Electrical Capacitance Volume Tomography: Design and Applications

Abstract
:
1. Introduction
2. Principle of ECVT
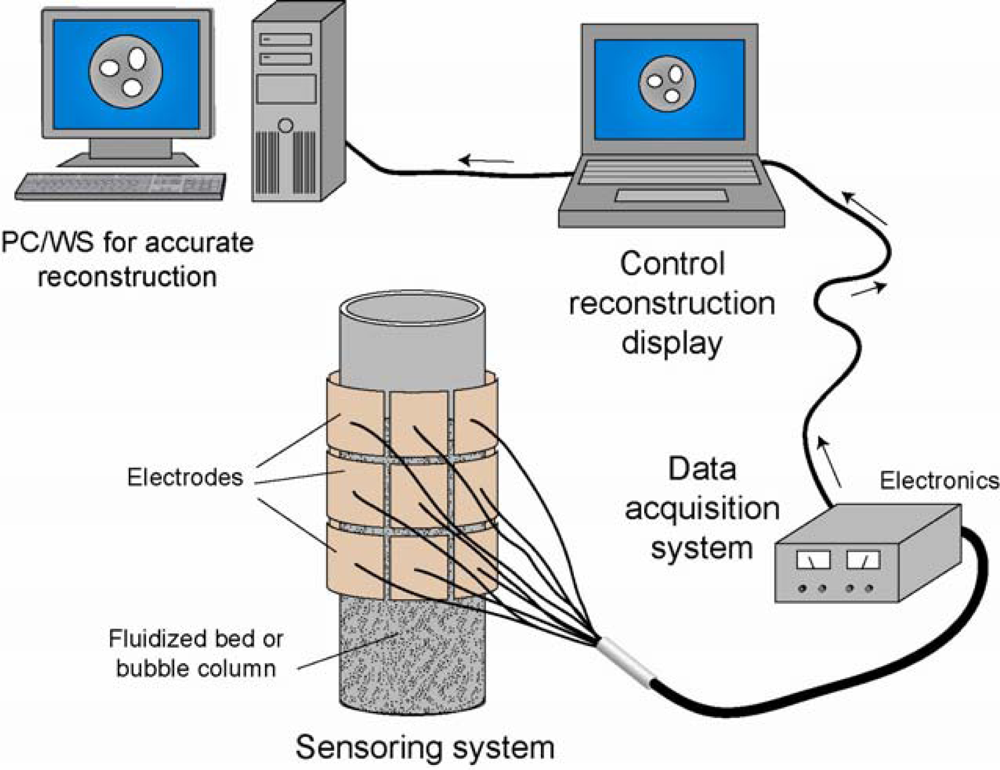
2.1. Operating Principle
2.2. Reconstruction
2.3. Potential Applications
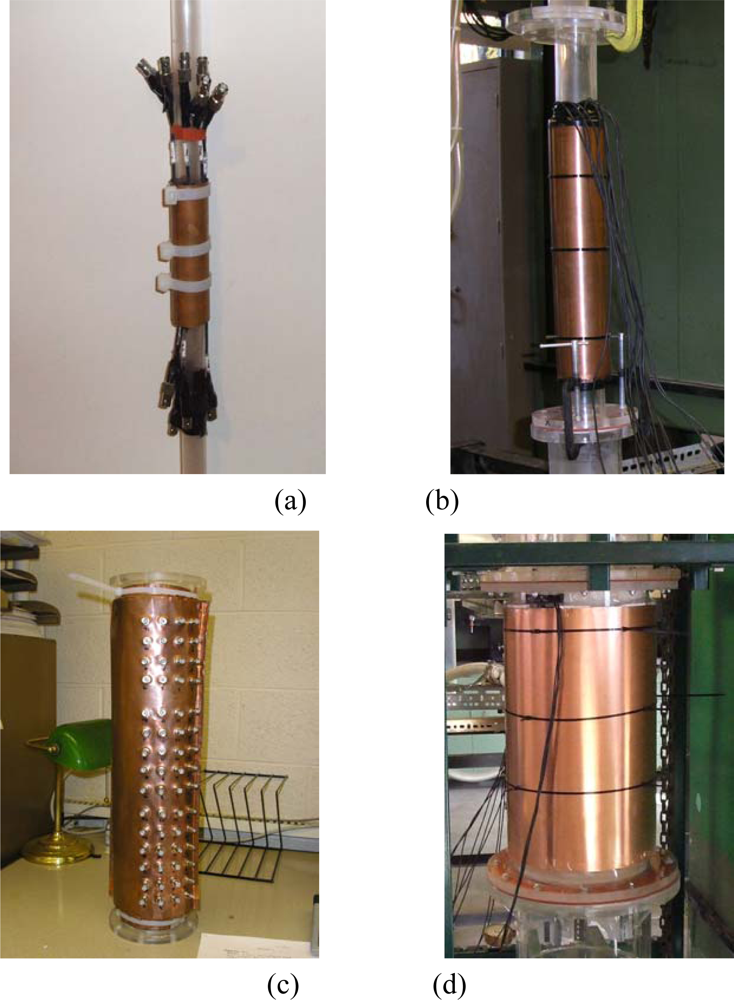
3. ECVT Sensors
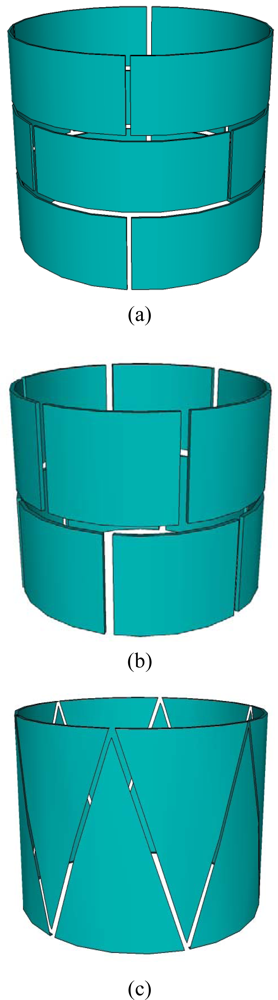
3.1. Cylindrical Shape Sensor
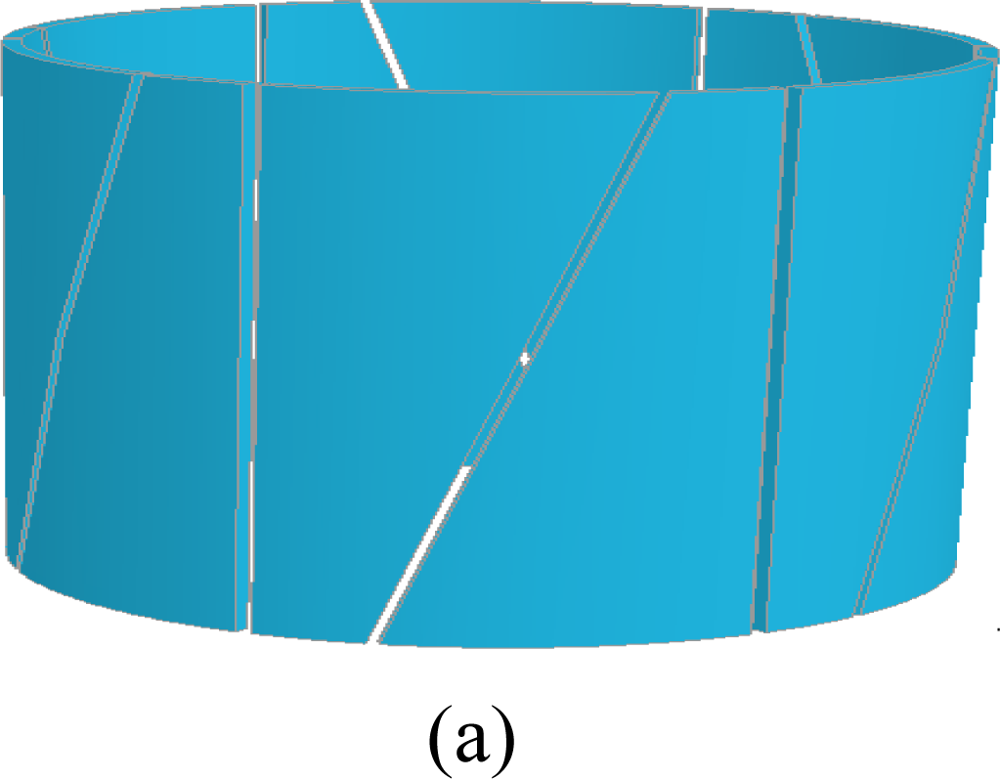
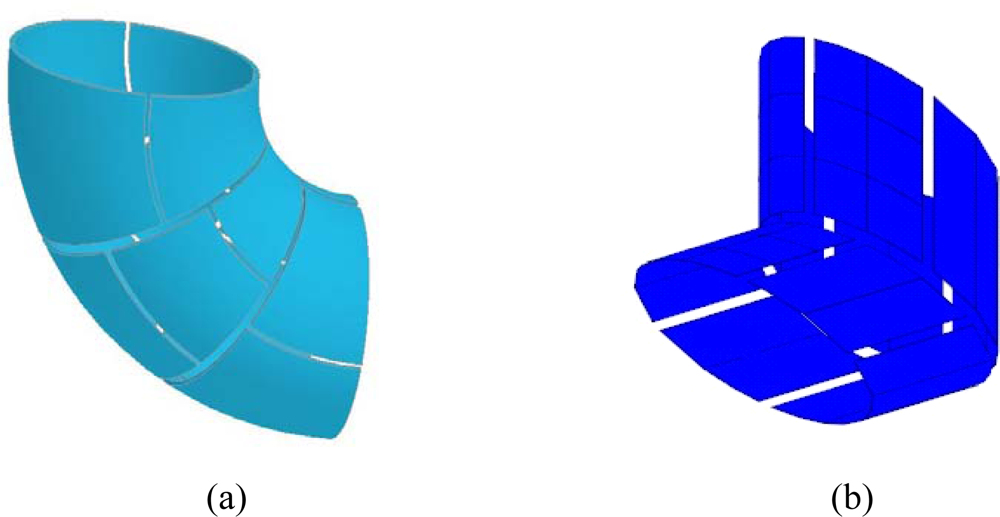
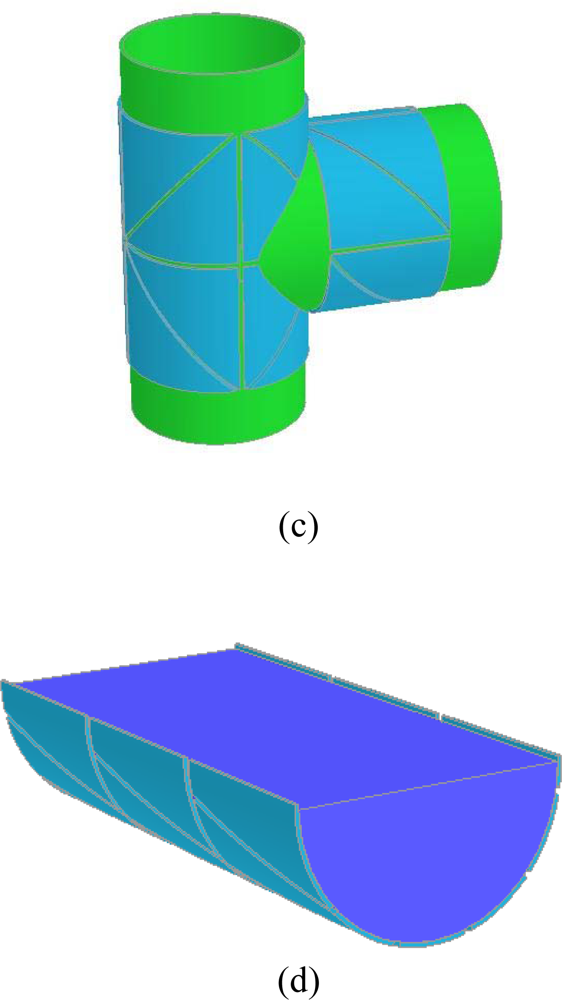
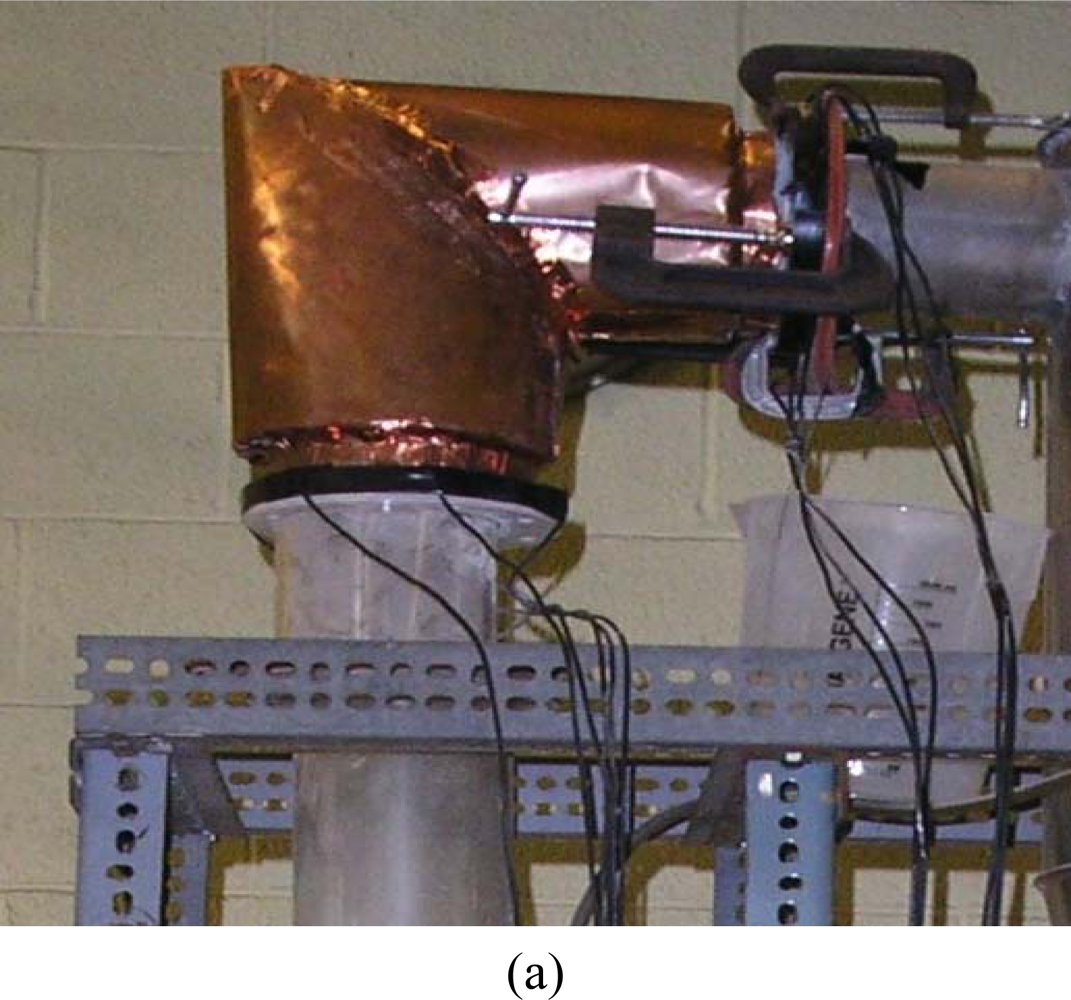
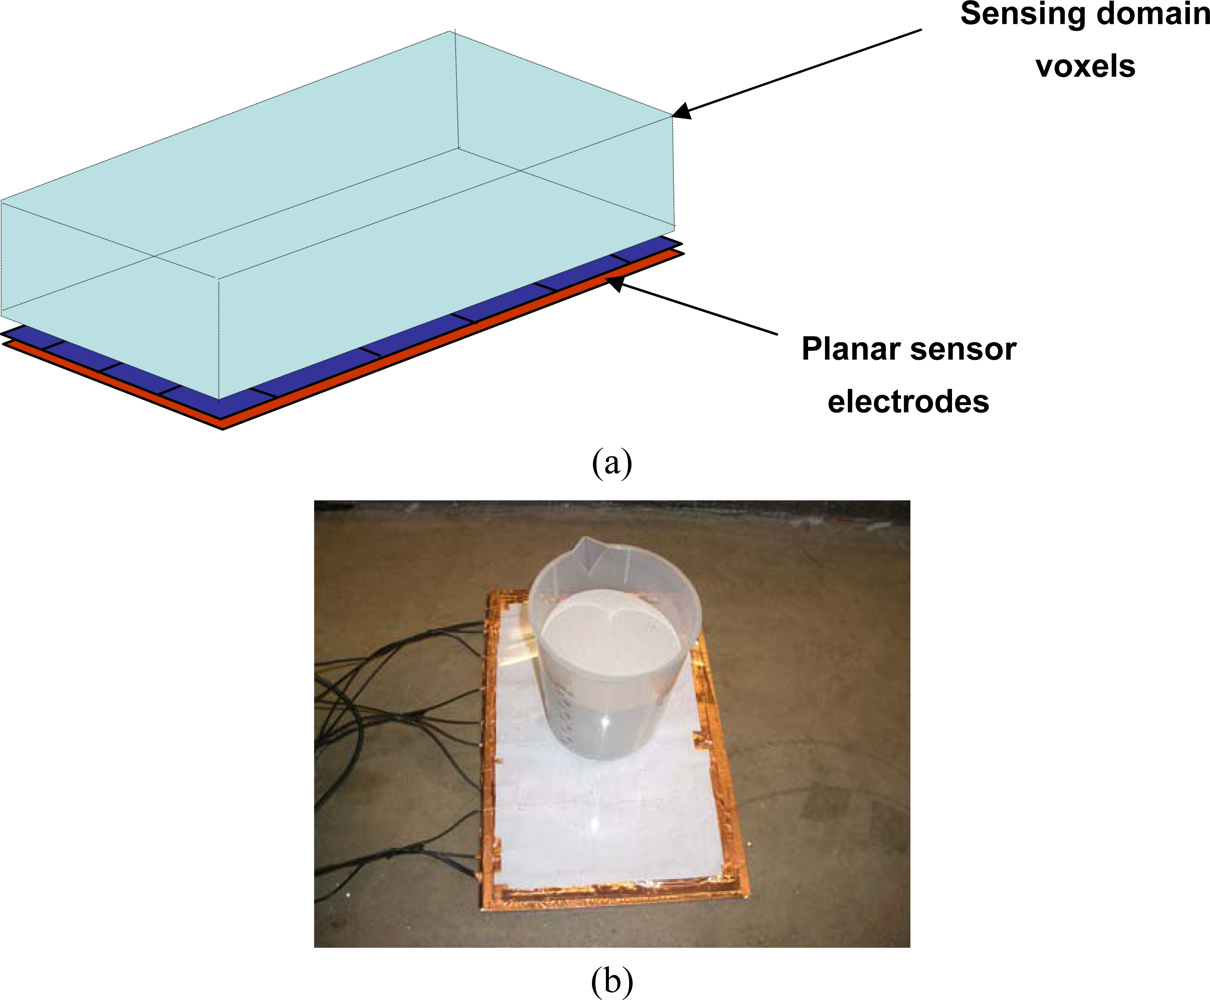
3.2. Sensors with Complex Geometries
3.3. Sensor Channel Number
4. Applications
5. Conclusions
Acknowledgments
Nomenclature
| Notations | |
|---|---|
| M | number of electrodes in the layer of an ECT sensor |
| N | number of channels in an ECVT sensor |
| x,y | two horizontal directions in the sensing domain of a cylindrical sensor |
| z | vertical direction in the sensing domain of a cylindrical sensor |
| Greek letters | |
|---|---|
| ε | dielectric constant (permittivity) distribution in the sensing domain |
| ϕ | potential distribution in the sensing domain |
References
- Kunii, D.O.; Levenspiel, O. Fluidization Engineering, 2nd ed.; Butterworth-Heinemann: Boston, MA, USA, 1991; p. 491. [Google Scholar]
- Fan, L.S.; Zhu, C. Principles of Gas-Solid Flows; Cambridge University Press: New York, NY, USA, 1998; p. 557. [Google Scholar]
- Kristensen, H.G.; Schaefer, T. Granulation-A Review of Pharmaceutical Wet-Granulation. Drug Develop. Ind. Pharm 1987, 13, 803–872. [Google Scholar]
- Cohen, J.S.; Yang, T.C.S. Progress in Food Dehydration. Trends Food Sci. Tech 1995, 6, 20–25. [Google Scholar]
- Dixit, R.; Puthli, S. Fluidization Technologies: Aerodynamic Principles and Process Engineering. J. Pharm. Sci 2009, 98, 3933–3960. [Google Scholar]
- Fan, L.S. Gas-Liquid-Solid Fluidization Engineering; Butterworths: Boston, MA, USA, 1989; p. 763. [Google Scholar]
- Geldart, D.; Kelsey, J.R. Use of Capacitance Probes in Gas Fluidized-Beds. Powder Tech 1972, 6, 45–50. [Google Scholar]
- Yutani, N.; Ho, T.C.; Fan, L.T.; Walawender, W.P.; Song, J.C. Statistical Study of the Grid Zone Behavior in a Shallow Gas-Solid Fluidized-Bed Using a Mini-Capacitance Probe. Chem. Eng. Sci 1983, 38, 575–582. [Google Scholar]
- Cui, H.P.; Chaouki, J. Effects of Temperature on Local Two-Phase Flow Structure in Bubbling and Turbulent Fluidized Beds of FCC Particles. Chem. Eng. Sci 2004, 59, 3413–3422. [Google Scholar]
- Liu, J.Z.; Grace, J.R.; Bi, X.T. Novel Multifunctional Optical-Fiber Probe: I. Development and Validation. AIChE J 2003, 49, 1405–1420. [Google Scholar]
- Liu, J.Z.; Grace, J.R.; Bi, X.T. Novel Multifunctional Optical-Fiber Probe: II. High-Density CFB Measurements. AIChE J 2003, 49, 1421–1432. [Google Scholar]
- Kang, W.K.; Sutherla, J.P.; Osberg, G.L. Pressure Fluctuations in a Fluidized Bed with and without Screen Cylindrical Packings. Ind. Eng. Chem. Fund 1967, 6, 499–504. [Google Scholar]
- Fan, L.T.; Ho, T.C.; Hiraoka, S.; Walawender, W.P. Pressure-Fluctuations in a Fluidized-Bed. AIChE J 1981, 27, 388–396. [Google Scholar]
- Xie, H.Y.; Geldart, D. The Response Time of Pressure Probes. Powder Tech 1997, 90, 149–151. [Google Scholar]
- Peters, M.H.; Fan, L.S.; Sweeney, T.L. Study of Particle Ejections in the Freeboard Region of a Fluidized-Bed with an Image Carrying Probe. Chem. Eng. Sci 1983, 38, 481–485. [Google Scholar]
- Du, B.; Warsito, W.; Fan, L.S. ECT Studies of the Choking Phenomenon in a Gas-Solid Circulating Fluidized Bed. AIChE J 2004, 50, 1386–1406. [Google Scholar]
- Plaskowski, A.; Beck, M.S. Process Tomography. Przem. Chem 1988, 67, 104–106. [Google Scholar]
- Huang, S.M.; Xie, C.G.; Salkeld, J.A.; Plaskowski, A.; Thorn, R.; Williams, R.A.; Hunt, A.; Beck, M.S. Process Tomography for Identification, Design and Measurement in Industrial-Systems. Powder Tech 1992, 69, 85–92. [Google Scholar]
- Savelsberg, R.; Demco, D.E.; Blumich, B.; Stapf, S. Particle Motion in Gas-Fluidized Granular Systems by Pulsed-Field Gradient Nuclear Magnetic Resonance. Phy. Rev 2002, 65, 020301.1–020301.4. [Google Scholar]
- Fennell, P.S.; Davidson, J.F.; Dennis, J.S.; Gladden, L.F.; Hayhurst, A.N.; Mantle, M.D.; Muller, C.R.; Rees, A.C.; Scott, S.A.; Sederman, A.J. A Study of the Mixing of Solids in Gas-Fluidized Beds, Using Ultra-Fast MRI. Chem. Eng. Sci 2005, 60, 2085–2088. [Google Scholar]
- Wang, R.P.; Rosen, M.S.; Candela, D.; Mair, R.W.; Walsworth, R.L. Study of Gas-Fluidization Dynamics with Laser-Polarized Xe-129. J. Magn. Reson. Imaging 2005, 23, 203–207. [Google Scholar]
- Holland, D.J.; Marashdeh, Q.; Muller, C.R.; Wang, F.; Dennis, J.S.; Fan, L.S.; Gladden, L.F. Comparison of ECVT and MR Measurements of Voidage in a Gas-Fluidized Bed. Ind. Eng. Chem. Res 2009, 48, 172–181. [Google Scholar]
- Dechsiri, C.; Ghione, A.; van de Wiel, F.; Dehling, H.G.; Paans, A.M.J.; Hoffmann, A.C. Positron Emission Tomography Applied to Fluidization Engineering. Can. J. Chem. Eng 2005, 83, 88–96. [Google Scholar]
- Dechsiri, C.; Van der Zwan, E.A.; Dehling, H.G.; Hoffmann, A.C. Dispersion of Particle Pulses in Fluidized Beds Measured by Positron Emission Tomography. AICHE J 2005, 51, 791–801. [Google Scholar]
- Simons, S.J.R. Imaging Techniques for Fluidized-Bed Systems-A Review. Chem. Eng. J. Bio. Eng. J 1995, 56, 83–93. [Google Scholar]
- Rowe, P.N.; Partridg, B. An X-Ray Study of Bubbles in Fluidised Beds. Trans. Inst. Chem. Eng. Chem. Eng 1965, 43, 157–161. [Google Scholar]
- Rowe, P.N.; Partridge, B.A. An X-ray Study of Bubbles in Fluidised Beds. Chem. Eng. Res. Des 1997, 75, S116–S134. [Google Scholar]
- Clough, D.E.; Weimer, A.W. Time-Dependent Behavior of Bubble Volume in Fluidized-Beds. Ind. Eng. Chem. Fund 1985, 24, 235–241. [Google Scholar]
- Wang, Z.C.; Afacan, A.; Nandakumar, K.; Chuang, K.T. Porosity Distribution in Random Packed Columns by Gamma Ray Tomography. Chem. Eng. Pr 2001, 40, 209–219. [Google Scholar]
- Patel, A.K.; Waje, S.S.; Thorat, B.N.; Mujumdar, A.S. Tomographic Diagnosis of Gas Maldistribution in Gas-Solid Fluidized Beds. Powder Tech 2008, 185, 239–250. [Google Scholar]
- Williams, R.A.; Beck, M.S. Process tomography: principles, techniques, and applications; Butterworth-Heinemann: Boston, MA, USA, 1995; pp. 581–588. [Google Scholar]
- Xie, C.G.; Huang, S.M.; Hoyle, B.S.; Thorn, R.; Lenn, C.; Snowden, D.; Beck, M.S. Electrical Capacitance Tomography for Flow Imaging-System Model for Development of Image-Reconstruction Algorithms and Design of Primary Sensors. IEE Proceedings-G Circuits Devices Syst 1992, 139, 89–98. [Google Scholar]
- Yang, W.Q.; Peng, L.H. Image Reconstruction Algorithms for Electrical Capacitance Tomography. Measure. Sci. Tech 2003, 14, R1–R13. [Google Scholar]
- Warsito, W.; Fan, L.S. Neural Network Based Multi-Criterion Optimization Image Reconstruction Technique For Imaging Two- and Three-Phase Flow Systems Using Electrical Capacitance Tomography. Measure.Sci. Tech 2001, 12, 2198–2210. [Google Scholar]
- Du, B.; Warsito, W.; Fan, L.S. Bed Nonhomogeneity in Turbulent Gas-Solid Fluidization. AIChE J 2003, 49, 1109–1126. [Google Scholar]
- Marashdeh, Q.; Warsito, W.; Fan, L.S.; Teixeira, F.L. Nonlinear Forward Problem Solution for Electrical Capacitance Tomography Using Feed-Forward Neural Network. IEEE Sensors J 2006, 6, 441–449. [Google Scholar]
- Wang, F.; Marashdeh, Q.; Fan, L.S.; Williams, R.A. Electrical Capacitance, Electrical Resistance, and Position Emission Tomography Techniques and Their Applications in Multi-Phase Flow Systems. In Advances in Chemical Engineering Vol. 37: Characterization of Flow, Particles, and Interfaces; Li, J.H., Ed.; Academic Press: Amsterdam, The Netherlands, 2009; pp. 179–222. [Google Scholar]
- Warsito, W.; Fan, L.S. Measurement of Real-Time Flow Structures in Gas-Liquid and Gas-Liquid-Solid Flow Systems Using Electrical Capacitance Tomography (ECT). Chem. Eng. Sci 2001, 56, 6455–6462. [Google Scholar]
- Warsito, W.; Fan, L.S. Neural Network Multi-Criteria Optimization Image Reconstruction Technique (Nn-Moirt) for Linear and Non-Linear Process Tomography. Chem. Eng. Process 2003, 42, 663–674. [Google Scholar]
- Warsito, W.; Fan, L.S. ECT Imaging of Three-Phase Fluidized Bed Based on Three-Phase Capacitance Model. Chem. Eng. Sci 2003, 58, 823–832. [Google Scholar]
- Warsito, W.; Fan, L.S. Dynamics of Spiral Bubble Plume Motion in The Entrance Region of Bubble Columns and Three-Phase Fluidized Beds Using 3D ECT. Chem. Eng. Sci 2005, 60, 6073–6084. [Google Scholar]
- Warsito, W.; Marashdeh, Q.; Fan, L.S. Electrical Capacitance Volume Tomography (ECVT). IEEE Sens. J 2007, 7, 525–535. [Google Scholar]
- Fasching, G.E.; Smith, N.S. High Resolution Capacitance Imaging System. US Dept. Energy 1988, 37. DOE/METC-88/4083. [Google Scholar]
- Fasching, G.E.; Smith, N.S. A Capacitive System for 3-Dimensional Imaging of Fluidized-Beds. Rev. Sci. Instr 1991, 62, 2243–2251. [Google Scholar]
- Xie, C.G.; Reinecke, N.; Beck, M.S.; Mewes, D.; Williams, R.A. Electrical Tomography Techniques for Process Engineering Applications. Chem. Eng. J. Biol. Eng. J 1995, 56, 127–133. [Google Scholar]
- Yang, W.Q.; Beck, M.S.; Byars, M. Electrical Capacitance Tomography-from Design to Applications. Measurement Control 1995, 28, 261–266. [Google Scholar]
- Beck, M.S.; Byars, M.; Dyakowski, T.; Waterfall, R.; He, R.; Wang, S.J.; Yang, W.Q. Principles and Industrial Applications of Electrical Capacitance Tomography. Meas. Control 1997, 30, 197–200. [Google Scholar]
- Dyakowski, T.; Edwards, R.B.; Xie, C.G.; Williams, R.A. Application of Capacitance Tomography to Gas-Solid Flows. Chem. Eng. Sci 1997, 52, 2099–2110. [Google Scholar]
- Bennett, M.A.; West, R.M.; Luke, S.P.; Williams, R.A. The Investigation of Bubble Column and Foam Processes Using Electrical Capacitance Tomography. Miner. Eng 2002, 15, 225–234. [Google Scholar]
- Chaplin, G.; Pugsley, T.; van der Lee, L.; Kantzas, A.; Winters, C. The Dynamic Calibration of an Electrical Capacitance Tomography Sensor Applied to the Fluidized Bed Drying of Pharmaceutical Granule. Meas. Sci. Tech 2005, 16, 1281–1290. [Google Scholar]
- Ostrowski, K.L.; Luke, S.P.; Bennett, M.A.; Williams, R.A. Application of Capacitance Electrical Tomography for on-Line and off-Line Analysis of Flow Pattern in Horizontal Pipeline of Pneumatic Conveyer. Chem. Eng. J 2000, 77, 43–50. [Google Scholar]
- Ostrowski, K.L.; Luke, S.P.; Williams, R.A. Simulation of the Performance of Electrical Capacitance Tomography for Measurement of Dense Phase Pneumatic Conveying. Chem. Eng. J 1997, 68, 197–205. [Google Scholar]
- Du, B.; Warsito, W.; Fan, L.S. ECT Studies of Gas-Solid Fluidized Beds of Different Diameters. Ind. Eng. Chem. Res 2005, 44, 5020–5030. [Google Scholar]
- Du, B.; Warsito, W.; Fan, L.S. Imaging the Choking Transition in Gas-Solid Risers Using Electrical Capacitance Tomography. Ind. Eng. Chem. Res 2006, 45, 5384–5395. [Google Scholar]
- Du, B.; Warsito, W.; Fan, L.S. Behavior of the Dense-Phase Transportation Regime in a Circulating Fluidized Bed. Ind. Eng. Chem. Res 2006, 45, 3741–3751. [Google Scholar]
- Fan, L.S.; Warsito, W.; Du, B. Electrical Capacitance Tomography Imaging of Gas-Solid and Gas-Liquid-Solid Fluidized Bed Systems. J. Vis 2004, 7, 5. [Google Scholar]
- Marashdeh, Q.; Warsito, W.; Fan, L.S.; Teixeira, F.L. A Nonlinear Image Reconstruction Technique for ECT Using a Combined Neural Network Approach. Meas. Sci. Tech 2006, 17, 2097–2103. [Google Scholar]
- You, J.; Zhu, C.; Du, B.; Fan, L.S. Heterogeneous Structure in Gas-Solid Riser Flows. AIChE J 2008, 54, 1459–1469. [Google Scholar]
- Wajman, R.; Banasiak, R.; Mazurkiewicz, L.; Dyakowski, T.; Sankowski, D. Spatial Imaging with 3D Capacitance Measurements. Meas. Sci. Tech 2006, 17, 2113–2118. [Google Scholar]
- Soleimani, M.; Mitchell, C.N.; Banasiak, R.; Wajman, R.; Adler, A. Four-Dimensional Electrical Capacitance Tomography Imaging Using Experimental Data. Prog. Electromagn. Res 2009, 90, 171–186. [Google Scholar]
- Warsito, W.; Marashdeh, Q.; Fan, L.S. Some Comments on Spatial Imaging with 3D Capacitance Measurements. Meas. Sci. Tech 2007, 18, 3665–3667. [Google Scholar]
- Wang, F.; Marashdeh, Q.; Warsito, W.F. Imaging Gas/Solid Jet Penetration in a Gas-Solid Fluidized Bed Using Electrical Capacitance Volume Tomography. Proceedings of AIChE Annual Meeting, Philadelphia, PA, USA, 16–21 November 2008.
- Tech4Imaging. Available online: www.Tech4Imaging.com (accessed on 6 February 2010).
- Williams, A.; Wang, M.; Ellul, C.; Pourkashanian, M. Electrical Capacitance Tomography for High Temperature Flames. INFUB, Vilamoura, Portugal, March 25–28, 2008.
- Marashdeh, Q.; Fan, L.S.; Du, B.; Warsito, W. Electrical Capacitance Tomography-A Perspective. Ind. Eng. Chem. Res 2008, 47, 3708–3719. [Google Scholar]
- Wang, F.; Yu, Z.; Marashdeh, Q.; Fan, L.S. Horizontal Gas and Gas/Solid Jet Penetration in a Gas-Solid Fluidized Bed. Chem. Eng. Sci 1971, 26, 923–935. [Google Scholar]
- FY 09 Seed Fund Awards. Available online: http://www.nasa.gov/pdf/368044main_09_seedfund_awards.pdf (accessed on 5 February 2010).
- Pfeffer, R.; Zakin, J.; Park, A.H. Preface to the L.S. Fan Festschrift. Ind. Eng. Chem. Res 2009, 48, 2–3. [Google Scholar]
- Marashdeh, Q.; Wang, F.; Fan, L.S.; Warsito, W. Velocity Measurement of Multi-Phase Flows Based on Electrical Capacitance Volume Tomography. Sensors, 2007 IEEE, Atlanta, GA, USA, October 28–31, 2007; pp. 1017–1019.
- Marashdeh, Q.; Wang, F.; Warsito, W.; Fan, L.S. 3D Velocity Profiles of Multi-Phase Flow Systems Using Electrical Capacitance Volume Tomography. Proceedings of 3rd International Workshop on Process Tomography (IWPT-3), Tokyo, Japan, April 17–19, 2009.
- Wang, F.; Marashdeh, Q.; Warsito, W.; Fan, L.S. Three-Dimensional Velocimetry in a Fluidized Bed System Using Electrical Capacitance Volume Tomography. 8th World Congress of Chemical Engineering and 9th International Conference on Gas-Liquid and Gas-Liquid-Solid Reactor Engineering, Montreal, QC, Canada, August 23–27, 2009.
- Wang, F.; Marashdeh, Q.; Warsito, W.; Fan, L.S. Validation of 3-D ECVT Velocimetry in Multi-Phase Flow Systems. Proceedings of AIChE Annual Meeting, Nashville, TN, USA, November 8–13, 2009.
- Kajishima, T.; Takiguchi, S. Interaction between Particle Clusters and Particle-Induced Turbulence. Int. J. Heat. Fluid Flow 2002, 23, 639–646. [Google Scholar]
- Fan, L.S. Advances in Gas-Liquid-Solid Fluidization. In Fluidization-XI; Arena, U., Chirone, R., Miccio, M., Salatino, P., Eds.; Engineering Conferences International Press: New York, NY, USA, 2004; pp. 1–20. [Google Scholar]


| Reconstruction | Methodology | Characteristics | Example |
|---|---|---|---|
| Single Step Linear Back Projection | The sensor system is linearized (usually by constructing a sensitivity matrix). The image is obtained by back projecting the capacitance vector using the sensitivity matrix. | Fast, low image resolution, and introducing image artifacts | LBP [33] |
| Iterative Linear Back Projection | The mean square error between the capacitance data and forward solution of the final image is minimized by iterative linear projections using the sensitivity matrix. | Slower than Single Step Linear. Providing better images than Single Step [33] | Landweber ILBP [33] |
| Optimization | A set of objective functions are minimized iteratively to provide the most likely image. Different optimization algorithms and objective functions can be used. | Slower than Iterative Linear Back Projection. Providing better images than Iterative Linear Back Projection [42] | 3D-NNMOIRT [42] |
| Sensor Type | Sensor Symmetry | Axial Resolution | Radial Resolution |
|---|---|---|---|
| Cylindrical sensor with 1 layer | High | Low, sensitivity decreases toward center. | High, sensitivity decreases toward center. |
| Cylindrical sensor with 2 shifted layers | Moderate | Moderate, sensitivity decreases toward center. | Moderate, sensitivity decreases toward center |
| Cylindrical sensor with 3 shifted layers | Moderate | High, sensitivity decreases toward center. | Moderate-High, sensitivity decreases toward center. |
| Planar sensor with shifted planes | Moderate | Low, sensitivity decreases away from sensor. | High, Sensitivity decreases away from sensor. |
| Bent sensor | Low | Depends on sensor plate arrangement | Depends on sensor plates arrangement |
© 2010 by the authors; licensee Molecular Diversity Preservation International, Basel, Switzerland. This article is an open access article distributed under the terms and conditions of the Creative Commons Attribution license (http://creativecommons.org/licenses/by/3.0/).
Share and Cite
Wang, F.; Marashdeh, Q.; Fan, L.-S.; Warsito, W. Electrical Capacitance Volume Tomography: Design and Applications. Sensors 2010, 10, 1890-1917. https://doi.org/10.3390/s100301890
Wang F, Marashdeh Q, Fan L-S, Warsito W. Electrical Capacitance Volume Tomography: Design and Applications. Sensors. 2010; 10(3):1890-1917. https://doi.org/10.3390/s100301890
Chicago/Turabian StyleWang, Fei, Qussai Marashdeh, Liang-Shih Fan, and Warsito Warsito. 2010. "Electrical Capacitance Volume Tomography: Design and Applications" Sensors 10, no. 3: 1890-1917. https://doi.org/10.3390/s100301890