Patterns of Spontaneous Nucleotide Substitutions in Grape Processed Pseudogenes


Dipartimento di Agraria, University of Sassari, 07100 Sassari, Italy
*
Author to whom correspondence should be addressed.
Diversity 2017, 9(4), 45; https://doi.org/10.3390/d9040045
Submission received: 17 July 2017
/
Revised: 12 September 2017
/
Accepted: 9 October 2017
/
Published: 13 October 2017
(This article belongs to the Special Issue Plant Genetics and Biotechnology in Biodiversity)
Abstract
:Pseudogenes are dead copies of genes. Owing to the absence of functional constraint, all nucleotide substitutions that occur in these sequences are selectively neutral, and thus represent the spontaneous pattern of substitution within a genome. Here, we analysed the patterns of nucleotide substitutions in Vitis vinifera processed pseudogenes. In total, 259 processed pseudogenes were used to compile two datasets of nucleotide substitutions. The ancestral states of polymorphic sites were determined based on either parsimony or site functional constraints. An overall tendency towards an increase in the pseudogene A:T content was suggested by all of the datasets analysed. Low association was seen between the patterns and rates of substitutions, and the compositional background of the region where the pseudogene was inserted. The flanking nucleotide significantly influenced the substitution rates. In particular, we noted that the transition of G→A was influenced by the presence of C at the contiguous 5′ end base. This finding is in agreement with the targeting of cytosine to methylation, and the consequent methyl-cytosine deamination. These data will be useful to interpret the roles of selection in shaping the genetic diversity of grape cultivars.
1. Introduction
Sequence diversity is generated by mutations that are transmitted across generations due to evolutionary forces. Understanding the patterns and frequencies of spontaneous mutations is very important, as these generate the molecular basis for gene and genome evolution [1,2,3]. The availability of sequence polymorphism data for a high number of individuals of one species can provide a wealth of information on the spectra and dynamics of nucleotide substitutions. However, most of these studies are conducted without any assessment of the selective constraints on the sites analysed, and thus it can be difficult to deduce how an identified substitution spectrum deviates from expectations constructed under the assumption of neutrality.
Several reports have demonstrated that the rate of nucleotide substitutions can be significantly influenced by the adjacent nucleotides, i.e., the probability that a nucleotide is substituted depends on the identity of its neighbouring nucleotides [4,5,6]. Datasets of nucleotide polymorphisms generated by next-generation sequencing usually do not report the identity of the neighbouring (unchanged) nucleotides, and thus information on the nucleotide context in which a mutation has occurred is not readily accessible.
A widely used approach to infer patterns and rates of nucleotide substitution at selectively unconstrained sites is based on the analysis of pseudogenes [7,8]. These are inactive copies of genes, and they are believed to experience very weak, if any, selective pressures [6,7,9]. Based on the mechanisms leading to their formation, pseudogenes are usually classified into two types: (i) duplicated (or non-processed), which are generated by genomic duplication and subsequent function disabling due to mutation; and (ii) processed (or retro-processed), which originate from genomic integration of a cDNA copy retro-transcribed from a spliced mRNA molecule [10,11]. The identification of either pseudogene type is generally based on their inferred intron–exon structure. Duplicated pseudogenes usually retain introns and other regulatory non-transcribed sequences, such as promoters and terminators, while processed pseudogenes are depleted of introns and of all untranscribed regulatory regions. The absence of regulatory elements means that processed pseudogenes are inactive, as at the time of their creation, and for this reason they were defined as “dead on arrival” (DOA) elements [8,12]. An important feature of DOA elements for diversity studies is that they represent a comprehensive catalogue of mutation events. In contrast, some mutations that occur in a non-processed pseudogene before its inactivation might potentially have been lost due to the action of purifying selection.
The determination of the spontaneous mutation patterns through an analysis of pseudogenes also poses some critical issues. Several lines of evidence have recently challenged the view that all DOA elements should evolve neutrally [9,13]. In this regard, an indication of the action of natural selection on a sequence can be obtained by studying the ratio of synonymous to non-synonymous substitutions. In theory, genes that evolve under purifying selection are expected to experience fewer non-synonymous than synonymous substitutions. On the contrary, synonymous and non-synonymous substitutions should be comparably frequent in pseudogenes, if these evolve neutrally.
As mutations are detected as changes in pairwise sequence comparisons, it is very difficult to tell in which of the compared sequences the mutations have occurred. Several possible solutions to this problem have been proposed [9]. The first and second base positions of codons generally determine the coding specificity. A change at these positions will be subjected to purifying selection in the functional locus, but not in the pseudogenes; thus, changes at these sites can be bona-fide attributed to the pseudogene [9]. An alternative solution is to use an orthologous sequence from a closely related species in combination with parsimony to infer the sequence that underwent the base change. In practice, given a polymorphic site, the substitution is attributed to the pseudogene only if the functional paralogous and orthologous sequences share the same nucleotide at that position [6,14,15].
The pattern of spontaneous mutation can vary across genomic regions, and therefore the genomic distribution of pseudogenes should be adequately scattered to represent the various genomic backgrounds. Analysis of spontaneous mutation patterns based on pseudogene–functional loci comparisons has been carried out for several mammalian systems [6,8,14], while there is little information available relating to plant genomes. Benovoy et al. [9] analysed 411 processed pseudogenes in Arabidopsis thaliana and reported that the spontaneous pattern of mutation in A. thaliana is different from that of mammals, but similar to that of Drosophila. Transitions were more abundant than expected by chance, but in contrast to other systems, they were less frequent than transversions. A study conducted by Ossowsky et al. [16] in resequenced Arabidopsis progenies, however, indicated that transitions were 2.5-fold more frequent than transversions. Two independent studies examined the variation dynamics of substitution rates in relation to regional and flanking nucleotides using datasets of single nucleotide polymorphisms that were constructed by resequencing of genomic portions of several individuals of A. thaliana and Zea mays (maize) [4,5]. Both of these studies reported significant correlation between mutation frequency and regional A + T content. However, the relationships pointed in different directions in these two species. There was a direct correlation between mutation frequency and A+T content in A. thaliana, whereas the opposite trend was reported in maize. These data demonstrated that some of the factors that influence the substitution rates can have different weights across different species.
The so-called methylation/deamination cycle that defines an increased rate of transition from cytosine to thymine due to rapid deamination of the methylated cytosine at CpG sites is one of the most prominent effects of nucleotide context on substitution rates in plant genomes [4,5,9]. Other context dependencies of the substitution rates have been reported in both Arabidopsis and maize, and in some cases, these effects have proved to be species-specific [4,5].
In the present study, we analysed the patterns of spontaneous base substitutions in V. vinifera, as detected through the analysis of 259 processed grape pseudogenes. These data demonstrate that the grape genome is almost at compositional equilibrium, and that transitions are more frequent than transversions. Some of the neighbouring nucleotide effects seen for other species are also confirmed, although very low regional effects on nucleotide substitutions emerged from this analysis of V. vinifera. Although our results are limited to a single grapevine line, and thus may need to be confirmed on other cultivars, we believe the findings reported here will be useful for comparisons with spectra of mutations deduced from re-sequencing studies with grape cultivars. These studies are expected to shed light on how natural selection impacts on sequence diversity.
2. Materials and Methods
2.1. Genomic Sequence
The V. vinifera genomic sequence, and the gene models and annotations, were downloaded from http://genomes.cribi.unipd.it/DATA/. As the reference genome sequence was determined from genomic DNA of cultivar Pinot 40024, all of the sequences used in this study should be referred to this cultivar [17]. Coding sequences, and intron and intergenic sequences were obtained using the gff2sequence software [18].
2.2. Pseudogene Identification
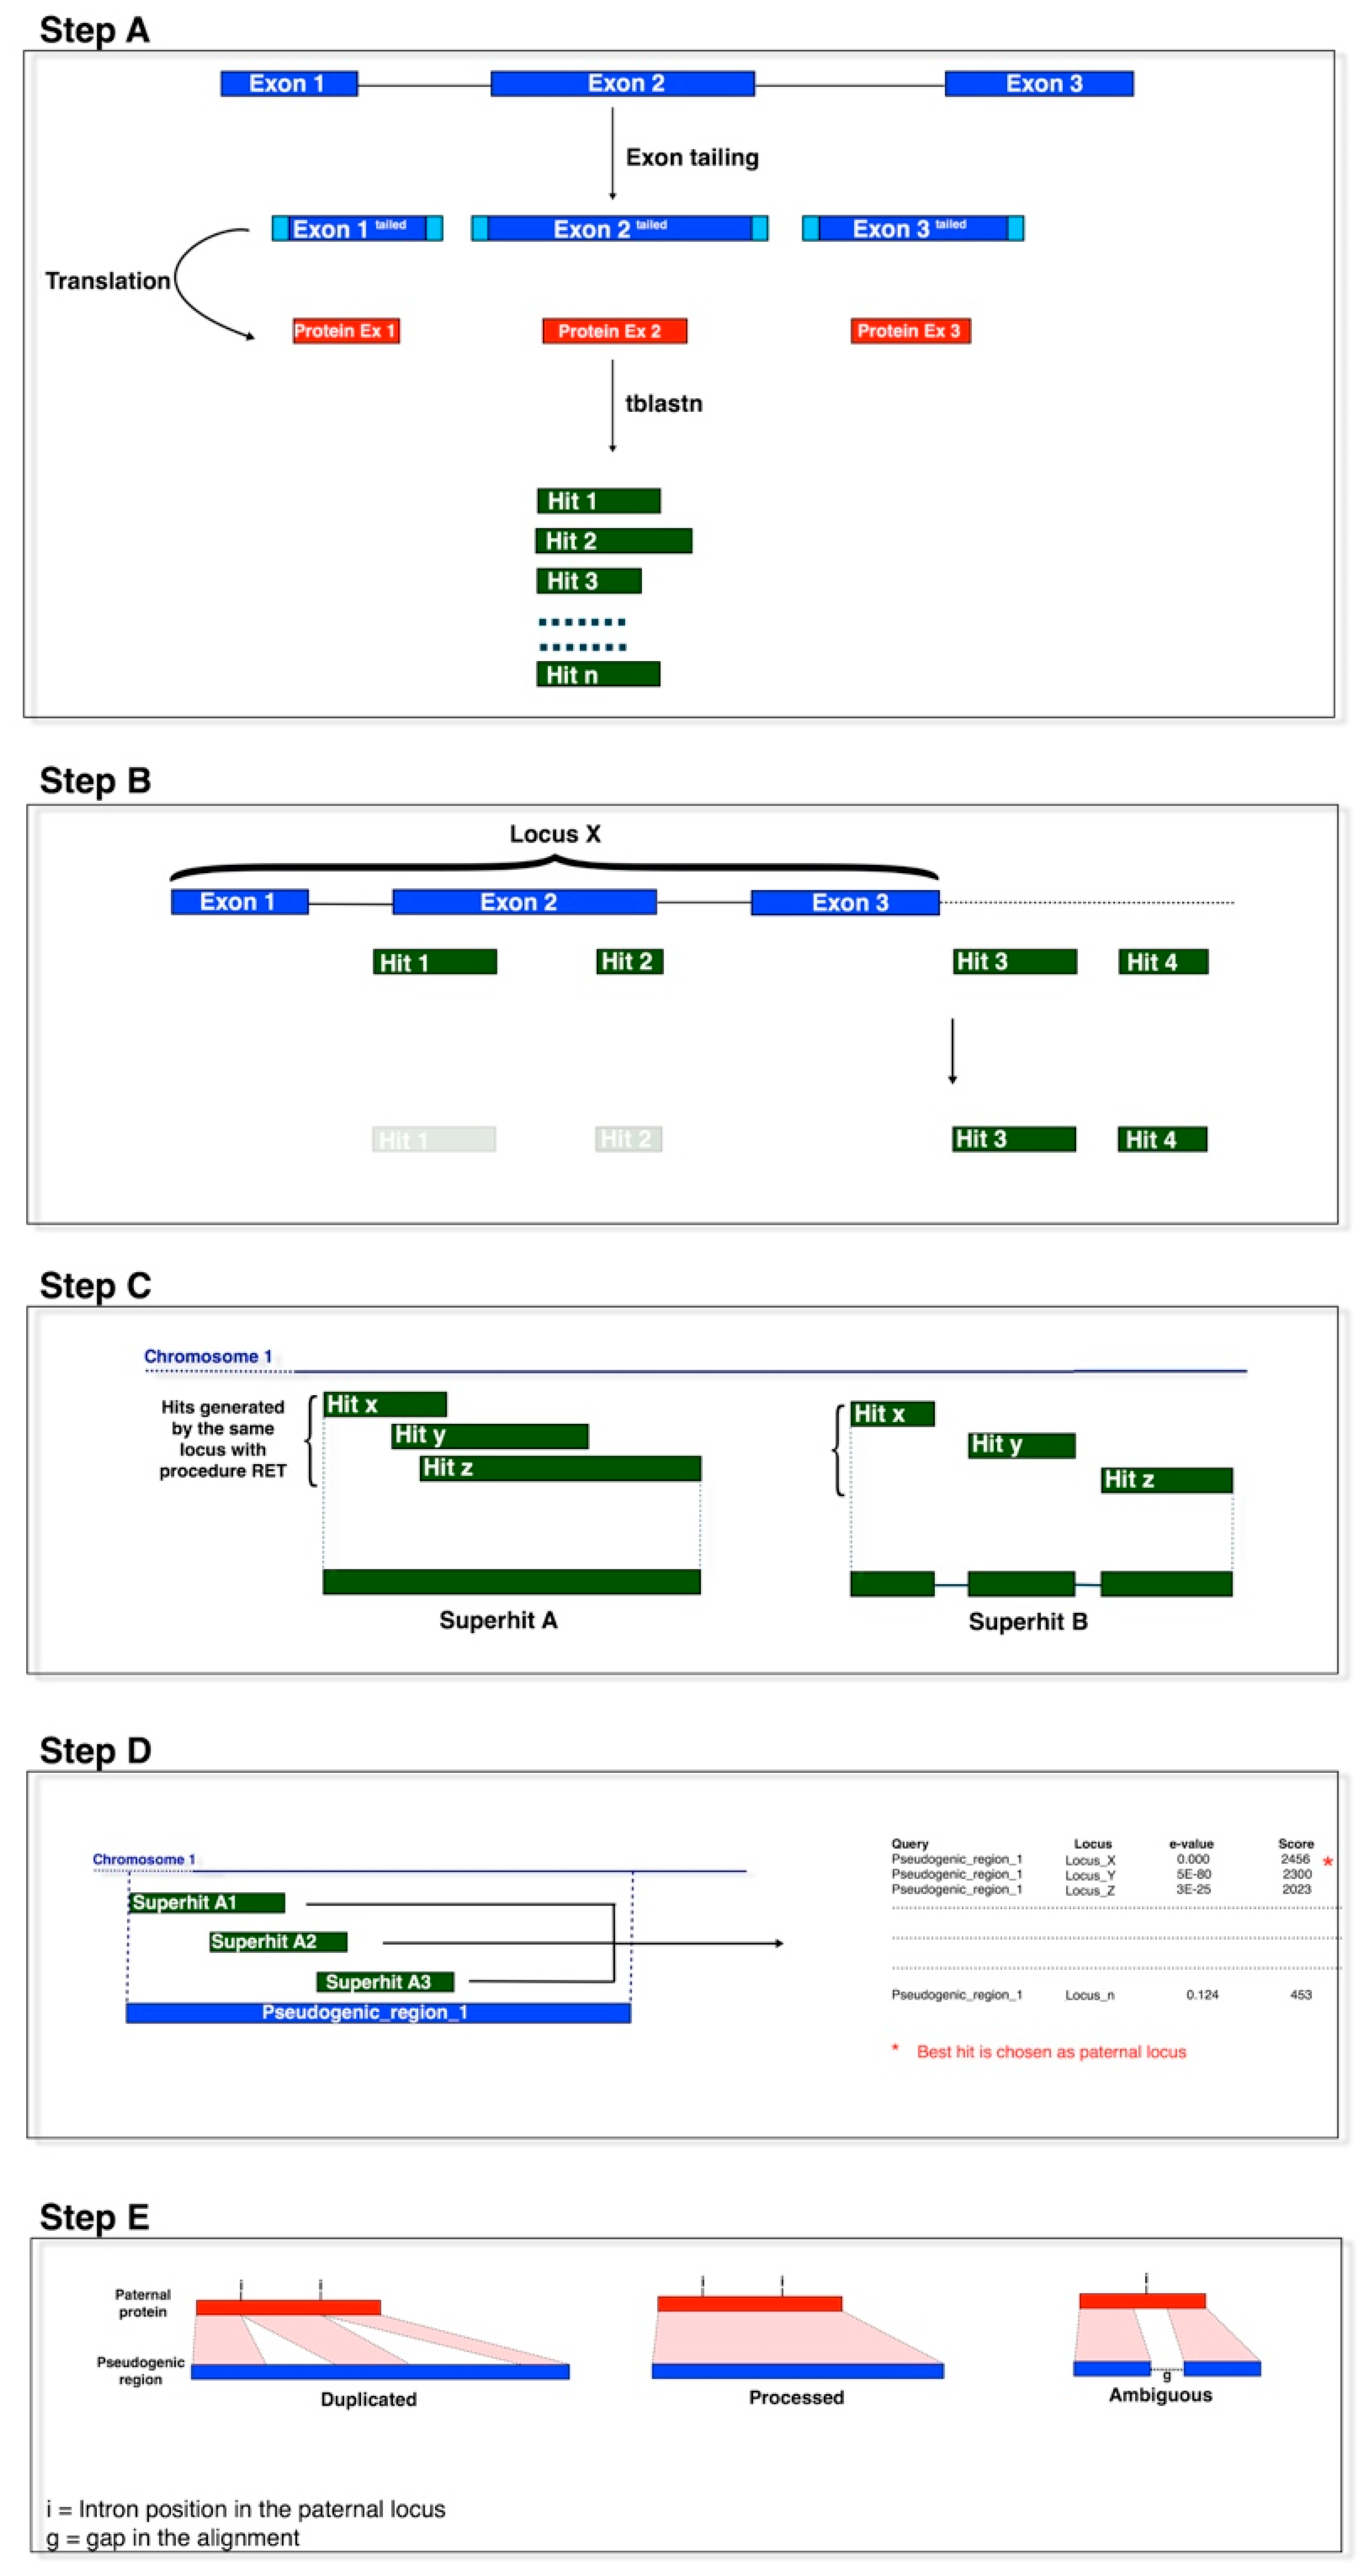
Processed pseudogenes were identified as described by Camiolo and Porceddu [19]. In brief, the sequences of the V. vinifera exons were extended (at both ends) with additional nucleotides (exon tails) from the neighbouring genomic regions [20]. As in Zheng and Gerstein (2006) [20], the length of these exon tails were 51, 52 or 53 nucleotides, which depended upon whether the exon started/ended with the first, second or third position of a codon. The tailed exon sequences were converted into amino-acid sequences and used as queries for tblastn searches against the V. vinifera reference genome sequence, which was previously masked in repetitive regions (Figure 1, Step A). The extra nucleotides are important for the separation of duplicated from processed pseudogenes, as they allow the queries to align to the pseudo-intron–exon boundaries of duplicated pseudogenes.
All of the tblastn hits with identity >40% and e-value <10−10 were kept for further analysis [20]. Adjacent hits that were identified by query sequences derived from adjacent exons of a functional locus were assembled in a pseudogene model (Figure 1, Steps B, C). We controlled for the distance between the assembled hits before incorporation into the model, by imposing their genomic distance as shorter by 500 nucleotides (base pairs; bp) than the distance between the matching exons added. This tolerance was set to take into account possible insertions within the identified pseudogenes [20], and the 500 bp was derived by a trial and error process, to reduce the risk of predicting pseudogene mosaics derived from independent pseudogenisation events. If present, the genomic region between the two hits was considered as a putative pseudo-intron, and the hits were assembled in a model with (eventually) an intervening (pseudo-)intron between the two (pseudo-)exons [21].
As paralogous loci identify (homologous) pseudogenes in overlapping chromosomal regions, pseudogene models that overlapped by ≥20% of their length were clustered together. Pseudogene models that overlapped by <20% of their length were assigned to different clusters, as these might represent either pseudogenes generated by nested insertions of homologous sequences, or pseudogene models generated by loci containing repetitive regions. The clusters identified at this step were defined as ‘pseudogenic regions’ (Figure 1, Steps C, D). For each pseudogenic region, the pseudogene model-functional locus pairs with the highest scores and the lowest e-values were selected for further analysis. The functional loci selected at this stage were referred to as the pater locus of the pseudogene, although they should be considered as a pseudogene sibling (i.e., functional paralogues).
The pseudogene models were classified as processed, non-processed and fragmented, based on the deduced exon–intron structure, e.g., the pseudogene sequences were aligned to the protein sequence of their pater locus and the deduced intron–exon structure was determined using the Genewise algorithm [22]. Here, blastn was run between each pseudogene model sequence and the introns of the pater locus, as reported by Khelifi et al. [23] (i.e., length > 50, no similarity threshold, e-value > 10−5). This step is not shown in Figure 1. Pseudogene models with introns inferred at analogous positions of the exon–intron structure of the pater locus were classified as non-processed. Pseudogenes formed by at least two hits, that matched two exons without predicted pseudo-introns, and that showed no homology to the intron sequence of the pater locus in blastn searches were classified as processed and were kept for further sequence analyses (Figure 1, Step E).
Finally, as a pseudogene sequence can be generated by genomic duplication of a pre-existing pseudogene, we studied the phylogeny of pseudogenes in relation to the correspondent functional loci. The pseudogenes and functional loci were grouped into clusters using the CD-Hit software [24], with a sequence similarity threshold of 60% [24]. For each cluster of sequences, a neighbour-joining tree was constructed using ClustalW [25]. Only the processed pseudogenes that showed the highest homologies to the functional locus were inferred to be derived directly from retropositions of functional loci (i.e., primary pseudogenes), and these were kept for further analysis.
2.3. Ka/Ks Rate Determination
The number of synonymous substitutions per synonymous site (Ks) and of non-synonymous substitutions per non-synonymous site (Ka) were deduced using the method of Li et al. [26,27]. The Ka and Ks rates were calculated for pairwise alignments of collinear functional paralogues. The collinear paralogues were identified using the MCScanX software, with the default settings [28]. The Ka and Ks values were also calculated for alignments that involved the pseudogenes and their pater loci. The estimates obtained for the alignment involving the pseudogenes were slightly biased (e.g., underestimated) because the functional gene sequence is expected to evolve at a lower rate than the pseudogenes.
2.4. Analysis of Nucleotide Substitutions
The pseudogene-predicted amino-acid sequences were obtained by aligning the functional protein encoded by the pater locus and the pseudogene sequence using Genewise [22]. The pseudo-proteins were aligned to protein sequences that were encoded by functional proteins, using MUSCLE with the default settings [29]. The aligned (pseudo-)protein was then converted to a sequence of codons using a perl script. The substitutions between complimentary nucleotide pairs were joined and represented with a unique code. For example, the two complimentary events of A substituted for G (A→G), and hence T substituted for C (T→C), or vice versa, were joined and represented as A:T→G:C.
The directions of the nucleotide substitutions were inferred using the following two approaches.
2.4.1. The Non-Synonymous Dataset
Following Benovoy et al. [9], the substitutions at the first and second codon positions were assumed to have occurred in the pseudogene. This assumption is supported by the consideration that most mutations at these positions will change the codon coding specificity and hence will be filtered by purifying selection in the functional locus.
2.4.2. The Parsimony-Based Dataset
The substitutions were inferred as those that occurred in the pseudogene by applying parsimony to multiple alignments between the pseudogene, the pater locus, and an orthologous sequence from A. thaliana. In brief, the alignment positions that featured the same nucleotide in the pater locus and in its orthologues but showed a different nucleotide in the pseudogene were considered for further analysis [6].
3. Results
3.1. Identification of Primary Processed Pseudogenes
Processed pseudogenes were identified in V. vinifera through the homology search approach outlined in Figure 1 [19]. As processed pseudogenes are generated by genomic integration of a cDNA copy that is retro-transcribed from a spliced transcript, they are believed to be intronless. The pseudogene structure was inferred through the study of the pseudogene–pater locus alignments at intron–exon junctions, and by analysis of the sequence homology between the pseudogenes and the pater locus intron sequences.
In practice, a pseudogene was classified as processed (or retro-processed) if (i) it was identified by at least two matches to two consecutive exons of an intron-containing locus; (ii) the alignment spanned the exon–intron position; and (iii) no sequence homology to paralogous intron sequences was detected. Other diagnostic features showed low predictive power, such as for the presence of adenine-rich regions at the 3′ end, or target site duplication, and thus these were not considered. For an example of a pseudogene–pater locus alignment, see Supplementary Figure S1.
In theory, an intronless pseudogene might originate from genomic duplication of a pre-existing processed pseudogene sequence. These duplicated pseudogene sequences will share the nucleotide changes that occurred in the common ancestor of these pseudogenes (i.e., from its generation by retroposition until genomic duplication) and thus provide (partially) redundant information for mutation analysis. To avoid such redundancy, the pseudogenes and functional paralogues were grouped into clusters based on sequence similarities. For each cluster, a phylogenetic tree was constructed, and only the pseudogene sequences with functional paralogues as their closest homologues (i.e., primary pseudogenes) were retained for further analysis resulting in 259 primary processed pseudogenes (Supplementary Table S1).
3.2. Compositional Features of Functional Genes and Pseudogenes
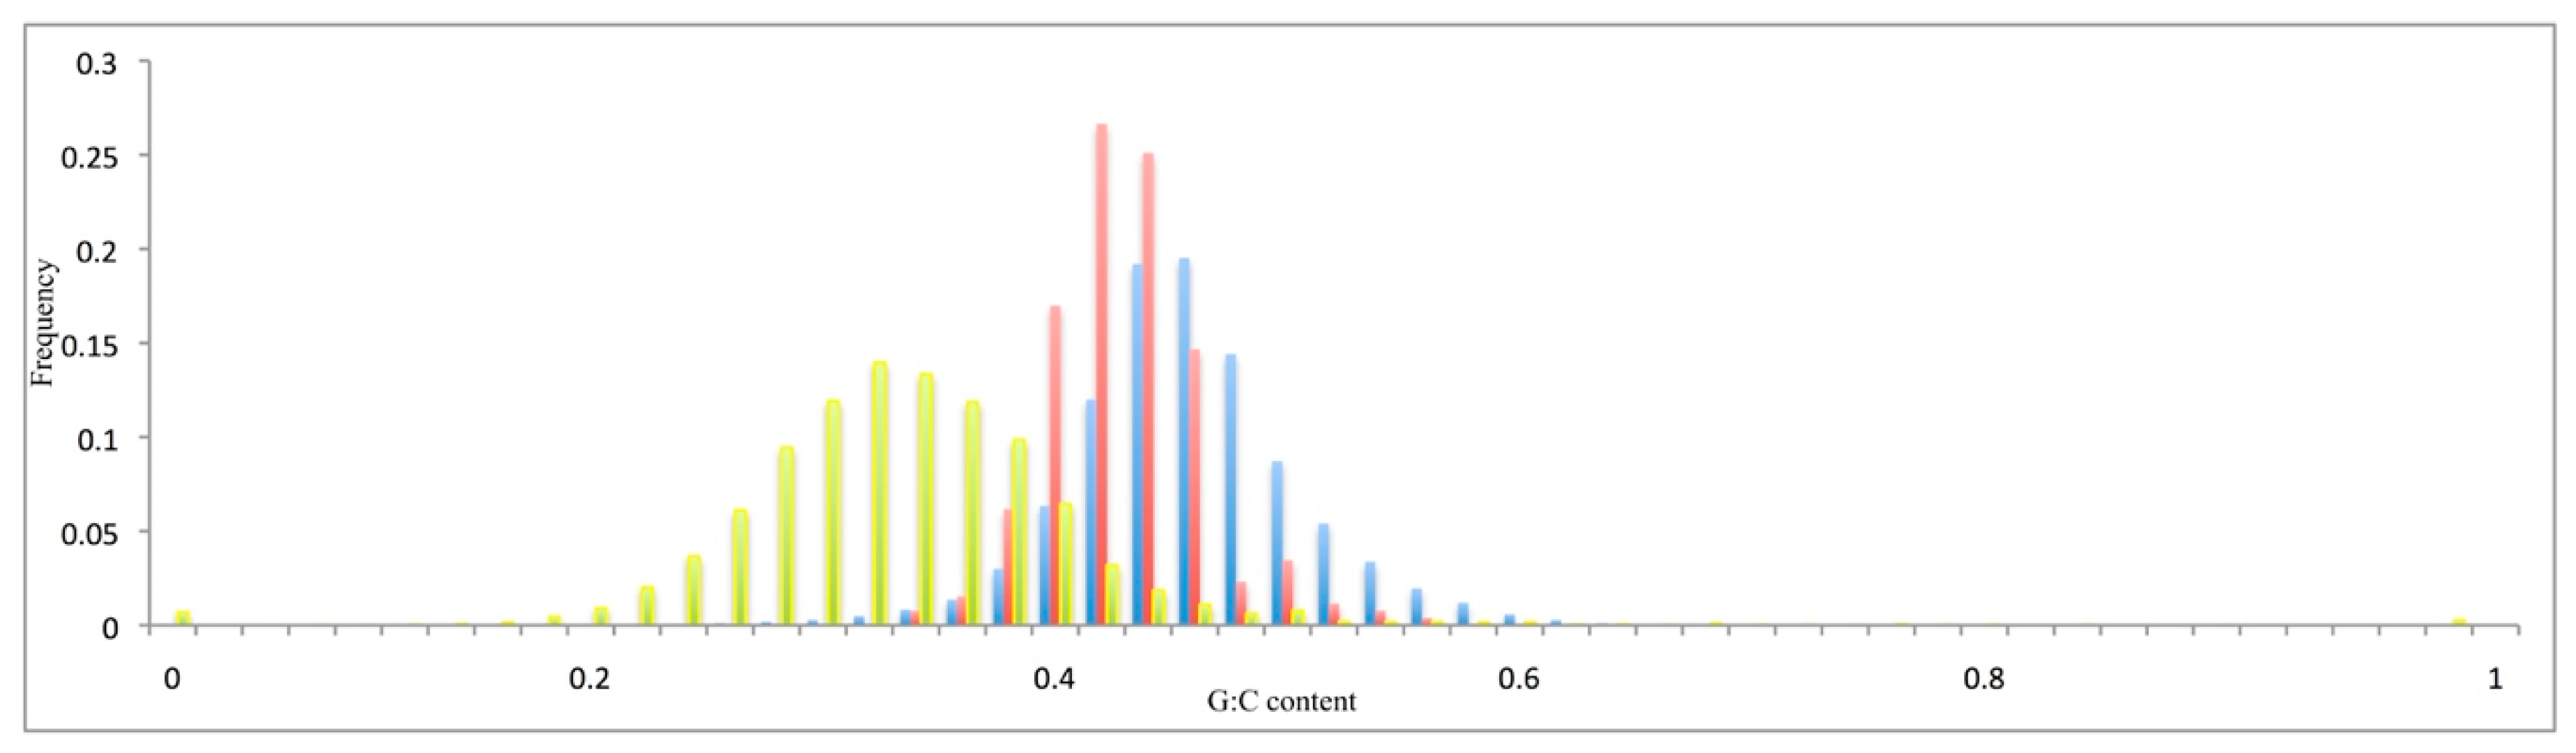
The distributions of the G + C content of the coding sequences (Figure 2) or at the synonymous codon positions (Supplementary Figure S2, G3 + C3) were unimodal, with means of 44% and 50% (see Figure 2). The introns (Supplementary Figure S2) and intergenic sequences (Figure 2) showed lower G + C content, with means of 33% and 32%, respectively. The V. vinifera pseudogenes showed a mean G + C content of 42% (Figure 2), and a mean G + C content at the third codon position of 48% (Supplementary Figure S2). These data were extrapolated from the reference genome sequence [17].
3.3. Pseudogene Evolutionary Rates
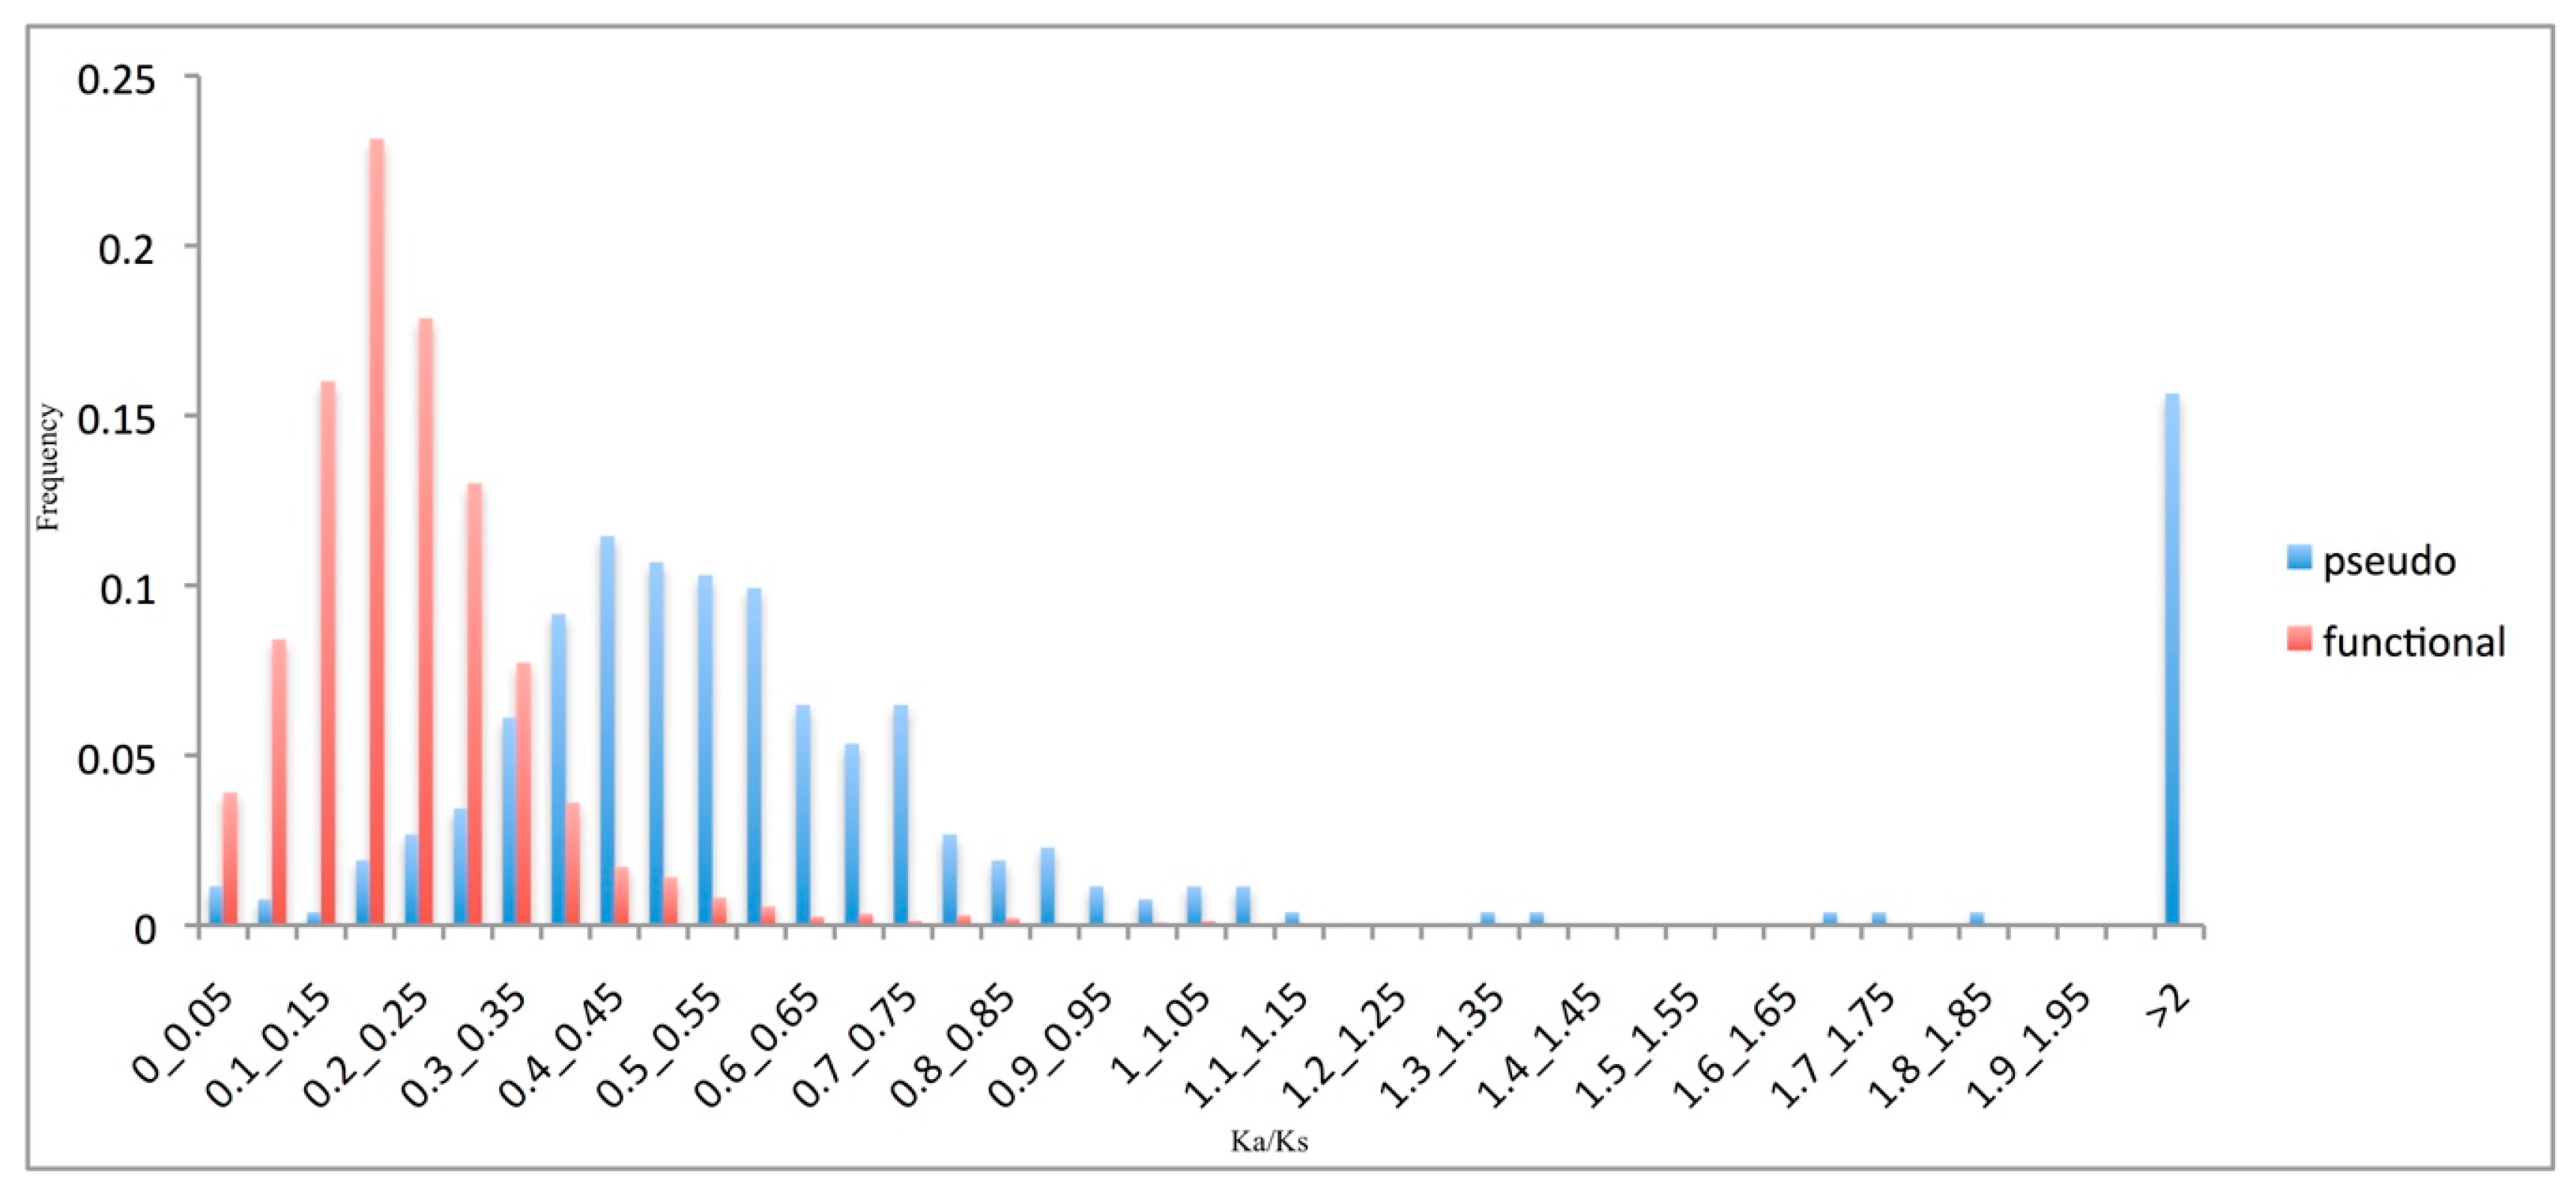
As pseudogenes are non-functional, they are expected to be under very weak selective constraints. Under this assumption, the non-synonymous (Ka) and synonymous (Ks) substitution rates should be equal, and hence the Ka/Ks ratio should approach unity [1,7]. Although all of the pseudogenes used in this study appeared to be disabled, their sequence evolutionary rates were analysed, as several studies have demonstrated that pseudogenes can undergo exaptation for other functions [9,13].
As most amino-acid changes (i.e., non-synonymous substitutions) are selected against in coding sequences, functional genes are expected to have significantly lower Ka/Ks ratio than pseudogenes. As illustrated in Figure 3, the Ka/Ks ratio of the pseudogenes was shifted significantly towards higher values compared to that for the functional genes (p < 0.01). However, the pseudogene Ka/Ks ratio did not peak at the expected value of 1.0. Note that the pseudogene sequences were compared to their ‘sibling’ functional sequences, and not to their true ancestral pater locus. This unavoidable approximation may have inflated the rate estimations [30].
3.4. Transitions Are More Freequent Than Transversions
Two datasets of substitutions were analysed. The non-synonymous dataset (see Methods) comprised nucleotide substitutions at the first and second codon base positions. Generally, substitutions at these positions change the coding specificity of the codon, and are thus counter-selected in the functional locus. On the other hand, the parsimony-based dataset (see Methods) comprised the substitutions identified as single nucleotide variations with respect to the consensus nucleotide between the pater locus and orthologous locus at the corresponding position.
For each nucleotide type (i.e., adenine, guanine, cytosine, thymine), Table 1 provides information on the number of positions inferred to be unchanged in the pseudogene, the positions featuring substitutions in the pseudogene, and those missing in the aligned pseudogene sequence. The substitutions were classified as transversions if a purine was changed for a pyrimidine (or vice versa), or as transitions if they involved only purines or pyrimidines. Cytosine and guanine in CpG dinucleotides were treated separately.
Cytosine and guanine showed the highest frequencies of transitions (Table 1). In particular, cytosine and guanine that were part of the CpG dinucleotides were very frequently substituted by transitions. The CpG dinucleotide is a common target for cytosine methylation, and methylated cytosine is frequently converted to thymine by deamination. These data confirmed the high frequencies of transitions at CpG sites. However, high frequencies of transitions were also seen for non-CpG dinucleotides, which suggested that the methylation/deamination cycle alone cannot explain the high prevalence of transitional substitutions in these grape pseudogenes. The overall patterns detected in the two datasets were highly similar (see Supplementary Table S2 for an analogous summary of the non-synonymous dataset).
3.5. Effects of Compositional Background on Nucleotide Substitution
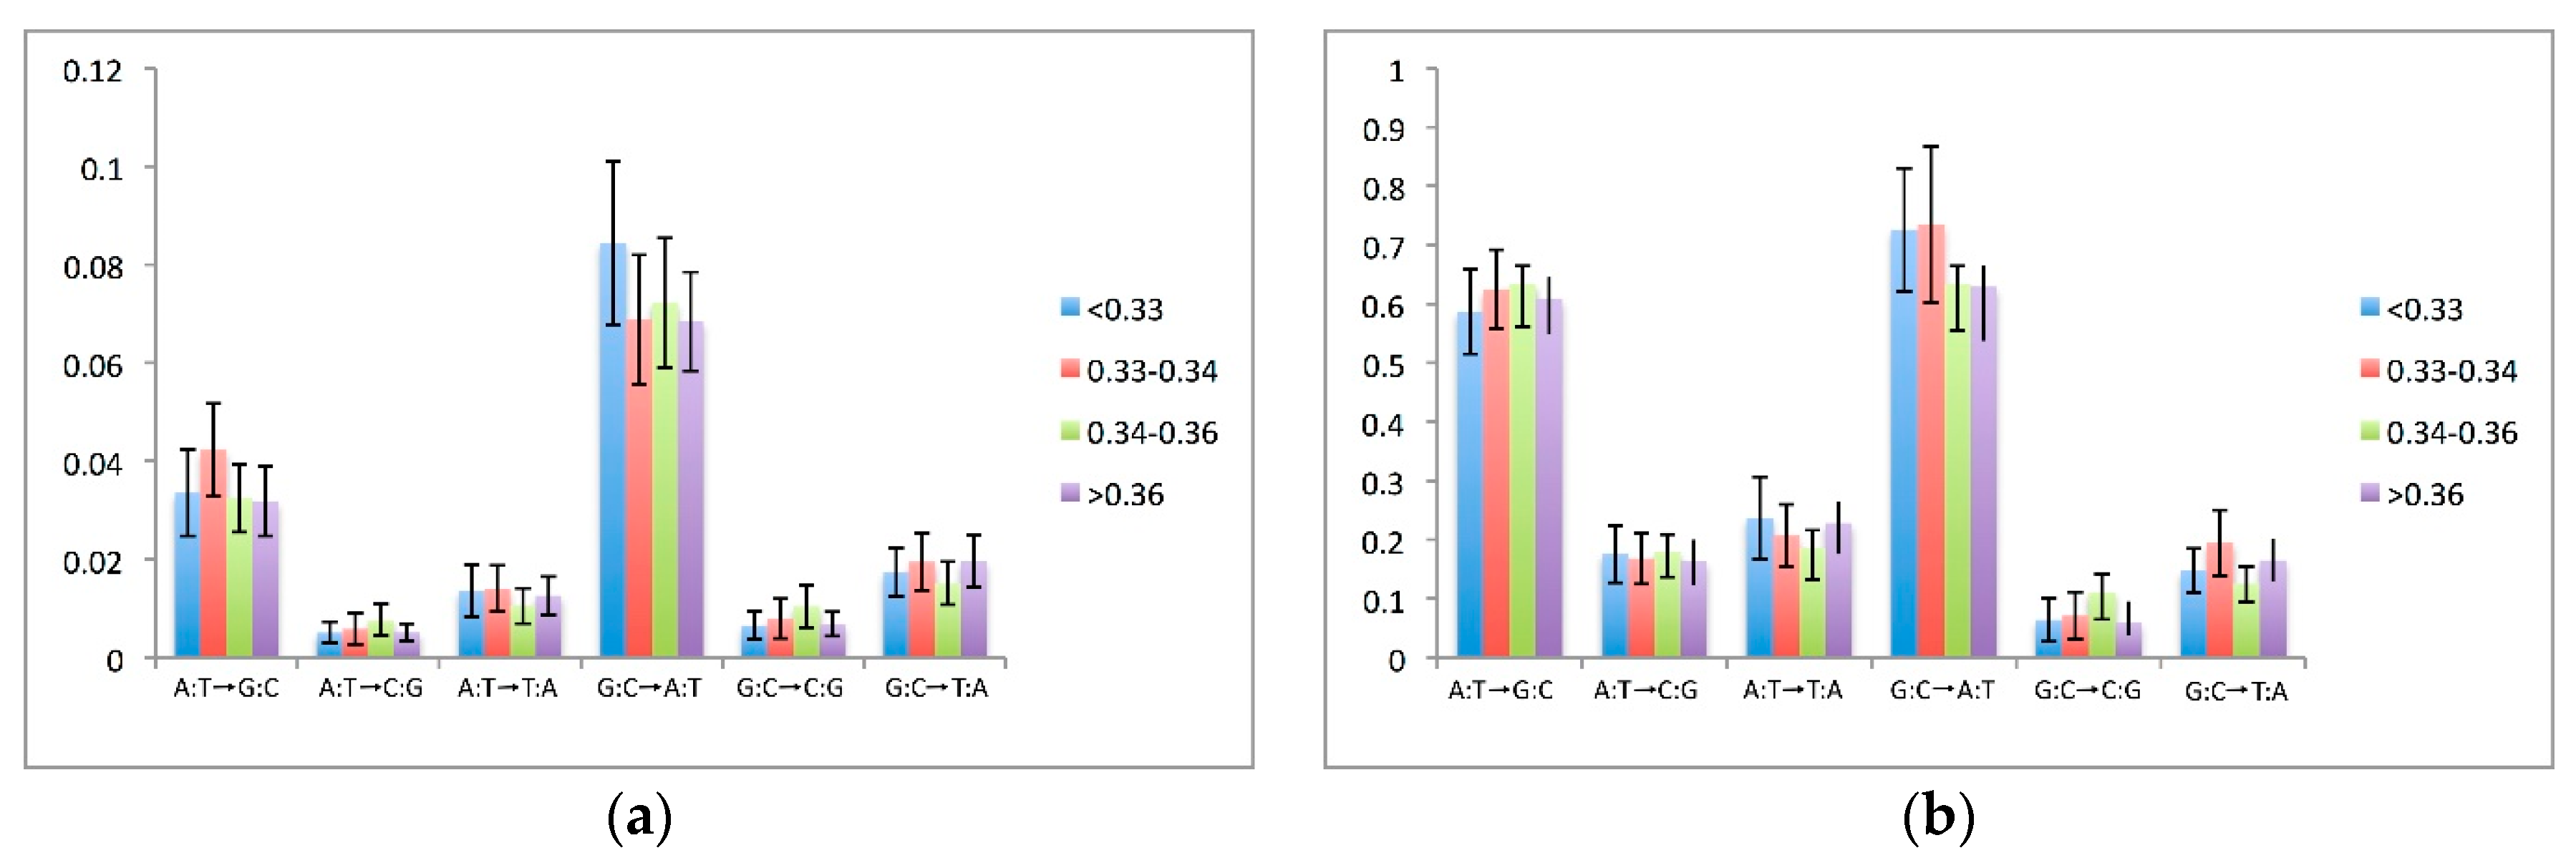
It has been reported that nucleotide substitution rates can vary among compositionally different genomic regions. To gain insight into this phenomenon (i.e., regional effects), the pseudogenes were divided into four groups based on the G + C content of the flanking genomic regions (30,000 bp at both sides of each pseudogene). In all of these pseudogene groups, most of the substitutions occurred by transitions with an overall balance towards a decrease in G:C content (see Figure 4a).
The substitution rates between the nucleotides were also investigated. Following the approach of Zhang and Gerstein [6], the substitution rate was considered to comprise two rates: one that measures the frequency of the change of one nucleotide to another (i.e., substitution rate); and the other that reports the relative proportions of the changes normalised to the identified substitutions (i.e., substitution preferentiality). For example, if we are studying the substitution of nucleotide j for i, we calculate the substitution rate as the ratio between the changes from j to i divided by the total number of nucleotides j in the pseudogene at the time of its integration. This index describes how often the j→i substitution occurs in a sequence. The index of substitution can be preferentiality obtained by normalising the substitutions j→i for the total number of nucleotides j that have been substituted; in other words, the number of j→i changes can be divided by the total number of substitutions that have involved the j nucleotide in the pseudogene. Substitutions between complementary nucleotide pairs were added together. For example, to study the A:T→G:C substitutions, we added up the adenines that were substituted by guanines, and the thymines that were substituted by cytosines. Figure 4a reports the substitution rates (for the parsimony-based dataset) between the nucleotides, and Figure 4b reports the substitution preferentialities (for the parsimony-based dataset). The analogous data for the substitution rates and preferentiality calculated for the non-synonymous dataset are reported in Supplementary Figure S3a,b.
The transitions of G:C→A:T were more frequent than the reverse, of A:T→G:C, which is in agreement with the higher rates of substitutions of G:C for A:T (Figure 4a). Such a bias towards an A:T increase was also observed for the transversions, as the G:C→T:A transversions were more frequent than the reverse, A:T→C:G. The rates of the G:C→A:T transitions were associated with the regional G:C content, with higher rates of these transitions in the groups with lower regional G:C content. Such an effect was, however, less evident for the non-synonymous dataset (see Supplementary Figure S3a).
A different picture emerged in the analysis of the substitution preferentiality (Figure 4b). The differences in the preferentiality rates among the two transitional types were less imbalanced in favour of the substitutions, indicating an A:T increase. Also, the effects of the regional G:C composition on the substitution preferentiality were less pronounced.
3.6. Neigbouring Effects on Nucleotide Substitutions
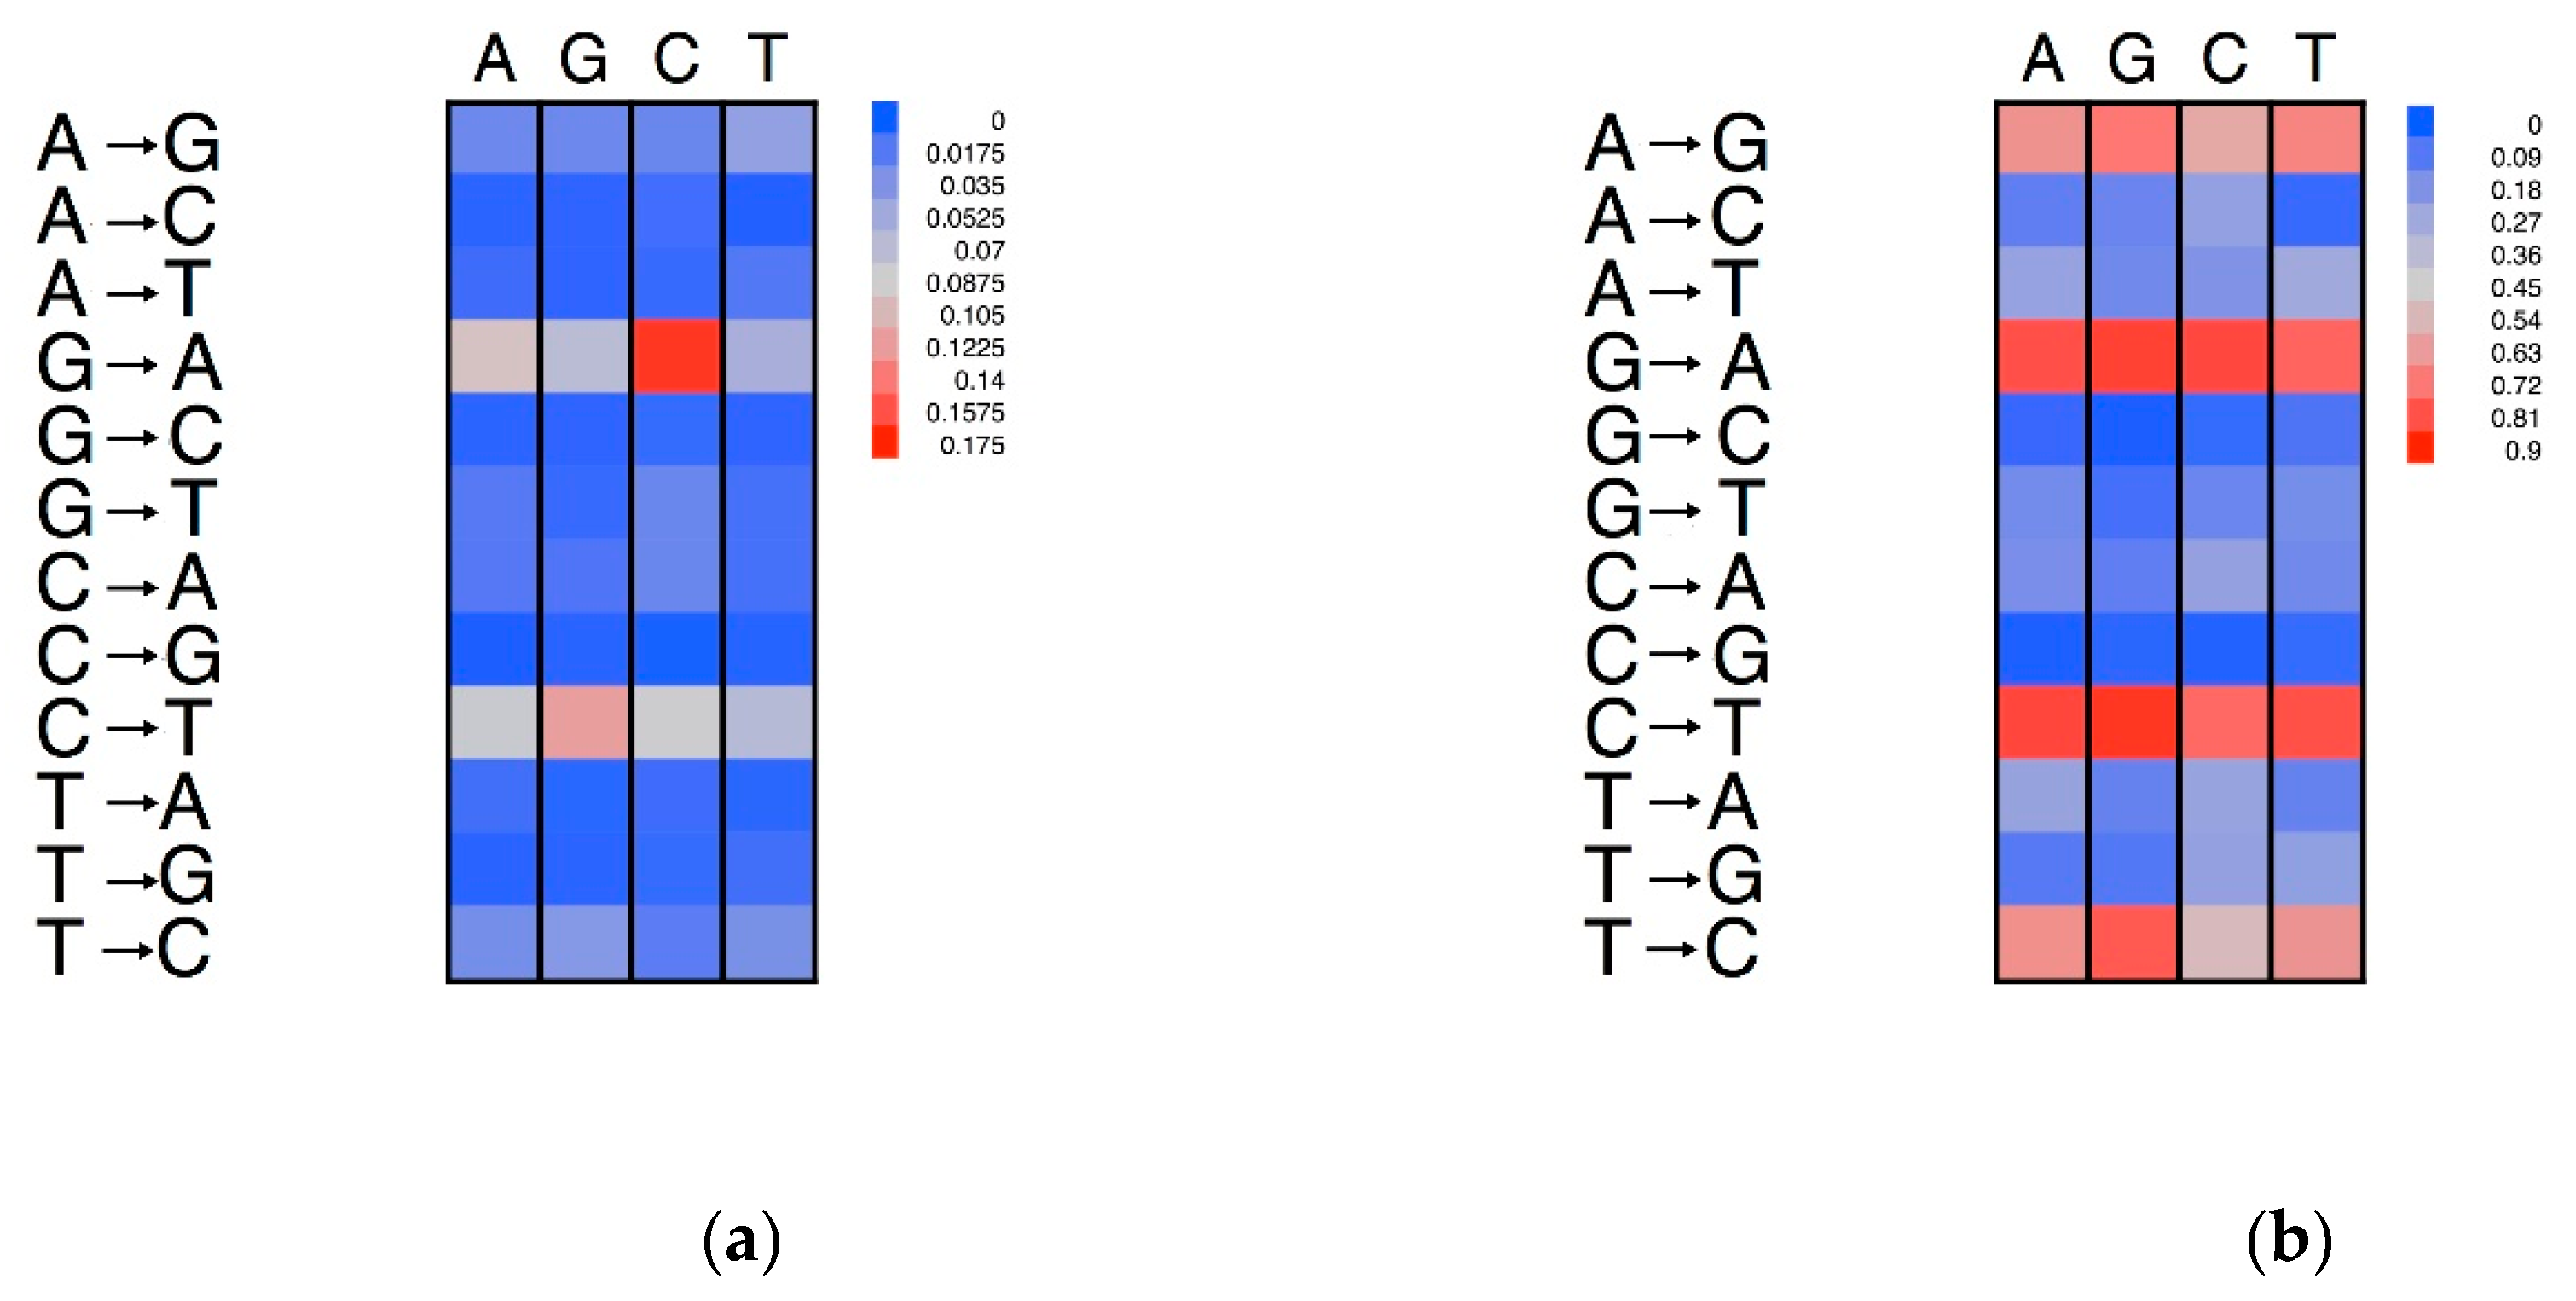
It has been proposed that nucleotide substitution rates are not only under regional effects, but also local effects, e.g., the effects of the nucleotides adjacent to the site that is mutated [4,5,6]. This factor is referred to as a neighbouring effect on substitutions. In analogy with the analysis on mononucleotides, the dinucleotide substitution rate was comprised of two factors: the substitution rate, and the preferentiality rate [6]. The dinucleotide substitution rate was calculated by dividing the number of a given dinucleotide substitution by the total number of occurrences of the dinucleotide in question in the pseudogene sequence at the time of its formation [6]. The dinucleotide preferentiality rate was obtained by normalising the dinucleotide substitutions for the total number of dinucleotides that had mutated in the pseudogene since its formation. To study the effects of adjacent nucleotides, it is essential that the change in question did not involve the nucleotide at the 5′ of the substituted position. This corresponds to an analysis of the alignment in units of two positions and considering only the units that differ in terms of the 3′ position [6]. The direction of the substitution was established following the parsimony approach. Due to the complementarity nature of DNA here, we needed to only consider the effects of the 5′ nucleotide. In other words, the effects of cytosine on thymine for the dinucleotide TpC are assumed to be equivalent to the effects of guanine on adenine for the complementary strand [20].
The neighbouring effects on the substitution rates are illustrated in the heatmap of Figure 5. The rows represent the 12 possible substitutions, while the colour intensities of the cells define the substitution rates. For example, if we consider the transition of A→G, it is evident that this occurs more frequently when the adenine is flanked at the 5′ by a thymine. The transition of G→A showed the highest neighbouring effect, with the highest substitution rates when the guanine was flanked by a cytosine in a CpG dinucleotide (Figure 5a). However, no neighbouring effect was seen on the substitution preferentially for these transitions (Figure 5b). We also noted a high rate of transition of C→T, especially when the cytosine was preceded by a guanine.
Porceddu et al. [31] compared the abundances of the dinucleotides in plant genes with the expectations based on the DNA (mono)nucleotide compositions. The TA dinucleotide was under-represented in both coding and non-coding genomic regions. For both A→G and A→T substitutions, TpA showed a higher substitution rate than the other nucleotides. However, this conclusion did not hold for the A→C substitutions.
4. Discussion
We have used processed pseudogene sequences here to infer the patterns of spontaneous mutations in the V. vinifera genome. As pseudogenes appear not to be subjected to functional constraints, all of their mutations (i.e., nucleotide substitutions) would be selectively neutral and become fixed with equal probability [7,8]. The rate of substitutions from G:C→A:T were higher than the reverse of A:T→G:C. This tendency towards A:T enrichment of pseudogenes was seen for both transitions and transversions. Taking into account the A:T→G:C substitution and the reverse rate, we calculated the equilibrium frequency as about 70 to 72% for A + T, which is a little higher than the average of 67 to 68% for introns and intergenic sequence.
Ossowsky et al. [32] calculated that the expected A+T equilibrium frequency for the A. thaliana genome would be 85%, which is higher than the 68% of the whole A. thaliana genome sequence. Based on the analysis of single nucleotide polymorphisms in maize transcript sequences from a panel of varieties, Morton et al. [5] calculated an expected A + T frequency of 62% for the maize genome. The average A + T relative content of the maize genome is 55% (for non-coding regions), which suggests that maize is far from reaching its compositional equilibrium [5].
The present data indicate that the grape genome is closer to compositional equilibrium than maize and A. thaliana. Whether this difference is due to any ascertainment bias of our pseudogene datasets or to other forces acting in the opposite direction (i.e., lower incidence of the G:C biased gene conversion in V. vinifera, as compared to other plant species) deserves further studies.
These data indicate that transitions are 3.5-fold more frequent than transversions in grape pseudogenes. Benovoy et al. [9] reported that in A. thaliana processed pseudogenes, although the transitions were more abundant than expected by chance, they were less frequent than transversions. In contrast, Ossowsky et al. [32] reported a transitions/transversions ratio of about 2.5 in 10 fully resequenced A. thaliana progenies. Studies conducted by Morton et al. [4] on 90 fully resequenced A. thaliana lines confirmed this preponderance of transition over transversion in introns and intergenic regions of this species. Similar findings have also been reported for several vertebrate genomes [6], and these have converged on the indication that the deamination of methylcytosine is the main determinant of the high transition rate. However, it was recently reported in the grasshopper Podisma psedestris that the transition and transversion rates were similar if the mutations that involved CpG sites were excluded from the computations [33]. To determine whether this conclusion holds for V. vinifera, we separately analysed the cytosines and guanines that were part of the CpG dinucleotides. Indeed, the CpG sites were subjected to very high rates of transitions, although there was also an excess of transitions over transversions even for cytosine and guanine in the non-CpG dinucleotides. Such a finding indicates that the methylation/deamination cycle alone cannot explain the high transition/transversion ratio in these grape pseudogenes. A similar finding was reported in Homo sapiens processed pseudogenes [6], and also by Ossowsky et al. [32] in a study that compared the patterns of methylated cytosines in an A. thaliana individual and the substitutions of 10 fully resequenced progenies.
Zhang et al. [6,34] suggested that the rates of spontaneous mutations can vary among regions. This finding implies that the A:T equilibrium frequency might vary between genomic regions, and it raises questions about the relationships between the genomic distribution of pseudogenes and the sampling errors for the rate estimates. To address these questions, we analysed the substitution rates in compositionally different genomic backgrounds. The differences between these ‘regional’ substitution rates were very small, and they defined a clear trend only in the parsimony-based dataset. This finding is in sharp contrast with the data of Zhang and coworkers [6] in H. sapiens, where their rates of substitutions were clearly associated to compositional differences of the genomic regions. It is worth recalling that in contrast to V. vinifera, the H. sapiens genome is organised compositionally in highly differentiated regions, termed isochores [35]. Studies conducted in both Arabidopsis and maize have, instead, demonstrated significant regional context effects on substitution rates, with an evident association of the regional A:T content and substitutions replacing cytosine or guanine for adenine or thymine [4,5]. It is important to mention that these studies analysed the substitution patterns of non-coding sites, and the regional compositional context was determined based on the sequence of the locus scored for the mutations. The processed pseudogenes originated from retropositions of loci that mapped elsewhere in the genome. We speculate that the compositional differences between the sites and their pater locus genomic positions influenced our detection of substitution regional effects in V. vinifera. We acknowledge also that due to the limited size of the dataset used here, it might have lower power for studies on (weak) regional effects. For these reasons, we urge caution in drawing conclusions based solely on the findings presented in the present study.
Through this study, we investigated the substitution rates as determined by two main factors. The nucleotide substitution rate is a measure of the nucleotide stability, i.e., the probability of a given nucleotide to be changed for another nucleotide. The substitution preferentiality (or the proportion of substitutions) measured the probability of a given type of change over the other possible changes. Neither of these measures of the substitution rates showed strong dependence on regional genomic background. On the contrary, there were evident neighbouring effects of some substitutions. For example, the presence of cytosine at the 5′ end of guanine had evident effects on the probability of guanine to be substituted by a transitional event. However, we did not find any strong neighbouring effects on the preferentiality rates, which indicated that, in this case, the neighbouring nucleotide influenced the vulnerability to mutation, but did not influence the direction of the substitution. Another interesting case was for nucleotides ending with adenine. The presence of thymine at the 5′ targeted the adenine for mutation, which is in agreement with the under-representation of TA in plant genomes.
The advent of next-generation sequencing and the availability of a reference genome will soon allow the generation of sequence data from the wide grape germplasm [36,37]. The spontaneous mutation patterns of nucleotide substitutions presented here can be used as a reference for studies that are aimed at understanding how selection and other evolutionary forces shape the sequence diversity of grape cultivars.
Supplementary Materials
The following are available online at www.mdpi.com/1424-2818/9/4/45/s1, Figure S1: Pseudogene–pater locus alignment, Figure S2: GC3 content of pseudogenes and functional genes, Figure S3: Substitution patterns between nucleotide pairs (non-synonymous dataset), Table S1: List of the analysed processed pseudogenes.
Acknowledgments
We acknowledge the Regione Autonoma della Sardegna for grant LR7 CRP-79000.
Author Contributions
Andrea Porceddu and Salvatore Camiolo conceived, designed and performed the experiments, and analysed the data; Andrea Porceddu wrote the paper.
Conflicts of Interest
The authors declare no conflict of interest.
References
- Fitch, W.M. Evidence suggesting a non-random character to nucleotide replacements in naturally occurring mutations. J. Mol. Biol. 1967, 26, 499–507. [Google Scholar] [CrossRef]
- Kimura, M. Estimation of evolutionary distances between homologous nucleotide sequences. Proc. Natl Acad. Sci. USA 1981, 78, 454–458. [Google Scholar] [CrossRef] [PubMed]
- Grantham, R. Amino-acid difference formula to help explain protein evolution. Science 1974, 185, 862–864. [Google Scholar] [CrossRef] [PubMed]
- Morton, B.R.; Dar, V.-U.-N.; Wright, S.I. Analysis of site frequency spectra from Arabidopsis with context-dependent corrections for ancestral misinference. Plant. Physiol. 2009, 149, 616–624. [Google Scholar] [CrossRef] [PubMed]
- Morton, B.R.; Bi, I.V.; McMullen, M.D.; Gaut, B.S. Variation in mutation dynamics across the maize genome as a function of regional and flanking base composition. Genetics 2006, 172, 569–577. [Google Scholar] [CrossRef] [PubMed]
- Zhang, Z.; Gerstein, M. Patterns of nucleotide substitution, insertion and deletion in the human genome inferred from pseudogenes. Nucleic Acids Res. 2003, 31, 5338–5348. [Google Scholar] [CrossRef] [PubMed]
- Gojobori, T.; Li, W.H.; Graur, D. Patterns of nucleotide substitution in pseudogenes and functional genes. J. Mol. Evol. 1982, 18, 360–369. [Google Scholar] [CrossRef] [PubMed]
- Petrov, D.A.; Hartl, D.L. Patterns of nucleotide substitution in Drosophila and mammalian genomes. Proc. Natl. Acad. Sci. USA 1999, 96, 1475–1479. [Google Scholar] [CrossRef] [PubMed]
- Benovoy, D.; Drouin, G. Processed pseudogenes, processed genes, and spontaneous mutations in the Arabidopsis genome. J. Mol. Evol. 2006, 62, 511–522. [Google Scholar] [CrossRef] [PubMed]
- Vanin, E.F. Processed pseudogenes. Characteristics and evolution. Biochim. Biophys. Acta 1984, 782, 231–241. [Google Scholar] [CrossRef]
- Esnault, C.; Maestre, J.; Heidmann, T. Human LINE retrotransposons generate processed pseudogenes. Nat. Genet. 2000, 24, 363–367. [Google Scholar] [PubMed]
- Tutar, Y. Pseudogenes. Comp. Funct. Genom. 2012. [Google Scholar] [CrossRef] [PubMed]
- Wen, Y.-Z.; Zheng, L.-L.; Qu, L.-H.; Ayala, F.J.; Lun, Z.-R. Pseudogenes are not pseudo any more. RNA Biol. 2012, 9, 27–32. [Google Scholar] [CrossRef] [PubMed]
- Ophir, R.; Graur, D. Patterns and rates of indel evolution in processed pseudogenes from humans and murids. Gene 1997, 205, 191–202. [Google Scholar] [CrossRef]
- Mitchell, A.; Graur, D. Inferring the pattern of spontaneous mutation from the pattern of substitution in unitary pseudogenes of Mycobacterium leprae and a comparison of mutation patterns among distantly related organisms. J. Mol. Evol. 2005, 61, 795–803. [Google Scholar] [CrossRef] [PubMed]
- Ossowski, S.; Schneeberger, K.; Clark, R.M.; Lanz, C.; Warthmann, N.; Weigel, D. Sequencing of natural strains of Arabidopsis thaliana with short reads. Genome Res. 2008, 18, 2024–2033. [Google Scholar] [CrossRef] [PubMed]
- Jaillon, O.; Aury, J.-M.; Noel, B.; Policriti, A.; Clepet, C.; Casagrande, A.; Choisne, N.; Aubourg, S.; Vitulo, N.; Jubin, C.; et al. The grapevine genome sequence suggests ancestral hexaploidization in major angiosperm phyla. Nature 2007, 449, 463–467. [Google Scholar] [CrossRef] [PubMed]
- Camiolo, S.; Porceddu, A. gff2sequence, a new user friendly tool for the generation of genomic sequences. BioData Min. 2013, 6, 15. [Google Scholar] [CrossRef] [PubMed]
- Camiolo, S.; Porceddu, A. Identification of Pseudogenes in Brachipodium dystachion. In Methods in Molecular Biology; Humana Press: New York, NY, USA, 2018; Volume 1667, pp. 1–15. [Google Scholar]
- Zheng, D.; Gerstein, M.B. A computational approach for identifying pseudogenes in the ENCODE regions. Genome Biol. 2006, 7 (Suppl. 1), S13. [Google Scholar] [CrossRef] [PubMed]
- Zhang, Z.; Carriero, N.; Zheng, D.; Karro, J.; Harrison, P.M.; Gerstein, M. PseudoPipe: An automated pseudogene identification pipeline. Bioinformatics 2006, 22, 1437–1439. [Google Scholar] [CrossRef] [PubMed]
- Birney, E.; Clamp, M.; Durbin, R. GeneWise and Genomewise. Genome Res. 2004, 14, 988–995. [Google Scholar] [CrossRef] [PubMed]
- Khelifi, A.; Adel, K.; Duret, L.; Laurent, D.; Mouchiroud, D.; Dominique, M. HOPPSIGEN: A database of human and mouse processed pseudogenes. Nucleic Acids Res. 2005, 33, D59–D66. [Google Scholar] [PubMed]
- Huang, Y.; Niu, B.; Gao, Y.; Fu, L.; Li, W. CD-HIT Suite: A web server for clustering and comparing biological sequences. Bioinformatics 2010, 26, 680–682. [Google Scholar] [CrossRef] [PubMed]
- Thompson, J.D.; Higgins, D.G.; Gibson, T.J. CLUSTAL W: Improving the sensitivity of progressive multiple sequence alignment through sequence weighting, position-specific gap penalties and weight matrix choice. Nucleic Acids Res. 1994, 22, 4673–4680. [Google Scholar] [CrossRef] [PubMed]
- Yang, Z. PAML 4: Phylogenetic analysis by maximum likelihood. Mol. Biol. Evol. 2007, 24, 1586–1591. [Google Scholar] [CrossRef] [PubMed]
- Li, W.H. Unbiased estimation of the rates of synonymous and nonsynonymous substitution. J. Mol. Evol. 1993, 36, 96–99. [Google Scholar] [CrossRef] [PubMed]
- Wang, Y.; Tang, H.; Debarry, J.D.; Tan, X.; Li, J.; Wang, X.; Lee, T.-H.; Jin, H.; Marler, B.; Guo, H.; et al. MCScanX: A toolkit for detection and evolutionary analysis of gene synteny and collinearity. Nucleic Acids Res. 2012, 40, e49. [Google Scholar] [CrossRef] [PubMed]
- Edgar, R.C. MUSCLE: Multiple sequence alignment with high accuracy and high throughput. Nucleic Acids Res. 2004, 32, 1792–1797. [Google Scholar] [CrossRef] [PubMed]
- Thibaud-Nissen, F.; Ouyang, S.; Buell, C.R. Identification and characterization of pseudogenes in the rice gene complement. BMC Genom. 2009, 10, 317. [Google Scholar] [CrossRef] [PubMed]
- Porceddu, A.; Camiolo, S. Spatial analyses of mono, di and trinucleotide trends in plant genes. PLoS ONE 2011, 6, e22855. [Google Scholar] [CrossRef] [PubMed]
- Ossowski, S.; Schneeberger, K.; Lucas-Lledó, J.I.; Warthmann, N.; Clark, R.M.; Shaw, R.G.; Weigel, D.; Lynch, M. The rate and molecular spectrum of spontaneous mutations in Arabidopsis thaliana. Science 2010, 327, 92–94. [Google Scholar] [CrossRef] [PubMed]
- Keller, I.; Bensasson, D.; Nichols, R.A. Transition-transversion bias is not universal: A counter example from grasshopper pseudogenes. PLoS Genet. 2007, 3, e22. [Google Scholar] [CrossRef] [PubMed] [Green Version]
- Zhang, Z.D.; Frankish, A.; Hunt, T.; Harrow, J.; Gerstein, M. Identification and analysis of unitary pseudogenes: Historic and contemporary gene losses in humans and other primates. Genome Biol. 2010, 11, R26. [Google Scholar] [CrossRef] [PubMed]
- Costantini, M.; Clay, O.; Auletta, F.; Bernardi, G. An isochore map of human chromosomes. Genome Res. 2006, 16, 536–541. [Google Scholar] [CrossRef] [PubMed]
- Cardone, M.F.; D’Addabbo, P.; Alkan, C.; Bergamini, C.; Catacchio, C.R.; Anaclerio, F.; Chiatante, G.; Marra, A.; Giannuzzi, G.; Perniola, R.; et al. Inter-varietal structural variation in grapevine genomes. Plant. J. 2016, 88, 648–661. [Google Scholar] [CrossRef] [PubMed]
- Mercenaro, L.; Nieddu, G.; Porceddu, A.; Pezzotti, M.; Camiolo, S. Sequence polymorphisms and structural variations among four grapevine (Vitis vinifera L.) cultivars representing Sardinian agriculture. Front. Plant. Sci. 2017, 8, 1279. [Google Scholar] [CrossRef] [PubMed]
Figure 1.
The pipeline outline. The pseudogenes were identified by sequence homology to functional exons using tblastn. Step A: Query preparation and tblastn homology search. Step B: Hit filtering. Step C: Hit merging to generate pseudogenic models. Step D: Pater locus assignment. Step E: Pseudogene classification.

Figure 2.
Relative G + C content distribution of the pseudogenes (red), the coding sequences of the functional genes (blue), and the intergenic sequences (yellow).
Figure 2.
Relative G + C content distribution of the pseudogenes (red), the coding sequences of the functional genes (blue), and the intergenic sequences (yellow).

Figure 3.
Pseudogene evolutionary rates. Frequency distributions of the Ka/Ks ratios of the functional genes (red) and pseudogenes (blue).
Figure 3.
Pseudogene evolutionary rates. Frequency distributions of the Ka/Ks ratios of the functional genes (red) and pseudogenes (blue).

Figure 4.
Substitution patterns between the nucleotide pairs. (a) Substitution rates as normalised by the numbers of nucleotides of each type. Confidence intervals (95%) are given. (b) Substitutions rate (preferentiality) as normalised by the proportions of nucleotides that have mutated to another type. Reported values are intended as percentages. Each bar represents the sum of the substitution rates for complementary nucleotide pairs. As a way of example, A:T→G:C derives from the analysis of substitutions A→G and T→C.

Figure 5.
Neighbouring effects on the nucleotide substitution patterns. The dinucleotides are grouped on the basis of their first (5′) nucleotide. (a) Substitution rates normalised on the number of nucleotides of each type. (b) Proportions of substitutions normalised by the number of each type of substituted nucleotide type. The columns report the neighbouring nucleotide at the 5′ of the substituted nucleotide. The rows report the substitution type.

Table 1.
Summary of nucleotide substitutions in the grape processed pseudogenes from the parsimony-based dataset.
Table 1.
Summary of nucleotide substitutions in the grape processed pseudogenes from the parsimony-based dataset.
| Nucleotide | Total | Unchanged | Deletions | Substitutions a | ||||
|---|---|---|---|---|---|---|---|---|
| Type | Group | (n) | (n (%Total)) | (n (%Total)) | Total | Transitions (n (%Substitutions)) | Transversions (n (%Substitutions)) | Transitions: Transversions Ratio |
| A | All | 13,546 | 12,655 (93.42) | 198 (1.46) | 693 (5.12) | 421 (60.75) | 272 (39.25) | 1.55 |
| G | All | 11,928 | 10,476 (87.83) | 172 (1.44) | 1280 (10.73) | 994 (77.65) | 286 (22.34) | 3.48 |
| CpG | 429 | 343 (79.95) | 6 (1.39) | 80 (18.65) | 63 (78.75) | 17 (21.25) | 3.71 | |
| Non-CpG | 11,499 | 10,133 (88.12) | 166 (1.44) | 1200 (10.44) | 931 (77.58) | 269 (22.42) | 3.46 | |
| C | All | 8618 | 7516 (87.21) | 102 (1.18) | 1000 (11.60) | 786 (78.60) | 214 (21.40) | 3.67 |
| CpG | 429 | 336 (78.32) | 6 (1.39) | 87 (20.28) | 81 (93.10) | 6 (6.90) | 13.50 | |
| Non-CpG | 8189 | 7180 (87.68) | 96 (1.34) | 913 (11.15) | 705 (77.21) | 208 (22.78) | 3.39 | |
| T | All | 13,835 | 12,955 (93.64) | 158 (1.14) | 722 (5.22) | 446 (61.77) | 276 (38.23) | 1.62 |
a Transversion, purine changed for pyrimidine (or vice versa); transitions and substitutions that involve only purines or pyrimidines.
© 2017 by the authors. Licensee MDPI, Basel, Switzerland. This article is an open access article distributed under the terms and conditions of the Creative Commons Attribution (CC BY) license (http://creativecommons.org/licenses/by/4.0/).
Share and Cite
MDPI and ACS Style
Porceddu, A.; Camiolo, S. Patterns of Spontaneous Nucleotide Substitutions in Grape Processed Pseudogenes. Diversity 2017, 9, 45. https://doi.org/10.3390/d9040045
AMA Style
Porceddu A, Camiolo S. Patterns of Spontaneous Nucleotide Substitutions in Grape Processed Pseudogenes. Diversity. 2017; 9(4):45. https://doi.org/10.3390/d9040045
Chicago/Turabian StylePorceddu, Andrea, and Salvatore Camiolo. 2017. "Patterns of Spontaneous Nucleotide Substitutions in Grape Processed Pseudogenes" Diversity 9, no. 4: 45. https://doi.org/10.3390/d9040045
Note that from the first issue of 2016, this journal uses article numbers instead of page numbers. See further details here.