Article

Genetic Diversity Assessment of Portuguese Cultivated Vicia faba L. through IRAP Markers

1
Linking Landscape, Environment, Agriculture and Food (LEAF), Instituto Superior de Agronomia, Universidade de Lisboa, Tapada da Ajuda 1349-017 Lisboa, Portugal
2
Plant Biology/CIBIO-Centro de Investigação em Biodiversidade e Recursos Genéticos, Universidade do Porto, Campus Agrário de Vairão, 4485—661 Vairão, Portugal
3
Instituto de Agricultura Sostenible, CSIC, Apdo 4084, 14080 Cordoba, Spain
4
Unidade de Investigação de Biotecnologia e Recursos Genéticos, INIAV, Quinta do Marquês, 2784—505 Oeiras, Portugal
*
Author to whom correspondence should be addressed.
Diversity 2016, 8(2), 8; https://doi.org/10.3390/d8020008
Submission received: 18 December 2015 / Revised: 18 March 2016 / Accepted: 21 March 2016 / Published: 25 March 2016

Abstract

:
Faba bean have been grown in Portugal for a long time and locally adapted populations are still maintained on farm. The genetic diversity of four Portuguese faba bean populations that are still cultivated in some regions of the country was evaluated using the Inter Retrotransposons Amplified Polymorphism (IRAP) technique. It was shown that molecular markers based on retrotransposons previously identified in other species can be efficiently used in the genetic variability assessment of Vicia faba. The IRAP experiment targeting Athila yielded the most informative banding patterns. Cluster analysis using the neighbor-joining algorithm generated a dendrogram that clearly shows the distribution pattern of V. faba samples. The four equina accessions are separated from each other and form two distinct clades while the two major faba bean accessions are not unequivocally separated by the IRAP. Fluorescent In Situ Hybridization (FISH) analysis of sequences amplified by IRAP Athila revealed a wide distribution throughout V. faba chromosomes, confirming the whole-genome coverage of this molecular marker. Morphological characteristics were also assessed through cluster analysis of seed characters using the unweighted pair group method arithmetic average (UPGMA) and principal component analysis (PCA), showing a clear discrimination between faba bean major and equina groups. It was also found that the seed character most relevant to distinguish accessions was 100 seed weight. Seed morphological traits and IRAP evaluation give similar results supporting the potential of IRAP analysis for genetic diversity studies.

Graphical Abstract

1. Introduction

Faba bean (Vicia faba L.) is an important grain legume for human and animal consumption since their seeds are an important source of protein. It is an ancient crop only represented by cultivated forms in germplasm collections. Thus, these biodiversity “assets” represent key sources of traits and are indispensable for future crop improvement and food security, especially since the modernization of agriculture reduces genetic diversity [1]. Faba bean is an entomogamous, partially allogamous crop that has recently been considered a candidate for low input and organic agriculture [2]. Based on differences in seed weight, shape, size and leaflet density, four botanical varieties have been recognized: V. faba paucijuga (very small seed and leaflet size and number), V. faba minor (small seed), V. faba equina (intermediate seed) and V. faba major (with flattened and large seed), [3,4,5]. Equina and major botanical groups consist of the richest groups in genetic variability [4].
Through the process of domestication, the faba bean crop has been subjected to natural selection and human selection, which resulted in cultivars specifically adapted to different sets of environmental combinations. Both human use and geographical factors played major and interdependent roles in determining the diversity of Spanish major and equina landraces, the former being the most important [6]. The main trait discerning between these botanical groups is seed weight and differences in this trait are mainly due to different uses. Progress in assessing local genetic diversity has been explicitly designated as a research priority at the European Innovation Partnership (EIP)-Focus Group on “Genetic Resources: Cooperation Models” in order to strengthen the development of cultivars and breeds particularly adapted to specific regions [7].
In Portugal, the most important types are major and equina. However, there is insufficient knowledge on both types and the existing diversity in local landraces needs to be identified and quantified.
V. faba was cultivated in the Iberian Peninsula before 4000 BC [8] and carbonized seeds of faba bean minor from the Early Bronze Age were found in Portugal [9]. In the last decades, faba bean has been widely grown in Portugal but its area of cultivation is decreasing due to its low and unstable yield, farmers aging and land abandonment [10]. Presently, faba bean cropping area is restricted to 675 ha with a production of 5973 tons in 2012 [11,12]. Nowadays, locally adapted faba bean populations, mainly of the major type, are grown for human consumption and maintained on farm in some regions of the country, namely in the Oeste and the Algarve [13] and also in the Azores islands [14]. Portuguese germplasm collection has been identified as a key collection for its uniqueness in the context of the global faba bean gene-pools [15]. Recently, a V. faba ex situ collection mainly composed of Portuguese landraces [1] was regenerated and morphologically characterized [16] A great diversity of seed size and coat color was observed, particularly among the populations from the Madeira Islands [17]. Duplicates of the regenerated accessions were sent to the Svalbard Global Seed Vault, Norway and to the Centro de Recursos Fitogenéticos, Madrid, Spain.
Retrotransposons play a crucial role in genome evolution and speciation due to their dynamics and potential mobility [18]. A positive correlation between plant genome size and retrotransposon frequency has been reported (reviewed in [19]). In the Vicia genus, retrotransposon copy number is directly correlated with retrotransposon diversity [20].
V. faba (2n = 2x = 12) has a very large genome size (13,000 Mbp) due to a high number of retrotransposon copies [20,21]. Long terminal repeat (LTR) retrotransposons provide useful markers for the analysis of genetic diversity [22,23,24,25]. Although most retrotransposons are dispersed, they can also be clustered in the genome, allowing the utilization of the Inter-Retrotransposon Amplification Polymorphism (IRAP) technique [26]. IRAP has been used to study diversity within Pisum sativum [27,28], Vitis vinifera [29], Zea mays [30], Oryza sativa [31], Triticeae species [32,33], Avena species [34] and Arabidopsis [35].
The diffusion of alien germplasm has been responsible for the fast substitution of landraces. Thus, information on the extent of genetic diversity in the locally adapted populations has great implications for developping a suitable strategy for the maintenance and utilization of faba bean germplasm [36]. Moreover, in times of expected climate change and ecosystem instability, the importance of landrace conservation is paramount. The aim of this work was to assess the diversity in a selection of locally adapted faba bean populations which are still grown in the Portuguese farmer fields using the IRAP technique. The genetic variation assessed through IRAP was combined with morphological characterization and the IRAP amplification mapping was examined through Fluorescent In Situ Hybridization (FISH).

2. Experimental Section

2.1. Plant Material and DNA Extraction

Four Portuguese accessions adapted to different agroecological conditions were studied. These accessions represent the faba bean that is grown in the farmers´ fields at present day: two belonging to the major botanical group and two to the equina botanical group. Two inbred lines (for at least three generations of selfing) of the equina group were used as the control.
The faba bean accessions representing the major group were “Fava Do Algarve” (5357), which is a traditional variety registered in the National Catalogue of Varieties in 1992 and frequently found in farms of the Algarve and Oeste regions; and “Fava da Terra” (5362), which is a landrace from the Azores Islands. The equina group was represented by the locally adapted population “Favel” (5356) obtained from the National Plant Breeding Station (Elvas, Portugal); and “Fava Miúda” (2288) from the Madeira Islands. The two inbred lines used were “Jaulon 45” and “Jaulon 58” (Table 1).
Plants were grown under a pollinator-exclusion environment. Considering the mating system of the faba bean, five randomly chosen individual plants were analyzed from each local population. For inbred lines, three randomly chosen individual plants were used. DNA was isolated from the young leaves of four week old plants, using the Cetyltrimethylammonium Bromide (CTAB) extraction buffer according to [37].

2.2. IRAP

IRAP was performed and compared within distinct plants from each accession and between different accessions. IRAP PCR was performed in a 20 μL reaction mixture as previously described [38], using primers targeting the LTR of retrotransposons Nikita (5′-CGCTCCAGCGGTACTGCC) [39], Tat-1 (5′-TCCTCGTAAAACAACCACAAG), and Athila4-6 (5′-AAATGGATGCTCAAAACATGC) [19]. PCR products were separated by 1.7% agarose gel electrophoresis and detected by Ethidium Bromide staining. In addition, 1 kb Plus DNA Ladder (Invitrogen, Carlsbad, CA, USA) was used as molecular weight marker. Banding profiles from PCR products were registered using a BIO-Rad GEL DOC 2000 (Bio Rad, Hercules, CA, USA). The IRAP banding profiles were considered reliable when showing identical patterns on at least three replicates.

2.3. IRAP Data Analysis

The IRAP Athila4-6 banding profiles were analyzed with each amplified fragment as a unit character and scored as a binary code 1 and 0 for presence and absence, respectively. Only the prominent bands were scored for data reliability. In order to better visualize the relationships among the individuals and populations, the neighbor-joining (weighted) algorithm as implemented in DARwin software package, version 6.0.12 (CIRAD, Montpellier, France) [40] was used. The reliability of the neighbor-joining tree topology was assessed via bootstrapping [41] over 10,000 replicates.

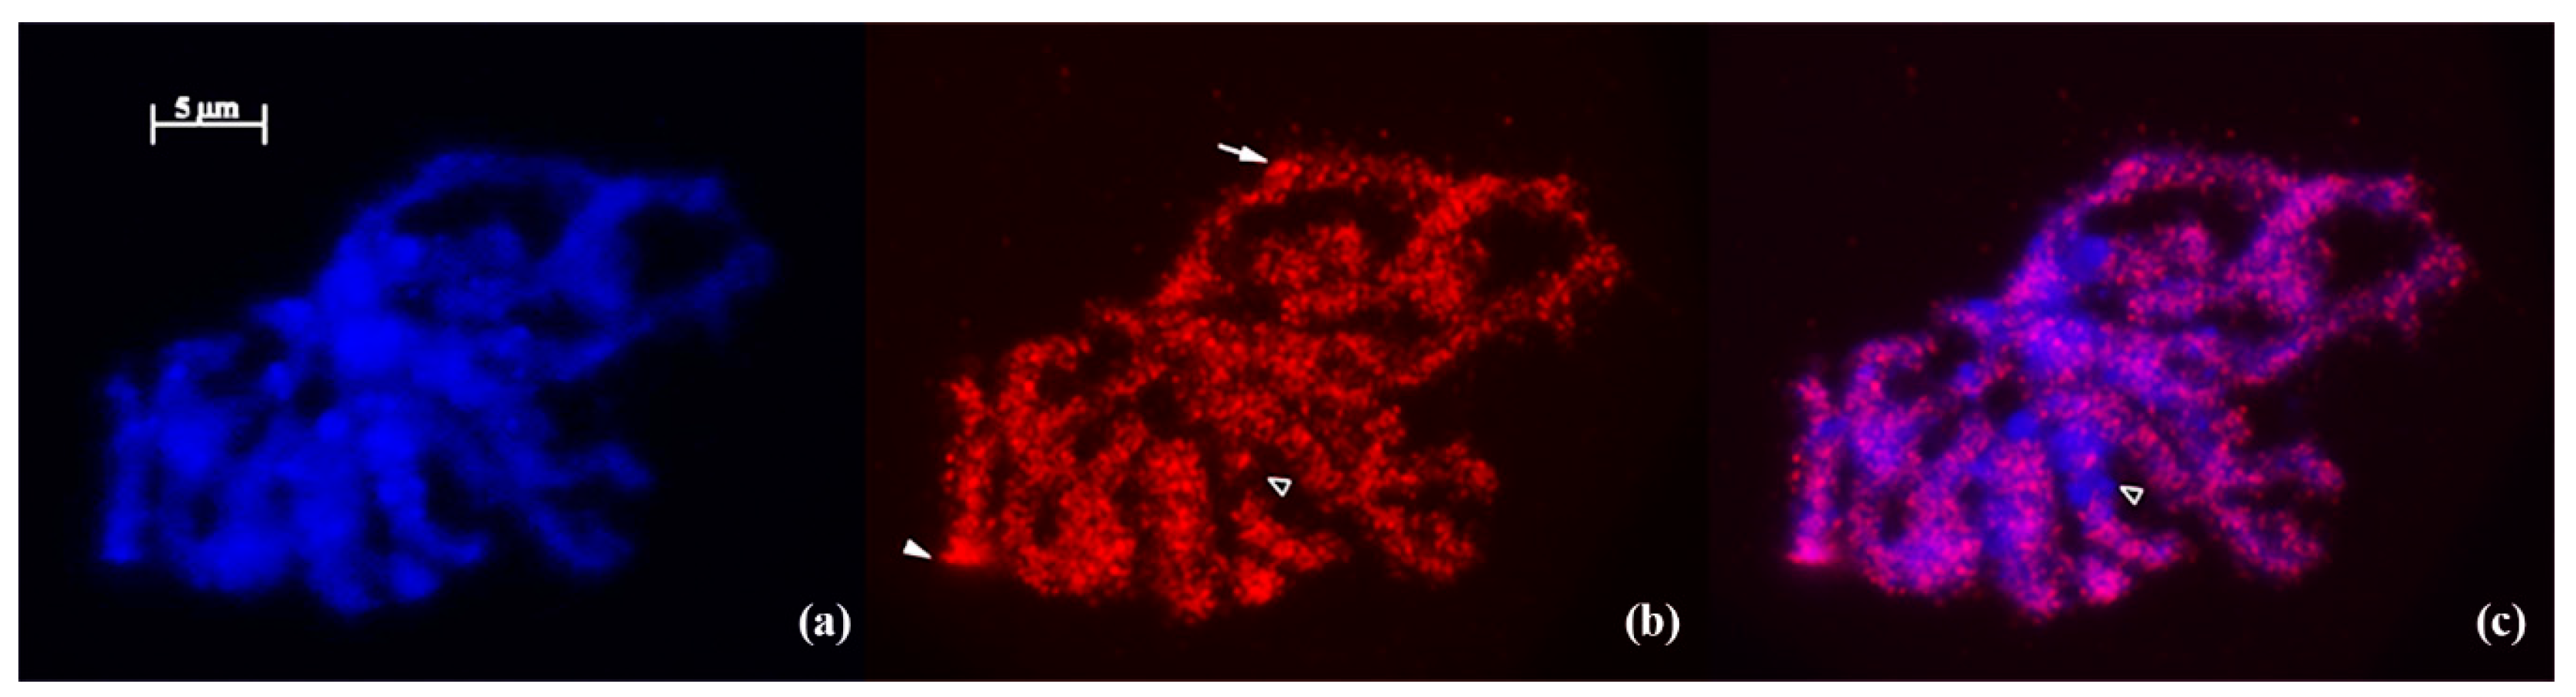
2.4. Fluorescence in Situ Hybridization (FISH)

For Fluorescence In Situ Hybridization (FISH), root tips were collected from one-week-old plants, washed, fixed in ethanol/acetic acid (3:1 vol/vol) for 24 h at room temperature and stored at −20 °C in fresh 3:1 solution until use.
FISH analysis was performed as previously described [42]. The Athila4-6 IRAP amplified from “Fava Do Algarve” (5357) labeled with biotin-dUTP (Roche, Basel, Switzerland) was used as probe. The probe was detected with Cy3- streptavidin conjugated (red) and chromosomes were counterstained with 4′,6-diamidino-2-phenylindole hydrochloride (DAPI, blue) in Citifluor antifade mounting medium (AF1; Agar Scientific Stansted, UK). Samples were examined using a Zeiss AxioImager Z1 epifluorescence microscope (Zeiss, Oberkochen, Germany). Images were obtained using a Zeiss AxioCam HRm digital camera (Zeiss, Oberkochen, Germany) and processed using Photoshop (Adobe Systems Mountain View, CA, USA).

2.5. Morphological Characterization

Accessions were evaluated according to the International Board for Plant Genetic Resources and International Center for Agricultural Research in the Dry Areas (IBPGR/ICARDA) faba bean descriptors. Three quantitative seed traits were recorded for each accession: (1) number of seeds per pod; (2) seed length, width and thickness (in mm; analysis of twenty randomly selected seeds) and (3) seed weight (in g; evaluation on 100 seeds). To examine the variation and to identify the most relevant seed characters for accessions distinction, cluster analysis using the unweighted pair group method arithmetic average (UPGMA) and principal component analysis (PCA) were performed. The program NTSYS-pc, version 2.1 (Applied Biostatistics Inc, New York, NY, USA) was used in all of the statistical analyses [43].

3. Results and Discussion

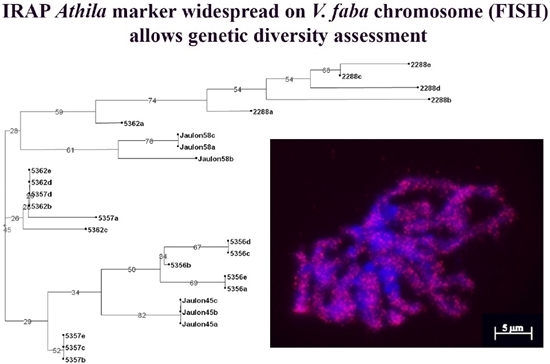
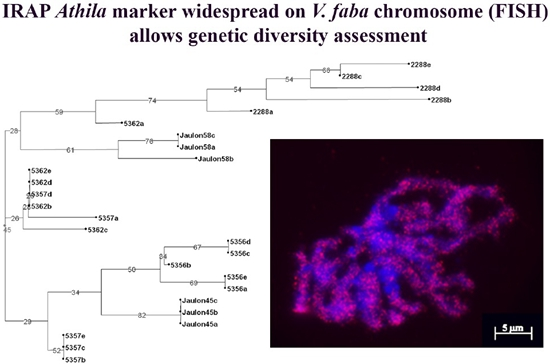
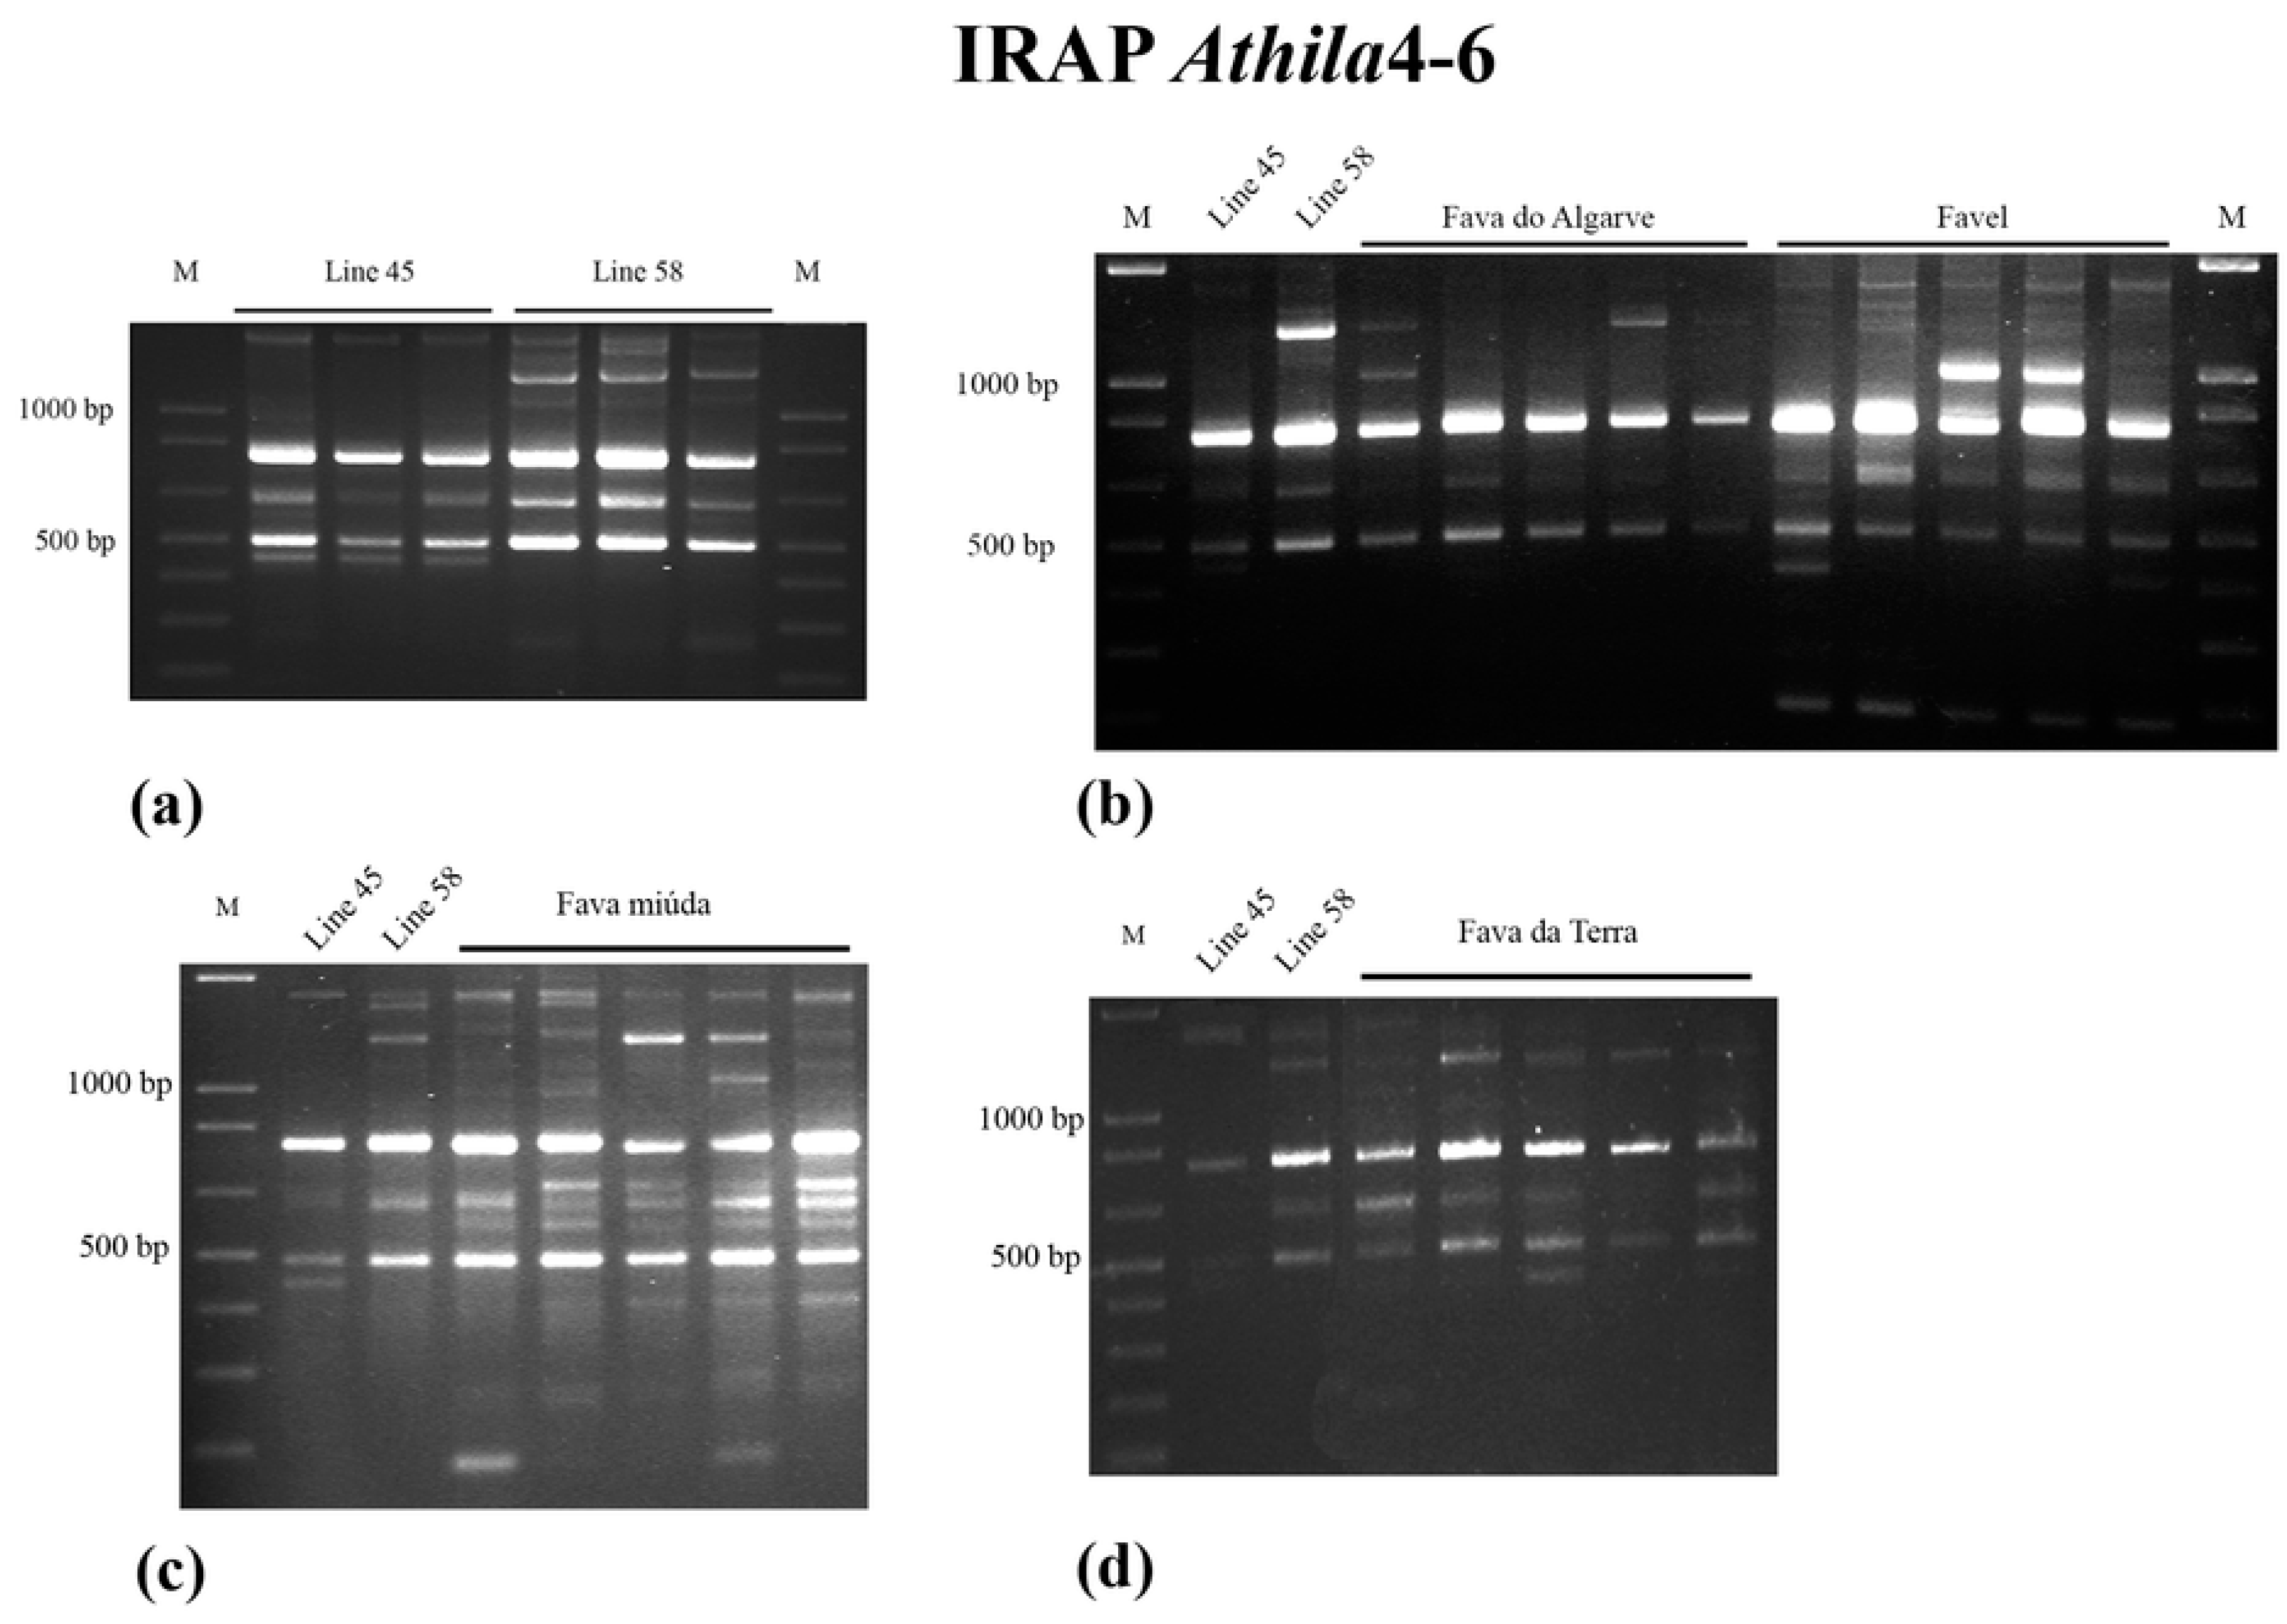
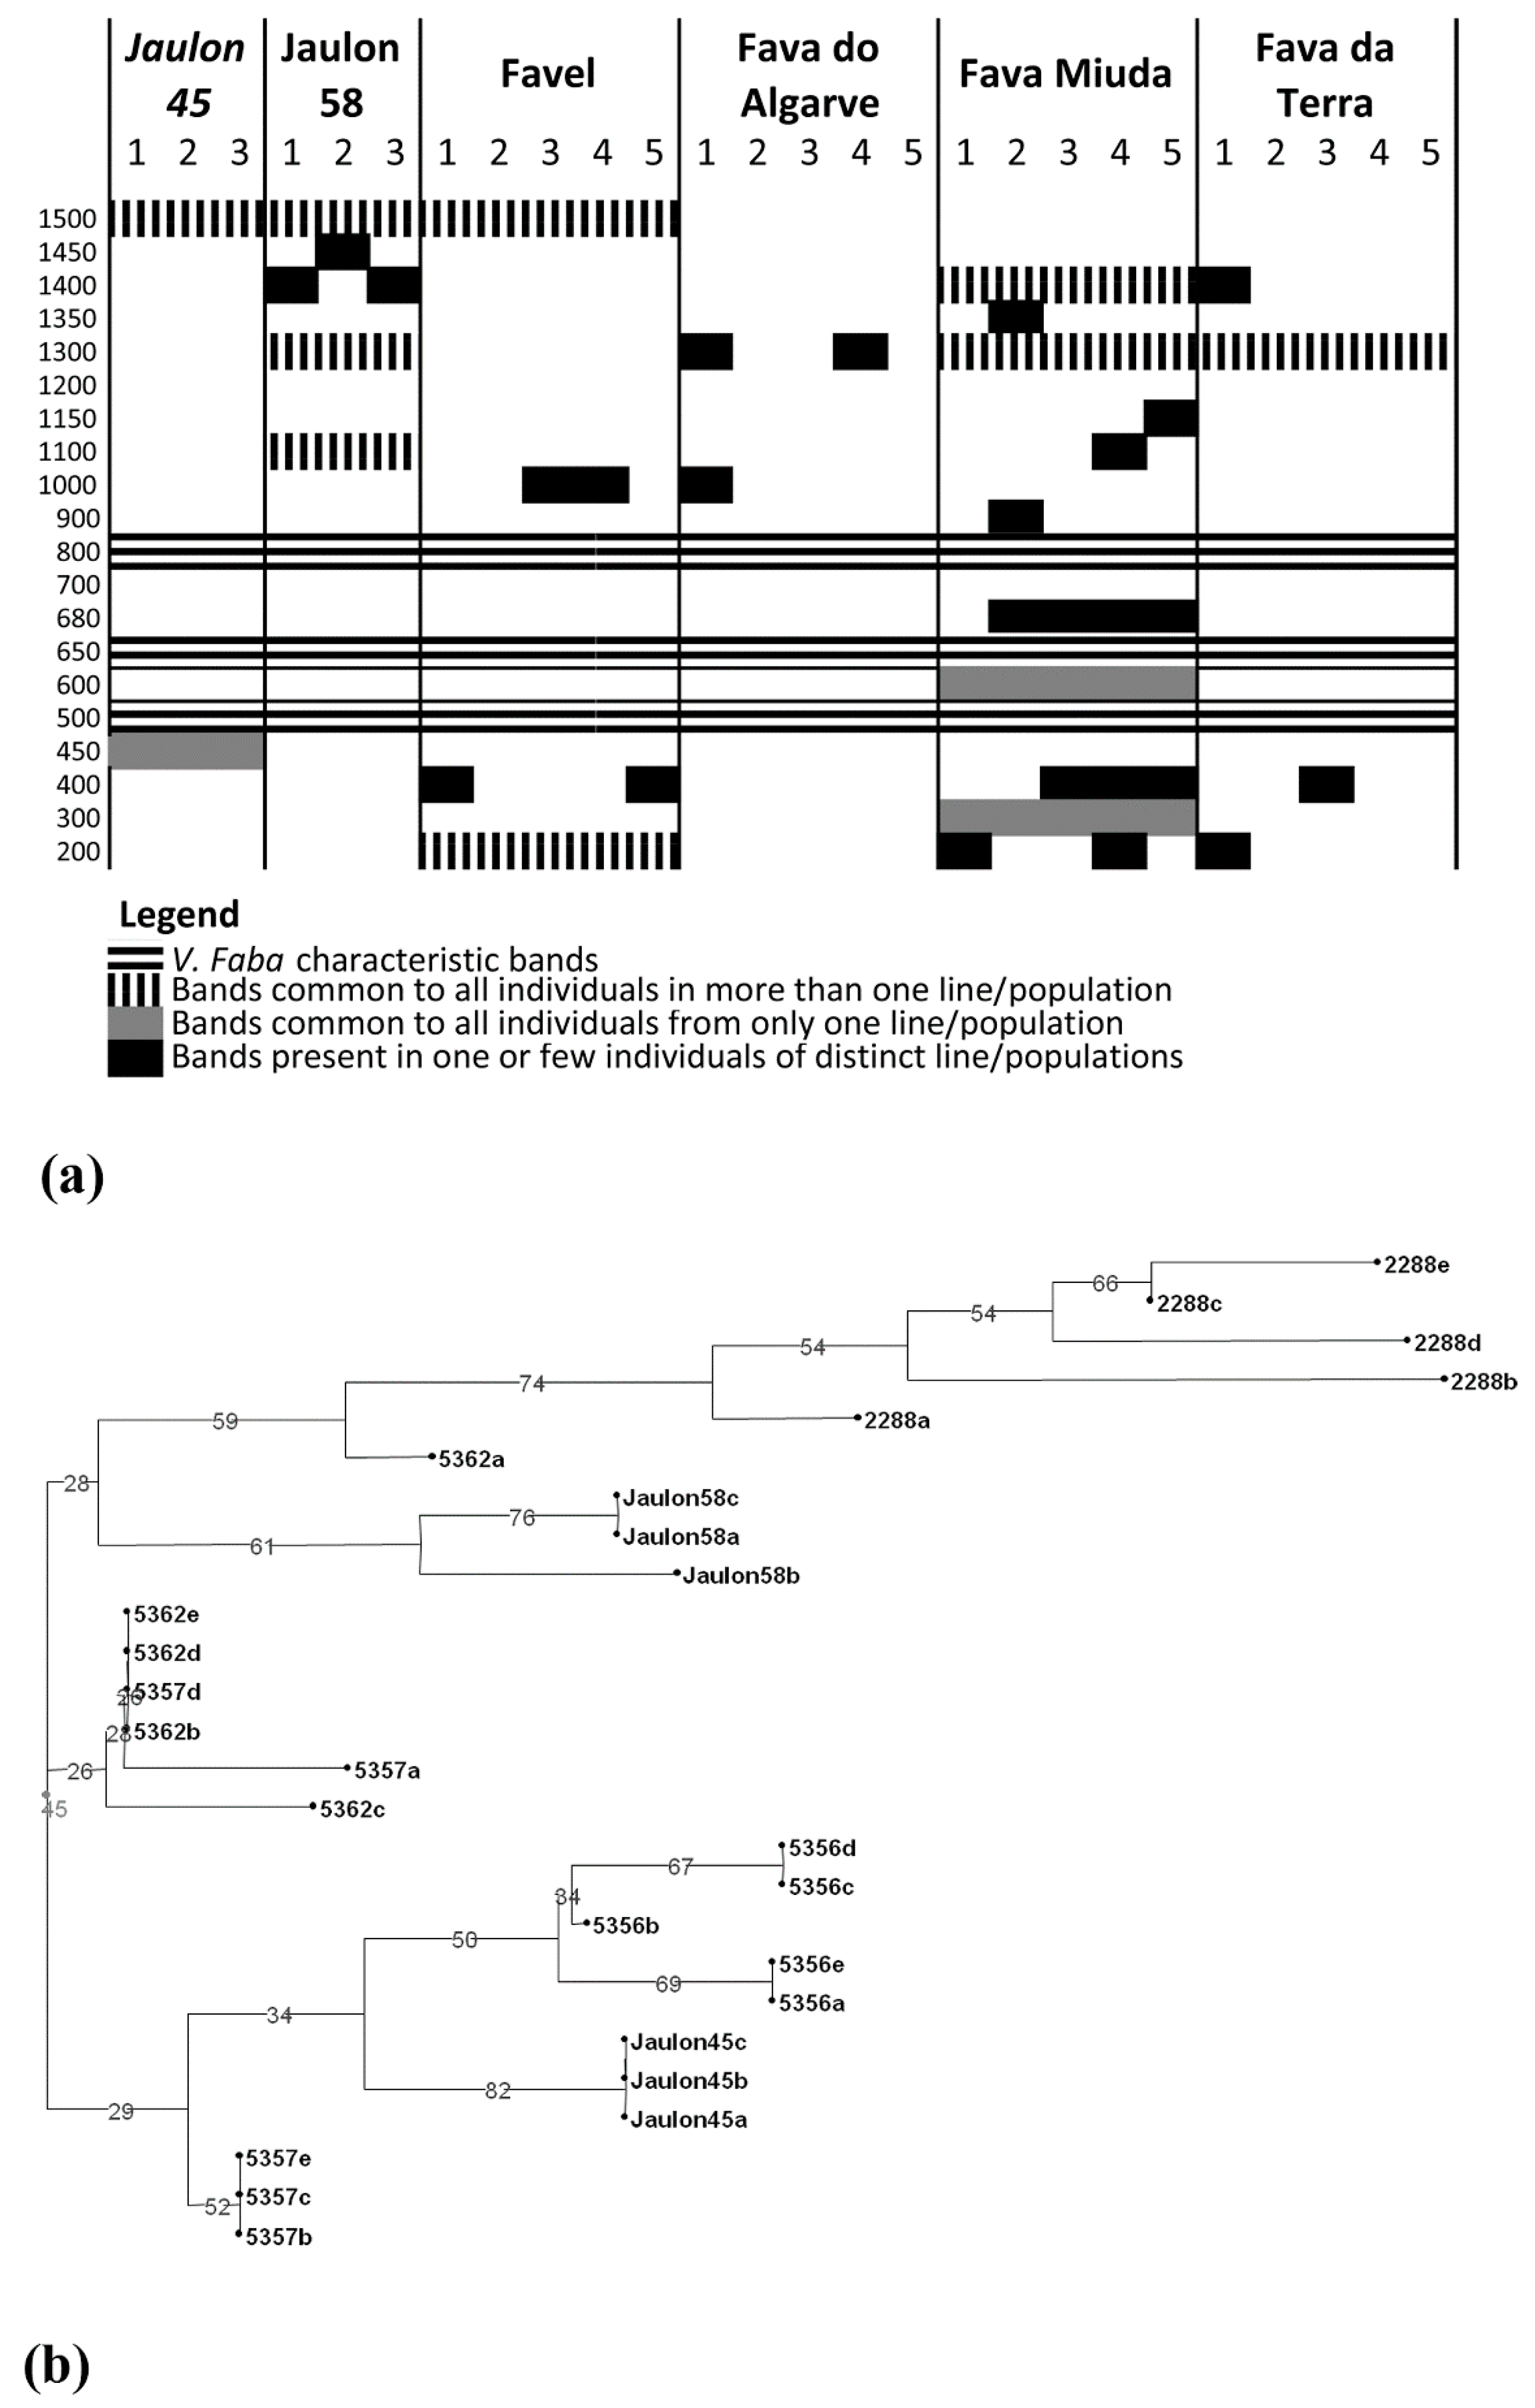
3.1. IRAP Analysis of Genomic Diversity

A total of 26 samples from six faba bean accessions were genotyped. The IRAP profiles were compared using the inbred lines “Jaulon 45” and “Jaulon 58” as control lines. IRAP methodology was used to target three distinct retrotransposable elements: Nikita (identified in barley [39]), Tat-1 [44] and Athila4-6 [45] (the last two from A. thaliana). These retrotransposons have been previously used to study genome diversity in other species besides the ones where they were identified [19,33,34,46]. They were selected to produce consistent banding profiles with easily distinguishable bands allowing the assessment of faba bean genotypes.
IRAP Athila was the most informative marker revealing the highest frequency of polymorphic bands (variable bands between genotypes, see Supplementary Figure S1 for polymorphic frequencies and IRAP images).
The IRAP Athila banding patterns consisted of amplification products with molecular weights varying from 200 bp to 1500 bp (Figure 1 and Figure 2a). All V. faba genotypes were characterized by the presence of three common fragments with 500 bp, 650 bp and 800 bp. This three band-signature will not be addressed in the detailed IRAP profile descriptions that follow.
The banding profiles of “Jaulon 45” control line were identical for all plants analyzed and the line’s specific 450 bp fragment could be revealed. “Jaulon 58” analysis showed one variable band of, either 1400 bp or 1450 bp on the analyzed samples but consistent expression of the remaining three bands, with 1100 bp, 1300 bp, and 1500bp (Figure 1a and Figure 2a). Contrastingly, IRAP banding profiles of V. faba Portuguese populations revealed marked genetic variability. “Fava Do Algarve” is the population depicting the simplest IRAP profiles including three individuals characterized only by the basic three bands-signature and two individuals with variability for bands with 1000 bp and 1300 bp. “Fava da Terra” exhibited variability concerning fragments with 200 bp, 400 bp and 1400 bp and “Favel” revealed variability concerning fragments with 400 bp and 1000 bp (Figure 1b,d and Figure 2a). In addition, “Favel” IRAP profiles show two bands common to all individuals (1500 bp and 200 bp), the former also being characteristic of both control lines (Figure 2a). “Fava Miúda” presents the highest number of scoring fragments (eight to 11 bands) and is the most variable population with different IRAP profiles for each individual (Figure 1c and Figure 2a). Moreover, “Fava Miuda” is the only population with accession-specific fragments (300bp and 600 bp) (Figure 1c and Figure 2a). The higher variability observed for “Fava Miúda” (equina type) relative to “Fava do Algarve” and “Fava da Terra” (both major type) could be related with the reduced self-fertilization described for the equina type in comparison with the major type [47]. However, such an assumption is not supported by the reduced variability observed in the equina type “Favel” (5356), possibly as a result of the breeding process.
The neighbor-joining algorithm applied to the IRAP marker data allowed the construction of a dendrogram (Figure 2b) which shows a clear distribution pattern of V. faba samples. More specifically, the four equina accessions are separated from each other (bootstraps values higher than 50%) forming two distinct groups. One group is composed of the inbred line “Jaulon 45” and the local population “Favel” (5356) while the other group includes the inbred line “Jaulon 58” and the local population “Fava Miuda” (2288). While in “Jaulon 45” all the plants are identical, the same is not observed in “Jaulon 58”, which may suggest insufficient generations of selfing. The analysis also expresses great heterogeneity within the landrace “Fava Miuda” (2288).
Concerning the two major faba bean accessions, the analysis shows that the IRAP markers did not allow the unequivocal separating of the two accessions. Indeed, the group containing “Fava da Terra” (5362) also contains plants of “Fava do Algarve” (5357). Furthermore, a “Fava da Terra” (5362a) plant group with the equina accession 2288 (with a bootstrap value of 74%).
The genetic variability detected within the faba bean accessions studied was also reported for Greek, Sicilian and Tunisian germplasm using Inter-Simple Sequence Repeat (ISSR), Amplified Fragment Length Polymorphism (AFLP) and Sequence Specific Amplified Polymorphism (SSAP) markers [48,49,50]. A large amount of variation within faba bean landraces was also demonstrated using Target Region Amplification Polymorphism (TRAP) [51], probably as a result of high levels of outcrossing as previously suggested [47,48,50,51,52].
The IRAP amplification products obtained from “Fava Do Algarve” plants only characterized by the basic three band-signature were used as probe in in situ hybridization. The technique shows a widespread distribution of FISH signals throughout prophase chromosomes (Figure 3). This result confirms that retrotransposon-related sequences are usually dispersed on plant species with large genomes like V. faba [53] and Triticeae species [54,55] or on plants with median size genomes like O. sativa [53] or Vitis vinifera [29], as opposed to the preferential clustering of retrotransposons in pericentromeric domains observed in plant species with small genomes like Arabidopsis thaliana [56]. The detailed analysis of IRAP Athila FISH labelling reveals signals on DAPI-positive domains with less condensed chromatin as well as on domains with more intense DAPI staining (heterochromatin) (arrowhead in Figure 3b), although some of these heterochromatic domains do not present any FISH labeling (small arrow in Figure 3c). This widespread labeling pattern was also previously observed in the distribution of Ty1-Copia elements in V. faba [20]. Moreover, such distribution of IRAP targeted sequences demonstrate the genome-wide evaluation of genomic variation occurrence between faba bean genotypes evaluated using IRAP Athila. This may account for the extensive diversity unraveled in the present study, emphasizing the relevance of this molecular tool for the characterization of V. faba germplasm.

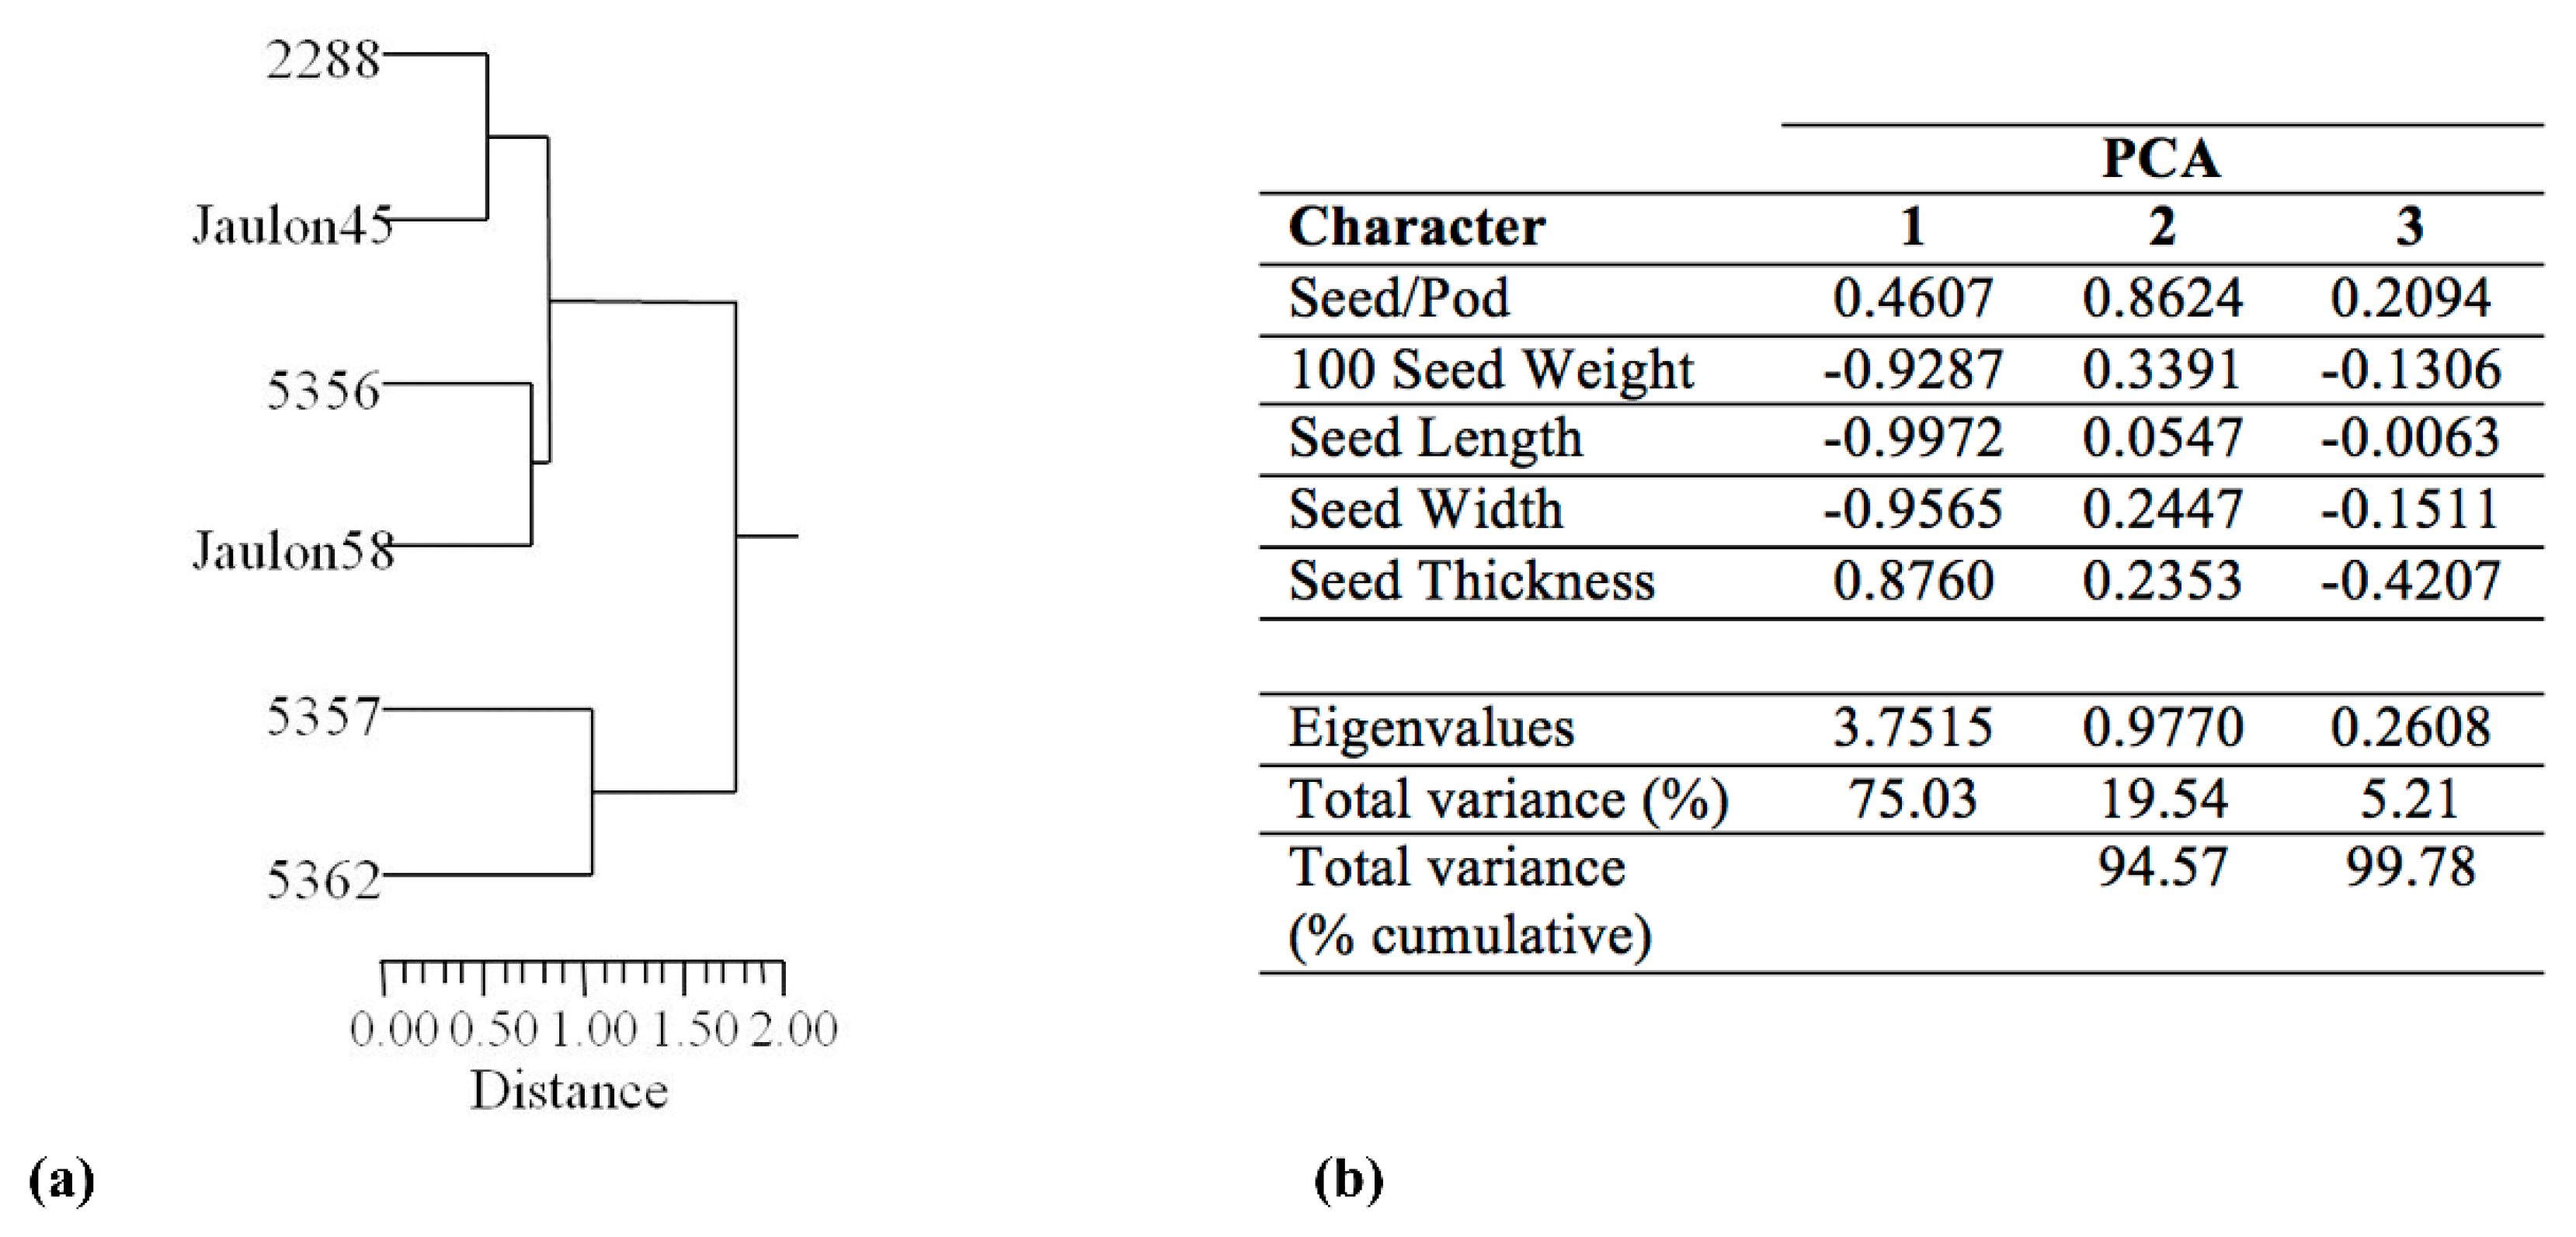
3.2. Seed Morphological Characterization

Faba bean seeds present a broad range of morphological variation on phenotype traits such as size, shape and color, probably as a result of natural and agronomic selection [9]. Since seeds are the main edible parts of faba beans, their weight and dimensions are important traits. In the Iberian Peninsula, large seeds are the most frequent and preferred for human consumption.
In the present study, significant differences and high variability were observed in 100 seed weight, and in length and width traits among accessions from the major and equina types (Table S1). All the accessions were discriminated and the cluster analysis placed major and equina accessions into separated groups (Figure 4a). A PCA was also performed with the original variables. Figure 4b demonstrates the correlation between the first three principal components of this PCA.
The first two principal components explain 94.5% of the total variation with 75% and 19.5% for the 1st and 2nd principal components, respectively. One hundred seed weight, length, width and thickness of the seeds were the traits contributing the most to the first principal component. The number of seeds/pod is the main contributor to the second principal component (Figure 4b). Within the major botanical group, distinct accessions were separated according to the number of seeds per pod. Recently, “Fava Miúda” (2288) and “Favel” (5356) were evaluated for ten morphological characters to estimate the phenotypic diversity, and it was concluded that the 100 seed weight and the plant height were the eigenvectors with the highest positive loading [17]. Thus, our results are in accordance with those of [6] who concluded that 100 seed weight is an important character to discriminate faba bean botanical groups. Moreover, the present analysis of V. faba Portuguese landraces agrees with studies on populations of V. faba major type from three Mediterranean countries [57], which were individualized according with each country’s agroclimatic conditions.
Finally, the degree of correspondence observed between dendrograms based on seed morphologic traits (Figure 4a) and IRAP banding profiles (Figure 2b) must be discussed. The correspondence between quantitative and molecular data on the evaluation of V. faba diversity was also recently confirmed on distinct accessions of a Sicilian major faba bean landrace [48], contrasting therefore with previous reports suggesting no correlation between diversity assessed by molecular tools and morphology traits [25,58]. The importance of IRAP methodology on studies of genetic diversity was already well established for several crops like Avena sativa and A. strigosa [34], H. vulgare [38], P. sativum [27,28], O. sativa [31], V. vinifera [29] and Z. mays [30]. The present study therefore emphasizes the fact that the separation of the faba bean classes extends to more than just morphological seed traits. Thus, the use of IRAP methodology is a valuable complement to the assessment of germplasm diversity and management in V. faba.

4. Conclusions

Faba bean is one of the most important cool-season food legumes with the potential of being a crop able to provide a platform for connecting small scale agriculture with biodiversity tasks such as ecological services [2]. However, the effectiveness of germplasm conservation depends on the available knowledge of the existing genetic diversity [59] since this information is crucial to plan any on farm or ex situ conservation strategies. To our knowledge, this is the first study on the biodiversity of faba bean landraces from different Portuguese agroecological conditions. This study demonstrated that IRAP fingerprints have been used successfully for assessing genetic variability of faba bean and allowed the full discrimination of the equina type. The variability detected within Portuguese accessions is therefore an important factor to consider in future strategies for faba bean germplasm management and conservation, and also to guarantee appropriate breeding approaches for sustainable agriculture.

Supplementary Materials

The following are available online at www.mdpi.com/8/2/8/s1, Figure S1: V. faba IRAP analysis targeting different retrotransposons, Table S1: Values of the seeds morphological characteristics used to characterize V. faba accessions.

Acknowledgments

We are very grateful to Joana Guimarães, Unidade de Investigação de Biotecnologia e Recursos Genéticos-Instituto Nacional de Investigação Agrária e Veterinária (UIBRG-INIAV) for help in statistical analysis. Diana Tomás was funded by a doctoral scholarship (SFRH/BD/93156/2013) by Fundação para a Ciência e a Tecnologia (FCT), Portugal and the research work was financed by the FCT LEAF Unit (UID/AGR/04129/2013).

Author Contributions

Manuela Silva, Maria Manuela Veloso, Diana Tomás and Wanda Viegas designed the project. Laboratory work was performed by Diana Tomás, Manuela Silva, Ana Luisa Dias and Maria Manuela Veloso. Maria José Suso produced the inbred lines. Data was analyzed by Manuela Silva, Maria Manuela Veloso, Diana Tomás and Wanda Viegas. Diana Tomás and Maria Manuela Veloso wrote the manuscript with contributions by Manuela Silva, Maria José Suso, Hugo Rafael Oliveira and Wanda Viegas.

Conflicts of Interest

The authors declare no conflict of interest.

References

  1. Duc, G.; Bao, S.Y.; Baum, M.; Redden, B.; Sadiki, M.; Suso, M.J.; Vishniakova, M.; Zong, X.X. Diversity maintenance and use of Vicia faba L. genetic resources. Field Crops Res. 2010, 115, 270–278. [Google Scholar] [CrossRef]
  2. Suso, M.J.; del Rio, R. A crop-pollinator inter-play approach to assessing seed production patterns in faba bean under two pollination environments. Euphytica 2015, 201, 231–251. [Google Scholar] [CrossRef]
  3. Cubero, J.I. Evolutionary trends in Vicia faba L. Theor. Appl. Genet. 1973, 43, 59–65. [Google Scholar] [CrossRef] [PubMed]
  4. Cubero, J.I. On the evolution of Vicia faba L. Theor. Appl. Genet. 1974, 45, 47–51. [Google Scholar] [CrossRef] [PubMed]
  5. Muratova, V. Common Beans (Vicia faba). Suppl. Bull. Appl. Bot. Genet. Plant Breed 1931, 50, 1–298. [Google Scholar]
  6. Suso, M.J.; Moreno, M.T.; Cubero, J.I. Variation among spanish faba beans cultivars: Taxonomic and evolutionary implications. Genet. Resour. Crop Evol. 1993, 40, 105–111. [Google Scholar] [CrossRef]
  7. European Comission. EIP-Focus Group. Available online: http://ec.europa.eu/eip/agriculture/en/content/genetic-resources-cooperation-models (accessed on 2 November 2015).
  8. Zapata, L.; Peña-Chocarro, L.; Pérez-Jordá, G.; Stika, H.-P. Early neolithic agriculture in the iberian peninsula. J. World Prehist. 2004, 18, 283–325. [Google Scholar] [CrossRef]
  9. Zohary, D.; Hopf, M.; Weiss, E. Domestication of Plants in the Old World: The Origin and Spread of Domesticated Plants in Southwest asia, Europe, and the Mediterranean Basin; OUP Oxford: New York, NY, USA, 2012. [Google Scholar]
  10. Moreira, P.M.R.M.; Veloso, M.M. Landraces inventory for portugal. In European Landraces: On Farm Conservation, Management and Use, 1st ed.; Bioversity Technical Bulletin No. 15; Vetelainen, M., Negri, V., Maxted, N., Eds.; Bioversity International: Rome, Italy, 2009; pp. 124–136. [Google Scholar]
  11. GPPAA. Crop Production Year Book, 1st ed.; Castel Publicações: Lisbon, Portugal, 2005; p. 252. [Google Scholar]
  12. INE. Estatísticas Agrícolas 2012, 1st ed.; Instituto Nacional de Estatística, IP: Lisbon, Portugal, 2013; p. 178. (In Portuguese) [Google Scholar]
  13. GPP. Year Book of Agriculture 2014, 1st ed.; Enigma Previsível: Algés, Portugal, 2014; p. 158. (In Portuguese) [Google Scholar]
  14. INE. Estatísticas Agrícolas 2013., 1st ed.; Instituto Nacional de Estatística, IP: Lisbon, Portugal, 2014; p. 166. (In Portuguese) [Google Scholar]
  15. Khoury, C.K. Global Strategy for the Ex Situ Conservation of Faba Bean (Vicia faba L.); Global Crop Diversity Trust: Rome, Italy, 2009; p. 74. [Google Scholar]
  16. Maggioni, L. Regeneration and Safety Duplication of Regionally Prioritized Crop Collections; Global Crop Diversity Trust Technical and Financial Report 2011; Bioversity International: Rome, Italy, 2011; p. 8. [Google Scholar]
  17. Pereira, M.G.; Tavares de Sousa, M.M.; Meneses, M.; Suso, M.J.; Matos, C.R.; Veloso, M.M. Regeneration and Safety Duplication of Faba Bean Prioritized Collection. In Proceedings of the 28th International Horticultural Congress, Lisbon, Portugal, 22–27 August 2010; p. 570.
  18. Vitte, C.; Panaud, O. LTR retrotransposons and flowering plant genome size: Emergence of the increase/decrease model. Cytogenet. Genome Res. 2005, 110, 91–107. [Google Scholar] [CrossRef] [PubMed]
  19. Bento, M.; Tomas, D.; Viegas, W.; Silva, M. Retrotransposons represent the most labile fraction for genomic rearrangements in polyploid plant species. Cytogenet. Genome Res. 2013, 140, 286–294. [Google Scholar] [CrossRef] [PubMed]
  20. Pearce, S.R.; Li, D.; Flavell, A.J.; Harrison, G.; Heslop-Harrison, J.S.; Kumar, A. The Ty1-copia group retrotransposons in Vicia species: Copy number, sequence heterogeneity and chromosomal localisation. Mol. Gen. Genet. 1996, 250, 305–315. [Google Scholar] [PubMed]
  21. Hill, P.; Burford, D.; Martin, D.M.A.; Flavell, A.J. Retrotransposon populations of Vicia species with varying genome size. Mol. Gen. Genom. 2005, 273, 371–381. [Google Scholar] [CrossRef] [PubMed]
  22. Ellis, T.H.N.; Poyser, S.J.; Knox, M.R.; Vershinin, A.V.; Ambrose, M.J. Ty1-copia class retrotransposon insertion site polymorphism for linkage and diversity analysis in pea. Mol. Gen. Genet. 1998, 260, 9–19. [Google Scholar] [CrossRef] [PubMed]
  23. Galasso, I.; Harrison, G.E.; Pignone, D.; Brandes, A.; HeslopHarrison, J.S. The distribution and organization of Ty1-copia-like retrotransposable elements in the genome of Vigna unguiculata (L.) Walp. (cowpea) and its relatives. Ann. Bot. 1997, 80, 327–333. [Google Scholar] [CrossRef]
  24. Porceddu, A.; Albertini, E.; Barcaccia, G.; Marconi, G.; Bertoli, F.B.; Veronesi, F. Development of S-SAP markers based on an LTR-like sequence from Medicago sativa L. Mol. Gen. Genom. 2002, 267, 107–114. [Google Scholar] [CrossRef] [PubMed]
  25. Sanz, A.M.; Gonzalez, S.G.; Syed, N.H.; Suso, M.J.; Saldana, C.C.; Flavell, A.J. Genetic diversity analysis in Vicia species using retrotransposon-based SSAP markers. Mol. Genet. Genom. 2007, 278, 433–441. [Google Scholar] [CrossRef] [PubMed]
  26. Kalendar, R.; Flavell, A.J.; Ellis, T.H.N.; Sjakste, T.; Moisy, C.; Schulman, A.H. Analysis of plant diversity with retrotransposon-based molecular markers. Heredity 2011, 106, 520–530. [Google Scholar] [CrossRef] [PubMed]
  27. Smykal, P. Development of an efficient retrotransposon-based fingerprinting method for rapid pea variety identification. J. Appl. Genet. 2006, 47, 221–230. [Google Scholar] [CrossRef] [PubMed]
  28. Smykal, P.; Horacek, J.; Dostalova, R.; Hybl, M. Variety discrimination in pea (Pisum sativum L.) by molecular, biochemical and morphological markers. J. Appl. Genet. 2008, 49, 155–166. [Google Scholar] [CrossRef] [PubMed]
  29. Pereira, H.S.; Barao, A.; Delgado, M.; Morais-Cecilio, L.; Viegas, W. Genomic analysis of grapevine retrotransposon 1 (Gret1) in Vitis vinifera. Theor. Appl. Genet. 2005, 111, 871–878. [Google Scholar] [CrossRef] [PubMed]
  30. Kuhn, B.C.; Lopez-Ribera, I.; Machado, M.D.P.D.; Vicient, C.M. Genetic diversity of maize germplasm assessed by retrotransposon-based markers. Electrophoresis 2014, 35, 1921–1927. [Google Scholar] [CrossRef] [PubMed]
  31. Branco, C.J.S.; Vieira, E.A.; Malone, G.; Kopp, M.M.; Malone, E.; Bernardes, A.; Mistura, C.C.; Carvalho, F.I.F.; Oliveira, C.A. IRAP and REMAP assessments of genetic similarity in rice. J. Appl. Genet. 2007, 48, 107–113. [Google Scholar] [CrossRef] [PubMed]
  32. Bento, M.; Gustafson, J.P.; Viegas, W.; Silva, M. Size matters in triticeae polyploids: Larger genomes have higher remodeling. Genome 2011, 54, 175–183. [Google Scholar] [PubMed]
  33. Bento, M.; Gustafson, P.; Viegas, W.; Silva, M. Genome merger: From sequence rearrangements in triticale to their elimination in wheat-rye addition lines. Theor. Appl. Genet. 2010, 121, 489–497. [Google Scholar] [CrossRef] [PubMed]
  34. Tomás, D.; Rodrigues, J.; Varela, A.; Veloso, M.M.; Viegas, W.; Silva, M. Use of repetitive sequences for molecular and cytogenetic characterization of Avena species from Portugal. Int. J. Mol. Sci. 2016, 17, 203. [Google Scholar] [CrossRef] [PubMed]
  35. Bento, M.; Tomas, D.; Viegas, W.; Silva, M. Unravelling genome dynamics in Arabidopsis synthetic auto and allopolyploid species. Biol. Plantarum. 2015, 59, 661–670. [Google Scholar] [CrossRef]
  36. Terzopoulos, P.J.; Kaltsikes, P.J.; Bebeli, P.J. Determining the sources of heterogeneity in greek faba bean local populations. Field Crops Res. 2008, 105, 124–130. [Google Scholar] [CrossRef]
  37. Doyle, J.J. A rapid DNA isolation procedure for small quantities of fresh leaf tissue. Phytochem. Bull. 1987, 19, 11–15. [Google Scholar]
  38. Kalendar, R.; Grob, T.; Regina, M.; Suoniemi, A.; Schulman, A. IRAP and REMAP: Two new retrotransposon-based DNA fingerprinting techniques. Theor. Appl. Genet. 1999, 98, 704–711. [Google Scholar] [CrossRef]
  39. Leigh, L.; Kalendar, R.; Lea, V.; Lee, D.; Donini, P.; Schulman, A.H. Comparison of the utility of barley retrotransposon families for genetic analysis by molecular marker techniques. Mol. Gen. Genomics 2003, 269, 464–474. [Google Scholar] [CrossRef] [PubMed]
  40. Perrier, X.; Jacquemoud-Collet, J.P. Darwin Software, CIRAD: Montpellier, France, 2006.
  41. Felsenstein, J. Confidence limits on phylogenies: An approach using the bootstrap. Evolution 1985, 39, 783–791. [Google Scholar] [CrossRef]
  42. Tomás, D.; Brazao, J.; Viegas, W.; Silva, M. Differential effects of high-temperature stress on nuclear topology and transcription of repetitive noncoding and coding rye sequences. Cytogenet. Genome Res. 2013, 139, 119–127. [Google Scholar] [CrossRef] [PubMed]
  43. Rohlf, F.J. Ntsys-pc: Numerical taxonomy and multivariate analysis system, version 2.1—Getting started guide. 2000. [Google Scholar]
  44. Wright, D.A.; Voytas, D.F. Potential retroviruses in plants: Tat1 is related to a group of Arabidopsis thaliana Ty3/gypsy retrotransposons that encode envelope-like proteins. Genetics 1998, 149, 703–715. [Google Scholar] [PubMed]
  45. Wright, D.A.; Voytas, D.F. Athila 4 of Arabidopsis and calypso of soybean define a lineage of endogenous plant retroviruses. Genome Res. 2002, 12, 122–131. [Google Scholar] [CrossRef] [PubMed]
  46. Bento, M.; Pereira, S.; Rocheta, M.; Gustafson, P.; Viegas, W.; Silva, M. Polyploidization as a retraction force in plant genome evolution: Sequence rearrangements in triticale. PLoS ONE 2008, 3, e1402. [Google Scholar] [CrossRef] [PubMed]
  47. Nadal, S.; Suso, M.J.; Moreno, M.T. Management of Vicia faba genetic resources: Changes associated to the selfing process in the major, equina and minor groups. Genet. Resour. Crop Evol. 2003, 50, 183–192. [Google Scholar] [CrossRef]
  48. Gresta, F.; Avola, G.; Albertini, E.; Raggi, L.; Abbate, V. A study of variability in the sicilian faba bean landrace ‘Larga di Leonforte’. Genet. Resour. Crop Evol. 2010, 57, 523–531. [Google Scholar] [CrossRef]
  49. Ouji, A.; El Bok, S.; Syed, N.H.; Abdellaoui, R.; Rouaissi, M.; Flavell, A.J.; El Gazzah, M. Genetic diversity of faba bean (Vicia faba L.) populations revealed by sequence specific amplified polymorphism (SSAP) markers. Afr. J. Biotechnol. 2012, 11, 2162–2168. [Google Scholar]
  50. Terzopoulos, P.J.; Bebeli, P.J. Genetic diversity analysis of mediterranean faba bean (Vicia faba L.) with ISSR markers. Field Crops Res. 2008, 108, 39–44. [Google Scholar] [CrossRef]
  51. Kwon, S.J.; Hu, J.G.; Coyne, C.J. Genetic diversity and relationship among faba bean (Vicia faba L.) germplasm entries as revealed by TRAP markers. Plant Genet. Resour.-Charact. Util. 2010, 8, 204–213. [Google Scholar] [CrossRef]
  52. Suso, M.J.; Hunady, I.; Solis, I.; Mondragão-Rodrigues, F.; Winkler, J. Germplasm management of Vicia faba L.: Comparative study of the mating system of local and common cultivars growing under different agro-ecological conditions. Plant Genet. Resour. Newsl. 2008, 155, 46–51. [Google Scholar]
  53. Kumar, A.; Bennetzen, J.L. Plant retrotransposons. Ann. Rev. Genet. 1999, 33, 479–532. [Google Scholar] [CrossRef] [PubMed]
  54. Choulet, F.; Wicker, T.; Rustenholz, C.; Paux, E.; Salse, J.; Leroy, P.; Schlub, S.; Le Paslier, M.C.; Magdelenat, G.; Gonthier, C.; et al. Megabase level sequencing reveals contrasted organization and evolution patterns of the wheat gene and transposable element spaces. Plant Cell 2010, 22, 1686–1701. [Google Scholar] [CrossRef] [PubMed]
  55. Dvořák, J. Triticeae genome structure and evolution. In Genetics and Genomics of the Triticeae; Muehlbauer, G.J., Feuillet, C., Eds.; Springer: New York, NY, USA, 2009; Volume 7, pp. 685–711. [Google Scholar]
  56. Peterson-Burch, B.D.; Nettleton, D.; Voytas, D.F. Genomic neighborhoods for Arabidopsis retrotransposons: A role for targeted integration in the distribution of the metaviridae. Genome Biol. 2004, 5, R78. [Google Scholar] [CrossRef] [PubMed] [Green Version]
  57. Polignano, G.B.; Zeuli, P.L.S. Variation and covariation in Vicia faba L. populations of mediterranean origins. Euphytica 1985, 34, 659–668. [Google Scholar] [CrossRef]
  58. Zeid, M.; Schon, C.C.; Link, W. Genetic diversity in recent elite faba bean lines using AFLP markers. Theor. Appl. Genet. 2003, 107, 1304–1314. [Google Scholar] [CrossRef] [PubMed]
  59. Negri, V. Landraces in central italy: Where and why they are conserved and perspectives for their on-farm conservation. Genet. Resour. Crop Evol. 2003, 50, 871–885. [Google Scholar] [CrossRef]
Figure 1. V. faba IRAP banding profiles obtained with Athila4-6 retrotransposon LTR primer. (a) inbred lines “Jaulon 45” and “Jaulon 58”; (b) “Fava Do Algarve” (5357) and “Favel” (5356); (c) “Fava Miúda” (2288); and (d) “Fava da Terra” (5362). For control purposes, “Jaulon 45” and “Jaulon 58” were used as comparative profiles in each experiment.
Diversity 08 00008 g001
Figure 2. (a) schematic representation of V. faba IRAP banding profiles obtained with Athila4-6 retrotransposon LTR primer; (b) neighbor-joining tree of 26 Vicia faba individuals based on IRAP analysis with Athila4-6 retrotransposon LTR primer. Numbers at the branches correspond to bootstrap values (%) out of 10,000 replications.
Diversity 08 00008 g002
Figure 3. Meristematic root-tip prophase cells from V. faba (“Fava Do Algarve”, plant 2). (a) DAPI counterstaining (blue); (b) FISH using IRAP Athila amplification product marked with biotin and detected with streptavidin Cy3 conjugated (red); (c) FISH signals and DAPI superimposed. In (b), the arrow indicates FISH labels with two signals on both chromatids and the arrowhead indicates a DAPI-condensed domain marked with IRAP FISH signal. In (b) and (c), the black arrowhead indicates a DAPI-condensed domain negative for IRAP FISH signal.
Diversity 08 00008 g003
Figure 4. (a) dendrogram from cluster analysis of faba bean accessions using UPGMA based on seeds morphological characteristics. The matrix correlation coefficient is 94.6. All of the accessions were discriminated. Two main groups were identified: V. faba equina type including “Fava Miúda” (2288), “Jaulon 45”, “Favel” (5356) and “Jaulon 58” and V. faba major type composed by “Fava Do Algarve” (5357) and “Fava da Terra” (5362); (b) eigenvalues and total variance (%) that describe the variation of the five morphological characters analyzed.
Diversity 08 00008 g004
Table 1. V. faba accessions representing the two botanical groups.
Population Common Name/Accession NumberOrigin/PedigreeBotanical Group
“Fava Miuda”/2288Madeira Island (Portugal)/locally adapted populationEquina
“Fava da Terra”/5362Azores Island (Portugal)/locally adapted populationMajor
“Fava Do Algarve”/5357Algarve (Portugal)/locally adapted populationMajor
“Favel”/5356Elvas (Portugal)/locally adapted populationEquina
“Jaulon 45”CSIC (Spain)/Inbred lineEquina
“Jaulon 58”CSIC (Spain)/Inbred lineEquina

