Article

DNA-Based Identification and Chemical Characteristics of Hypnea musciformis from Coastal Sites in Ghana

by
Marcel Tutor Ale
1,*,
Kristian Barrett
1,
Gloria Naa Dzama Addico
2,
Nanna Rhein-Knudsen
1,
Amoako Atta DeGraft-Johnson
2 and
Anne S. Meyer
1
1
Center for Bioprocess Engineering, Department of Chemical and Biochemical Engineering, Technical University of Denmark (DTU), Søltofts Plads, Building 229, DK-2800 Lyngby, Denmark
2
CSIR Water Research Institute, P.O. Box M. 32, Accra, Ghana
*
Author to whom correspondence should be addressed.
Diversity 2016, 8(2), 14; https://doi.org/10.3390/d8020014
Submission received: 7 April 2016 / Revised: 13 June 2016 / Accepted: 15 June 2016 / Published: 20 June 2016

Abstract

:
This work reveals new, important insights about the influence of broad spatial variations on the phylogenetic relationship and chemical characteristics of Ghanaian Hypnea musciformis—a carrageenan-containing red seaweed. DNA barcoding techniques alleviate the difficulty for accurate morphological identification. COI barcode sequences of the Ghanaian H. musciformis showed <0.7% intraspecies divergence, indicating no distinct phylogenetic variation, suggesting that they actually belong to the same species. Thus, the spatial distribution of the sampling sites along the coast of Ghana did not influence the phylogenetic characteristics of H. musciformis in the region. The data also showed that the Ghanaian Hypnea sp. examined in this work should be regarded as the same species as the H. musciformis collected in Brazilian Sao Paulo (KP725276) with only 0.8%–1.3% intraspecies divergence. However, the comparison of COI sequences of Ghanaian H. musciformis with the available COI sequence of H. musciformis from other countries showed intraspecies divergences of 0%–6.9% indicating that the COI sequences for H. musciformis in the GenBank may include different subspecies. Although samples did not differ phylogenetically, the chemical characteristics of the H. musciformis differed significantly between different sampling locations in Ghana. The levels of the monosaccharides, notably galactose (20%–30% dw) and glucose (10%–18% dw), as well as the seawater inorganic salt concentration (21–32 mg/L) and ash content (19%–33% dw), varied between H. musciformis collected at different coastal locations in Ghana. The current work demonstrated that DNA-based identification allowed a detailed understanding of H. musciformis phylogenetic characteristics and revealed that chemical compositional differences of H. musciformis occur along the Ghanaian coast which are not coupled with genetic variations among those samples.

Graphical Abstract

1. Introduction

For centuries, taxonomists have identified seaweed species through examination of their visual appearance and morphological characteristics, and these methods are still commonly used today [1,2]. Algal diversity in Ghana has previously been taxonomically catalogued by Lawson and Price (1969), together with seaweed species from other sites along the western coast of tropical Africa [3]. Hypnea musciformis (Wulfen) J.V.Lamouroux (H. musciformis), of class of Rhodophyta and of the family Cystocloniaceae, is found abundantly throughout the year in many coastal areas of Ghana [4]. This specie contains a commercially important hydrocolloid, carrageenan, which possesses unique gelling characteristics that can be used in various food, industrial, and medical applications [5,6]. The carrageenan is made up of repeating units of galactose and 3,6 anhydrogalactose [6].
The morphological features and chemical characteristics of H. musciformis, including the yield and physical properties of carrageenan, are vulnerable to changes in response to environmental conditions, and temporally, as well [7,8]. Spatial variations can trigger acclimatization responses in seaweed that relate to habitat physico-chemical changes [7]. Hence, closely-related species of seaweed, can be difficult to differentiate because their morphological attributes, are affected by environmental conditions (i.e., salinity and nutrient limitations) and life cycle stage [9]. The traditional system for taxonomic classification of red seaweeds is limited by the fact that it is largely based on the seaweed’s female reproductive anatomy and post-fertilization events [10]. Hence, morphological features may only be visible within a particular life stage or gender, which can make indisputable determination of red seaweed species impossible, even for experts [10,11]. Moreover, the changes in the coastal ecosystem in which the seaweed grows, influenced by spatial, seasonal, and temporal variations can have a large impact on its morphological characteristics due to phenotypic plasticity—the ability of one genotype to produce more than one phenotype when exposed to different environments [12]. Thus, samples with high phenotypic plasticity may have a greater risk of being misidentified.
In more recent developments, marine bio-diversity studies have shown the potential of DNA-based identification methods (e.g., using DNA barcodes) to allow greater discrimination among cryptic seaweed species than traditional taxonomic methods [13,14,15]. DNA barcoding by amplification and sequencing of short specific genetic markers can be used to obtain molecular information from an organism to identify its species. The application of DNA barcoding to the identification of seaweed species has been reported to be less successful than for other organisms, due to insufficient phylogenetic information compared to animals, microbes, and terrestrial plants [16]. Nevertheless, the use of DNA barcodes in seaweed studies is becoming increasingly common [17]. Different DNA barcode sequences have been proposed to assist in traditional red seaweed classification, notably sequence comparisons of the following markers: LSU sequences from the nuclear 28 S rRNA gene [18]; a UPA (universal plastids amplicon) subunit of the 23 S rRNA gene [19]; a ITS (internal transcribed spacer) from a nuclear ribosomal internal transcribed spacer [20] and a 660 base-long mitochondrial gene cytochrome oxidase I (COI) primer sequence [9].
DNA-based identification methods require successful DNA extraction and amplification, which has been widely reported to be difficult for seaweed biomass, due to co-isolation of hydrocolloids and polyphenols [21]. Phenolic compounds bind firmly to DNA during DNA extraction and interfere with subsequent reactions, including during PCR amplification. The DNA extraction can be performed using the benzyl chloride method or the phenol/chloroform method [22,23]. Less hazardous chemicals and a more standardized procedure can be employed using DNA extraction kits, such as the DNeasy Plant kit and PowerPlant Pro DNA Isolation kit [16,24].
In this work, we investigated whether the spatial distribution of seaweeds along the coast of Ghana (~540 km) is extreme enough to have an impact on the molecular identity or chemical characteristics of H. musciformis. We evaluated two commercial DNA extraction kits and a set of DNA barcodes (LSU, COI, and UPA) regarding the quantity of phylogenetic information obtained and success rate in discriminating phenotypic variations. Furthermore, we investigated the effect of spatial variations on inorganic salt and monosaccharide compositions of Hypnea sp. from different coastal sampling sites in Ghana.

2. Materials and Methods

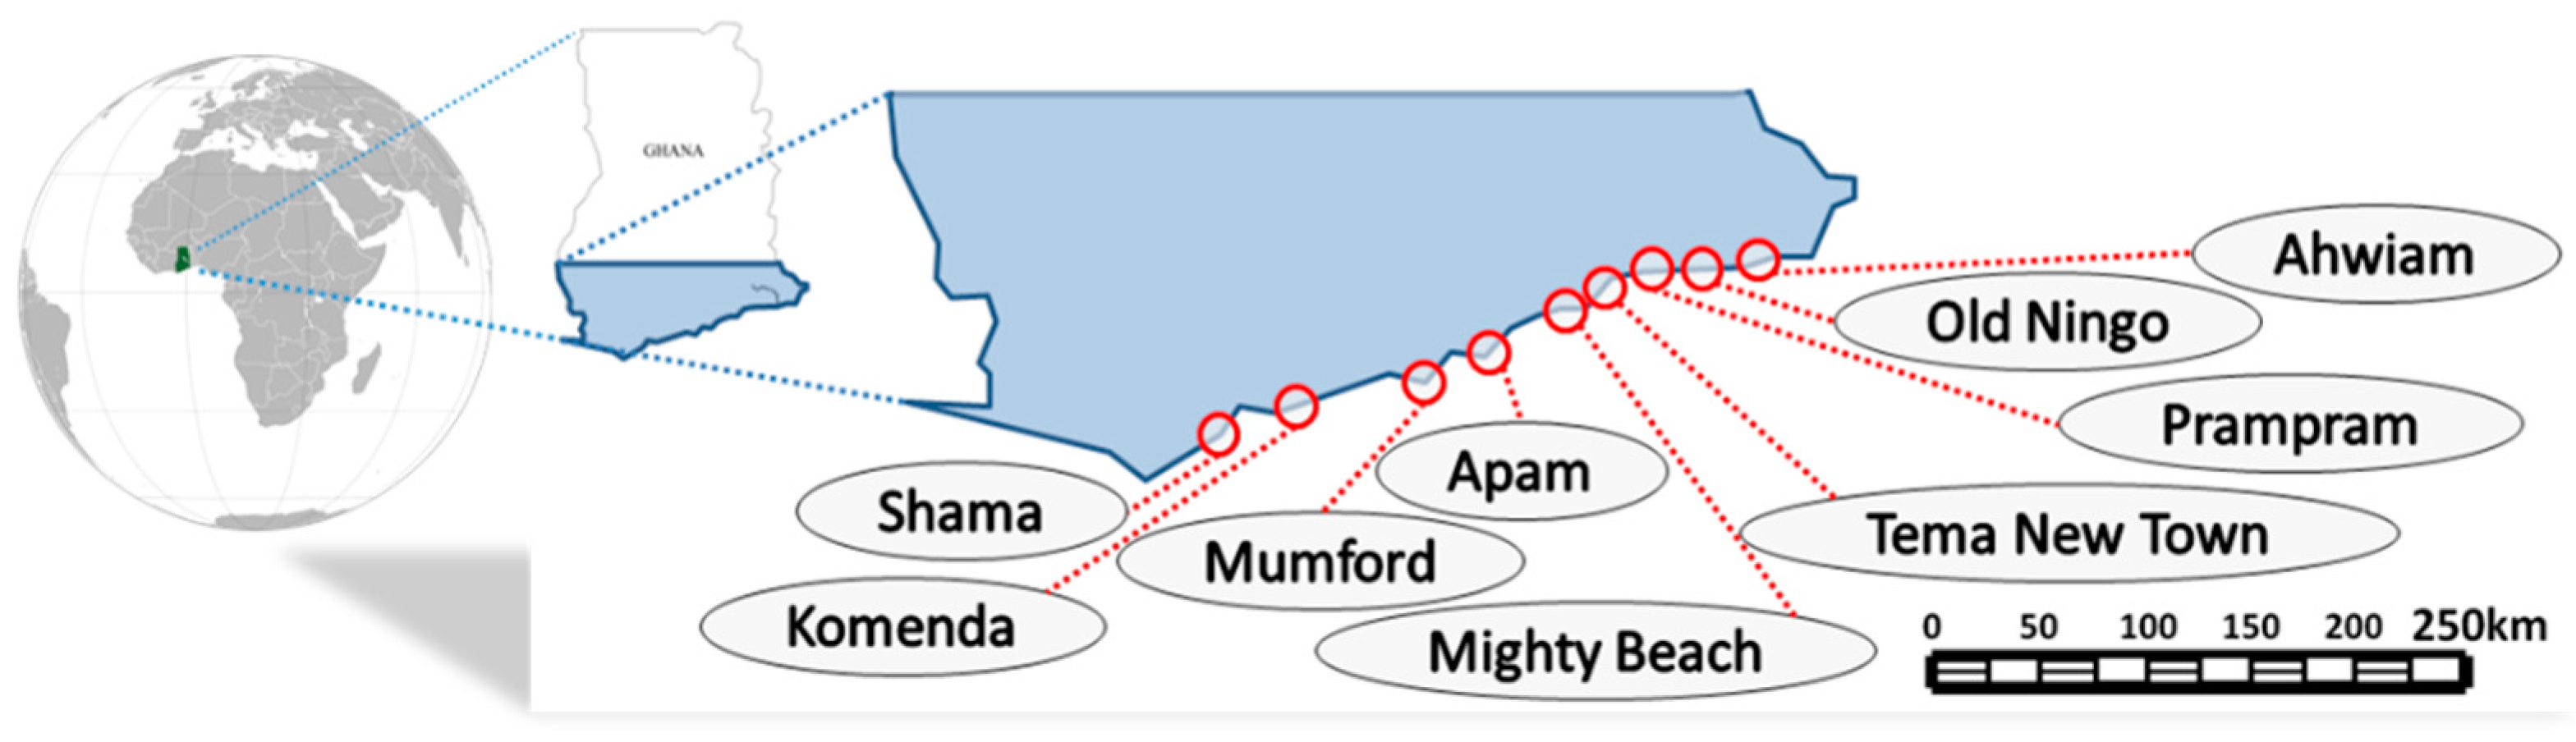
2.1. Seaweed Sampling and Preparation

Each seaweed sample represented a pool of H. musciformis collected during low tides on Ghanaian shores in January 2015 (Figure 1) and taxonomically classified based on their morphological features by an experienced marine taxonomist to benchmark samples taxa. Coastal sites were selected according to regional distribution: Accra region: Mighty Beach (MB), Tema New Town (TNT), Ahwiam (AH), Old Ningo (ON) and Prampram (PRM); Central region: Komenda (KO), Apam (AP), Mumford (MU); and Western region: Shama (SH) (Figure 1). Using rubber gloves, individually handpicked seaweed specimens from the shore were placed into polyethylene zip bags, and then transferred into a thermos-insulated box filled with ice cubes. Seaweed was prepared according to Francavilla et al. (2013) [25] briefly, seaweed samples were rinsed with distilled water several times to remove seawater and sediments, including epiphytes, ropes, and small marine animals. All seaweed samples intended for DNA extraction were frozen to −20 °C prior to use, while the remaining samples were dried in an oven at 105 °C for 24 h, then milled into small particles for further analysis [26].

2.2. DNA Extractions and Barcodes

Seaweed samples for DNA analysis were thawed and thereafter treated with liquid nitrogen and then crushed using mortar and pestle prior to DNA extraction. Two DNA extraction procedures were performed according to the manufacturers’ protocols: DNeasy Plant Mini Kit (Qiagen, Hilden, Germany) and Power Plant Pro DNA Isolation Kit (MoBio, Carlsbad, CA, USA). Three DNA markers were employed for sequence acquisition: the nuclear D6/D7 region of the large ribosomal subunit (LSU, 598 bases) 28S rRNA gene [18], Universal plastid amplicon (UPA, 410 bases), domain V of 23S rRNA [19], and mitochondrial marker cytochrome oxidase (COI, 650 bases) subunit 1 gene region [9].

2.3. PCR Amplification of DNA Barcodes

Previously reported primer sets were used for PCR amplifications: LSU: nu28Sf and nu28Sr [1]; UPA: p23SrV_f1 and p23SrV_r1 [19], and GazF1 and GazR1 for COI [9]. Each DNA sample (1 µL) was used as a template in a Phusion PCR reaction: master mix (49 µL) containing 10 µM of reverse and forward primers for LSU, UPA and COI; 5X HF buffer (includes 7.5 mM MgCl2), 200 µM dNTPs and 2 U/µL Phusion DNA polymerase (Thermo Fisher Scientific, Waltham, MA, USA). For the PCR employing DreamTaq polymerase the following was used: master mix (49 µL) containing 10 µM of reverse and forward primers for LSU, UPA and COI, 10X DreamTaq buffer (includes 20 mM MgCl2), 200 µM dNTPs and 5 U/µL DreamTaq DNA polymerase (Thermo Fisher Scientific). PCR amplification was carried out on a TECHNE TC-3000X thermal cycler (Techne Inc., Burlington, NJ, USA) in a reaction mixture of 50 µL following the manufacturer’s protocol for Phusion and DreamTaq polymerase (Thermo Fisher Scientific). The annealing temperature was 50 °C for COI and 55 °C for both LSU and UPA [9].

2.4. DNA Purification and Sequencing

Amplified DNA products were loaded into a 1% agarose gel and purified using illustra GFX PCR DNA and a gel Band Purification Kit (GE Healthcare A/S, Brøndby, Denmark) following the manufacturer’s procedure. A Synergy 2 Multi-mode Microplate reader by BioTek Synergy HT (Biotek Instruments Inc, Swindon, UK) was used for determination of the DNA concentration prior to sequencing. Sequencing was carried out by Macrogen (Amsterdam, The Netherlands) using the primers listed above with final concentrations of 2.5 mM primers and 25 ng/µL PCR product according to the manufacturer’s procedure.

2.5. Phylogenetic and Bioinformatics Analysis

The sequence chromatograms of the obtained sequences were inspected for irregularity in the beginning of the sequence (the first 50 bases of sequence is often low quality), and the sequences from the reverse direction were reverse complemented using Mega6 [27]. Downloaded sequences from GenBank: HQ421909 (LSU), KP725300 (UPA), and KP725276 (COI), and the complete list of surveyed accessions for which at least one sequence was obtained were used to calculate the sequencing success percentage for each marker. A successful sequencing should consist of available sequence accessions that align with the relevant GenBank sequence from at least one of the three markers [1]. Phylogenetic analysis was conducted for each DNA sequence, and a multiple alignment was created via the Clustal W alignment tool [28]. Individual barcode sequences were aligned with relevant target sequences from the NCBI GenBank database, using a NCBI BLAST alignment search. The GenBank accession number of the best match, based on identity followed by score, was obtained and reported as best match (with a query coverage cut-off at 95% of the truncated barcode) [29]. Multiple alignments results were calculated for within- and between-species divergence values in a single genus using MegAlign software (DNAStar Lasergene 12, Madison, WI, USA). The individual divergences between all sequences in a multiple alignment were used to construct a plot using the Multidimensional Scaling option in the excel extension package XLSTAT, 2016. A phylogenic tree was constructed in Mega6.0 [27] using the maximum likelihood (ML) method based on the Kimura 2 parameter model [30]. The reliability of branches was evaluated with non-parametric bootstrapping (100 replicates). All positions with less than 95% site coverage were eliminated (complete deletion option). Fewer than 5% alignment gaps, missing data and ambiguous bases were allowed at any position. Additional sequences of LSU, UPA and COI of the relevant seaweed species were downloaded from GenBank (www.ncbi.com).

2.6. Chemicals and HPAEC for Monosaccharide Analysis

The amount of dry matter and ash in the seaweed samples were determined according to the National Renewable Energy Laboratory (NREL) procedures and the weight of biomass used in the experiments was mathematically corrected for the amount of moisture present in the samples [31]. Determination of Na, K, Ca and Mg was performed using the method outlined by Novosarnsky et al. [32]. Methods for chemical analyses were according to the protocol of Standard Methods for the Examination of Water and Wastewater (APHA [33]). Dried, ground H. musciformis was hydrolyzed using two-step sulfuric acid hydrolysis at 72% and 4% (w/w), according to the method of the US National Renewable Energy Laboratory with minor modifications [31]. Briefly, a seaweed sample was hydrolyzed with 72% H2SO4 in a 30 ± 3 °C water bath for 60 min, then the mixture was diluted up to 4% H2SO4 and subjected to 121 ± 3 °C autoclave for 40 min [34]. After acid hydrolysis, the hydrolysate was collected by vacuum filtration using #4 crucibles (Schott, Duran, Wertheim, Germany). Each supernatant was filtered using a 0.2 µm syringe tip filter (Sun-Sri, Rockwood, TN, USA) prior to injection for monosaccharide analysis on HPAEC-PAD. The separation and quantification of monosaccharides by HPAEC-PAD were performed using an ICS-3000 system according to the method described by Ale et al. 2011 [35]. Data quantification was carried-out using Chromeleon 7.2.1 (Thermo Scientific Dionex, Sunnyvale, CA, USA). Recovery values of the monosaccharides were estimated from parallel runs.

2.7. Statistical Analysis

Chemicals and monosaccharides were analyzed in triplicates (i.e., each analysis included full analytical runs of three different samples) of the pooled H. musciformis sample from each sampling site. Tabulation of data, graphs, and calculation of mean and standard deviations were done using Excel (Microsoft Office Professional Plus 2013). Analysis of variance was performed using Tukey’s 95% simultaneous confidence intervals at a p value of 0.05 by Minitab 15. (Minitab Inc., State College, PA, USA).

3. Results and Discussion

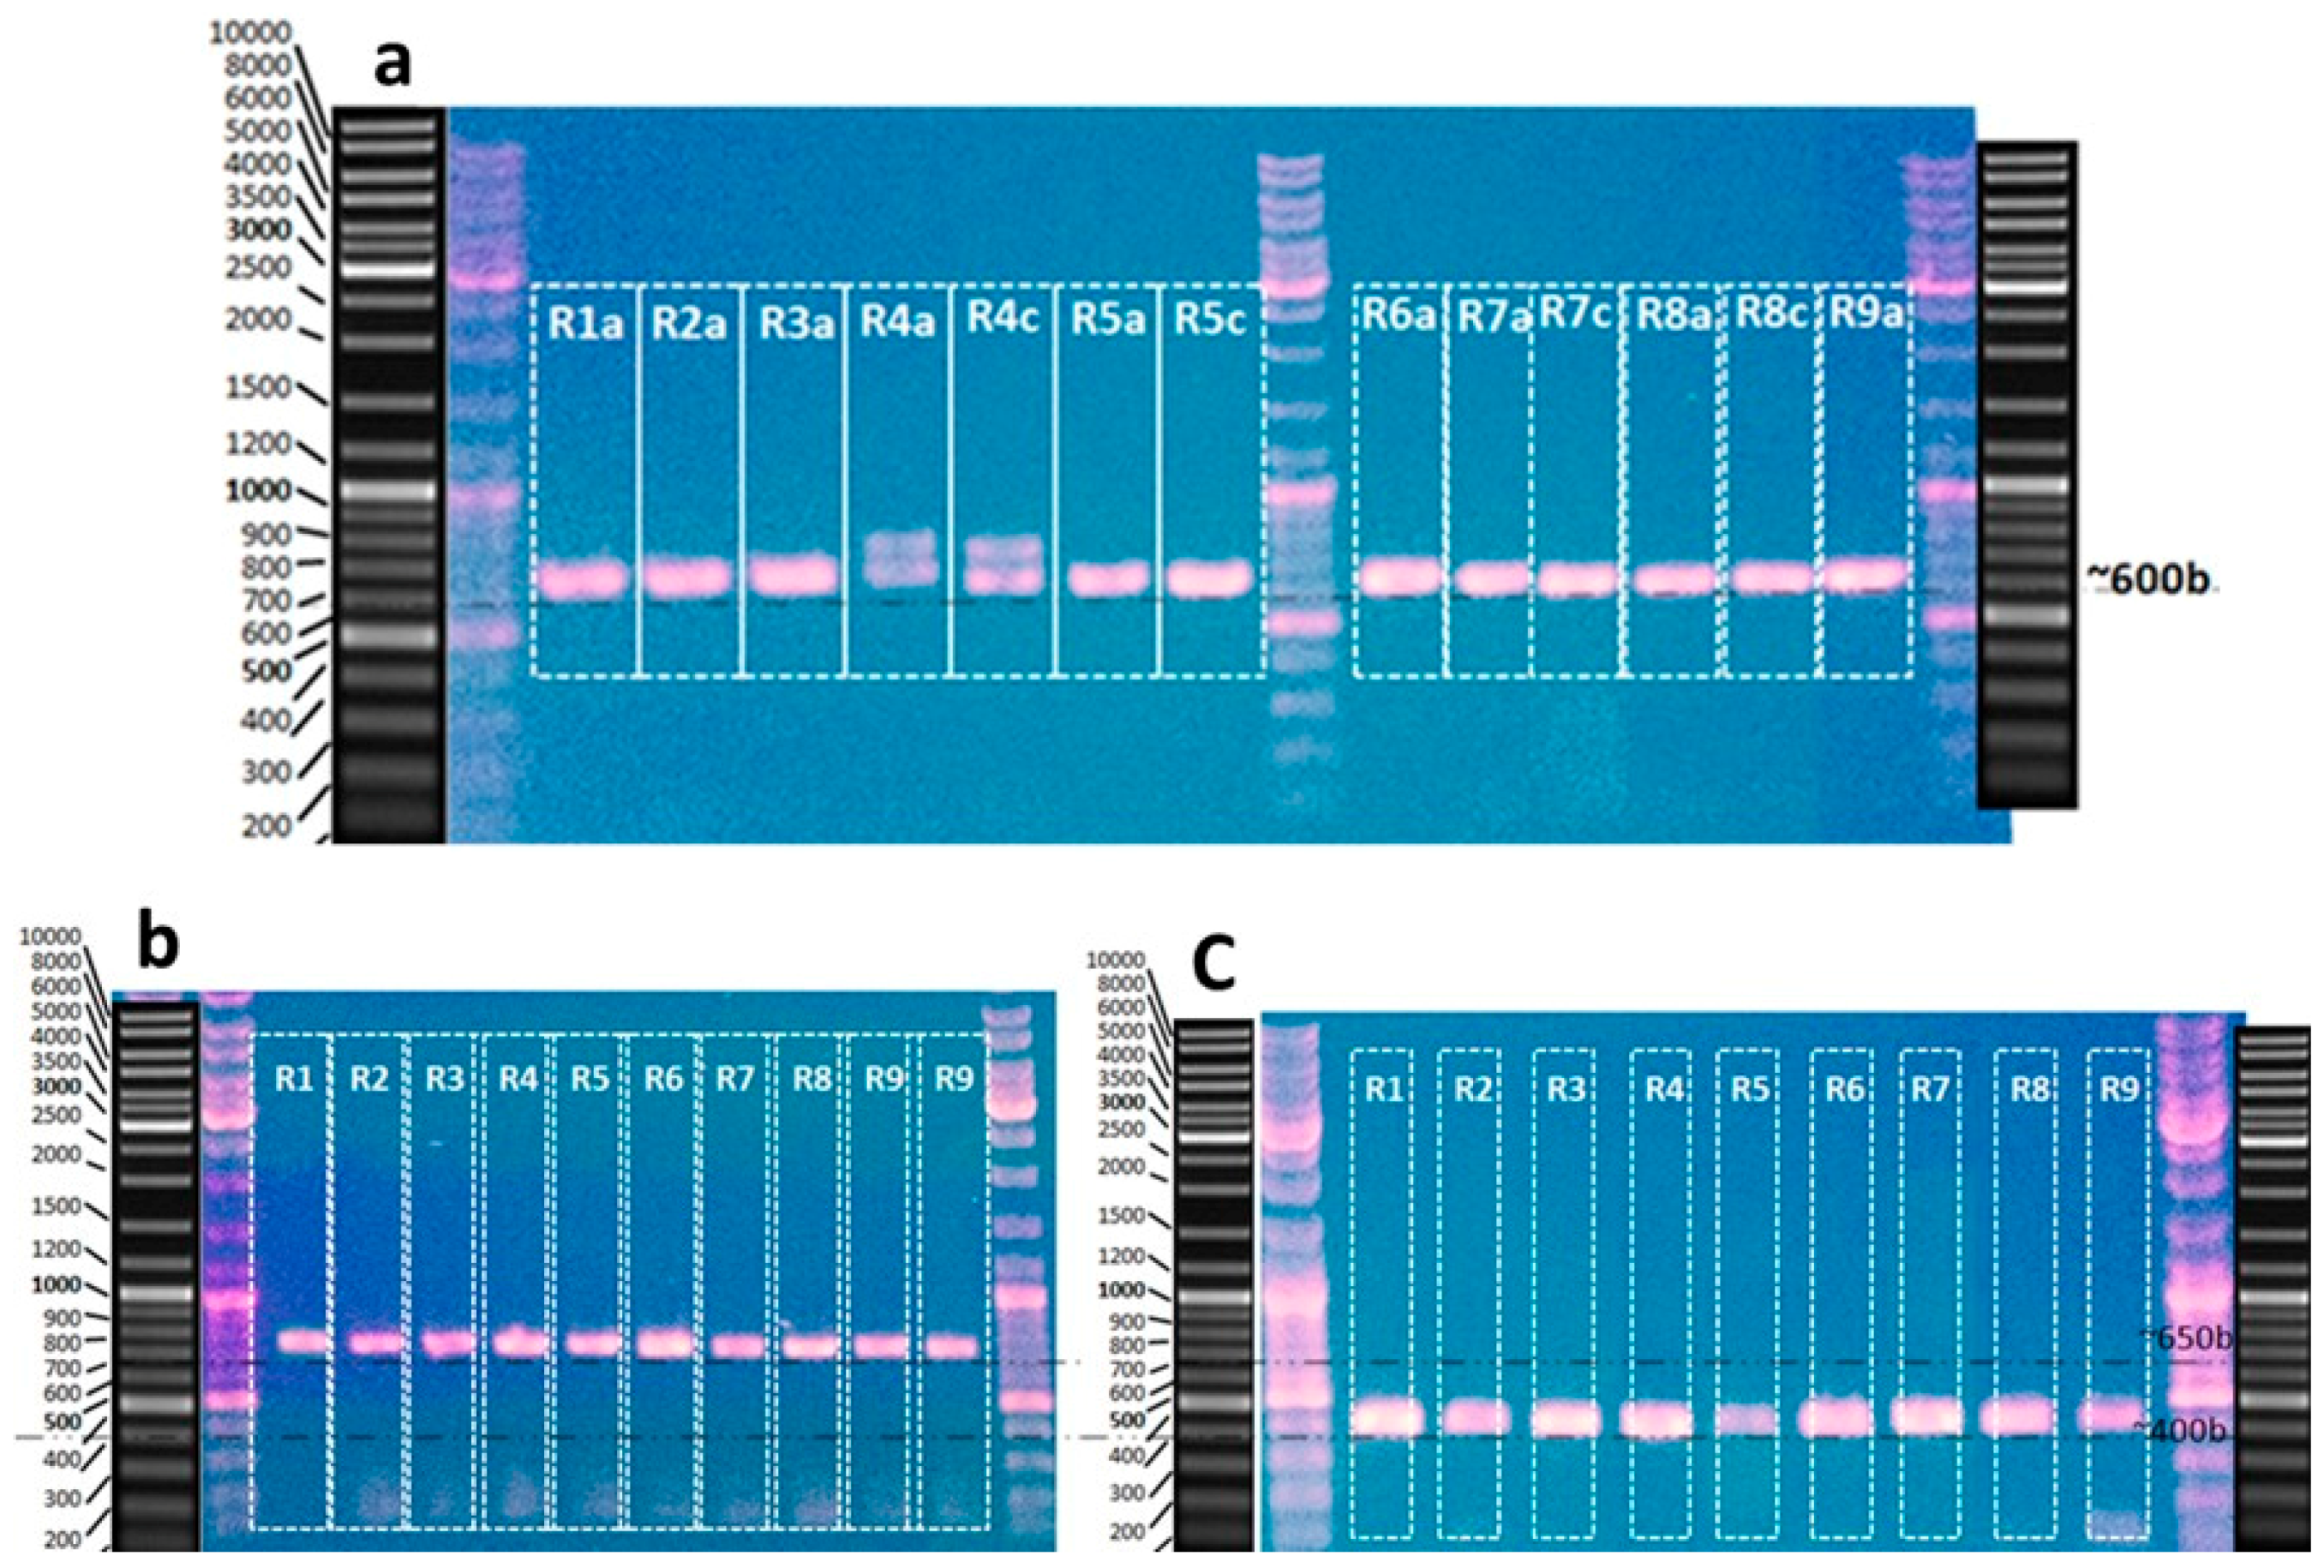
3.1. DNA Extraction of Hypnea sp. and PCR Amplification

After DNA extraction with either of the DNA extraction kits (PowerPlant and DNeasy) the LSU barcode was successfully amplified for all nine H. musciformis (morphologically identified by taxonomist) samples (i.e., R1-R9 in Figure 2a) by Phusion polymerase based on the 600 base-band visible on the gel (Figure 2a). There was no notable difference in the quality of the DNA sequences of the LSU barcode for each of the nine Hypnea sp. samples extracted with either PowerPlant or DNeasy. The overall success rate using Powerplant kit was 100% for all nine H. musciformis with LSU, UPA, and COI barcodes amplified by Phusion polymerase (Figure 2) and 100% for DNeasy kit initially tested for four H. musciformis samples (Figure 2a). Hence, commercial DNA extraction kits (notably PowerPlant and DNeasy) can be used for DNA extraction of Hypnea sp. However, several publications have previously reported problems with obtaining barcode sequences with the DNeasy extraction kit, thus, we decided to continue with the PowerPlant DNA extraction kit [1,16,36]. The LSU barcode sequence of one specimen R4, (Figure 2a) initially displayed an additional band of about 650 bases, in addition to the expected bands of 600 bases. The unknown band for this barcode was, however, eliminated after multiple PCR amplification (data not shown).
There are many different polymerases available for PCR amplification, but the inexpensive Taq polymerase is frequently used in barcoding studies [37]. The PowerPlant extracted DNA of the nine H. musciformis specimens (R1–R9) were first subject to PCR amplification using the Taq polymerase; but the initial barcoding experiment using Taq polymerase only amplified LSU and UPA but did not produce any barcodes for COI (data not shown). The Taq polymerase has previously been reported to have a high error rate of (1–20) × 10−5, and it has also been reported that Taq polymerase is sensitive to some sulfated polysaccharides and polyphenols, which may inhibit its enzymatic activity [38]. Phusion Hot Start polymerase (Phusion) has a fidelity more than 50 times higher in a HF buffer, resulting in accurate replication of the desired template [39] and has not been reported for seaweed barcoding. The overall success rate using Phusion was 100% for this study, and also allowed successful amplification of the COI barcode, which suggests that Phusion polymerase is advantageous for the amplification of H. musciformis DNA extracts, thereby increasing the success rate of replication of barcoded DNA extracts from red seaweed. For UPA, barcode amplification with Taq polymerase was retained since most of the samples were already successfully amplified. The length of the sequences on the gel was about 650 bases for COI (Figure 2b) and about 400 bases for UPA (Figure 2c), in agreement with previously reported amplifications. The data obtained agree with those of Sherwood et al. (2010) who conducted a comparative analysis of the three barcodes and the success rates were 42.9%, 57.1%, and 71.4% for COI, UPA and LSU (D6/D7), respectively, among all their red seaweed specimens [1].

3.2. DNA barcoding by LSU, UPA, and COI

Based on barcode sequence availability, and the degree of the sequencing success, COI, UPA, and LSU (D6/D7) barcodes were compared to available sequences in the NCBI GenBank database. The best match is shown in Table 1. UPA barcode sequences for all nine of the Hypnea sp. collected in Ghana matched best with a Brazilian H. musciformis (KP725300 and KP725302). However, the Brazilian H. musciformis sequences i.e., KP725300 and KP725302 were identical to three other Brazilian UPA barcode sequences—one of which was H. cervicornis (KM210575) (data not shown). This indicates insufficient information for species discrimination between H. musciformis and H. cervicornis using the UPA barcode, or perhaps morphological misidentification of the H. cervicornis during sampling, since all other UPA barcodes for H. cervicornis evaluated only had a 97%–98% identity match (data not shown). COI barcode sequences obtained for nine Hypnea sp. from Ghana were closely related with the COI barcode sequence of H. musciformis from Brazil notably KP725276, KP725277, KP725278 (Table 1).

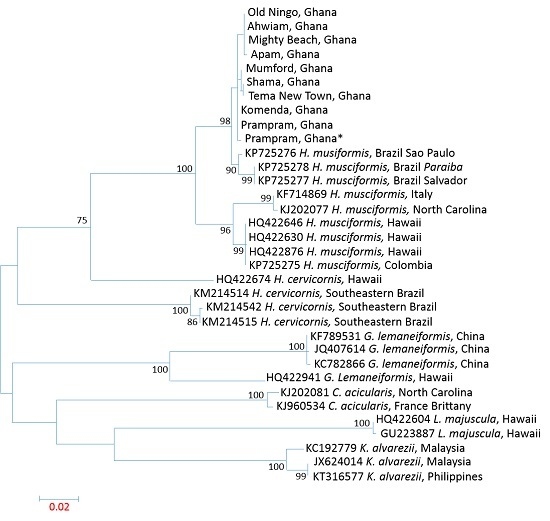
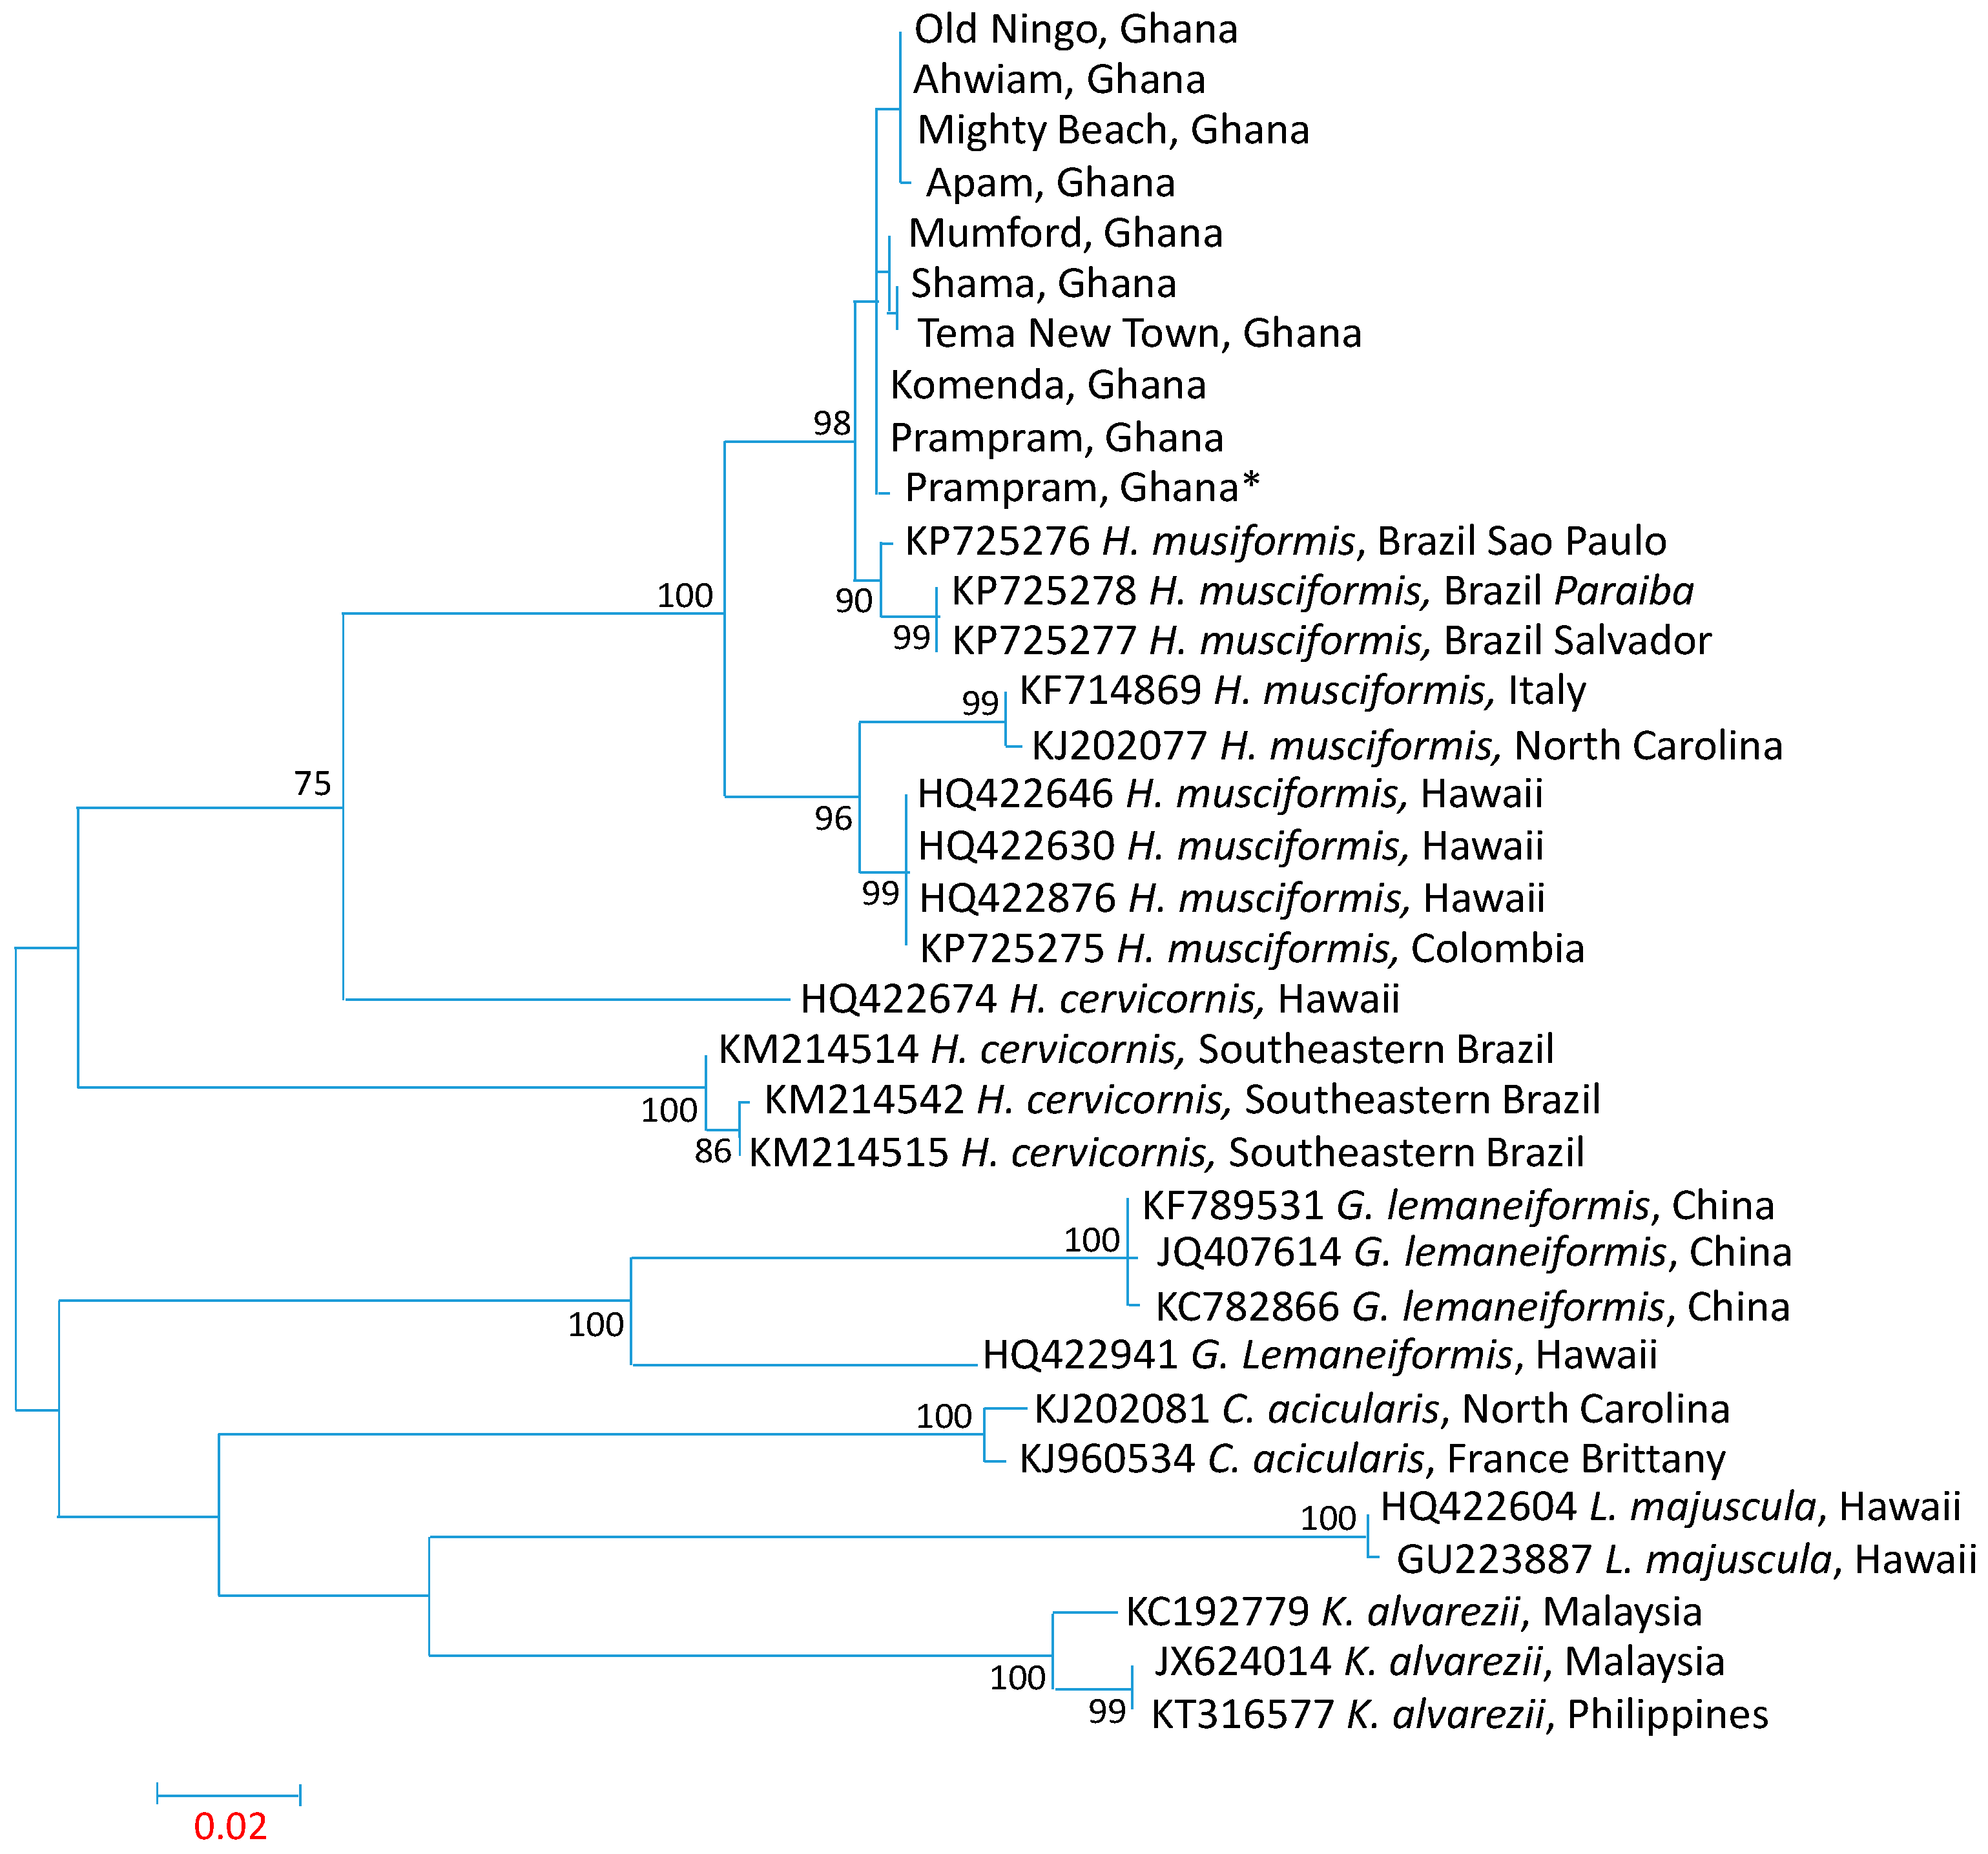
3.3. Influence of Spatial Variations on Phylogenetic Relationship

All LSU, UPA, and COI barcode sequences of the Ghanaian H. musciformis showed no distinct phylogenetic variations as all barcodes result points to H. musciformis sequence identity (99% for UPA and LSU), and for COI the identity match were 98.7%–99.2% (Table 1). The aligned sequences are similar to H. musciformis found in GenBank for LSU, UPA, and COI barcode sequences, which confirms the previous taxonomic identification by a local taxonomist. The results indicate that the spatial differences of the sampling sites in the coast of Ghana were not extreme enough to influence the DNA make-up and phylogenetic identity of H. musciformis in the region. Nevertheless, the similarity of the COI sequences for H. musciformis collected from around the world varies (Table 1). This variation may indicate that extreme spatial differences may have an influence on the molecular and phylogenetic characteristics of H. musciformis, and this also indicates that the power of resolution of the markers is not enough to resolve this issue. To elucidate the influence of spatial variations on the evolutionary relationship of H. musciformis from different locations in the world, a maximum likelihood phylogenetic tree of COI barcode sequences for Ghanaian H. musciformis was constructed (Figure 3). The COI sequences of other seaweed specimens from GenBank were selected for comparison, based on their collection locations (Figure 3).
The degree of phylogenetic modification between Ghanaian and Brazilian, Sao Paulo (KP725276) H. musciformis is not particularly high, probably because the Ghanaian and Brazilian H. musciformis have the same putative ancestors (Figure 3). Moreover, the geographical current flow suggests that H. musciformis drifts along the Atlantic South Equatorial Current by the diversion of a portion of the Guinea current along the Ghanaian coast. Nevertheless, H. musciformis from Italy, North Carolina, Columbia and Hawaii have different common putative ancestors than H. musciformis from Brazil and Ghana (Figure 3). This DNA modification was probably due to the impact of different environmental and climatic conditions, because of the enormous spatial difference, and possibly because of pure genetic drift due to the absence of gene flow. Saunders reported difficulties in phenotypic and taxonomic identification of red seaweed species due to varying environmental conditions [9].

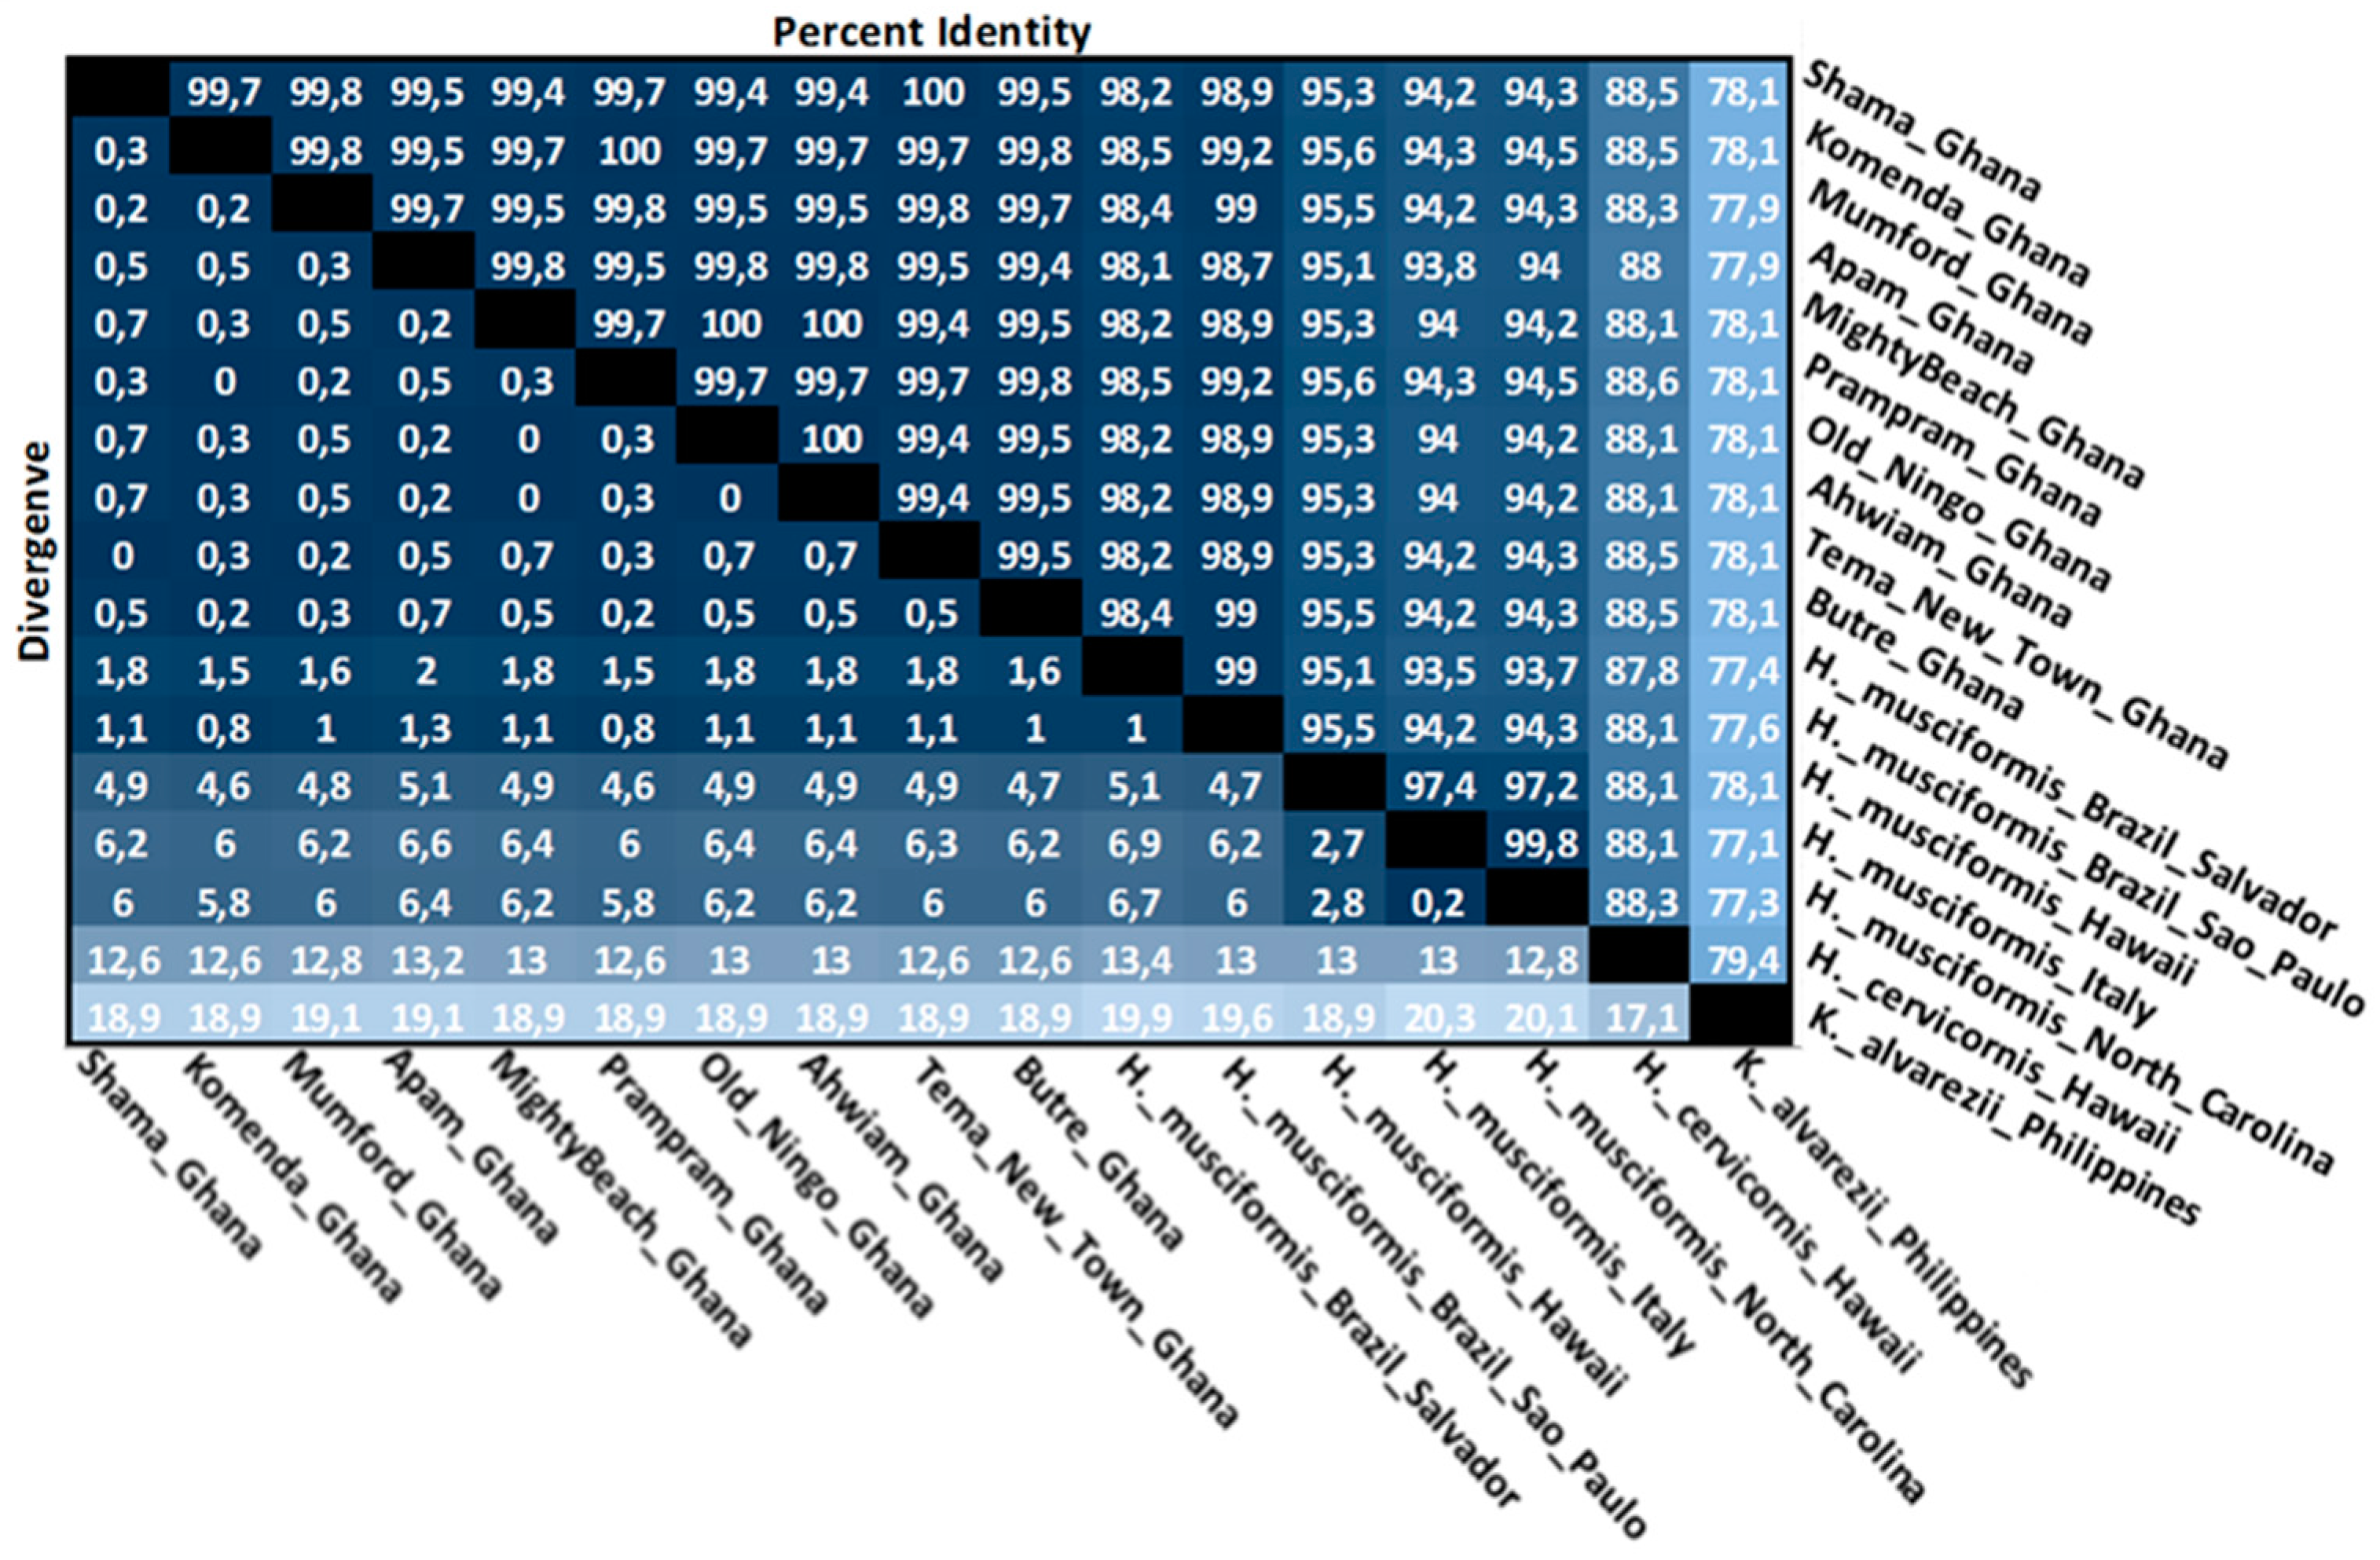
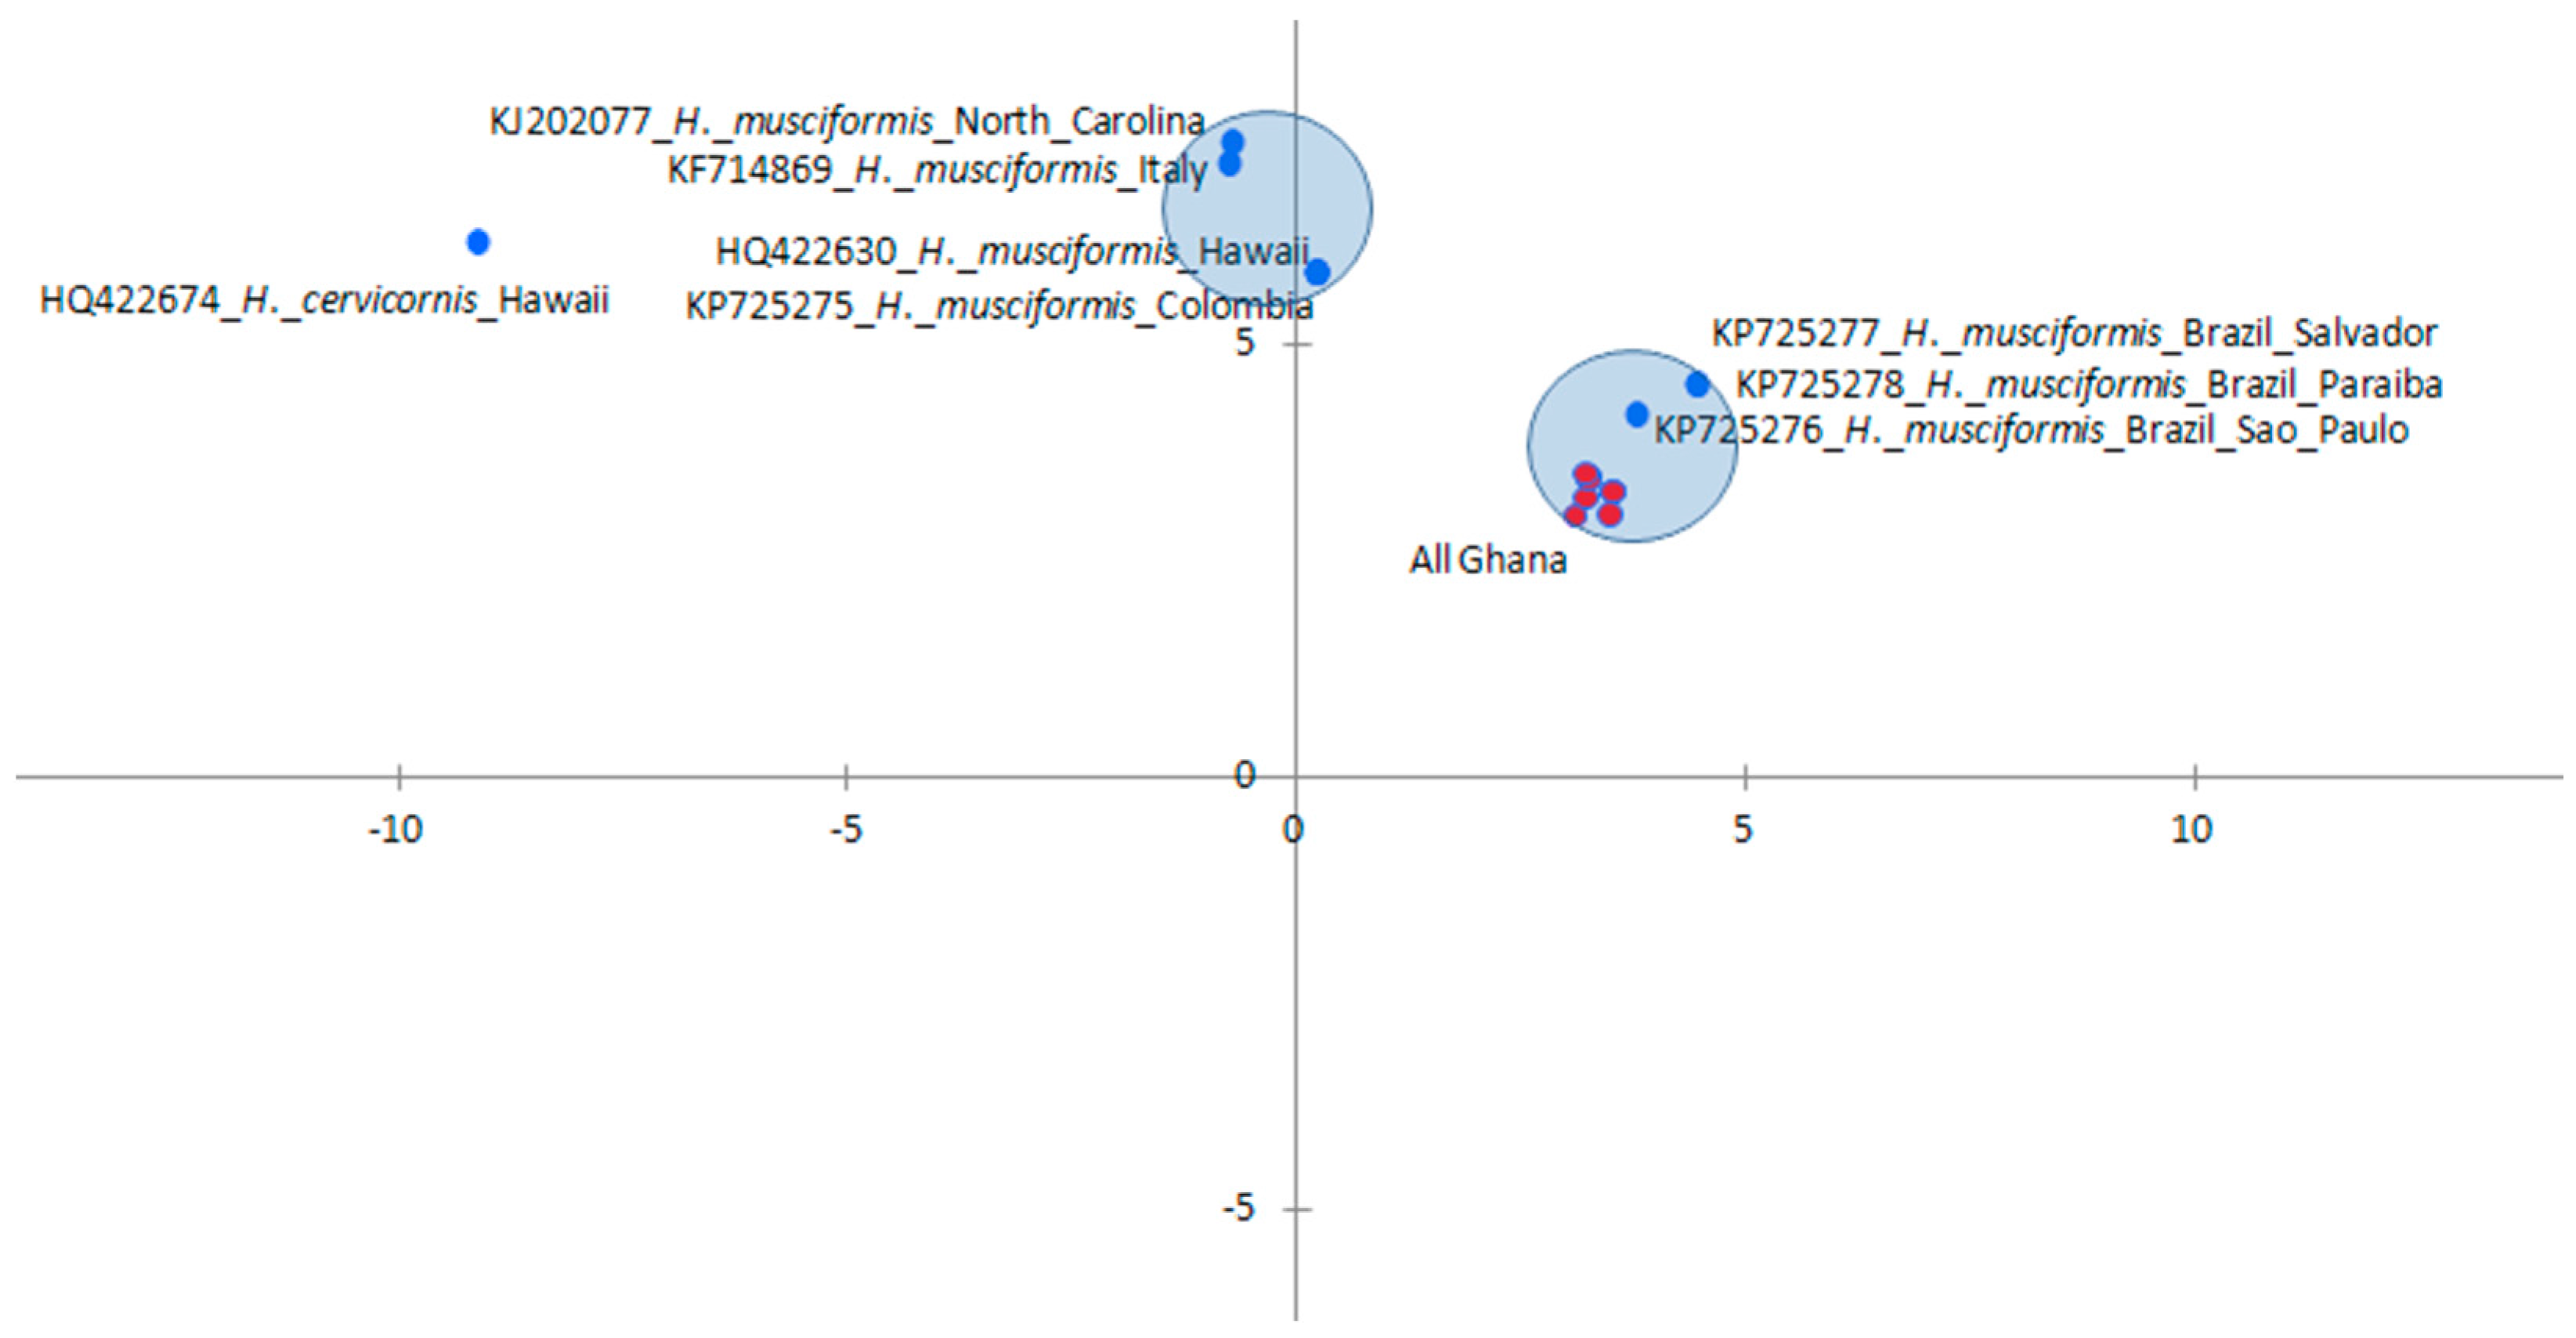
3.4. Intraspecies Divergence Analysis within COI Sequences

The molecular divergence between COI sequences of the Ghanaian Hypnea sp. and other seaweed specimens in GenBank were matched (Figure 4). This analysis may not be relevant for the sequences of the LSU and UPA barcodes for Ghanaian Hypnea sp., since the intraspecies divergence is 0%. However, intraspecies divergence for COI sequences is above zero, since not all obtained sequences were identical. In this analysis, a Hypnea sp. doubted to be a Hypnea cervicornis species by the local taxonomist (from Prampram, Ghana) was included to evaluate its phylogenetic identity. The sequence of K. alvarezii (KT316577) from the Philippines was used as a benchmark since it has a different putative ancestor than Hypnea species (Figure 4). The intraspecies divergence was calculated for the highest and the lowest divergence in a group of COI sequences. The intraspecies divergence for all Ghanaian Hypnea species were within the range of 0%–0.7% (with or without the Hypnea sample from Prampram), strongly indicating that they belong to the same species. According to Freshwater et al. the rule of thumb is that a divergence below 1 % is the same species and one above 2% signify that the specimen in questions are two different species [17]. The phylogenetic identification of the taxonomically identified Hypnea cervicornis suggests that its classification was incorrect and it was indeed a Hypnea musciformis.
Figure 5 presents the plot using multidimensional scaling to visualize the level of similarity of individual H. musciformis compared in this study, and verifies the possibility that molecular divergence of this particular species is influenced by large spatial variation. All Ghanaian H. musciformis were confirmed to have a level of similarity close to the Brazilian H. musciformis (KP725276–KP725278, Figure 5), while other H. musciformis from Hawaii, North Carolina, Italy, and Colombia were away (Figure 5). Moreover, two sequences of Brazilian H. musciformis samples (i.e., KP725276, and KP725277) were matched to the Ghanaian H. musciformis in the intraspecies range with changes from 0%–2% (Figure 4), thus confirming the barcode data (Table 1). However, comparing all H. musciformis investigated (only with the full sequence length and a documented location of collection were investigated) showed that the intraspecies divergence ranged from 0% to 6.9% (Figure 4). This indicates that in the current species identified as H. musciformis, there could be two separate species; but all reported Ghanaian H. musciformis specimens of this work should be regarded as the same as the Brazilian Sao Paulo species (KP725276, Figure 5) with a range of 0.8%–1.3% in divergence (Figure 4). This analysis demonstrates that the specimens morphologically identified as H. musciformis probably belong to the same “subspecies” within the H. musciformis species. Pairwise comparison within Ghanaian H. musciformis COI sequences, including COI sequences of H. cervicornis (from Hawaii, HQ422674) and Kappaphycus alvarezii (from Philippines, KT316577), produced an interspecies divergence of 12.6%–13.2% (H. cervicornis) and 18.9%–19.1% (K. alvarezii), respectively (Figure 4). This underlines the usefulness of COI barcode for species discrimination between H. musciformis and H. cervicornis. The evolutionary changes of H. cervicornis (HQ422674) can also be observed in the phylogenetic tree (Figure 3), together with other relevant red seaweed species in this work.

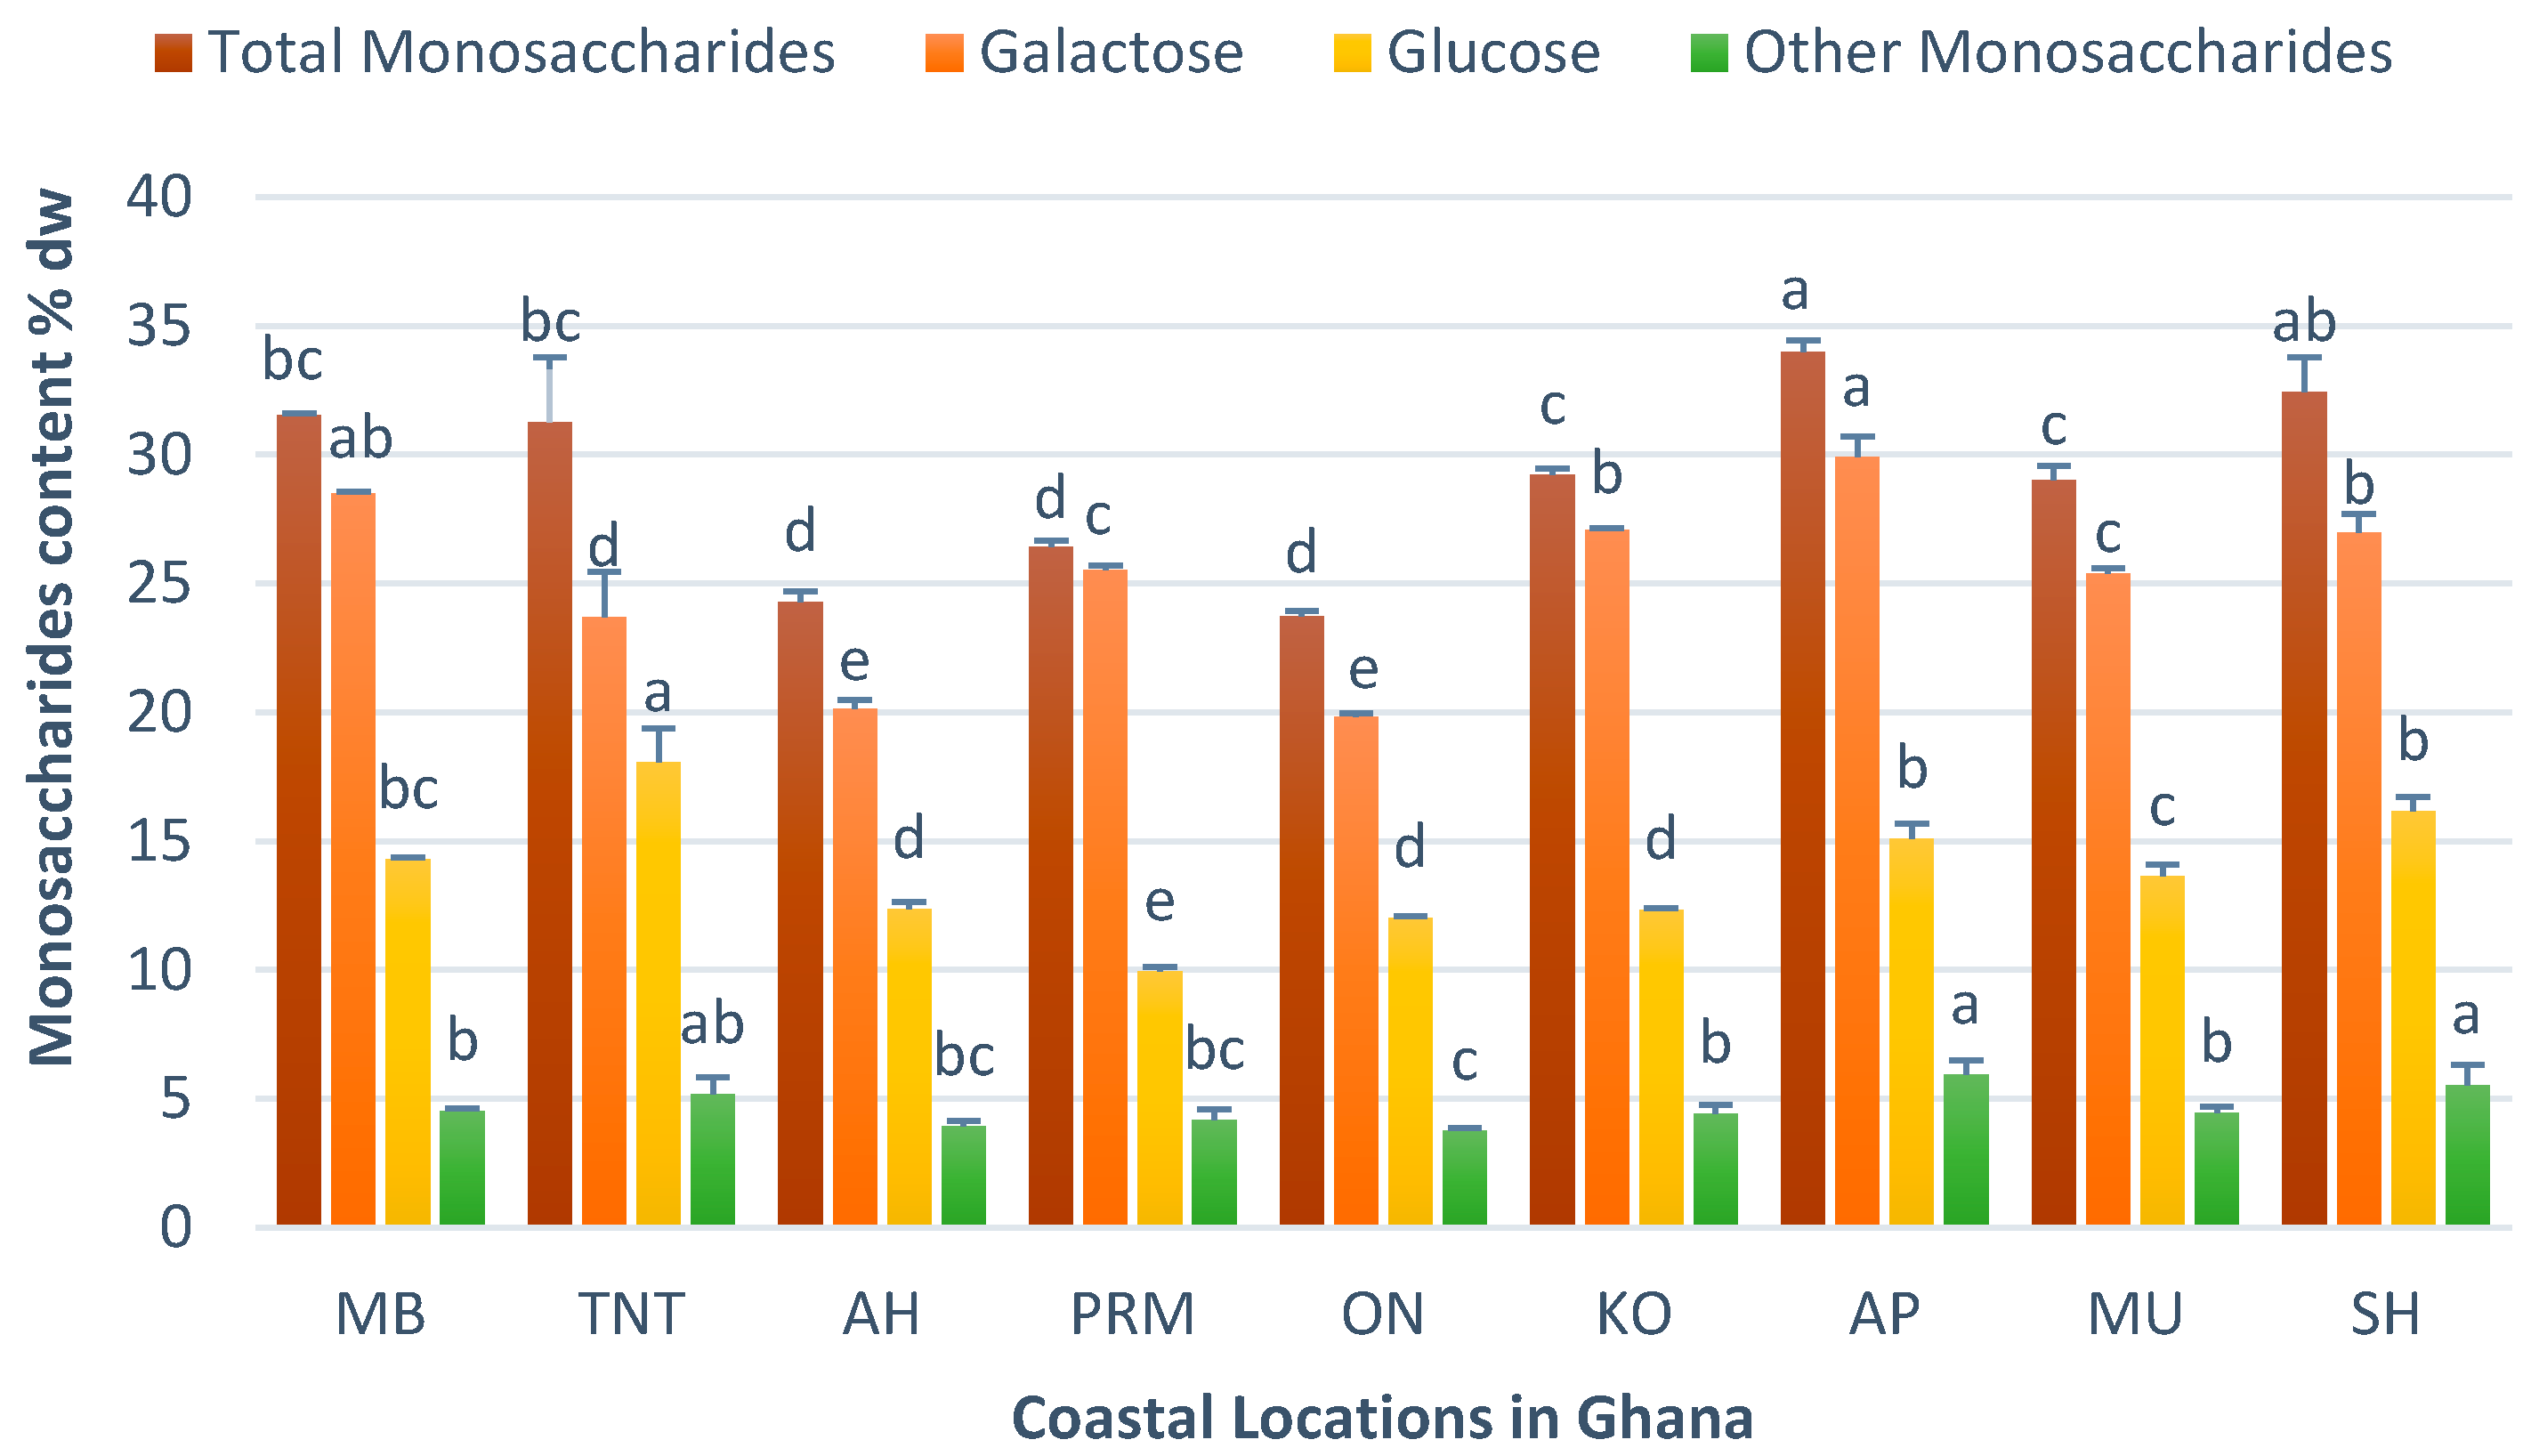
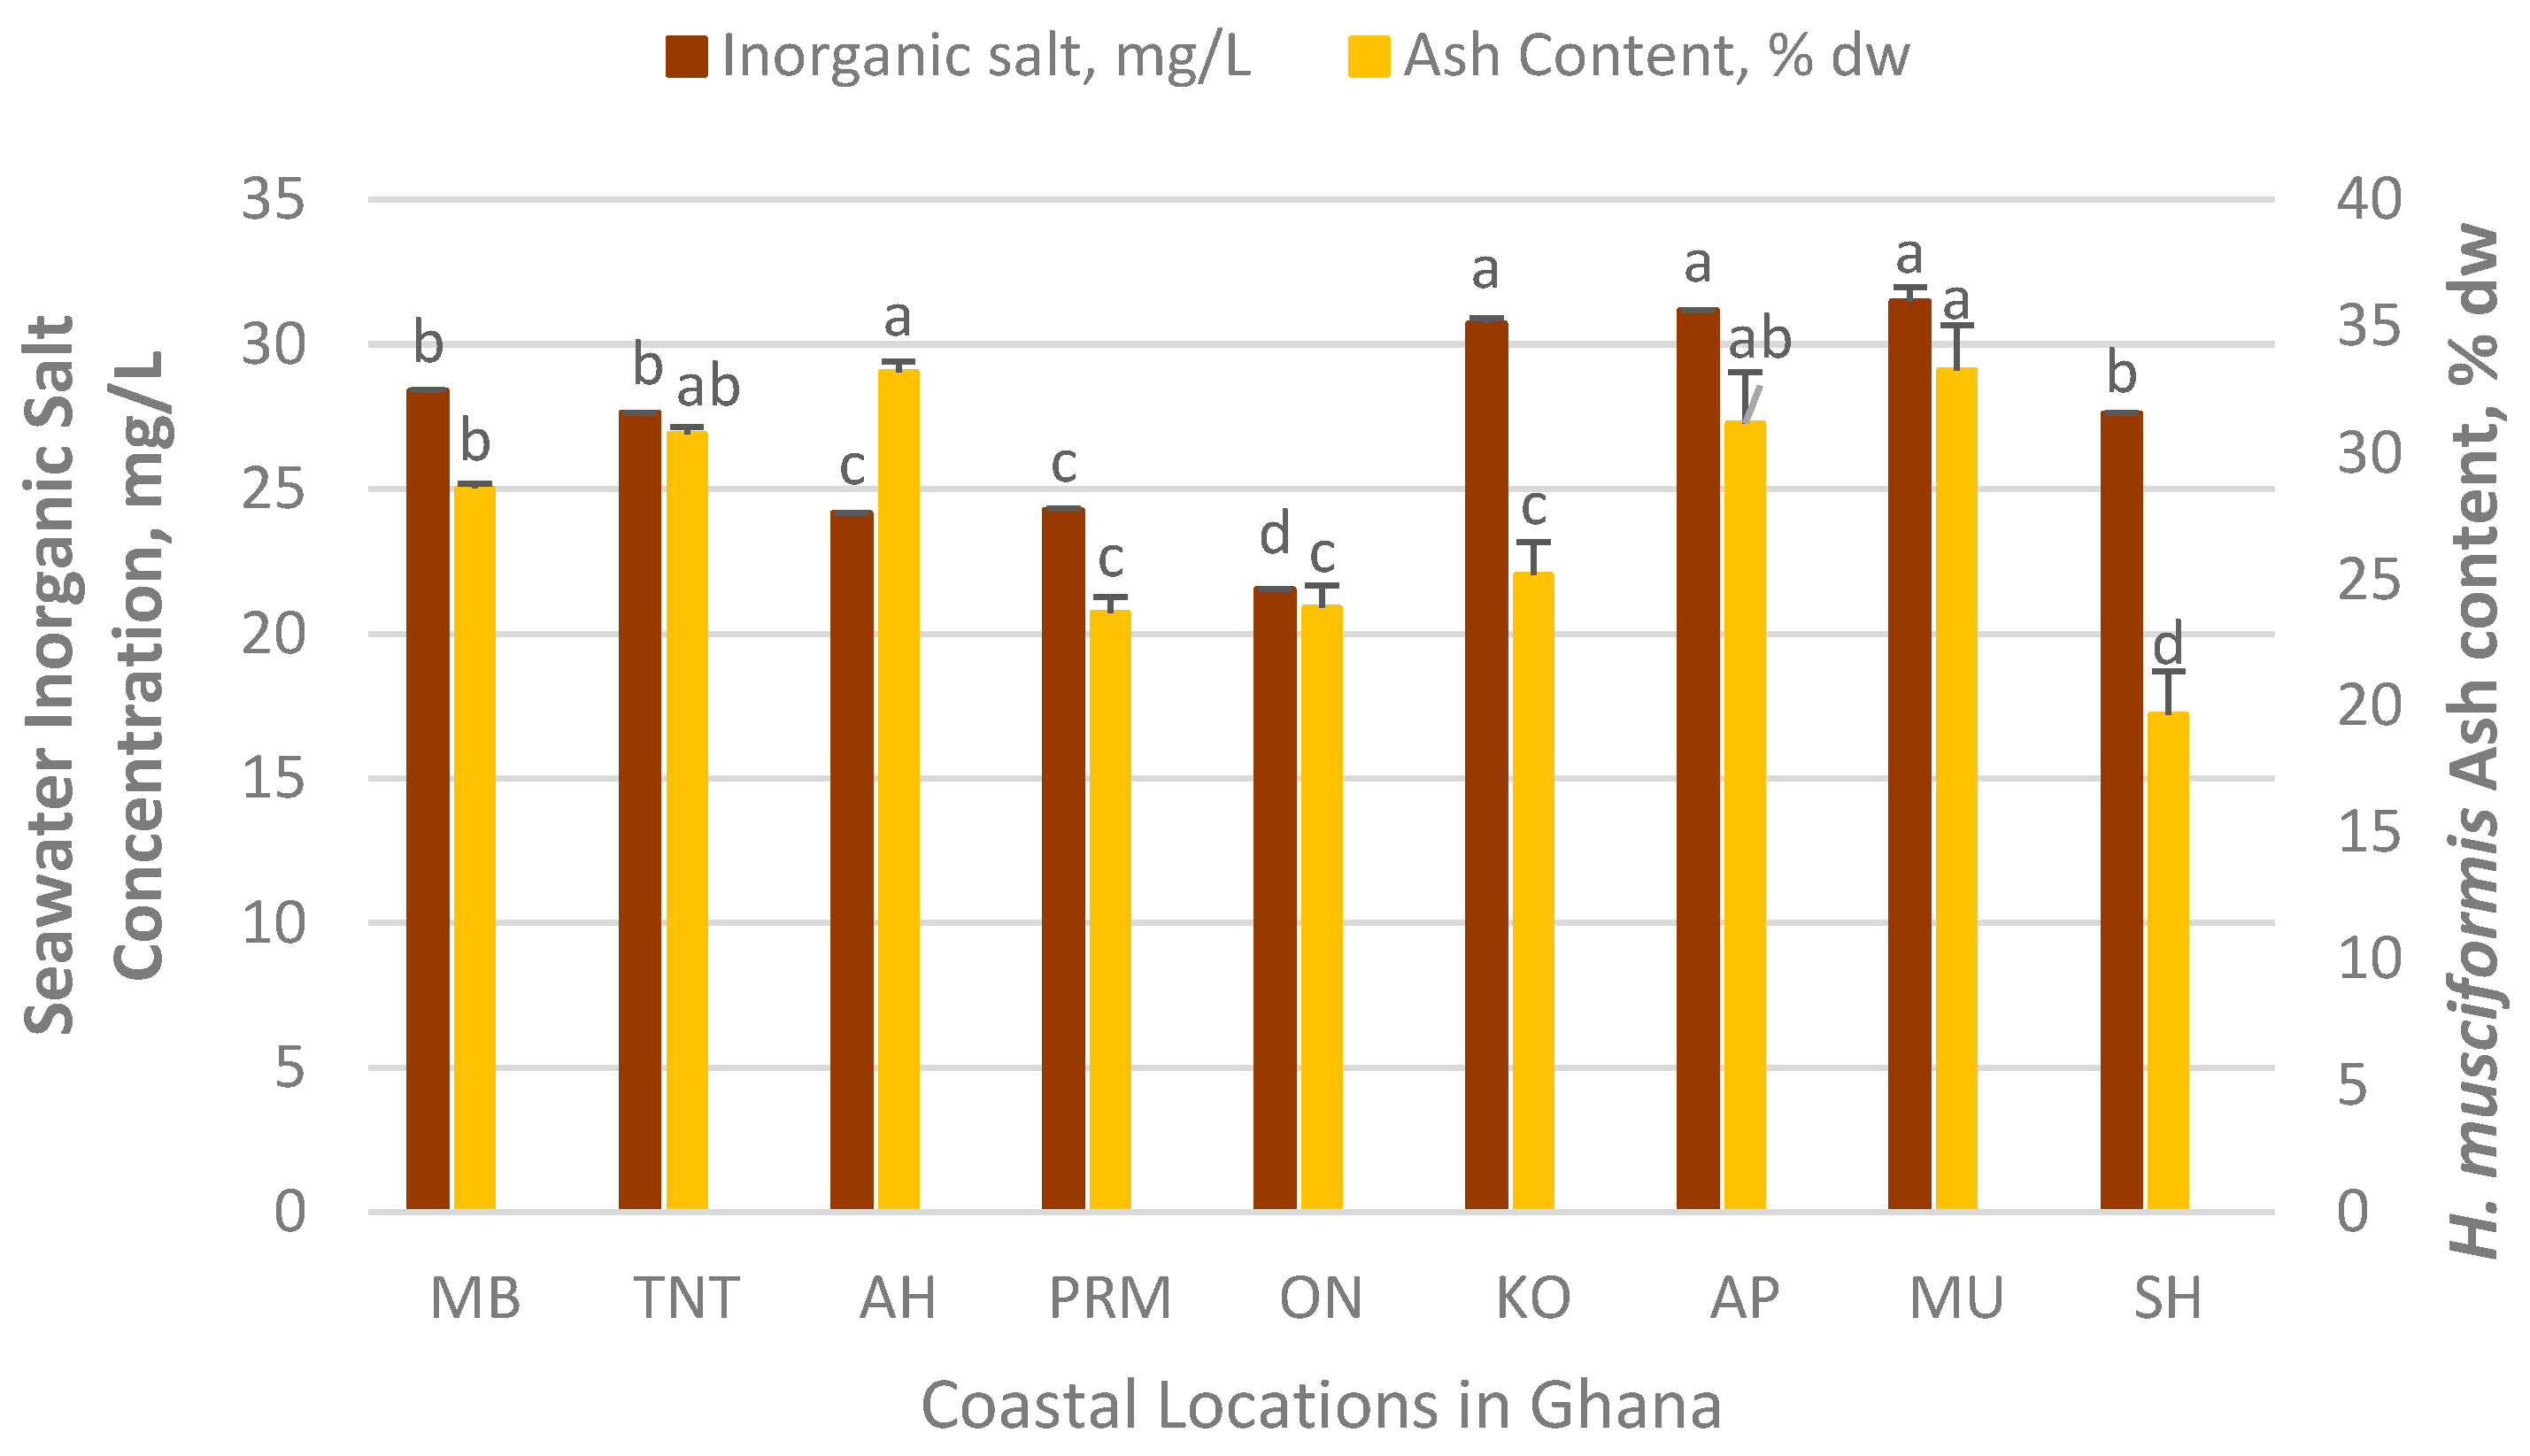
3.5. Chemical Characteristics of H. musciformis

The levels of the monosaccharides, notably galactose and glucose, varied between H. musciformis collected at different coastal locations in Ghana (Figure 6). Earlier studies reported that the carrageenan yield and quality of the H. musciformis differs between sampling locations along the Southeastern Brazilian coast [8]. These differences were ascribed to differences in various spatial abiotic factors, such as water movement, desiccation stress, low salinity, and extreme temperatures influence the changes in environmental conditions and nutrient limitations [8]. However, spatial variations between sampling locations along the coast of Ghana showed quantitative variation in chemical traits across different accessions (Figure 6), though it did not promote extreme phylogenetic divergence in the H. musciformis molecular identity, as described in this work (Figure 3).
Galactose was the main monosaccharide (20%–30% dw) component found in Ghanaian H. musciformis (Figure 6), which probably springs from the repeating disaccharides of d-galactopyranose units bound together with alternating α-1,3 and β-1,4 linkages of carrageenan. Since red seaweeds are generally believed to contain less than 10% w/w cellulose, some of the glucose (10%–18% dw, Figure 6) may derive from floridean starch, the storage carbohydrate of red seaweed that is built of 1,4-linked α-d-glucopyranose chains with branches at position 6 [44]. The total monosaccharide content (24%–33% dw, Figure 6), detected by the HPAEC, was very close to previously reported carbohydrate contents of H. musciformis collected in India [45]. Other minor monosaccharide constituents identified in the Ghanaian H. musciformis hydrolysates were mannose, rhamnose, arabinose, xylose, and glucuronic acid, which have all been previously identified in red seaweeds [44].
The districts of Ahiam (AH), Prampram (PRM), and Old Ningo (ON) where surrounded with lagoons and streams (i.e., the Moyo Lagoon, Gyankai Lagoon, and Nyigbe streams). During low tides the effluents from the lagoons and streams flow back to the coast, altering the typical seawater conditions, notably the inorganic salt concentrations. This may explain why H. musciformis samples collected from AH, PRM, and ON have low levels of dissolved salts ions (21–24 mg/L) compared to other coastal sampling sites (Figure 7). The concentrations of inorganic salts that influence the salinity of seawater, such as chloride, sodium, sulfate, magnesium, calcium, and potassium, varied slightly depending on the sampling sites (Figure 7). Dissolved inorganic salts are important abiotic factors that could influence the H. musciformis growth and carrageenan synthesis mechanisms [8]. The growth of H. cervicornis is closely related to changes in external environmental factors notably seawater inorganic salt concentration [46,47]. The salinity level determines the seawater osmotic pressure. The osmotic pressure affects seaweed moisture distribution inside and outside of the semipermeable membrane, and absorption of nutrients. Moreover, the fluctuation of dissolved salt ions in seawater is detrimental to the carrageenan yield. Studies on Tanzanian H. musciformis showed that fluctuation in salinity levels (e.g., dilution due to rainfall or runoff) significantly affected the field biomass, while stable salinity was associated with high carrageenan content [5]. In addition, seawater collected in the Accra region notably AH, PRM, and ON have the lowest combined content of N, PO4-P, and K ranging from 69–246 mg/L (data not shown), which may also have contributed the low synthesis of galactose and glucose (Figure 6).
The total amount of minerals present in H. musciformis samples from different coastal locations in Ghana was measured through ash content (Figure 7). The ash content in seaweeds are generally higher than those of terrestrial plants, and ranged from 19%–33% dw (Figure 7), which supports previous findings for red seaweed species [45]. The ash content for H. musciformis, presented in Figure 7 showed significant variations (p < 0.05) amongst sampling locations in Ghana. The highest level was 33% dw found in AH and MU and the lowest was 19% dw from PRM, ON, and KO (Figure 7). The high ash contents could be related to the accumulation of great quantities of mineral residues by H. musciformis in its tissue, or by absorption on the surface of the thalli without biological accumulation. Moreover, the presence of ash could be strongly attributed to ester sulfate groups and uronic acids of the polysaccharides, [48,49,50] mineral elements, [51], and metals associated with carbohydrates [52].

4. Conclusions

The current work shows that DNA-based identification allows for a detailed understanding of H. musciformis phylogenetic characteristics. This study also demonstrated that commercial kits (i.e., PowerPlant or DNeasy) can be used to extract DNA from Ghanaian H. musciformis. The phylogenetic divergence found within the COI barcode of the Ghanaian H. musciformis was 0%–0.7%, demonstrating that they belong to one group, and they were matched to the Brazilian H. musciformis with 0%–2% divergence. Ghanaian H. musciformis are, thus, suggested to have the same putative ancestors as H. musciformis from Brazil, because phylogenetic divergence was not particularly high. The geographical current flow suggests that H. musciformis drifts along the Atlantic South Equatorial Current by diversion of a portion of the Guinea current along the Ghanaian coast. Comparing all H. musciformis, investigated (Figure 4 and Figure 5) showed that the intraspecies divergence ranged from 0 to 6.9%, whereas the divergence within the samples collected in Ghana was <0.7%. This indicates that only one of two different groups of H. musciformis is present in Ghana. The phylogenetic divergence between H. musciformis populations was probably due to different environmental and climatic conditions, because of enormous spatial distribution and possibly because of pure genetic drift due to the absence of gene flow. Nevertheless, the spatial variance in the coast of Ghana was not large enough to influence any genetic changes in H. musciformis. In contrast the chemical characteristics of H. musciformis were significantly affected by spatial disparity. The total monosaccharide, galactose and glucose levels varied between H. musciformis collected at different coastal locations in Ghana. The concentrations of inorganic salts varied slightly depending on the sampling sites. H. musciformis samples collected from AH, PRM, and ON had low levels of dissolved salts ions compared to other coastal sampling sites, probably because the districts of AH, PRM, and ON were surrounded with lagoons and streams (i.e., the Moyo Lagoon, Gyankai Lagoon, and Nyigbe streams). It was also found that for the COI barcode the DNA amplification was best achieved using Phusion rather than DreamTaq polymerase. In addition, this work also highlights the possibility of mapping favorable locations for collecting or cultivating H. musciformis along the coast Ghana in the near future.

Acknowledgments

This work was funded via the Seaweed Biorefinery Research Project in Ghana (SeaBioGha) supported by Denmark’s development cooperation (Grant DANIDA-14-01DTU), Ministry of Foreign Affairs of Denmark. We will also like to thank the Water Research Institute, Council for Scientific Research, Accra, Ghana for their assistance in collecting the seaweed samples.

Author Contributions

M. T. Ale conceived the study, analyzed all the data and lead the writing, K. Barrett performed the DNA Barcoding analysis and drafted the section, A. deGraft-Johnson carried out the morphological taxonomic identification of the samples, N. Rhein-Knudsen helped the HPAEC analysis, G. N. D. Addico carried-out the chemical analysis and documented the results and Anne S. Meyer supervised all the experimental and analytical work and polishing the manuscript. All authors approved the paper.

Conflicts of Interest

The authors declare no conflict of interest.

References

  1. Sherwood, A.; Sauvage, T.; Kurihara, A.; Conklin, K.Y.; Presting, G.G. A comparative analysis of COI, LSU and UPA marker data for the Hawaiian florideophyte Rhodophyta: Implications for DNA barcoding of red algae. Cryptogamie 2010, 31, 451–465. [Google Scholar]
  2. De Jesus, P.B.; Silva, M.S.; de Lyra, G.M.; de Nunes, J.M.C.; Schnadelbach, A.S. Extension of the distribution range of Hypnea stellulifera (Cystocloniaceae, Rhodophyta) to the South Atlantic: Morphological and molecular evidence. Aquat. Bot. 2015, 123, 26–36. [Google Scholar] [CrossRef]
  3. Lawson, G.W.; Price, J.H. Seaweeds of the western coast of tropical Africa and adjacent islands: A critical assessment. I. Chlorophyta and Xanthophyta. Bot. J. Linn. Soc. 1969, 62, 279–346. [Google Scholar] [CrossRef]
  4. Serfor-Armah, Y.; Nyarko, B.J.B.; Osae, E.K.; Carboo, D.; Seku, F. Elemental analysis of some green and brown seaweeds from the coastal belt of Ghana. J. Radioanal. Nucl. Chem. 1999, 242, 193–197. [Google Scholar] [CrossRef]
  5. Mtolera, M.; Buriyo, A. Studies on Tanzanian Hypneaceae: Seasonal Variation in Content and Quality of Kappa-Carrageenan from Hypnea musciformis (Gigartinales: Rhodophyta). West. Indian Ocean J. Mar. Sci. 2005, 3, 43–49. [Google Scholar]
  6. Rhein-Knudsen, N.; Ale, M.T.; Meyer, A.S. Seaweed hydrocolloid production: An update on enzyme assisted extraction and modification technologies. Mar. Drugs 2015, 13, 3340–3359. [Google Scholar] [CrossRef] [PubMed] [Green Version]
  7. Durako, M.J.; Dawes, C.J. A comparative seasonal study of two populations of Hypnea musciformis from the East and West Coasts of Florida, USA. I. Growth and chemistry. Mar. Biol. 1980, 59, 151–156. [Google Scholar] [CrossRef]
  8. Reis, R.P.; Yoneshigue-Valentin, Y.; Pereira Dos Santos, C. Spatial and temporal variation of Hypnea musciformis carrageenan (Rhodophyta-Gigartinales) from natural beds in Rio de Janeiro State, Brazil. J. Appl. Phycol. 2008, 20, 1–8. [Google Scholar] [CrossRef]
  9. Saunders, G.W. Applying DNA barcoding to red macroalgae: A preliminary appraisal holds promise for future applications. Philos. Trans. R. Soc. Lond. Seri. B Biol. Sci. 2005, 360, 1879–1888. [Google Scholar] [CrossRef] [PubMed]
  10. Saunders, G.W.; Hommersand, M.H. Assessing red algal supraordinal diversity and taxonomy in the context of contemporary systematic data. Am. J. Bot. 2004, 91, 1494–1507. [Google Scholar] [CrossRef] [PubMed]
  11. Hebert, P.D.N.; Cywinska, A.; Ball, S.L.; de Waard, J.R. Biological identifications through DNA barcodes. Proc. Biol. Sci./R. Soc. 2003, 270, 313–321. [Google Scholar] [CrossRef] [PubMed]
  12. De Barros-Barreto, M.B.; McIvor, L.; Maggs, C.A.; Gomes Ferreira, P.C. Molecular systematics of Ceramium and Centroceras (Ceramiaceae, Rhodophyta) from Brazil. J. Phycol. 2006, 42, 905–921. [Google Scholar] [CrossRef]
  13. Carro, B.; Lopez, L.; Peña, V.; Bárbara, I.; Barreiro, R. DNA barcoding allows the accurate assessment of European maerl diversity: A Proof-of-Concept study. Phytotaxa 2014, 190, 176–189. [Google Scholar] [CrossRef]
  14. Moritz, C.; Cicero, C. DNA barcoding: Promise and pitfalls. PLoS Biol. 2004, 2, e354. [Google Scholar] [CrossRef] [PubMed] [Green Version]
  15. Radulovici, A.E.; Archambault, P.; Dufresne, F. DNA Barcodes for Marine Biodiversity: Moving Fast Forward? Diversity 2010, 2, 450–472. [Google Scholar] [CrossRef]
  16. Du, G.; Wu, F.; Guo, H.; Xue, H.; Mao, Y. DNA barcode assessment of Ceramiales (Rhodophyta) in the intertidal zone of the northwestern Yellow Sea. Chin. J. Oceanol. Limnol. 2015, 33, 685–695. [Google Scholar] [CrossRef]
  17. Freshwater, D.W.; Tudor, K.; O’Shaughnessy, K.; Wysor, B. DNA barcoding in the red algal order Gelidiales: Comparison of COI with rbcL and verification of the barcoding gap. Cryptogam. Algol. 2010, 31, 435–449. [Google Scholar]
  18. Conklin, K.Y.; Kurihara, A.; Sherwood, A.R. A molecular method for identification of the morphologically plastic invasive algal genera Eucheuma and Kappaphycus (Rhodophyta, Gigartinales) in Hawaii. J. Appl. Phycol. 2009, 21, 691–699. [Google Scholar] [CrossRef]
  19. Sherwood, A.R.; Presting, G.G. Universal primers amplify a 23S rDNA plastid marker in eukaryotic algae and cyanobacteria. J. Phycol. 2007, 43, 605–608. [Google Scholar] [CrossRef]
  20. Hu, Z.; Guiry, M.D.; Duan, D. Using the ribosomal internal transcribed spacer (ITS) as a complement marker for species identification of red macroalgae. Hydrobiologia 2009, 635, 279–287. [Google Scholar] [CrossRef]
  21. Greco, M.; Sáez, C.A.; Brown, M.T.; Bitonti, M.B. A simple and effective method for high quality co-extraction of genomic DNA and total RNA from low biomass Ectocarpus siliculosus, the model brown alga. PLoS ONE 2014, 9, e96470. [Google Scholar] [CrossRef] [PubMed]
  22. Stiger, V.; Horiguchi, T.; Yoshida, T.; Coleman, A.W.; Masuda, M. Phylogenetic relationships of Sargassum (Sargassaceae, Phaeophyceae) with reference to a taxonomic revision of the section Phyllocystae based on ITS-2 nrDNA sequences. Phycol. Res. 2000, 48, 251–260. [Google Scholar] [CrossRef]
  23. Yoshida, T.; Stiger, V.; Horiguchi, T. Sargassum boreale sp. nov. (Fucales, Phaeophyceae) from Hokkaido, Japan. Phycol. Res. 2000, 48, 125–131. [Google Scholar] [CrossRef]
  24. Du, G.; Wu, F.; Mao, Y.; Guo, S.; Xue, H.; Bi, G. DNA barcoding assessment of green macroalgae in coastal zone around Qingdao, China. J. Ocean Univ. China 2014, 13, 97–103. [Google Scholar] [CrossRef]
  25. Francavilla, M.; Franchi, M.; Monteleone, M.; Caroppo, C. The red seaweed Gracilaria gracilis as a multi products source. Mar. Drugs 2013, 11, 3754–3776. [Google Scholar] [CrossRef] [PubMed]
  26. Anderson, J.; Ingram, J. Tropical Soil Biology and Fertility: A Handbook of Methods. CAB International: Wallingford, UK, 1989. [Google Scholar]
  27. Tamura, K.; Stecher, G.; Peterson, D.; Filipski, A.; Kumar, S. MEGA6: Molecular Evolutionary Genetics Analysis version 6.0. Mol. Biol. Evol. 2013, 30, 2725–2729. [Google Scholar] [CrossRef] [PubMed]
  28. Thompson, J.D.; Higgins, D.G.; Gibson, T.J. CLUSTAL W: Improving the sensitivity of progressive multiple sequence alignment through sequence weighting, position-specific gap penalties and weight matrix choice. Nucleic Acids Res. 1994, 22, 4673–4680. [Google Scholar] [CrossRef] [PubMed]
  29. Gordon-Bradley, N.; Lymperopoulou, D.S.; Williams, H.N. Differences in bacterial community structure on Hydrilla verticillata and Vallisneria americana in a freshwater spring. Microbes Environ. 2014, 29, 67–73. [Google Scholar] [CrossRef] [PubMed]
  30. Kimura, M. A simple method for estimating evolutionary rates of base substitutions through comparative studies of nucleotide sequences. J. Mol. Evol. 1980, 16, 111–120. [Google Scholar] [CrossRef] [PubMed]
  31. Sluiter, J.B.; Ruiz, R.O.; Scarlata, C.J.; Sluiter, A.D.; Templeton, D.W. Compositional analysis of lignocellulosic feedstocks. 1. Review and description of methods. J. Agric. Food Chem. 2010, 58, 9043–9053. [Google Scholar] [CrossRef] [PubMed]
  32. Novozamsky, I.; Houba, V.J.G.; van Eck, R.; van Vark, W. A novel digestion technique for multi-element plant analysis. Commun. Soil Sci. Plant Anal. 2008, 14, 239–248. [Google Scholar] [CrossRef]
  33. Clesceri, L.S. Standard Methods for the Examination of Water and Wastewater, 20th ed.; APHA: Washington, DC, USA, 1998. [Google Scholar]
  34. Manns, D.; Deutschle, A.L.; Saake, B.; Meyer, A.S. Methodology for quantitative determination of the carbohydrate composition of brown seaweeds (Laminariaceae). RSC Adv. 2014, 4, 25736–25746. [Google Scholar] [CrossRef] [Green Version]
  35. Ale, M.T.; Maruyama, H.; Tamauchi, H.; Mikkelsen, J.D.; Meyer, A.S. Fucose-containing sulfated polysaccharides from brown seaweeds inhibit proliferation of melanoma cells and induce apoptosis by activation of caspase-3 in vitro. Mar. Drugs 2011, 9, 2605–2621. [Google Scholar] [CrossRef] [PubMed] [Green Version]
  36. Mattio, L.; Payri, C.E.; Verlaque, M. Taxonomic revision and geographic distribution of the subgenus Sargassum (Fucales, Phaeophyceae) in the western and central Pacific Islands based n morphological and molecular analysis. J. Phycol. 2009, 45, 1213–1227. [Google Scholar] [CrossRef] [PubMed]
  37. Saunders, G.W.; Kucena, H. An evaluation of rbcL, tufA, UPA, LSU and ITS as DNA barcode markers for the marine green macroalgae. Cryptogam. Algol. 2010, 31, 487–528. [Google Scholar]
  38. Davalieva, K.; Efremov, G.D. Influence of salts and pcr inhibitors on the amplification capacity of three thermostable DNA polymerases. Maced. J. Chem. Chem. Eng. 2010, 29, 57–62. [Google Scholar]
  39. McInerney, P.; Adams, P.; Hadi, M.Z. Error Rate Comparison during Polymerase Chain Reaction by DNA Polymerase. Mol. Biol. Int. 2014, 2014, 287430. [Google Scholar] [CrossRef] [PubMed]
  40. Sherwood, A.R.; Kurihara, A.; Conklin, K.Y.; Sauvage, T.; Presting, G.G. The Hawaiian Rhodophyta Biodiversity Survey (2006–2010): A summary of principal findings. BMC Plant Biol. 2010, 10, 258. [Google Scholar] [CrossRef] [PubMed]
  41. Nauer, F.; Cassano, V.; Oliveira, M.C. Description of Hypnea pseudomusciformis sp. nov., a new species based on molecular and morphological analyses, in the context of the H. musciformis complex (Gigartinales, Rhodophyta). J. Appl. Phycol. 2014, 27, 2405–2417. [Google Scholar] [CrossRef]
  42. Freshwater, D.W.; Parham, S.L.; Phillips, P.R.; Lyon, S.F.; Wilson, R. Hypnea musciformis cytochrome oxidase subunit 1 (COI) gene, partial cd. Available online: http://www.ncbi.nlm.nih.gov/nuccore/KJ202077 (accessed on 13 April 2014).
  43. Manghisi, A. Identifying alien macroalgae through DNA barcoding: The case of Hypnea cornuta (Cystocloniaceae, Rhodophyta). Trans. Waters Bull. 2011, 5, 42–49. [Google Scholar]
  44. Usov, A.I. Polysaccharides of the red algae. Adv. Carbohydr. Chem. Biochem. 2011, 65, 115–217. [Google Scholar] [PubMed]
  45. Arunkumar, K.; Palanivelu, A.; Darsis, A. Proximate composition, nutraceutical constituents and fatty acid profile on GCMS of seaweeds collected from Balk Bay (Thondi), India. Int. J. Curr. Sci. 2014, 12, 57–71. [Google Scholar]
  46. Ding, L.; Ma, Y.; Huang, B.; Chen, S. Effects of seawater salinity and temperature on growth and pigment contents in Hypnea cervicornis J. Agardh (Gigartinales, Rhodophyta). BioMed Res. Int. 2013, 2013, 594308. [Google Scholar] [CrossRef] [PubMed]
  47. Marinho-Soriano, E.; Fonseca, P.C.; Carneiro, M.A.A.; Moreira, W.S.C. Seasonal variation in the chemical composition of two tropical seaweeds. Bioresour. Technol. 2006, 97, 2402–2406. [Google Scholar] [CrossRef] [PubMed]
  48. Charles, A.L.; Chang, C.-K.; Wu, M.-L.; Huang, T.-C. Studies on the expression of liver detoxifying enzymes in rats fed seaweed (Monostroma nitidum). Food Chem. Toxicol.  2007, 45, 2390–2396. [Google Scholar] [CrossRef] [PubMed]
  49. De Araújo, I.W.F.; de Vanderlei, E.S.O.; Rodrigues, J.A.G.; Coura, C.O.; Quinderé, A.L.G.; Fontes, B.P.; de Queiroz, I.N.L.; Jorge, R.J.B.; Bezerra, M.M.; Rodrigues e Silva, A.A.; et al. Effects of a sulfated polysaccharide isolated from the red seaweed Solieria filiformis on models of nociception and inflammation. Carbohydr. Polym. 2011, 86, 1207–1215. [Google Scholar] [CrossRef]
  50. Rodrigues, J.A.G.; de Vanderlei, E.S.O.; Silva, L.M.C.M.; de Araújo, I.W.F.; de Queiroz, I.N.L.; de Paula, G.A.; Abreu, T.M.; Ribeiro, N.A.; Bezerra, M.M.; Chaves, H.V.; et al. Antinociceptive and anti-inflammatory activities of a sulfated polysaccharide isolated from the green seaweed Caulerpa cupressoides. Pharmacol. Rep. 2012, 64, 282–292. [Google Scholar] [CrossRef]
  51. Mohamed, S.; Hashim, S.N.; Rahman, H.A. Seaweeds: A sustainable functional food for complementary and alternative therapy. Trends Food Sci. Technol. 2012, 23, 83–96. [Google Scholar] [CrossRef]
  52. Andrade, L.R.; Leal, R.N.; Noseda, M.; Duarte, M.E.R.; Pereira, M.S.; Mourão, P.A.S.; Farina, M.; Amado Filho, G.M. Brown algae overproduce cell wall polysaccharides as a protection mechanism against the heavy metal toxicity. Mar. Pollut. Bull. 2010, 60, 1482–1488. [Google Scholar] [CrossRef] [PubMed]
Figure 1. The coastline of Ghana and the relevant locations from which H. musciformis was collected (January 2015) by an experienced taxonomist.
Diversity 08 00014 g001
Figure 2. Gel electrophoresis with amplified Phusion PCR products for (a) LSU barcode of nine different Hypnea sp. extracted with PowerPlant (indicated by a) or DNeasy DNA extraction kit (indicated by c, i.e., R4, R5, R7, and R9); (b) COI barcode with amplified Phusion PCR products, and (c) UPA barcode with amplified Taq PCR products. Samples are coded according to the location they were obtained from: R1 from Ahwiam, R2 from Apam, R3 from Komenda, R4 from Mighty Beach, R5 from Mumford, R6 from Old Ningo, R7 from Shama, R8 from Tema New Town, and R9 from Prampram.
Diversity 08 00014 g002
Figure 3. Phylogenetic tree based on multiple alignment of COI barcodes sequences of the specimens collected from different sites along the Ghanaian coast (named after their location) and selected COI barcodes sequences of other red seaweed from the NCBI GenBank. The history of phylogenetic relationship comparison was performed using the maximum likelihood method, based on the Kimura two-parameter model [30]. * Hypnea sp. doubted to be as Hypnea cervicornis by local the taxonomist.
Diversity 08 00014 g003
Figure 4. Divergences and identities of COI barcode sequences from Ghanaian Hypnea sp. together with references from the NCBI GenBank H. musciformis, H. cervicornis and Kappaphycus alvarezii. The intensity of the blue color increases as the divergences decreases and the identity percentages increase relative to the sequences of this work.
Diversity 08 00014 g004
Figure 5. Multidimensional scaling analysis (XLSTAT, 2016) of the divergences of COI barcode sequences from Ghanaian H. musciformis associated to other H. musciformis sequences available in GenBank.
Diversity 08 00014 g005
Figure 6. HPLC-PAD analysis of monosaccharide composition of H. musciformis from selected coastal areas in Ghana. All values are given as dehydrated monomers; other monosaccharides were detected in minor amounts including mannose, xylose and glucuronic acid. Means with different letters (i.e., a, b, c, d, and e) are significantly different, p < 0.05 (ANOVA, Tukey’s 95% confidence intervals).
Diversity 08 00014 g006
Figure 7. Inorganic salt content was the combined levels of Na, K, Ca, Mg, Cl, SO4, and CO3, respectively. Seawater and seaweed samples were obtained from different coastal location in Ghana selected for this study. Means with different letters (i.e., a, b, c, and d) are significantly different p < 0.05, (ANOVA, Turkey’s 95% confidence intervals).
Diversity 08 00014 g007
Table 1. Barcode alignment for nine morphologically-identified Hypnea sp. collected in different coastal sites of Ghana. The best matches for the individual markers (UPA, LSU, and COI) are noted with their GenBank accession numbers, and the publisher of the sequence. The accession numbers in italic text are the reference H. musciformis sequences from locations around the world. The individual barcode sequences were pairwise aligned (BLAST) using the closest match of the reference sequence (H. musciformis UPA: KP725300; LSU: HQ421909; COI: KP725276).
Country/RegionGenBank Accession Numbers (Identity)References
UPA(ID)LSU (ID)COI (ID)
Ahwiam, GhanaKP72530099%HQ42190999%KP72527698.9%[2,40,41]
Apam, GhanaKP72530099%HQ42190999%KP72527698.7%[2,40,41]
Komenda, GhanaKP72530099%HQ42190999%KP72527699.2%[2,40,41]
Mighty Beach, GhanaKP72530099%HQ42190999%KP72527699.0%[2,40,41]
Mumford, GhanaKP72530099%HQ42190999%KP72527698.9%[2,40,41]
Old Ningo, GhanaKP72530099%HQ42190999%KP72527698.9%[2,40,41]
Shama, GhanaKP72530099%HQ42190999%KP72527698.9%[2,40,41]
Tema New Town KP72530099%HQ42190999%KP72527698.9%[2,40,41]
Prampram, GhanaKP72530099%HQ42190999%KP72527699.2%[2,40,41]
Sao Paulo, BrazilKP725300100%- KP725276100%[41]
Paraiba, BrazilKP725302100%- KP72527899%[41]
Salvador, Brazil- - KP72527799%[41]
HawaiiHQ42157899%HQ42179899%HQ42263095%[40]
HawaiiHQ42152099%HQ421909100%HQ42264695%[40]
Hawaii- HQ42231699%HQ42287695%[40]
ColumbiaKP72529999%- KP72527595%[2]
North Carolina- - KJ20207794%[42]
Italy- - KF71486994%[43]

