Article

Evolutionary Hotspots in the Mojave Desert

1
Geological Survey, Western Ecological Research Center, San Diego Field Station, 4165 Spruance Road, Suite 200, San Diego, CA 92101, USA
2
Geological Survey, Western Ecological Research Center, Las Vegas Field Station, 160 N. Stephanie, Henderson, NV 89074, USA
3
Florida Museum of Natural History, University of Florida. Gainesville, FL 32611, USA
4
Department of Biology, Utah Valley University, 800 W. University Pkwy, Orem, UT 84058, USA
5
Department of Biological Sciences, Humboldt State University, 1 Harpst Street, Arcata, CA 95521, USA
*
Author to whom correspondence should be addressed.
Present Address: Department of Biology, San Diego State University, 5500 Campanile Dr, San Diego, CA 92182, USA.
Present Address: Museu Nacional, Departamento de Vertebrados, Universidade Federal do Rio de Janeiro, Rio de Janeiro, RJ 20940-040, Brazil.
Diversity 2013, 5(2), 293-319; https://doi.org/10.3390/d5020293
Submission received: 1 March 2013 / Revised: 7 March 2013 / Accepted: 1 April 2013 / Published: 15 April 2013
(This article belongs to the Special Issue Biogeography and Biodiversity Conservation)

Abstract

:
Genetic diversity within species provides the raw material for adaptation and evolution. Just as regions of high species diversity are conservation targets, identifying regions containing high genetic diversity and divergence within and among populations may be important to protect future evolutionary potential. When multiple co-distributed species show spatial overlap in high genetic diversity and divergence, these regions can be considered evolutionary hotspots. We mapped spatial population genetic structure for 17 animal species across the Mojave Desert, USA. We analyzed these in concurrence and located 10 regions of high genetic diversity, divergence or both among species. These were mainly concentrated along the western and southern boundaries where ecotones between mountain, grassland and desert habitat are prevalent, and along the Colorado River. We evaluated the extent to which these hotspots overlapped protected lands and utility-scale renewable energy development projects of the Bureau of Land Management. While 30–40% of the total hotspot area was categorized as protected, between 3–7% overlapped with proposed renewable energy project footprints, and up to 17% overlapped with project footprints combined with transmission corridors. Overlap of evolutionary hotspots with renewable energy development mainly occurred in 6 of the 10 identified hotspots. Resulting GIS-based maps can be incorporated into ongoing landscape planning efforts and highlight specific regions where further investigation of impacts to population persistence and genetic connectivity may be warranted.

1. Introduction

The genetic diversity within a species represents a fundamental level of biodiversity. It provides the basis for phenotypic variation and adaptation, and underlies the evolutionary processes of lineage diversification and speciation that contribute to the patterns of species-, community- and ecosystem- level biodiversity evident today. To protect species-level biodiversity into the future, evolutionary processes must also be protected [1,2,3]. By examining and mapping patterns of intraspecific genetic diversity across a landscape, regions with high evolutionary potential can be identified, where diversification and speciation may be more likely to occur [4,5,6]. Herein, we characterize evolutionary potential in terms of interpopulation genetic divergence and intrapopulation genetic diversity. Geographic areas that support divergent populations may harbor greater evolutionary potential, as they can represent places where divergent lineages now meet (suture zones) or reflect abiotic drivers of adaptive variation (e.g., an ecotone of steep environmental gradients). High levels of intrapopulation genetic diversity may also provide a rich resource for evolutionary resilience, and can reflect large effective population sizes [7,8,9], the presence of a historical refuge with environmentally stable conditions [10], or a zone of mixing between previously isolated gene pools [11,12]. Conversely, low or reduced genetic diversity is generally associated with reductions in fitness and survival [13,14]. Comparative phylogeographic analyses have repeatedly shown that geographic barriers or past geological processes and climate alterations have left similar signatures on the genetic structure of populations across entire communities [15,16,17,18,19,20]. When regions of high genetic divergence and diversity overlap for multiple species, these can be considered to be evolutionary hotspots. Protection of these hotspots may be important for preserving the process of lineage diversification and may impart resilience to changing environmental conditions and selective pressures [21,22].
Determining the locations of evolutionary hotspots may be particularly informative in regions where development pressures are growing, and land use planning efforts include conservation goals. In the Mojave Desert for example, widespread development of utility scale renewable energy facilities, transmission corridors, and associated infrastructure has been proposed and is being implemented, and land use planning strategies that balance renewable energy production with other land use and conservation goals are currently being devised. The Mojave Desert is the smallest of the four North American deserts, and is generally characterized by broad valleys with alluvial fan complexes, playas and dunes that are separated by plateaus and rugged mountain ranges. Major vegetation communities in the valleys are dominated by mixed shrublands while mountain slopes are dominated by woodlands [23,24,25].
The biogeographic history of the Mojave is complex. The modern desert environment in the Mojave is young; however, the first desert conditions originated approximately 5 million years ago (Ma) [26] and have fluctuated since that time with changing climatic conditions. Warm desert vegetation may only have become extensive through the region over the last 12,000 years [27]. However, in a recent analysis of multiple arid-adapted small animal species in the Mojave and Sonoran Deserts, we found that many were present prior to this time, with divergence estimates for Mojave lineages ranging from 0.5 to 11.5 Ma [20], and indicating that genetic structure within desert adapted animal species has likely been influenced by expanding and contracting habitat and other isolating factors that have developed over this time period. In addition to climatic fluctuations, inundation and mountain uplift have influenced the Mojave Desert biota through time. In the late Miocene—late Pliocene (10–4 Ma) inundation events flooded the Gulf of California through the Colorado Desert region and contributed to the early Colorado River system, isolating the Mojave Desert from the Sonoran Desert [28,29]. Uplift of the Sierra Nevada and Transverse Mountain Ranges, between 5–2 Ma, reversed the flow of the Mojave River to drain into the Mojave Basin and created rain shadows to the east. During the Pleistocene, between 1.2–0.5 Ma, the Mojave River slowly advanced, filling playas and basins. During glacial-interglacial cycles that followed, the Mojave oscillated between a lacustrine and dry system. During the last glacial maximum, the Mojave region was dominated by a fluvial-lacustrine system [30] and arid adapted taxa were likely isolated in small refugia [31]. Piñon-juniper woodlands dominated the region [32], but eventually retreated as warming and drying trends intensified during the Holocene.
In modern times, human land use and modification in the arid lands of the western United States have further altered ecosystems, and have intensified in recent decades [33]. In the Mojave Desert, urbanization, agriculture, transportation networks, military operations and energy production have already transformed sections of the landscape with impacts to wildlife [34,35]. Further land use change is projected in this region, particularly utility-scale renewable energy development (USRED) on federal lands in response to federal and state goals and mandates for renewable energy production (e.g., the American Recovery and Reinvestment Act of 2009, CA Executive Order S-14-08 and CA Senate Bill X1-2). Increasing production of renewable energy will have benefits in curtailing greenhouse gas emissions, and promoting energy independence and economic growth, but development of USRED facilities, added transmission corridors, and their associated infrastructure may negatively impact local wildlife through habitat loss and fragmentation. Given the projected scale and rate of USRED development in the desert southwest, land use planning efforts must balance energy production and delivery goals with other land use and conservation priorities (e.g., California Desert Renewable Energy Conservation Plan). Additionally, agencies tasked with natural resource and wildlife management must understand potential impacts of planned development to local species and systems for mitigation and adaptive management purposes.
The focus of this study was to map patterns of intraspecific genetic divergence and diversity for multiple species throughout the Mojave Desert to locate evolutionary hotspots, where multiple species may have high evolutionary potential. We evaluated whether identified hotspots fell within protected lands, or overlapped with current and proposed USRED project sites and utility corridors. Resulting GIS-based maps may inform current landscape-based planning efforts, and help direct future investigations to particular regions of interest in the Mojave Desert and bordering ecoregions.

2. Background and Methods
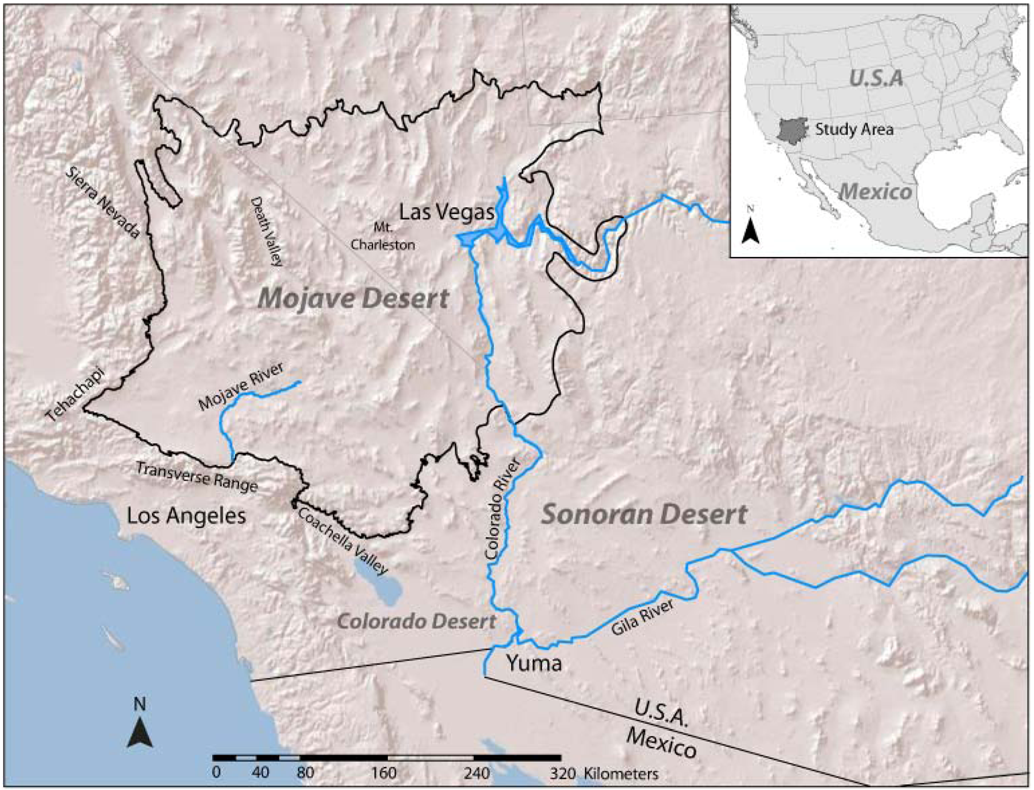
2.1. Study Region

This study was conducted in the Mojave Desert, using the spatial definition from the U.S. Environmental Protection Agency (EPA) Mojave Basin and Range Level III Ecoregion [36]. The Mojave ranges in elevation from 146 m below sea level (Death Valley, CA, USA) to over 3,633 m (Mount Charleston, NV, USA). Precipitation in the Mojave ranges from 100 to 350 mm per year, and shows a strong longitudinal trend, with the western portions of the Mojave receiving more precipitation in the winter, and the eastern portions receiving increased precipitation in late summer. Temperatures range from below 0 °C in the winter months to over 54 °C in the summer months, and vary diurnally and geographically. We buffered the EPA Mojave Basin and Range Ecoregion by 10 km to ensure that our analyses covered all of the Mojave Desert, resulting in a study area of approximately 150,000 km2 (Figure 1).
Figure 1. Mojave Desert study region including major geographic features.
Diversity 05 00293 g001

2.2. Compiling Genetic Data

We used previously published genetic datasets with spatially explicit sampling across the Mojave Desert. Additionally, some genetic data were collected for inclusion in the present study (see methods and database accession numbers in Appendix 1). The resulting dataset included 17 wildlife species. These included herpetofauna: Anaxyrus punctatus [37], Chionactis occipitalis (Appendix 1) [38], Crotaphytus bicinctores [39], Dipsosaurus dorsalis dorsalis (Appendix 1), Gopherus agassizii [40,41], Lichanura trivirgata [42], Plestiodon gilberti [43], Sceloporus magister [44], Uma scoparia (Appendix 1) [45], Xantusia vigilis [46]; mammals: Chaetodipus penicillatus [31], Ovis canadensis [47], Perognathus longimembris [48], Thomomys bottae [49], Xerospermophilus mohavensis [50,51]; and invertebrates: Homalonychus selenopoides [52], Homalonychus theologus [52] (Table 1). Most of the herpetofauna, small mammals and invertebrates comprise distinct lineages endemic to the Mojave Desert [20,45,51,53]. Species vary in habitat preference and ecology, and four species (G. agassizii, O. canadensis, U. scoparia and X. mohavensis) are federally or state listed as endangered, threatened or species of special concern, or include listed population segments.
Genetic data consisted mainly of mitochondrial sequence data, which were available for all species, with nuclear sequence data or microsatellite data available for a subset of six species (Table 1). Alignments for all sequence datasets were obtained via CLUSTAL-W [54], as implemented in MEGA 4.0 [55]. Sequence data were analyzed in ARLEQUIN 3.5 [56]. For consistency, all sequence-based analyses were conducted assuming a Tamura and Nei [57] model of nucleotide evolution. For microsatellite data, allelic richness and heterozygosity were estimated in MSA [58]. Whenever possible we incorporated data from multiple loci, as there are limitations to inferring population structure and diversity from mtDNA or any single locus [59,60]. We also relied upon multiple taxa rather than multiple loci to cross validate observed patterns. This approach is consistent with our goal to uncover regional diversity patterns.

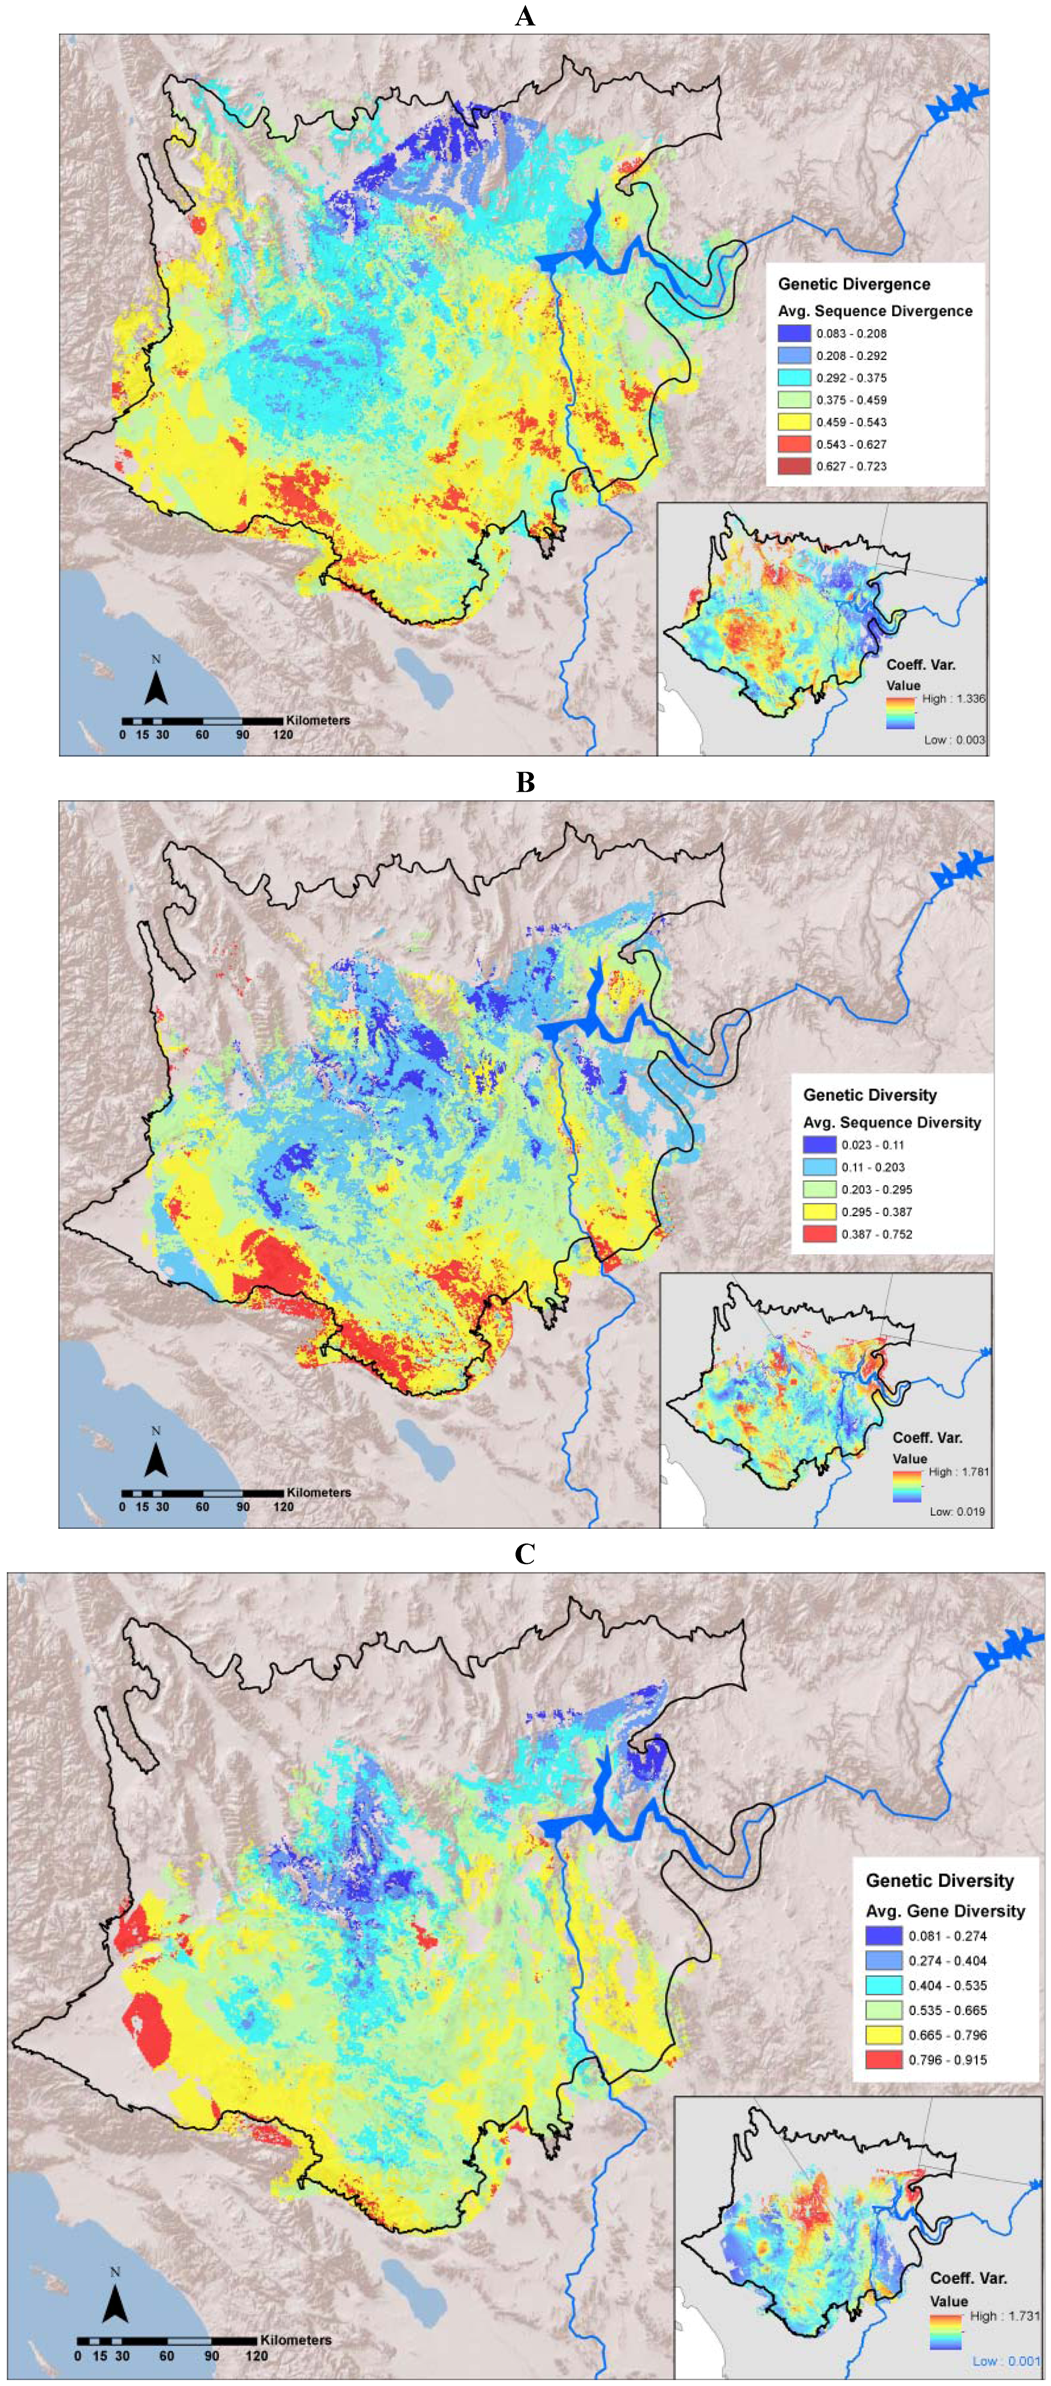
2.3. Mapping Divergence Landscapes

We used a phylogeographic approach to map patterns of genetic divergence estimated from mtDNA (and when available nuclear) sequences within species. For each species, genetic divergence landscapes were mapped in a Geographic Information System (GIS) based on pairwise genetic divergence among collection locations defined by the original study authors [6]. Sequence divergence was calculated as DA, Nei’s net number of nucleotide differences between each pair of collection locations, where the average number of differences between individuals among locations is corrected for the average number of differences within each location [61]. For datasets where multiple loci were sequenced, pairwise distances were averaged across loci after normalization. We tested for a signal of increasing genetic differentiation with increasing geographic distance (or Isolation by Distance; IBD) among sampling locations using reduced major axis regression as implemented in IBDWS 3.16 [62]. For species where statistically significant IBD was detected, we used the regression residuals rather than raw genetic divergence values to create divergence landscapes, in order to highlight locations where divergence was high while accounting for variation in the geographic distance among sampling points.
Table 1. Species and genetic datasets examined. The number of sampling locations within the study region and mean number of individuals sampled per location are given for divergence and diversity estimates. Numbers for gene diversity estimates based on microsatellite markers are provided in parentheses. NI denotes not included.
SpeciesGenetic MarkersDivergence Sampling Locations Divergence Mean NDiversity Sampling LocationsDiversity Mean N
Herpetofauna
Anaxyrus punctatus (red-spotted toad)mtDNA232.11114.36
Chionactis occipitalis (shovel-nosed snake)mtDNA, msats331.128 (7)4.38 (3.71)
Crotaphytus bicinctores (collared lizard)mtDNA241.02NINI
Dipsosaurus dorsalis dorsalis (northern desert iguana)mtDNA 81NINI
Gopherus agassizii (desert tortoise)mtDNA , msats138.9313 (24)8.93 (28.83)
Lichanura trivirgata (rosy boa)mtDNA101.9354.2
Plestiodon gilberti (Gilbert’s skink)mtDNA 421.11123.33
Sceloporus magister (desert spiny lizard) mtDNA, nuDNA 131.172.14
Uma scoparia (fringe-toed lizard)mtDNA, nuDNA 153.6153.6
Xantusia vigilis desert night lizard)mtDNA803.46298.9
Invertebrates
Homalonychus selenopoides (ground-dwelling spider)mtDNA62.6762.67
Homalonychus theologus (ground-dwelling spider).mtDNA 142.61103.3
Mammals
Chaetodipus penicillatus (desert pocket mouse)mtDNA 224.34138.15
Ovis canadensis (bighorn sheep)mtDNA, msats2613.9626 (26) 13.96 (13.96)
Perognathus longimembris (little pocket mouse)mtDNA122.2456.2
Thomomys bottae (pocket gopher)mtDNA71NINI
Xerospermophilus mohavensis (Mohave ground squirrel)mtDNA, msats114.0911 (12)4.09 (21.08)
Genetic distances or residual distances were visualized as genetic landscapes in ArcGIS 9.3, using the Genetic Landscapes Toolbox [63]. Divergence landscapes were created using the Single Species Divergence Tool. Pairwise genetic divergence values (or residuals) were mapped to the geographic midpoints between collection locations, as described and employed in previous visualization methods [64,65]. A surface was interpolated from the midpoints using Inverse Distance Weighted interpolation (power = 2, variable search radius with 12 points, grid cell size 1 km2). To avoid extrapolating beyond the original collection locations, individual species surfaces were clipped to the spatial extent of collection locations.
Finally, we masked interpolated genetic landscapes with suitable habitat derived from habitat suitability models created or obtained for each species. Functionally, this allowed us to focus on locations where genetic divergence was high across suitable (and potentially occupied) habitat, highlighting regions of potential lineage and population re-contact (or suture zones) rather than current geographic barriers. For all but one species, (O. canadensis), habitat suitability was statistically modeled from presence data using generalized additive modeling, maximum entropy (MaxEnt) [66], or both. Full modeling methods and results are available elsewhere [67,68,69], and so are only generally summarized here. Species occurrence records were obtained from online public databases for museum collections (VertNet, HerpNET, and MaNIS), and other regional data sources. For each species, conceptual models of potential habitat requirements were developed to identify the environmental covariates thought to influence their geographic distribution. These covariate layers were represented in a GIS as spatial raster layers, with a 1km2 grid cell size. Model performance was evaluated using the receiver operator curve statistic (AUC) [70,71], Boyce Index (BI) [72], Akaike Information Criterion (AIC) [73,74] and Bayesian Information Criterion (BIC) [75] test statistics, and environmental response curves were visually assessed. Models that ranked high based on these criteria were then averaged into a single final habitat suitability map for each species. Finally, we reclassified the averaged habitat suitability maps into binary representations of suitable/unsuitable habitat using the 5th percentile of habitat suitability scores from the occurrence localities [76]. For O. canadensis, a statistical habitat suitability model encompassing the study region was not available at the time of analysis. An expert opinion potential habitat model [77], rasterized at a 1 km2 grid cell size, was used to mask genetic landscapes instead.
To highlight areas of congruence among species, the genetic divergence landscapes for all taxa were averaged into a single multi-species genetic landscape. To assure that each species received equal weighting in the multi-species genetic landscape, we re-scaled individual species divergence landscapes by dividing each cell value by the maximum. Because the spatial coverage of available genetic data varied among species, the number of species represented in each 1 km2 grid cell of the multi-species genetic landscape also varied. To assess multi-species concordance, we clipped the multi-species genetic landscape extent to areas with coverage for three or more species. We considered the most divergent cells in the multi-species genetic landscape to be greater than 1.5 standard deviations from the mean cell value [6]. Single species genetic divergence landscapes were then visually examined in relation to the average landscape to determine which species contributed to divergent areas. To further assess variation across individual species landscapes that contributed to the average landscape, we also calculated the coefficient of variation among single species landscapes, calculated as the standard deviation divided by the mean.

2.4. Creating Diversity Landscapes

Diversity landscapes were created from genetic diversity estimates within sampling locations. To maximize the number of individuals grouped per sampling location, we grouped sampling locations that were within 20 km of one another that were not divided by potential barriers (e.g., rivers, mountains, highways, etc.). New population point locations were assigned as the midpoints of grouped sampling locations. All remaining singleton sampling locations were excluded from further analyses. Genetic diversity was calculated in two ways. For sequence data, we calculated “sequence diversity” as the average sequence divergence among individuals within a population as πi, under the Tamura and Nei model of nucleotide evolution [57]. This statistic is less biased by differences in sample size among populations than others such as the number of alleles or segregating sites [78]. For species for which the majority of sampling locations contained three or more individuals, we also calculated “gene diversity” for sequence datasets [79]. For haplotypic data this statistic is defined as the probability that two randomly chosen haplotypes are different in the sample, and is equivalent to expected heterozygosity for diploid data. For microsatellite datasets we calculated diversity as expected heterozygosity (HE). Gene diversity and HE are different from sequence diversity in that they focus on the number of gene copies, but do not contain information on the relative divergence of gene copies. For species where mtDNA sequences and multiple microsatellite loci were available, we chose to model gene diversity from microsatellites (HE) as multiple loci should give a better representation of levels of genomic diversity within a species.
Diversity landscapes were created using IDW interpolation in the Genetic Landscapes GIS Toolbox. Diversity values are specific to their population or collection location and so were mapped to their population locations, rather than to the midpoints between locations as done in divergence mapping. As with divergence landscapes, individual species surfaces were clipped to the extent of the collection locations, and suitable habitat was used to bound the analyses. Finally, diversity landscapes (sequence diversity, or gene diversity/HE) were averaged among species and the coefficient of variation was also calculated. Single species genetic diversity landscapes were visually examined to determine which species contributed to the most divergent areas on the average landscapes.

2.5. Assessing Protected Status and Vulnerability

Average genetic diversity and divergence surfaces were assessed in combination with land status boundaries and USRED boundaries to determine if regions of high genetic divergence and diversity fell within lands we considered protected or at-risk, or within USRED project footprints or transmission corridors. A land status layer was compiled for the study area using a regional land management/ownership map categorized into three status levels: “Protected”, “Uncertain” or “At-Risk”. The land management and ownership maps were obtained from the Bureau of Land Management (BLM) for California, Nevada, Arizona and Utah. We considered areas where the administrative status of land parcels was generally mandated to protect or preserve natural resources and ecosystems present as “Protected”. Land parcels that we categorized as “At-Risk” had administrative mandates that allow land uses that are incompatible with preserving habitat for our focal species—even if portions of those parcels are currently undisturbed or occupied by our focal species. Finally, the “Uncertain” status designates land parcels for which the effect of administrative status is currently unknown. Lands that we categorized as “Protected” included: BLM—Areas of Critical Environmental Concern and National Conservation Areas, U.S. Fish and Wildlife Service refuges, National Park Service lands, State wildlife departments, and State Parks and Wilderness Areas. Lands having “Uncertain” status included: U.S. Department of Energy, State lands, U.S. Forest Service lands, and Wilderness Study Areas. And finally, lands that we categorized as “At-Risk” were: BLM Unclassified lands (lands that do not have special designations other than multiple use), Bureau of Reclamation, Department of Defense, local municipality and county government, Off-Highway Vehicle areas, and private property.
Shapefiles of current and proposed USRED facilities mapped by BLM in California, Nevada and parts of Arizona and Utah were provided by the Renewable Energy Project Managers for the Southern Nevada and the California Desert Districts of the BLM, or were obtained from the Solar Energy Development Programmatic Environmental Impact Statement [80]. Footprints of pending USRED identified by BLM were compiled only for BLM lands, while development on private or state owned land are not represented. These data are not readily available, and were not included in our analysis. We also compiled areas that are designated for transmission corridors under the California Desert Conservation Area Plan of 1980 [81], and the West-wide Designation of Energy Corridors [82]. All files were converted into raster format at a 1 km2 grid cell size and overlaid on average genetic landscapes, and to regions of highest divergence and diversity (categorized as 1.5 standard deviations from mean values). Because USRED project sites and attendant transmission lines will likely have different impacts on wildlife, we examined these layers separately and in combination.

3. Results and Discussion

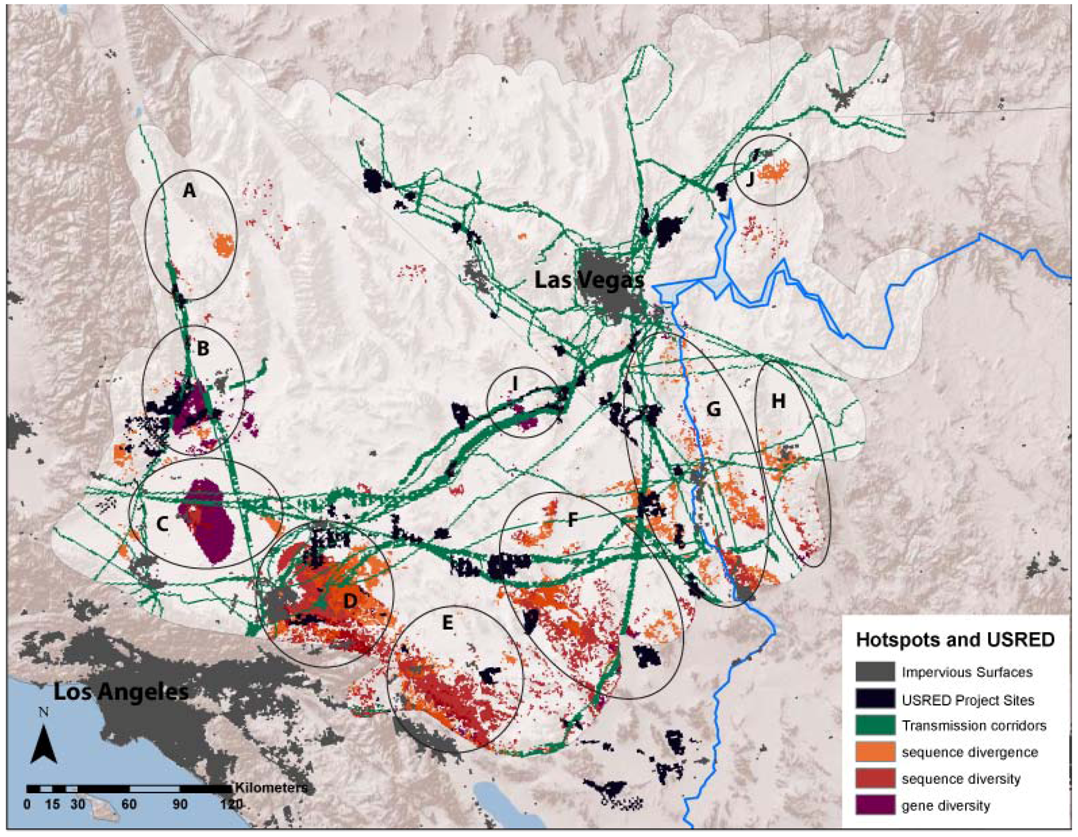
3.1. Evolutionary Hotspots

The average divergence landscape encompassed 110,089 km2 after clipping to the extent with three or more species overlapping, representing 73% of the study area. Data were lacking in the most northern and western portions of the study region (Figure 2A). The most divergent areas (categorized as greater than 1.5 standard deviations above the mean) encompassed 4,864 km2 or 4.4% of the analyzed area. We expected highest areas of divergence across habitat transition zones and our results generally concur with this, as hotspots generally ring the ecoregion. We identified 10 locations with highest levels of genetic divergence (Table 2; Figure 3 labeled regions A-J). These hotspots varied in the number and composition of contributing individual species (Table 2). Concordance was greatest in the Colorado River hotspot, with 10 species showing high divergence in this region, while the Ivanpah Valley and Virgin Mountains hotspots reflect high divergence in only one species each, G. agassizii and A. punctatus, respectively. However, the Ivanpah hotspot was also a region of high gene diversity in several other species examined. While relatively few species had high sequence divergence or diversity in the Virgin Mountains, this region has been previously identified as a zone of secondary contact and hybridization in amphibians [37], a group that is only represented by one species in our dataset. Across all species, variation among datasets was generally highest in the central portion of the study region. (Figure 2A inset).
Table 2. Identified divergence and diversity hotspots and individual species contributing to each hotspot. Species codes refer to the first two letters of the genus and species name (full names provided in the table footer). Geographic and geological factors that may have contributed to high levels of genetic divergence and diversity within each region are also listed.
Map CodePlace NameDivergenceSequence DiversityGene DiversityPossible Historical Isolating Factors
ADunmovin - Coso JunctionPLGI, XEMOXEMOPLGI, XAVITransition from Mojave to Owens Valley
BSierra -Tehachapi TransitionPLGI, THBO, XAVIPELO, GOAG, XEMOCHOC, PLGI, XAVI, XEMOTransition from Mojave to large mountains in the west
CAntelope Valley - Mojave Desert TransitionPELO, PLGI, THBO, XEMOXEMOPELO, PLGI, THBO, XAVI, XEMOTransition from western grasslands to eastern scrublands
DOrd Mountains - Lucerne ValleyCHPE, PELO, SCMA, THBO, XAVIPLGI, XAVIPLGI, XAVIHistoric barrier formed by Mojave River
EIndio Hills - Little San Bernardino MountainsDIDO, HOTH, LITR, PELO, PLGI, THBO, XAVIHOTH, LITR, PELO, SCMA, XAVICHPE, HOTH, LITR, OVCA, PELO, PLGITransition from low Sonoran/Colorado desert (Coachella Valley) into high desert of Little San Bernardino Mountains.
FPluvial Lakes (Bristol/Cadiz/Danby)HOTH, OVCA, SCMA, THBO, UMSC, XEMOHOSE, OVCA, SCMA, UMSCANPU, CHOC, CHPE, OVCA, UMSC, XAVIHistoric barrier across low elevation lakes, Mojave/Sonoran Transition
GColorado River Mountains (Mojave/Black Mountains)ANPU, CHOC, CRBI, DIDO, HOSE, HOTH, LITR, OVCA, PLGI, SCMACHPEANPU, CHPE, GOAGBarrier across river and/or mountains on eastern side of river
HSacramento-Detrital ValleyDIDO, HOSECHPE, HOSECHPE, XAVILow valley transition between Mojave and Sonoran desert
IIvanpah ValleyGOAGCHOC, GOAG, OVCA, XAVIHistoric barrier across low elevation lakes
JVirgin MountainsANPUANPU, GOAG Barrier between Virgin Valley and Shivwits Plateau
ANPU Anaxyrus punctatus, CHPE: Chaetodipus penicillatus CHOC: Chionactis occipitalis, CRBI: Crotaphytus bicinctores, DIDO: Dipsosaurus dorsalis, GOAG: Gopherus agassizii, HOSE: Homalonychus selenopoides, HOTH: Homalonychus theologus, LITR: Lichanura trivirgata, OVCA: Ovis canadensis; PELO: Perognathus longimembris, PLGI: Plestiodon gilberti, SCMA: Sceloporus magister, UMSC: Uma scoparia, THBO: Thomomys bottae, XAVI: Xantusia vigilis, XEMO Xerospermophilus mohavensis.
Figure 2. (A): Average sequence divergence for 17 animal species; (B): Average sequence diversity for 14 animal species; (C): Average gene diversity for 13 animal species. The insets in each figure show the coefficient of variation among individual species layers included in each average.
Diversity 05 00293 g002
Sequence diversity (π) was averaged across 14 species (A. punctatus, C. occipitalis, C. penicillatus, G. agassizii, H. selenopoides, H. theologus, L. trivirgata, O. canadensis, P. longimembris, P. gilberti, S. magister, U. scoparia, X. vigilis, and X. mohavensis). The remaining three species in our dataset (C. bicinctores, D. dorsalis, and T. bottae) were excluded from diversity analyses because only single individuals were sampled at disparate locations that could not be combined. The average sequence diversity landscape covered 87,982 km2 when clipped to include three or more species (Figure 2B). High sequence diversity hotspots encompassed 6,724 km2, or approximately 7.6% of the area. Sequence diversity hotspots were mainly concentrated along the western and southern boundaries of the Mojave Ecoregion and overlapped with regions of high divergence (Table 2, Figure 3). Individual species showed the greatest concordance at the Ord Mountain -Lucerne Valley hotspot with 5 species showing high sequence diversity (Table 2). Variation among species was generally greatest in the northeast portion of the study region, with patches throughout the central and southwest Mojave Desert (Figure 2B inset).
Gene diversity (heterozygosity) was averaged across 13 species (A. punctatus, C. occipitalis, C. penicillatus, G. agassizii, H. selenopoides, H. theologus, L. trivirgata, O. canadensis, P. longimembris, P. gilberti, S. magister, U. scoparia, X. vigilis, and X. mohavensis). Sceloporus magister was excluded because most sampling locations contained less than three individuals. The gene diversity average genetic landscape covered 71,468 km2 when clipped to the extent of three or more species and showed some geographical concordance with sequence divergence and diversity (Figure 2C). Highest diversity was concentrated along the western and southern ecoregional transition zones (Table 2, Figure 3). In addition, high average gene diversity was evident in the central Mojave near the Ivanpah Valley (Figure 4). The Indio Hills and Pluvial lakes hotspots represented the most species, with six species contributing to each (Table 2). Variation among datasets was generally greatest in the north central and northeastern Mojave Desert (Figure 2C inset).
Figure 3. Ten regional hotspots of sequence divergence, sequence diversity and gene diversity with relation to land conservation status in the Mojave Desert. Hotspots are A (Dunmovin–Coso Junction), B (Sierra–Tehachapi Transition Zone), C (Antelope Valley–Mojave Desert Transition), D (Ord Mountain–Lucerne Valley), E (Indio Hills–Little San Bernardino Mountains), F (Pluvial Lakes), G (Colorado River), H (Sacramento–Detrital Valley), I (Ivanpah Valley), and J (Virgin Mountains).
Diversity 05 00293 g003
The complex climatic and geological history of the Mojave Desert likely contributed to the formation of evolutionary hotspot regions detected. Hotspots are clustered in locations along the western and southern regions of the Mojave Desert, where past inundation, uplift, and the cyclical formation of riverine and lacustrine systems may have isolated lineages [50]. These areas may represent secondary contact zones or “suture zones” for previously isolated lineages across multiple species [83,84]. Regions of high gene diversity and heterozygosity may also reflect large effective population sizes [7,8,9,85] or refugia [10]. In addition to historical isolating events, current environmental conditions may contribute to diversity and divergence hotspots in regions with steep environmental gradients (e.g., steep ecotones between mountains and basins).
This study focused on patterns of genetic variation that are presumed to be selectively neutral. Clearly, the ultimate measure of evolutionary potential is genetic variation underlying traits that will be under selection in the future. Although higher intrapopulation genetic diversity measured at neutral loci can be associated with higher fitness and lower extinction rates [14,86], correlations between neutral and adaptive variation are not always strong [87,88]. However, inferences of adaptive potential are strengthened when the genetic hotspots overlap spatially with zones of lineage recontact and/or steep environmental gradients. Hybridization between previously isolated and divergent lineages or populations can create novel gene combinations that can facilitate speciation and adaptive evolution in some cases [11,89,90,91,92,93]. Adaptive variation is also often concentrated across ecological transitions [94,95,96]. Although not included in this study, previous genetic and morphological analysis of the Neotoma lepida group revealed zones of lineage recontact and hybridization between coastal and desert morphological groups in Kelso Valley (near hotspot B) and in Morongo Valley (hotspot E) [97]. Likewise, in the Mojave Desert annual Linanthus parrayae, dimorphism in flower color occurs in local populations found within hotspot D near Lucerne Valley and Victorville, and along the base of the San Gabriel Mountains near Palmdale [98]. Flowers are white throughout the majority of the species range, but blue flowers occur with variable frequencies in these mixed populations. Color dimorphism seems to be maintained by temporally variable selection associated with annual rainfall patterns and differential water use [99,100]. The adaptive potential stored in ecotonal evolutionary hotspots is likely to become increasingly important as climatic conditions change in the future, and environmental gradients intensify, weaken or shift spatially [22,101,102]. Other studies have also highlighted regions of the Mojave. Our broader analysis encompassing both the Mojave and Sonoran Deserts and including a subset of the species considered here also highlighted hotspots of high neutral diversity and divergence near Ord Mountain—Lucerne Valley, along the Mojave/Sonoran ecotone and across the Colorado River (corresponding to hotspots D, E, F and G in Figure 3) [20]. Finally, in an independent analysis focusing on California plants, Kraft et al. [5] recognized the Mojave as an important region of evolutionary potential in California, as it contains some of the youngest neoendemic vascular plants.
Because our genetic landscapes are interpolations from point data, the resulting patterns are highly dependent on the number and dispersion of collection locations across the landscape. When individual species datasets vary in sampling location and density (as with those compiled for this study), undoubtedly, uncertainty in the spatial location of hotspots is introduced. With this in mind, we caution against using the resulting hotspots maps for pinpointing exact locations for conservation purposes, rather we feel their utility is greatest for more broadly identifying regions of evolutionary potential within the ecoregion.

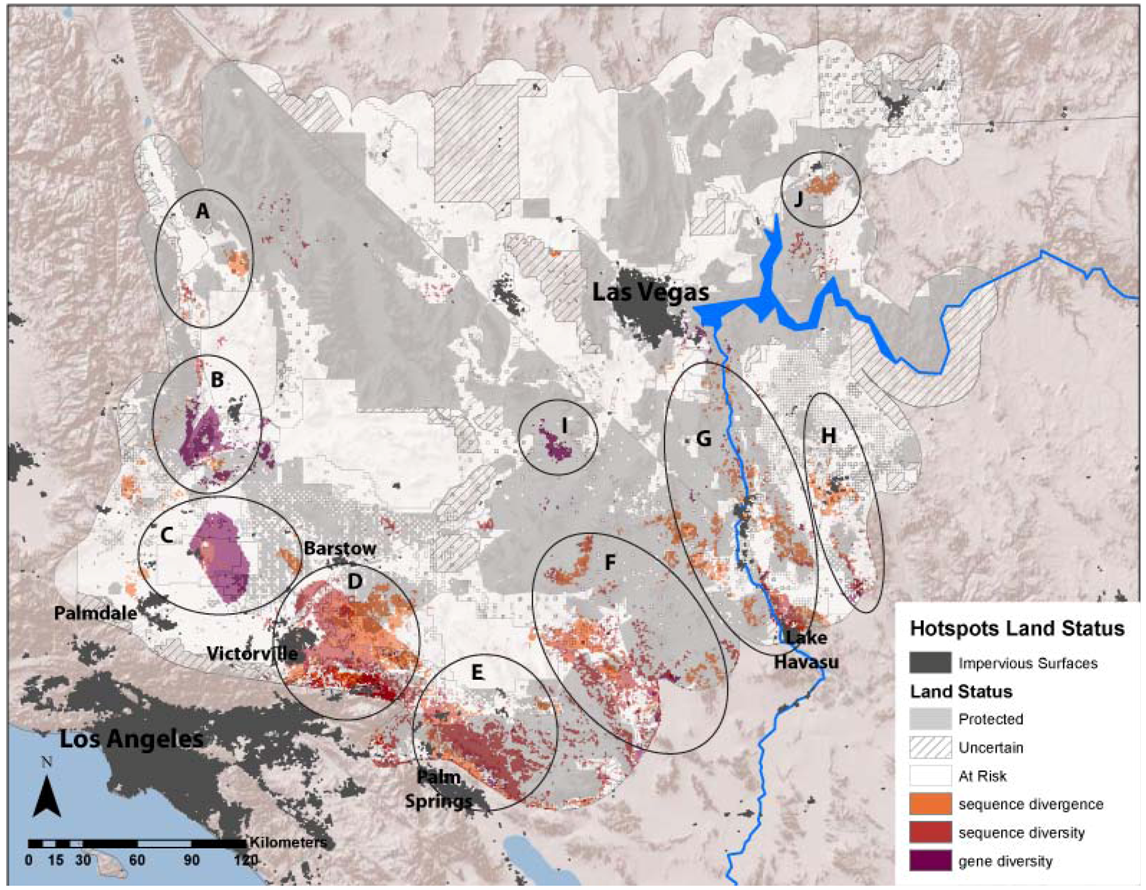
3.2. Protection and Vulnerability of Hotspots

All three averaged genetic landscapes had slightly more total area categorized as “At-Risk” than “Protected”, although mean scores for both categories did not vary substantially (Table 3). For divergence and diversity hotspots, a greater percentage were considered “At-Risk” versus “Protected” (divergence hotspots: 55% “At-Risk”, 40% “Protected”; sequence diversity hotspots: 53% “At-Risk”, 39% “Protected”; gene diversity hotspots: 63% “At-Risk”, 29% “Protected”; Table 3). Six identified hotspots were located primarily outside of protected lands, including hotspot A (Dunmovin–Coso Junction), B (Sierra–Tehachapi Transition Zone), C (Antelope Valley–Mojave Desert Transition), D (Ord Mountain–Lucerne Valley), F (Pluvial Lakes), and H (Sacramento and Detrital Valleys, Figure 3).
Mapped USRED project footprints encompassed approximately 3,547 km2 across the study region, while transmission corridors occupied approximately 14,483 km2. The area of overlap of average divergence and diversity landscapes with USRED project footprints ranged from 2,563 to 3,209 km2 and overlap with transmission corridors ranged from 8,503 to 10,733 km2 (Table 3). USRED footprints overlapped with 3–7% of the area designated as divergence or diversity hotspots, but this rose to 10–17% with the inclusion of transmission corridors (Table 3). Certain hotspot regions overlapped more than others. Hotspots B (Sierra–Tehachapi Transition Zone), D (Ord Mountain–Lucerne Valley), F (Pluvial Lakes) and G (Colorado River) showed the most overlap with project footprints, while Hotspots C (Antelope Valley–Mojave Transition) and I (Ivanpah Valley), showed the most overlap with transmission corridors. In total, 6 of the 10 identified divergence and diversity hotspot regions have the potential to be impacted by energy and infrastructure development (Figure 4).
Figure 4. Ten regional hotspots of sequence divergence, sequence diversity and gene diversity overlaid with existing and pending utility scale renewable energy development (USRED) project site footprints and energy corridors. Impervious surfaces represent existing urban development.
Diversity 05 00293 g004
Table 3. Overlap between divergence and diversity landscapes, land status, proposed utility scale renewable energy development (USRED), and transmission corridors.
LayerDivergence Sequence Diversity Gene Diversity
Area (km2)Mean ScoreScore Range% Hotspot AreaArea (km2)Mean ScoreScore Range% Hotspot AreaArea (km2)Mean ScoreScore Range% Hotspot Area
Total Layer110,0890.420.08–0.725%87,9820.250.02–0.757%71,4680.60.08–0.914%
“Protected” Lands47,4280.420.19–0.6940%37,7750.250.02–0.5839%32,3630.590.08–0.9129%
“Uncertain” Lands8,2750.390.10–0.645%5,2130.240.05–0.758%3,3880.560.13–0.878%
“At-Risk” Lands54,1880.420.08–0.7255%44,8810.250.02–0.6653%35,7090.610.10–0.9163%
USRED Footprint3,2090.440.08–0.674%2,9060.240.05–0.653%2,5630.580.27–0.917%
Transmission Footprint10,7330.430.09–0.6610%9,8630.240.03–0.678%8,5030.60.18–0.9112%
USRED + Transmission12,5540.430.08–0.6713%11,4770.240.03–0.6710%9,9700.60.18–0.9117%
Because evolutionary hotspots tend to occur in ecological transition zones, they may not necessarily be included in national and state parks, or other protected lands aimed at preserving exemplars of ecoregions and geomorphic provinces. We found that greater than half of the total area identified as divergence and diversity hotspots fell outside of designated protected lands. While less than 10% of the total area identified as diversity and divergence hotspots overlapped with current and pending USRED project sites, four hotspots showed substantial spatial overlap. When transmission corridors were included, overlap with hotspots increased up to 17%. Mapped energy corridors have high overlap with two additional hotspots in our study area. Given the potential impact of USRED in these areas, these six evolutionary hotspots may deserve further investigation, both in terms of habitat use and fine scale genetic structure across these regions, and in terms of specific impacts of USRED on wildlife populations in these regions.
While we have evaluated the spatial overlap between hotspot regions and planned renewable development, we do not have data on the extent to which these developments will directly impact individuals and populations in these locations. Perhaps of greatest importance to maintaining the functionality of evolutionary hotspots is mitigating the potential reduction of population size and connectivity due to habitat loss and fragmentation within and surrounding development footprints. Habitat disturbance within USRED project footprints may vary depending on the number and size of wind turbines or solar arrays placed at a site, vegetation clearing, access roads, fencing, and other project requirements [103]. Many of the mapped USRED projects currently slated for development within hotspot regions will generate wind energy. The documented effects of large scale wind energy farms on wildlife are varied. Research has largely focused on direct mortality of birds and bats from collisions [103,104], with impacts varying by life history and ecology of species [105,106], wind turbine type [106], and other specific site characteristics (e.g., region, layout design of the site, topology, weather, and lighting [107]). Direct effects on ground dwelling animals are largely unknown. Behavioral changes due to turbine noise have been documented in ground squirrel populations [108], but no differences were noted in individual growth rates and mortality in a population of desert tortoises on a wind farm when compared to other locations [109]. The effects of solar development projects on wildlife have not been well documented in the scientific literature [but see 80,110], and will likely vary extensively with the type of system and specific site management practices, although it should be noted that sites developed in the Mojave appear to have high levels of impact (e.g., blading with removal of all topsoil and vegetation, fencing, etc.). Associated USRED infrastructure including transmission corridors and road networks can affect connectivity [111,112], and may have a greater impact on connectivity in the Mojave than production sites themselves. Transmission corridors and surrounding right-of-ways throughout the Mojave Desert could encompass up to four times as much area as project footprints alone. In addition these crisscross through both protected and unprotected lands, further fragmenting the Mojave Desert. Over the long term, fragmentation and isolation may lead to loss of genetic diversity and increased divergence among sites, however this may take many generations to be measurable [113,114]. While transmission corridors and associated road networks may represent barriers to movement for some species, they may be permeable or even facilitate movement for others [115,116,117]. Variable disturbance characteristics can influence permeability (e.g., corridor width, grading, vegetation removal, paving, lighting, fencing, culverts, berms and traffic volume (reviewed in [103,112,118]). Transmission corridors and roads may also act as conduits for exotic and invasive species [119,120]. For example, power lines, roads and other linear right-of-ways provide nesting and perching sites for predatory birds, including the common raven, Corvus corax [121,122,123]. Large raven populations subsidized by human development in the Mojave Desert and elsewhere pose a threat to juvenile desert tortoises and other sensitive prey species [124]. Increased perch availability in xeric habitats has been studied elsewhere and shown to have a negative impact on certain prey species of lizards [125].
Future survey and genetic research efforts may better resolve patterns of genetic diversity in the Mojave Desert, and refine our assessment of evolutionary hotspots. Our initial work was opportunistic, relying mainly on previously conducted population genetic and phylogeographic studies. Increasing genetic sampling of additional species representing different ecotypes or species guilds, and gathering genomic data representative of both functional and selectively neutral diversity could provide greater resolution of population-level patterns across the landscape, and determine whether the hotspots identified here are indicative of a wider range of species, and how well these reflect patterns of adaptive genetic diversity. The lack of coverage in the northern Mojave represents a significant data gap. Because hotspots tend to occur at ecotones, the northern transition between the Mojave and Great Basin may also retain high genetic diversity. This region may be particularly important if climate change results in northward range shifts for some species [126,127]. Finally, focused surveys aimed at determining population status, fine-scale habitat suitability, and movement corridors within identified hotspot regions could further assess the potential site-specific impacts of USRED and other development to wildlife populations in these regions.

4. Conclusions

Throughout the Mojave Desert, we identified 10 regions where intraspecific genetic divergence and diversity were high for up to 17 species. Because genetic diversity underlies differentiation and adaptation, preserving regions with the greatest levels of genetic diversity and differentiation may help to preserve the evolutionary potential of these species. Thus we recognize these regions as evolutionary hotspots. While our analyses are coarse, we can generally assess where gaps in protection exist and where overlap with development may occur at a landscape-scale. Six of the 10 identified evolutionary hotspots show substantial overlap with existing and proposed renewable energy development sites and infrastructure. These results provide a working hypothesis for identifying regions of evolutionary significance and thus conservation importance in the Mojave. The compiled landscape-level, GIS-based maps of genetic information could be applied in ongoing regional conservation planning initiatives such as the Desert Renewable Energy Conservation Plan [128], the Landscape Conservation Cooperatives [129], and the U.S. Department of the Interior, Bureau of Land Management’s Landscape Approach to Managing Public Lands [130].

Acknowledgments

We thank all contributors of genetic and spatial data to this project, including James Andre, Randy Babb, Jeremiah Easter, Clint Epps, Bridgette Hagerty, Robert Hansen, Marshal Hedin, Jef Jaeger, Tereza Jezkova, Adam Leaché, Dean Leavitt, Marjorie Matocq, Jimmy McGuire, Daniel Mulcahy, Robert Murphy, James Patton, Kristeen Penrod, Tod Reeder, and Jonathan Q. Richmond. We are grateful to the herpetology collection managers at the MVZ CAS, and YAP for providing specimens. We also thank Jonathan Q. Richmond for reviewing conceptual and habitat models. Megan Lahti assisted with compiling museum records. Russell Scofield, Gregory Helseth, Lew Brownfield, Gregory Miller, and Peg Margosian assisted in locating solar and renewable energy project spatial data. We thank Andrew J. Bohonak, Kathleen Longshore, and three anonymous reviewers for their comments which greatly improved this manuscript. This work was supported by the Desert Manager’s Group, the Bureau of Land Management and the U.S. Geological Survey. The use of trade, product, or firm names in this publication does not imply endorsement by the U.S. Government.   

References

  1. Carvalho, S.B.; Brito, J.C.; Crespo, E.J.; Possingham, H.P. Incorporating evolutionary processes into conservation planning using species distribution data: A case study with the western Mediterranean herpetofauna. Divers. Distrib. 2011, 17, 408–421. [Google Scholar] [CrossRef]
  2. Cowling, R.M.; Pressey, R.L. Rapid plant diversification: Planning for an evolutionary future. Proc. Natl. Acad. Sci. USA 2001, 98, 5452–5457. [Google Scholar] [CrossRef]
  3. Prendergast, J.R.; Quinn, R.M.; Lawton, J.H. The gaps between theory and practice in selecting natural reserves. Conserv. Biol. 1999, 13, 484–492. [Google Scholar] [CrossRef]
  4. Davis, E.B.; Koo, M.S.; Conroy, C.; Patton, J.L.; Moritz, C. The California Hotspots Project: Identifying regions of rapid diversification of mammals. Mol. Ecol. 2008, 17, 120–138. [Google Scholar] [CrossRef]
  5. Kraft, N.J.B.; Baldwin, B.G.; Ackerly, D.D. Range size, taxon age and hotspots of neoendemism in the California flora. Divers. Distrib. 2010, 16, 403–413. [Google Scholar] [CrossRef]
  6. Vandergast, A.G.; Bohonak, A.J.; Hathaway, S.A.; Boys, J.; Fisher, R.N. Are hotspots of evolutionary potential adequately protected in southern California? Biol. Conserv. 2008, 141, 1648–1664. [Google Scholar] [CrossRef]
  7. Frankham, R. Relationship of genetic variation to population size in wildlife. Conserv. Biol. 1996, 10, 1500–1508. [Google Scholar]
  8. Mulligan, C.J.; Kitchen, A.; Miyamoto, M.M. Comment on “Population size does not influence mitochondrial genetic diversity in animals”. Science 2006, 314, 1390a. [Google Scholar] [CrossRef]
  9. Soulé, M. Allozyme variation: Its determinants in space and time. In Molecular Evolution; Ayala, F.J., Ed.; Sinauer: Sunderland, MA, USA, 1976; pp. 60–77. [Google Scholar]
  10. Carnaval, A.C.; Hickerson, M.J.; Haddad, C.F.B.; Rodrigues, M.T.; Moritz, C. Stability predicts genetic diversity in the Brazilian Atlantic forest hotspot. Science 2009, 323, 785–789. [Google Scholar] [CrossRef]
  11. Barton, N.H.; Halliday, R.B.; Hewitt, G.M. Rare electrophoretic variants in a hybrid zone. Heredity 1983, 50, 139–146. [Google Scholar] [CrossRef]
  12. Nettel, A.; Dood, R.S.; Afzal-Rafii, Z.; Tovilla-Hernandez, C. Genetic diversity enhanced by ancient introgression and secondary contact in East Pacific black mangroves. Mol. Ecol. 2008, 17, 2680–2690. [Google Scholar] [CrossRef]
  13. O’Brien, S.J.; Roelke, M.E.; Marker, L.; Newman, A.; Winkler, C.A.; Meltzer, D.; Colly, L.; Evermann, J.F.; Bush, M.; Wildt, D.E. Genetic basis for species vulnerability in the cheetah. Science 1985, 227, 1428–1434. [Google Scholar]
  14. Reed, D.H.; Frankham, R. Correlation between fitness and genetic diversity. Conserv. Biol. 2003, 17, 230–237. [Google Scholar] [CrossRef]
  15. Avise, J.C. Molecular population structure and the biogeographic history of a regional fauna: A case history with lessons for conservation biology. Oikos 1992, 63, 62–76. [Google Scholar] [CrossRef]
  16. Humphries, C.J.; Williams, P.H.; Vane-Wright, R.I. Measuring biodiversity value for conservation. Ann. Rev. Ecol. Syst. 1995, 26, 93–111. [Google Scholar]
  17. Moritz, C. Uses of molecular phylogenies for conservation. Philos. Trans. Royal Soc. London B Biol. Sci. 1995, 349, 113–118. [Google Scholar] [CrossRef]
  18. Moritz, C.; Faith, D.P. Comparative phylogeography and the identification of genetically divergent areas for conservation. Mol. Ecol. 1998, 7, 419–429. [Google Scholar] [CrossRef]
  19. Riddle, B.R.; Hafner, D.J. A step-wise approach to integrating phylogeographic and phylogenetic biogeographic perspectives on the history of a core North American warm deserts biota. J. Arid Environ. 2006, 66, 435–461. [Google Scholar] [CrossRef]
  20. Wood, D.A.; Vandergast, A.G.; Barr, K.R.; Inman, R.D.; Esque, T.C.; Nussear, K.E.; Fisher, R.N. Comparative phylogeography reveals deep lineages and regional evolutionary hotspots in the Mojave and Sonoran Deserts. Divers. Distrib. 2012. [Google Scholar] [CrossRef]
  21. Sgrò, C.M.; Lowe, A.J.; Hoffmann, A.A. Building evolutionary resilience for conserving biodiversity under climate change. Evolut. Appl. 2011, 4, 326–337. [Google Scholar] [CrossRef]
  22. Reusch, T.B.H.; Ehlers, A.; Hammerli, A.; Worm, B. Ecosystem recovery after climatic extremes enhanced by genotypic diversity. Proc. Natl. Acad. Sci. USA 2005, 102, 2826–2831. [Google Scholar] [CrossRef]
  23. Turner, R.M. Mohave Desertscrub. In Biotic Communities Southwestern United States and Northwestern Mexico; Brown, D.E., Ed.; University of Utah Press: Salt Lake City, UT, USA, 1994; pp. 157–168. [Google Scholar]
  24. Keeler-Wolf, T. Mojave Desert Scrub Vegetation. In Terrestrial Vegetation of California, 3rd; Barbour, M.G., Keeler-Wolf, T., Schoenherr, A.A., Eds.; University of California Press: Berkeley, CA, USA, 2007; pp. 609–656. [Google Scholar]
  25. Thorne, R.F.; Schoenherr, A.A.; Clements, C.D.; Young, J.A. Transmontane Coniferous Vegetation. In Terrestrial Vegetation of California, 3rd; Barbour, M.G., Keeler-Wolf, T., Schoenherr, A.A., Eds.; University of California Press: Berkeley, CA, USA, 2007; pp. 574–586. [Google Scholar]
  26. Axelrod, D.I. History of the Mediterranean Ecosystem in California. In Mediterranean Type Ecosystems: Origin and Structure; di Castri, F., Mooney, H.A., Eds.; Springer-Verlag: New York, NY, USA, 1973; pp. 225–277. [Google Scholar]
  27. Betancourt, J.L.; van Devender, T.R.; Martin, P.S. Packrat Middens: The Last 40,000 Years of Biotic Change; University of Arizona Press: Tucson, AZ, USA, 1990. [Google Scholar]
  28. Ivo, L. Late Cenozoic uplift of the southwestern Colorado Plateau and adjacent lower Colorado River region. Tectonophysics 1979, 61, 63–95. [Google Scholar] [CrossRef]
  29. McDougall, K.; Poore, R.; Matti, J. Age and paleoenvironment of the Imperial Formation near San Gorgonio Pass, southern California. J. Foraminiferal Res. 1999, 29, 4–25. [Google Scholar]
  30. Smith, G.I.; Street-Perrott, F.A. Pluvial lakes of the western United States. In Late-Quaternary Environments of the United States; Wright, H.E.J., Ed.; Longman Group, Limited: London, UK, 1983; Volume 1, pp. 190–212. [Google Scholar]
  31. Jezkova, T.; Jaeger, J.; Marshall, Z.; Riddle, B. Pleistocene impacts on the phylogeography of the desert pocket mouse (Chaetodipus penicillatus). J. Mammal. 2009, 90, 306–320. [Google Scholar] [CrossRef]
  32. Axelrod, D.I. Paleobotanical History of the Western Deserts. In Origin and Evolution of the Deserts; Wells, S.G., Haragan, D.R., Eds.; University of New Mexico Press: Albuquerque, NM, USA, 1983; pp. 113–129. [Google Scholar]
  33. Leu, M.; Hanser, S.E.; Knick, S.T. The human footprint in the west: A large-scale analysis of anthropogenic impacts. Ecol. Appl. 2008, 18, 1119–1139. [Google Scholar] [CrossRef]
  34. Lovich, J.E.; Bainbridge, D. Anthropogenic degradation of the southern California desert ecosystem and prospects for natural recovery and restoration. Environ. Manag. 1999, 24, 309–326. [Google Scholar] [CrossRef]
  35. Webb, R.H.; Fenstermaker, L.F.; Heaton, J.S.; Hughson, D.L.; Mcdonald, E.V.; Miller, D.M. The Mojave Desert Ecosystem Processes and Sustainability; University of Nevada Press: Reno, NV, USA, 2009; p. 481. [Google Scholar]
  36. Commission for Environmental Cooperation of North America, Ecological Regions of North America: Toward a Common Perspective. 1997; Unpublished report.
  37. Jaeger, J.R.; Riddle, B.R.; Bradford, D.F. Cryptic Neogene vicariance and Quaternary dispersal of the red-spotted toad (Bufo punctatus): Insights on the evolution of North American warm desert biotas. Mol. Ecol. 2005, 14, 3033–3048. [Google Scholar] [CrossRef]
  38. Wood, D.; Meik, J.; Holycross, A.; Fisher, R.; Vandergast, A. Molecular and phenotypic diversity in Chionactis occipitalis (Western shovel-nosed snake), with emphasis on the status of C. o. klauberi (Tucson shovel-nosed snake). Conserv. Genet. 2008, 9, 1489–1507. [Google Scholar] [CrossRef]
  39. McGuire, J.A.; Linkem, C.W.; Koo, M.S.; Hutchison, D.W.; Lappin, A.K.; Orange, D.I.; Lemos-Espinal, J.; Riddle, B.R.; Jaeger, J.R. Mitochondrial introgression and incomplete lineage sorting through space and time: phylogenetics of crotaphytid lizards. Evolution 2007, 61, 2879–2897. [Google Scholar] [CrossRef]
  40. Hagerty, B.E.; Nussear, K.E.; Esque, T.C.; Tracy, C.R. Making molehills out of mountains: landscape genetics of the Mojave Desert tortoise. Landscape Ecol. 2011, 26, 267–280. [Google Scholar] [CrossRef]
  41. Murphy, R.W.; Berry, K.H.; Edwards, T.; McLuckie, A.M. A genetic assessment of the recovery units for the Mojave population of the desert tortoise, Gopherus agassizii. Chelonian Conserv. Biol. 2007, 6, 229–251. [Google Scholar] [CrossRef]
  42. Wood, D.; Fisher, R.; Reeder, T. Novel patterns of historical isolation, dispersal, and secondary contact across Baja California in the rosy boa (Lichanura trivirgata). Mol. Phylogenet. Evol. 2008, 46, 484–502. [Google Scholar] [CrossRef]
  43. Richmond, J.; Jockusch, E. Body size evolution simultaneously creates and collapses species boundaries in a clade of scincid lizards. Proc. Royal Soc. B Biol. Sci. 2007, 274, 1701–1708. [Google Scholar] [CrossRef]
  44. Leaché, A.D.; Mulcahy, D.G. Phylogeny, divergence times and species limits of spiny lizards (Sceloporus magister species group) in western North American deserts and Baja California. Mol. Ecol. 2007, 16, 5216–5233. [Google Scholar] [CrossRef]
  45. Murphy, R.; Trepanier, T.; Morafka, D. Conservation genetics, evolution and distinct population segments of the Mojave fringe-toed lizard, Uma scoparia. J. Arid Environ. 2006, 67, 226–247. [Google Scholar] [CrossRef]
  46. Leavitt, D.H.; Bezy, R.L.; Crandall, K.A.; Sites, J.W., Jr. Multi-locus DNA sequence data reveal a history of deep cryptic vicariance and habitat-driven convergence in the desert night lizard Xantusia vigilis species complex (Squamata: Xantusiidae). Mol. Ecol. 2007, 16, 4455–4481. [Google Scholar] [CrossRef]
  47. Epps, C.W.; Palsboll, P.J.; Wehausen, J.D.; Roderick, G.K.; Ramey, R.R., II; McCullough, D.R. Highways block gene flow and cause a rapid decline in genetic diversity of desert bighorn sheep. Ecol. Lett. 2005, 8, 1029–1038. [Google Scholar] [CrossRef]
  48. Swei, A.; Brylski, P.V.; Spencer, W.D.; Dodd, S.C.; Patton, J.L. Hierarchical genetic structure in fragmented populations of the little pocket mouse (Perognathus longimembris) in southern California. Conserv. Genet. 2003, 4, 501–514. [Google Scholar] [CrossRef]
  49. lvarez-Castaneda, S. Phylogenetic structure of the Thomomys bottae-umbrinus complex in North America. Mol. Phylogenet. Evol. 2010, 54, 671–679. [Google Scholar] [CrossRef]
  50. Bell, K.C.; Hafner, D.J.; Leitner, P.; Matocq, M.D. Phylogeography of the ground squirrel subgenus Xerospermophilus and assembly of the Mojave Desert biota. J. Biogeogr. 2010, 37, 363–378. [Google Scholar] [CrossRef]
  51. Bell, K.C.; Matocq, M.D. Regional genetic subdivision in the Mohave ground squirrel: Evidence of historic isolation and ongoing connectivity in a Mojave Desert endemic. Anim. Conserv. 2010, 14, 371–381. [Google Scholar] [CrossRef]
  52. Crews, S.; Hedin, M. Studies of morphological and molecular phylogenetic divergence in spiders (Araneae: Homalonychus) from the American southwest, including divergence along the Baja California Peninsula. Mol. Phylogenet. Evol. 2006, 38, 470–487. [Google Scholar] [CrossRef]
  53. Murphy, R.W.; Berry, K.H.; Edwards, T.; Leviton, A.E.; Lathrop, A.; Riedle, J.D. The dazed and confused identity of Agassiz’s land tortoise, Gopherus agassizii (Testudines: Testudinidae) with the description of a new species and its consequences for conservation. ZooKeys 2011, 113, 39–71. [Google Scholar] [CrossRef]
  54. Higgins, D.G.; Bleasby, A.J.; Fuchs, R. CLUSTAL-V - Improved software for multiple sequence alignment. Comp. Appl. Biosciences 1992, 8, 189–191. [Google Scholar]
  55. Tamura, K.; Dudley, J.; Nei, M.; Kumar, S. MEGA4: Molecular evolutionary genetics analysis (MEGA) software version 4.0. Mol. Biol. Evol. 2007, 24, 1596–1599. [Google Scholar] [CrossRef]
  56. Excoffier, L.; Lischer, H.E.L. Arlequin Suite ver 3.5: A new series of programs to perform population genetics analyses under Linux and Windows. Mol. Ecol. Resour. 2010, 10, 564–567. [Google Scholar]
  57. Tamura, K.; Nei, M. Estimation of the number of nucleotide substitutions in the control region of mitochondrial-DNA in humans and chimpanzees. Mol. Biol. Evol. 1993, 10, 512–526. [Google Scholar]
  58. Dieringer, D.; Schlotterer, C. MICROSATELLITE ANALYSER (MSA): A platform independent analysis tool for large microsatellite data sets. Mol. Ecol. Notes 2003, 3, 167–169. [Google Scholar] [CrossRef]
  59. Ballard, J.W.O.; Whitlock, M.C. The incomplete natural history of mitochondria. Mol. Ecol. 2004, 13, 729–744. [Google Scholar] [CrossRef]
  60. Edwards, S.V.; Beerli, P. Perspective: Gene divergence, population divergence, and the variance in coalescence time in phylogeographic studies. Evolution 2000, 54, 1839–1854. [Google Scholar]
  61. Nei, M.; Li, W.-H. Mathematical model for studying genetic variation in terms of restriction endonucleases. Proc. Natl. Acad. Sci. USA 1979, 76, 5269–5273. [Google Scholar] [CrossRef]
  62. Jensen, J.L.; Bohonak, A.J.; Kelley, S.T. Isolation by distance, web service. BMC Genet. 2005, 6, 13. [Google Scholar] [CrossRef]
  63. Vandergast, A.G.; Perry, W.M.; Lugo, R.V.; Hathaway, S.A. Genetic landscapes GIS Toolbox: tools to map patterns of genetic divergence and diversity. Mol. Ecol. Resour. 2011, 11, 158–161. [Google Scholar] [CrossRef]
  64. Manni, F.; Guerard, E.; Heyer, E. Geographic patterns of (genetic, morphologic, linguistic) variation: How barriers can be detected by using Monmonier's algorithm. Hum. Biol. 2004, 76, 173–190. [Google Scholar] [CrossRef]
  65. Miller, M.P. Alleles In Space (AIS): Computer software for the joint analysis of interindividual spatial and genetic information. J. Hered. 2005, 96, 722–724. [Google Scholar] [CrossRef]
  66. Phillips, S.J.; Anderson, R.P.; Schapire, R.E. Maximum entropy modeling of species geographic distributions. Ecol. Model. 2006, 190, 231–259. [Google Scholar] [CrossRef]
  67. Nussear, K.E.; Esque, T.C.; Inman, R.D.; Gass, L.; Thomas, K.A.; Wallace, C.S.A.; Blainey, J.B.; Miller, D.M.; Webb, R.H. Modeling habitat of the desert tortoise (Gopherus agassizii) in the Mojave and parts of the Sonoran Deserts of California, Nevada, Utah, and Arizona: U.S. Geological Survey Open-File Report 2009–1102. 2009, p. 18. Available online: http://pubs.usgs.gov/of/2009/1102/ (accessed on 1 April 2013).
  68. Inman, R.D.; Esque, T.C.; Nussear, K.E.; Lieitner, P.; Matocq, M.D.; Weisberg, P.J.; Dilts, T.E.; Vandergast, A.G. Is there room for all of us? Renewable energy and Xerospermophilus mohavensis. Endanger. Species Res. 2013, 20, 1–18. [Google Scholar] [CrossRef]
  69. Inman, R.D.; Nussear, K.E.; Esque, T.C.; Vandergast, A.G.; Hathaway, S.A.; Barr, K.R.; Fisher, R.N. Mapping Habitat in the Desert Southwest. U.S. Geological Survey Open-File Report. 2013; in preparation. [Google Scholar]
  70. Cumming, G.S. Using between-model comparisons to fine-tune linear models of species ranges. J. Biogeogr. 2000, 27, 441–455. [Google Scholar] [CrossRef]
  71. Fielding, A.H.; Bell, J.F. A review of methods for the assessment of prediction errors in conservation presence/absence models. Environ. Conserv. 1997, 24, 38–49. [Google Scholar] [CrossRef]
  72. Boyce, M.S.; Vernier, P.R.; Nielsen, S.E.; Schmiegelow, F.K.A. Evaluating resource selection functions. Ecol. Model. 2002, 157, 281–300. [Google Scholar] [CrossRef]
  73. Anderson, D.R.; Burnham, K.P.; Thompson, W.L. Null hypothesis testing: Problems, prevalence, and an alternative. J. Wildlife Manag. 2000, 64, 912–923. [Google Scholar] [CrossRef]
  74. Burnham, K.P.; Anderson, D.R. Multimodel inference - understanding AIC and BIC in model selection. Sociol. Methods Res. 2004, 33, 261–304. [Google Scholar] [CrossRef]
  75. Posada, D.; Buckley, T.R. Model selection and model averaging in phylogenetics: Advantages of Akaike information criterion and Bayesian approaches over likelihood ratio tests. Syst. Biol. 2004, 53, 793–808. [Google Scholar] [CrossRef]
  76. Liu, C.; Berry, P.; Dawson, T.; Pearson, R. Selecting thresholds of occurrence in the prediction of species distributions. Ecography 2005, 28, 385–393. [Google Scholar] [CrossRef]
  77. Penrod, K.; Beier, P.; Garding, E.; Cabañero, C. A Linkage Network for the California Deserts; Prepared for the Bureau of Land Management and The Wildlands Conservancy. Science and Collaboration for Connected Wildlands and Northern Arizona University: Fair Oaks, CA, USA, 2012; p. 361. Available online: http://www.scwildlands.org/reports/Default.aspx/ (accessed on 14 December 2012).
  78. Fu, Y.-X. Statistical properties of segregating sites. Theor. Popul. Biol. 1995, 48, 172–197. [Google Scholar] [CrossRef]
  79. Nei, M. Molecular Evolutionary Genetics; Columbia University Press: New York, NY, USA, 1987. [Google Scholar]
  80. USDI-BLM Programmatic Environmental Impact Statement for Solar Energy Development in Six Southwestern States. Available online: http://solareis.anl.gov/documents/fpeis/Solar_FPEIS_ExecutiveSummary.pdf (accessed on 16 July 2012).
  81. USDI-BLM California Desert Conservation Area Plan. Available online: http://www.blm.gov/pgdata/etc/medialib//blm/ca/pdf/pdfs/cdd_pdfs.Par.aa6ec747.File.pdf/CA_Desert_.pdf (accessed on 18 July 2012).
  82. USDI-BLM Approved Resource Management Plan Amendments/Record of Decision (ROD) for Designation of Energy Corridors on Bureau of Land Management-Administered Lands in the 11 Western States. Available online: http://corridoreis.anl.gov/documents/docs/Energy_Corridors_final_signed_ROD_1_14_2009.pdf (accessed on 18 July 2012).
  83. Remington, C.L. Suture-Zones of Hybrid Interaction between Recently Joined Biotas. In Evolutionary Biology; Dobzhansky, T., Hecht, M.K., Steere, W.C., Eds.; Appleton-Century-Crofts: New York, NY, USA, 1968; Volume 2. [Google Scholar]
  84. Stebbins, G.L.; Major, J. Endemism and speciation in the California flora. Ecol. Monogr. 1965, 35, 1–35. [Google Scholar] [CrossRef]
  85. Epps, C.W.; Palsbøll, P.J.; Wehausen, J.D.; Roderick, G.K.; McCullough, D.R. Elevation and connectivity define genetic refugia for mountain sheep as climate warms. Mol. Ecol. 2006, 15, 4295–4302. [Google Scholar] [CrossRef]
  86. Markert, J.A.; Champlin, D.M.; Gutjahr-Gobell, R.; Grear, J.S.; Kuhn, A.; McGreevy, T.J.; Roth, A.; Bagley, M.J.; Nacci, D.E. Population genetic diversity and fitness in multiple environments. BMC Evolut. Biol. 2010, 10, 205. [Google Scholar]
  87. McKay, J.K.; Latta, R.G. Adaptive population divergence: Markers, QTL and traits. Trends Ecol. Evol. 2002, 17, 285–291. [Google Scholar] [CrossRef]
  88. Reed, D.H.; Frankham, R. How closely correlated are molecular and quantitative measures of genetic variation? A meta-analysis. Evolution 2001, 55, 1095–1103. [Google Scholar]
  89. Barton, N.H.; Hewitt, G.M. Analysis of hybrid zones. Ann. Rev. Ecol. Syst. 1985, 16, 113–148. [Google Scholar]
  90. Ebert, D.; Haag, C.; Kirkpatrick, M.; Riek, M.; Hottinger, J.W.; Pajunen, V.I. A selective advantage to immigrant genes in a Daphnia metapopulation. Science 2002, 295, 485–488. [Google Scholar] [CrossRef]
  91. Lavergne, S.; Molofsky, J. Increased genetic variation and evolutionary potential drive the success of an invasive grass. Proc. Natl. Acad. Sci. USA 2007, 104, 3883–3888. [Google Scholar] [CrossRef]
  92. Tallmon, D.A.; Luikart, G.; Waples, R.S. The alluring simplicity and complex reality of genetic rescue. Trends Ecol. Evol. 2004, 19, 489–496. [Google Scholar] [CrossRef]
  93. Turgeon, J.; Estoup, A.; Bernatchez, L. Species flock in the North American Great Lakes: Molecular ecology of Lake Nipigon Ciscoes (Teleostei: Coregonidae: Coregonus). Evolution 1999, 53, 1857–1871. [Google Scholar] [CrossRef]
  94. Freedman, A.H.; Thomassen, H.A.; Buermann, W.; Smith, T.B. Genomic signals of diversification along ecological gradients in a tropical lizard. Mol. Ecol. 2010, 19, 3773–3788. [Google Scholar] [CrossRef]
  95. Smith, T.B.; Kark, S.; Schneider, C.J.; Wayne, R.K.; Moritz, C. Biodiversity hotspots and beyond: the need for preserving environmental transitions. Trends Ecol. Evol. 2001, 16, 431. [Google Scholar]
  96. Thomassen, H.A.; Cheviron, Z.A.; Freedman, A.H.; Harrigan, R.J.; Wayne, R.K.; Smith, T.B. Spatial modelling and landscape-level approaches for visualizing intra-specific variation. Mol. Ecol. 2010, 19, 3532–3548. [Google Scholar] [CrossRef]
  97. Patton, J.L.; Huckaby, D.G.; Alvarez-Castaneda, S.T. The Systematic and Evolutionary History of Woodrats of the Neotoma lepida Complex; University of California Press: Berkeley, CA, USA, 2008. [Google Scholar]
  98. Epling, C.; Lewis, H.; Ball, F.M. The breeding group and seed storage: A study in population dynamics. Evolution 1960, 14, 238–255. [Google Scholar] [CrossRef]
  99. Schemske, D.W.; Bierzychudek, P. Evolution of flower color in the desert annual Linanthus parryae: Wright revisited. Evolution 2001, 55, 1269–1282. [Google Scholar]
  100. Schemske, D.W.; Bierzychudek, P. Spatial differentiation for flower color in the desert annual Linanthus parryae: was Wright right? Evolution 2007, 61, 2528–2543. [Google Scholar] [CrossRef]
  101. Etterson, J.R. Evolutionary potential of Chamaecrista fasciculata in relation to climate change. II. Genetic architecture of three populations reciprocally planted along an environmental gradient in the Great Plains. Evolution 2004, 58, 1459–1471. [Google Scholar]
  102. Hellmann, J.J.; Pineda-Krch, M. Constraints and reinforcement on adaptation under climate change: Selection of genetically correlated traits. Biol. Conserv. 2007, 137, 599–609. [Google Scholar] [CrossRef]
  103. Kuvlesky, W.P.; Brennan, L.A.; Morrison, M.L.; Boydston, K.K.; Ballard, B.M.; Bryant, F.C. Wind energy development and wildlife conservation: Challenges and opportunities. J. Wildl. Manag. 2007, 71, 2487–2498. [Google Scholar] [CrossRef]
  104. Kunz, T.H.; Arnett, E.B.; Cooper, B.M.; Erickson, W.P.; Larkin, R.P.; Mabee, T.; Morrison, M.L.; Strickland, M.D.; Szewczak, J.M. Assessing impacts of wind-energy development on nocturnally active birds and bats: A guidance document. J. Wildl. Manag. 2007, 71, 2449–2486. [Google Scholar] [CrossRef]
  105. Baerwald, E.F.; Barclay, R.M.R. Patterns of activity and fatality of migratory bats at a wind energy facility in Alberta, Canada. J. Wildl. Manag. 2011, 75, 1103–1114. [Google Scholar] [CrossRef]
  106. Smallwood, K.S.; Rugge, L.; Morrison, M.L. Influence of behavior on bird mortality in wind energy developments. J. Wildl. Manag. 2009, 73, 1082–1098. [Google Scholar] [CrossRef]
  107. Drewitt, A.L.; Langston, R.H.W. Assessing the impacts of wind farms on birds. Ibis 2006, 148, 29–42. [Google Scholar] [CrossRef]
  108. Rabin, L.A.; Coss, R.G.; Owings, D.H. The effects of wind turbines on antipredator behavior in California ground squirrels (Spermophilus beecheyi). Biol. Conserv. 2006, 131, 410–420. [Google Scholar] [CrossRef]
  109. Lovich, J.E.; Ennen, J.R.; Madrak, S.; Meyer, K.; Loughran, C.; Bjrulin, C.; Arundel, T.; Turner, W.; Jones, C.; Groenendaal, G.M. Effects of wind energy production on growth, demography and survivorship of a desert tortoise (Gopherus agassizii) population in southern California with comparisons to natural populations. Herpetol. Conserv. Biol. 2011, 6, 161–174. [Google Scholar]
  110. Lovich, J.E.; Ennen, J.R. Wildlife conservation and solar energy development in the desert southwest, United States. Bioscience 2011, 61, 982–992. [Google Scholar] [CrossRef]
  111. Holderegger, R.; Di Giulio, M. The genetic effects of roads: A review of empirical evidence. Basic Appl. Ecol. 2010, 11, 522–531. [Google Scholar] [CrossRef]
  112. Trombulak, S.C.; Frissell, C.A. Review of ecological effects of roads on terrestrial and aquatic communities. Conserv. Biol. 2000, 14, 18–30. [Google Scholar] [CrossRef]
  113. Keyghobadi, N.; Roland, J.; Matter, S.F.; Strobeck, C. Among- and within-patch components of genetic diversity respond at different rates to habitat fragmentation: an empirical demonstration. Proc. R. Soc. B-Biol. Sci. 2005, 272, 553–560. [Google Scholar] [CrossRef]
  114. Richmond, J.Q.; Reid, D.T.; Ashton, K.G.; Zamudio, K.R. Delayed genetic effects of habitat fragmentation on the ecologically specialized Florida sand skink (Plestiodon reynoldsi). Conserv. Genet. 2009, 10, 1281–1297. [Google Scholar] [CrossRef]
  115. Carthew, S.M.; Horner, B.; Jones, K.M.W. Do utility corridors affect movements of small terrestrial fauna? Wildl. Res. 2009, 36, 488–495. [Google Scholar] [CrossRef]
  116. Fahrig, L.; Rytwinski, T. Effects of roads on animal abundance: An empirical review and synthesis. Ecol. Soc. 2009, 14, 21. [Google Scholar]
  117. Schreiber, R.K.; Graves, J.H. Powerline corridors as possible barriers to the movements of small mammals. Am. Midl. Nat. 1977, 97, 504–508. [Google Scholar] [CrossRef]
  118. Forman, R.T.T.; Alexander, L.E. Roads and their major ecological effects. Ann. Rev. Ecol. Syst. 1998, 29, 207–231. [Google Scholar] [CrossRef]
  119. Gelbard, J.L.; Belnap, J. Roads as conduits for exotic plant invasions in a semiarid landscape. Conserv. Biol. 2003, 17, 420–432. [Google Scholar] [CrossRef]
  120. Stiles, J.H.; Jones, R.H. Distribution of the red imported fire ant, Solenopsis invicta, in road and powerline habitats. Landsc. Ecol. 1998, 13, 335–346. [Google Scholar] [CrossRef]
  121. Coates, P.S.; Connelly, J.W.; Delehanty, D.J. Predators of Greater Sage-Grouse nests identified by video monitoring. J. Field Ornithol. 2008, 79, 421–428. [Google Scholar] [CrossRef]
  122. Kristan, W.B.; Boarman, W.I. Spatial pattern of risk of common raven predation on desert tortoises. Ecology 2003, 84, 2432–2443. [Google Scholar] [CrossRef]
  123. Peery, M.Z.; Henry, R.W. Recovering marbled murrelets via corvid management: A population viability analysis approach. Biol. Conserv. 2010, 143, 2414–2424. [Google Scholar] [CrossRef]
  124. Boarman, W. Threats to Desert Tortoise Populations: A Critical Review of the Literature. 2002. Available online: http://www.werc.usgs.gov/ProductDetails.aspx?ID=2574/ (accessed on 14 December 2012). Prepared for West Mojave Planning Team, Bureau of Land Management.
  125. Hawlena, D.; Bouskila, A. Land management practices for combating desertification cause species replacement of desert lizards. J. Appl. Ecol. 2006, 43, 701–709. [Google Scholar] [CrossRef]
  126. Loarie, S.R.; Carter, B.E.; Hayhoe, K.; McMahon, S.; Moe, R.; Knight, C.A.; Ackerly, D.D. Climate change and the future of California’s endemic flora. Plos One 2008, 3, e2502. [Google Scholar] [CrossRef]
  127. Notaro, M.; Mauss, A.; Williams, J.W. Projected vegetation changes for the American Southwest: combined dynamic modeling and bioclimatic-envelope approach. Ecol. Appl. 2012, 22, 1365–1388. [Google Scholar] [CrossRef]
  128. Spencer, W.; Abella, S.R.; Barrows, C.; Berry, K.; Esque, T.C.; Garrett, K.; Howell, C.A.; Kobaly, R.; Noss, R.F.; Redak, R.A.; et al. Recommendations of Independent Science Advisors for the California Desert Renewable Energy Conservation Plans (DRECP); Prepared for: Renewable Energy Action Team. Conservation Biology Institute: Corvallis, OR, 2010. Available online: http://www.energy.ca.gov/2010publications/DRECP-1000–2010–008/DRECP-1000–2010–008-F.PDF.
  129. Salazar, K. Addressing the impacts of climate change on America’s water, land, and other natural and cultural resources. Order No. 3289 from the Director of the Department of the Interior. 2009. Available online: http://www.doi.gov/whatwedo/climate/cop15/upload/SecOrder3289.pdf (accessed on 14 December 2012).
  130. Abby, R.V. The Bureau of Land Management’s Landscape Approach for Managing the Public Lands. Information Bulletin No. 2012-058. Available online: http://www.blm.gov/wo/st/en/info/regulations/Instruction_Memos_and_Bulletins/national_information/2012/IB_2012–058.html/ (accessed on 14 December 2012).

