Article

Re-Evaluating Causal Modeling with Mantel Tests in Landscape Genetics

by
Samuel A. Cushman
1,*,
Tzeidle N. Wasserman
2,
Erin L. Landguth
3 and
Andrew J. Shirk
4
1
USDA Forest Service, Rocky Mountain Research Station, 800 E Beckwith, Missoula, MT 59801, USA
2
School of Forestry, Northern Arizona University, P.O. Box 1508, Flagstaff, AZ 86011, USA
3
Division of Biological Sciences, University of Montana, 32 Campus Drive, Missoula, MT 59812, USA
4
Climate Impacts Group, University of Washington, Seattle, WA 98109, USA
*
Author to whom correspondence should be addressed.
Diversity 2013, 5(1), 51-72; https://doi.org/10.3390/d5010051
Submission received: 30 November 2012 / Revised: 18 January 2013 / Accepted: 1 February 2013 / Published: 18 February 2013
(This article belongs to the Special Issue Genetic Diversity and Molecular Evolution)

Abstract

:
The predominant analytical approach to associate landscape patterns with gene flow processes is based on the association of cost distances with genetic distances between individuals. Mantel and partial Mantel tests have been the dominant statistical tools used to correlate cost distances and genetic distances in landscape genetics. However, the inherent high correlation among alternative resistance models results in a high risk of spurious correlations using simple Mantel tests. Several refinements, including causal modeling, have been developed to reduce the risk of affirming spurious correlations and to assist model selection. However, the evaluation of these approaches has been incomplete in several respects. To demonstrate the general reliability of the causal modeling approach with Mantel tests, it must be shown to be able to correctly identify a wide range of landscape resistance models as the correct drivers relative to alternative hypotheses. The objectives of this study were to (1) evaluate the effectiveness of the originally published causal modeling framework to support the correct model and reject alternative hypotheses of isolation by distance and isolation by barriers and to (2) evaluate the effectiveness of causal modeling involving direct competition of all hypotheses to support the correct model and reject all alternative landscape resistance models. We found that partial Mantel tests have very low Type II error rates, but elevated Type I error rates. This leads to frequent identification of support for spurious correlations between alternative resistance hypotheses and genetic distance, independent of the true resistance model. The frequency in which this occurs is directly related to the degree of correlation between true and alternative resistance models. We propose an improvement based on the relative support of the causal modeling diagnostic tests.

1. Introduction

Landscape genetics provides a powerful approach to evaluate the effects of multiple landscape features on population connectivity [1,2,3,4,5,6,7,8,9,10,11,12]. Individual-based analyses relating landscape structure to genetic distance across complex landscapes enable rigorous evaluation of multiple alternative hypotheses relating landscape structure to gene flow.
The predominant analytical approach to associate landscape patterns with gene flow processes is based on pair-wise calculation of cost distances, using least cost paths (e.g., [13,14] or multi-path circuit approaches [15]). These pair-wise cost distances among individuals across a landscape resistance model are then correlated with pair-wise genetic distances among the same individuals with methods, such as Mantel and partial Mantel tests [16,17].
There has been controversy in the literature about the appropriateness of Mantel testing in landscape genetics. Raufaste and Rousset [18] questioned the use of partial Mantel tests in micro-evolutionary studies. Subsequently, Castellano and Balletto [19] attempted to rehabilitate the use of the partial Mantel test in genetic analysis. Recently, Legendre and Fortin [20] clarified this confusion. They show that Raufaste and Rousset [18] raised a valid point about a situation requiring a particular permutation procedure, but made unwarranted claims that partial Mantel tests are a biased testing procedure, while Castellano and Balletto [19] attempted to refute this, but advocated an inappropriate testing procedure. Legendre and Fortin [20] note that distance-based regression approaches, such as the Mantel test, have lower power than traditional linear models and tend to underestimate the true magnitude of a relationship. They conclude that partial Mantel testing is the appropriate framework when the hypotheses are explicitly defined in terms of distance matrices, as they are in landscape genetic analyses testing effects of landscape resistance on neutral genetic differentiation.
Recently, Guillot and Rousset [21] reported that partial Mantel tests may suffer from bias in cases where there is spatial correlation in landscape resistance. They suggest that Mantel tests should not be used in case auto-correlation is suspected in both variables. Similarly, Meirmans [22] argued that spatial autocorrelation deriving from isolation by distance bias the outcome of Mantel tests, leading to a large number of false positives. Amos [23] reported a similar pattern of results for alternative resistance models, rather than isolation by distance.
Cushman et al. [6] proposed a causal modeling framework to assist in model selection and increase the likelihood of identifying the true driver of genetic isolation. This approach involves identifying the most supported resistance hypothesis among a range of alternative resistance models (based on statistical significance) and then using partial Mantel tests [25,26] to determine whether it meets the statistical expectations of a causal model relative to alternative models of isolation by distance or isolation by barrier. Recently, Cushman and Landguth [26] evaluated the power of this framework and found that the method performs well in identifying the drivers of genetic differentiation in a case study of complex landscape and rejecting incorrect and correlated alternatives. However, the evaluation of Cushman and Landguth [26] only evaluated whether a single stipulated landscape resistance model (i.e., that identified by Cushman et al. [6]) could be reliably distinguished from hypotheses of isolation by distance and isolation by barrier.
Two additional questions need to be evaluated to determine the overall reliability of the causal modeling approach using partial Mantel tests in landscape genetics. First, to demonstrate the general reliability of the Cushman and Landguth [26] approach (Figure 1a), it must be shown to be able to correctly identify a wide range of landscape resistance models as the correct drivers relative to isolation by distance and isolation by barrier. Second, Wasserman et al. [11] proposed a more complete form of causal modeling to improve the strength of inference (Figure 1b). In this approach, rather than to first identify the most supported resistance hypothesis and then to evaluate it relative to null models, all resistance and null models directly compete against each other. To validate this approach, a formal evaluation using simulation must be conducted to determine whether these additional comparisons improve the reliability of the method.
The objectives of this study were to (1) evaluate the effectiveness of the Cushman et al. [6] causal modeling framework to support the correct model and reject alternative hypotheses of isolation by distance and isolation by barriers and to (2) evaluate the effectiveness of the Wasserman et al. [11] approach to causal modeling. We had three specific hypotheses. First, we expected, following Cushman and Landguth [26], that causal modeling would have high power to correctly identify the driving process (i.e., a low rate of failing to find significant support for the true model, independent of alternative models). Second, as seen in Cushman and Landguth [26], we expected a lower ability of causal modeling to correctly reject alternative models that are highly correlated with the true driving process (i.e., a higher rate of significant partial Mantel correlation between the null models and genetic distance, partialling out the resistance model known to be true). Third, we expected that the rate of failing to reject spurious alternative models would be positively related to the strength of correlation between the cost distances in simulated (true) resistance hypothesis and those in the null model that could not be rejected.
Figure 1. Schematic describing the two different approaches to causal modeling with partial Mantel tests used in this paper. (a) The method used by Cushman et al. [6] in which if a resistance hypothesis is supported independently of the two null models of isolation by distance and isolation by barriers then: (1) the partial Mantel test between the resistance model and genetic distance would be significant, partialling out geographical distance, (2) the partial mantel test between the resistance model and genetic distance would be significant, partialling out the barrier model, (3) the partial Mantel test between geographical distance and genetic distance would not be significant, partialling out the resistance model and (4) the partial Mantel test between the barrier model and genetic distance would not be significant, partialling out the resistance model. (b) The method used by Wasserman et al. [11] involves directly competing alternative resistance models against each other. In this method, if a resistance model is supported independently of another resistance model then: (1) the partial Mantel test between the resistance model and genetic distance would be significant, partialling out the alternative model and (2) the partial Mantel test between the alternative model and genetic distance would not be significant, partialling out the supported resistance model.
Diversity 05 00051 g001

2. Experimental Section

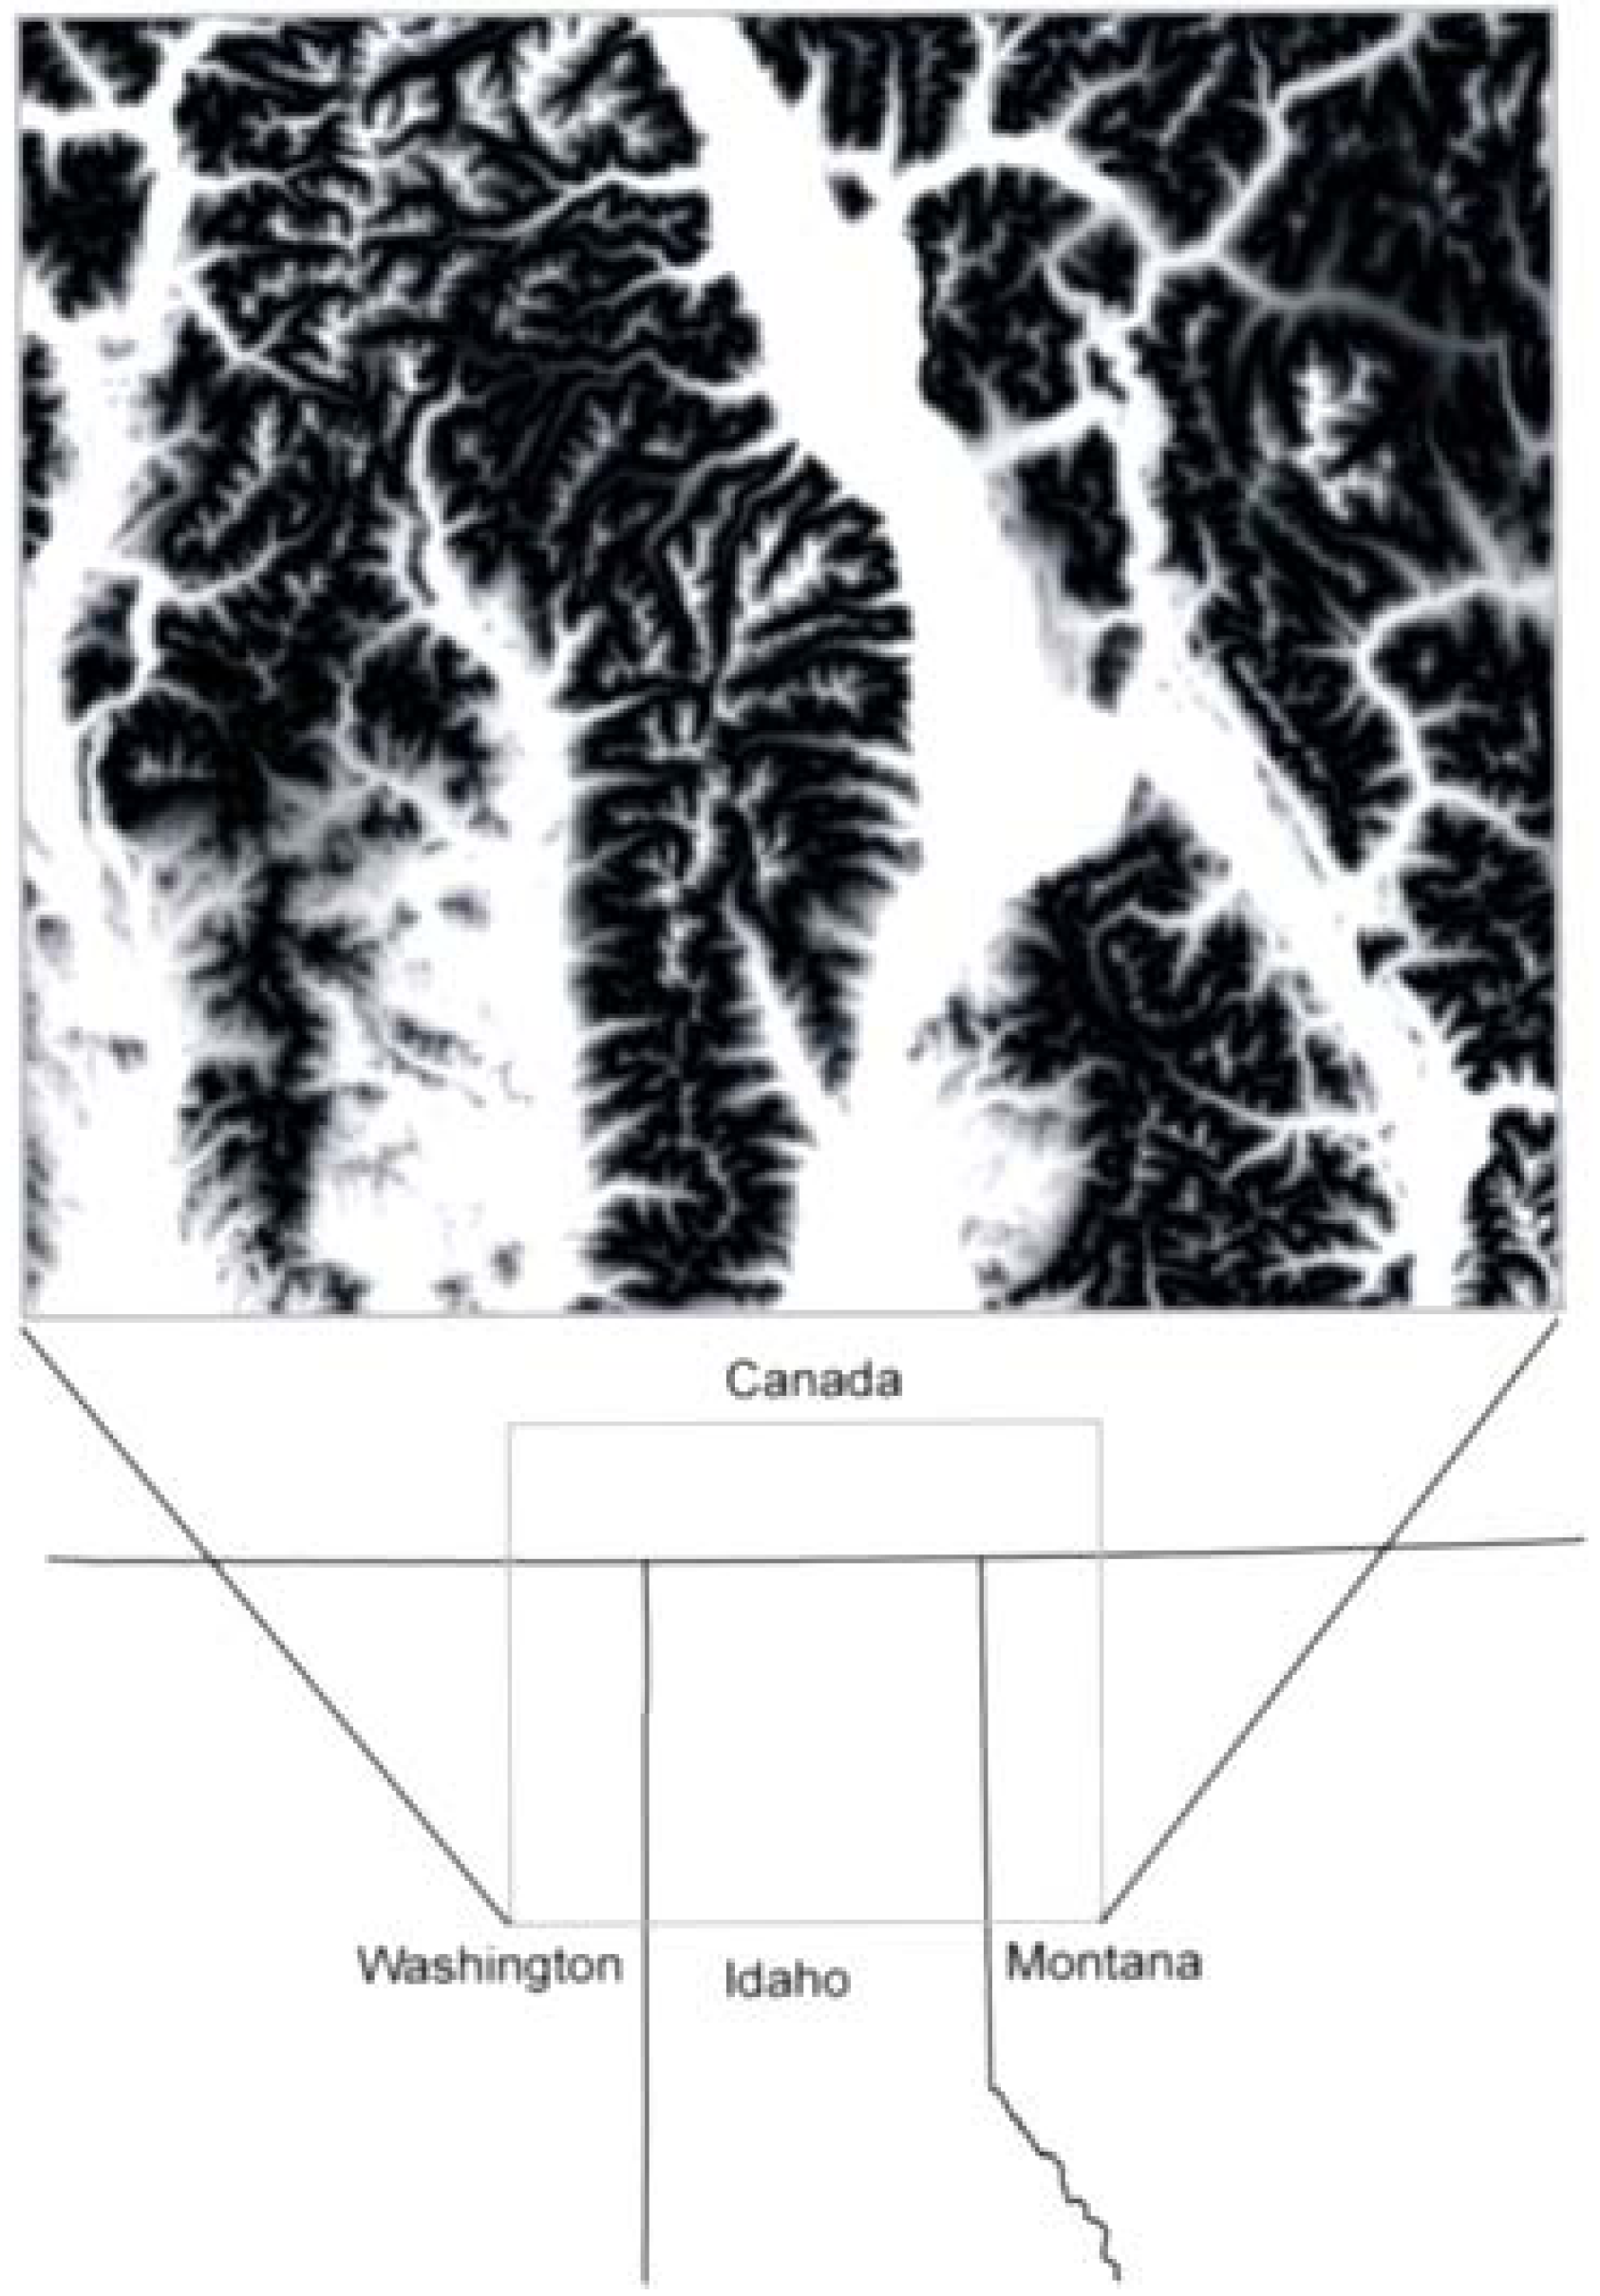
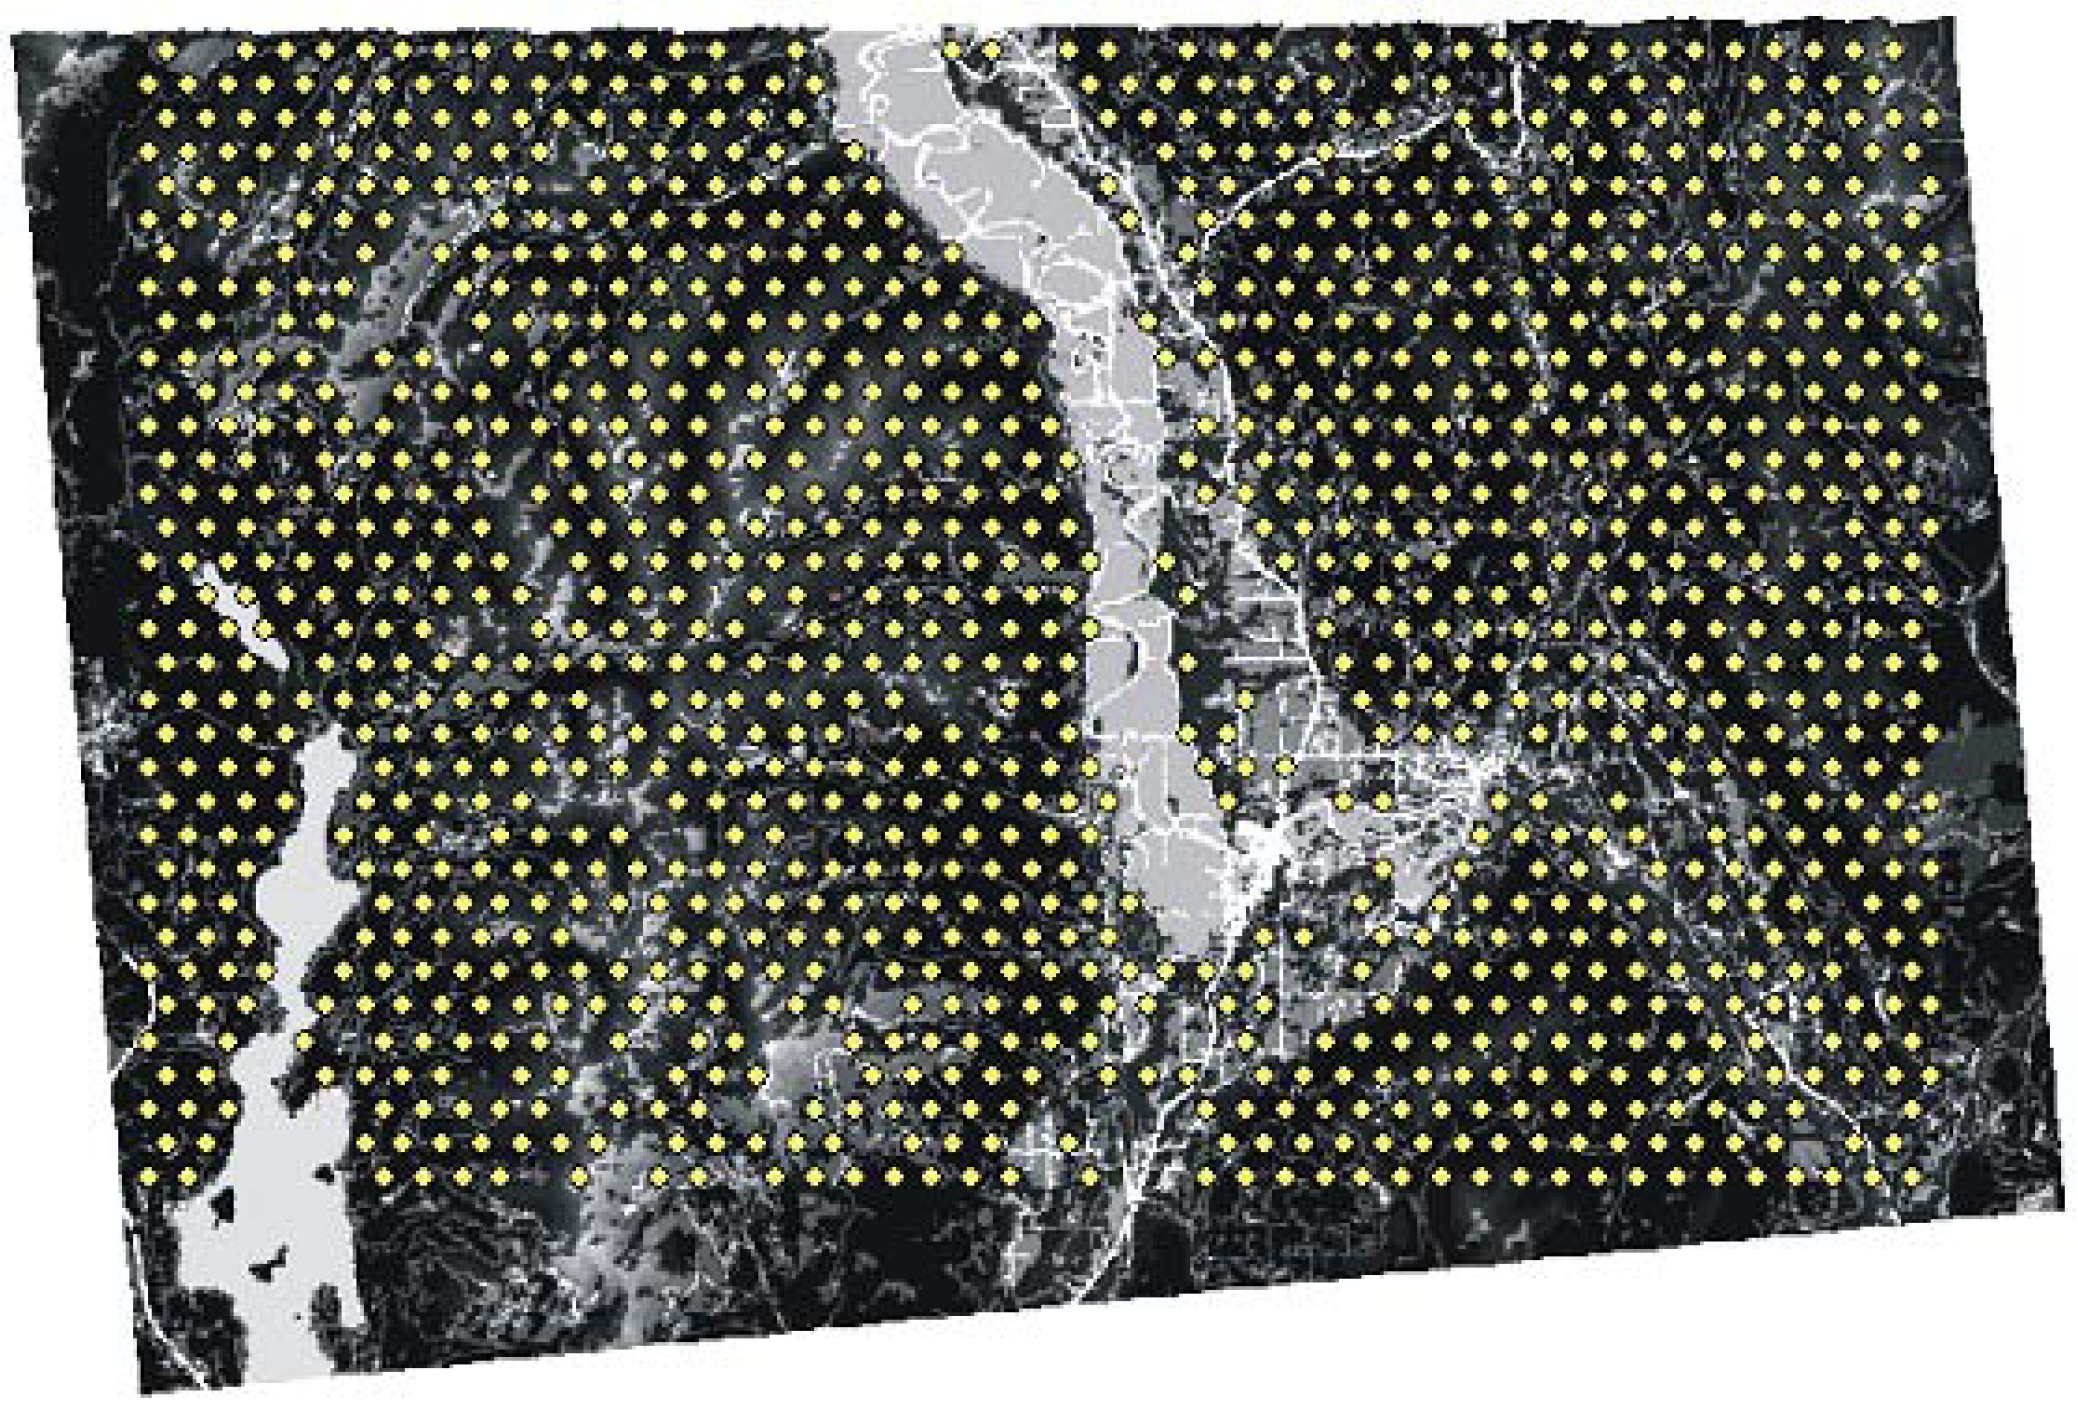
2.1. Study Area and Resistance Hypotheses

We chose a real landscape in northern Idaho, USA (Figure 2), that has been the focus of extensive landscape genetic research on black bears [6,27] and American marten [11,28,29]. This landscape has also been used as a “case study” in several simulation experiments to evaluate the performance of individual-based landscape genetic approaches [30] and of the causal modeling framework [26]. Cushman et al. [6] evaluated the Mantel and partial Mantel correlation between 108 landscape resistance models, plus the null models of isolation by distance and isolation by barriers and black bear genetic differentiation in the study area. In the current study, we use a subset of 35 of these resistance models that had the highest relationships with black bear genetic differentiation [31]. These 35 resistance models are a combination of the effects of elevation, forest cover and roads on resistance (Table 1). These are the major physiognomic attributes that vary in the study area. In addition, this suite of resistance models has also been used as the basis of studies to evaluate population connectivity across the U.S. northern Rocky Mountains for a wide range of native taxa [32,33] and to quantify the sufficiency of Federally owned lands in providing protection for these species [34].
Figure 2. Map of study area, which contains 4,500 square kilometers encompassing the extreme northern part of the Idaho panhandle and adjacent areas of Washington, Montana and British Columbia.
Diversity 05 00051 g002
Table 1. List and description of the 35 resistance models evaluated in the present study. The models were a combination of the effects of elevation, forest cover and roads on resistance to gene flow (for details see [6] Cushman et al. 2006; 2012)). The resistance model identified as causal in [6] Cushman et al. (2006) has a minimum resistance in forest at middle elevations with high resistance of roads (FHEMRH).
Model AcronymModel Description
EHMinimum resistance at high elevations (1,500 m)
EHFHMinimum resistance in forest (strong) at high elevations
EHFLMinimum resistance in forest (weak) at high elevations
EHRHMinimum resistance at high elevations with high resistance of roads
EHRLMinimum resistance at high elevations with weak resistance of roads
ELMinimum resistance at low elevations (500 m)
ELFHMinimum resistance at in forest (strong) at low elevations
ELFLMinimum resistance in forest (weak) at low elevations
ELRHMinimum resistance at low elevations with high resistance of roads
ELRLMinimum resistance at low elevations with weak resistance of roads
EMMinimum resistance at middle elevations (1,000 m)
EMFHMinimum resistance in forest (strong) at middle elevations
EMFLMinimum resistance in forest (weak) at middle elevations
EMRHMinimum resistance at middle elevations with high resistance of roads
EMRLMinimum resistance at middle elevations with weak resistance of roads
FHMinimum resistance in forest (strong)
FHEHRHMinimum resistance in forest (strong) at high elevations with high resistance of roads
FHEHRLMinimum resistance in forest (strong) at high elevations with weak resistance of roads
FHELRHMinimum resistance in forest (strong) at low elevations with high resistance of roads
FHELRLMinimum resistance in forest (strong) at low elevations with weak resistance of roads
FHEMRHMinimum resistance in forest (strong) at middle elevations with high resistance of roads
FHEMRLMinimum resistance in forest (strong) at middle elevations with weak resistance of roads
FHRHMinimum resistance in forest (strong) with high resistance of roads
FHRLMinimum resistance in forest (strong) with low resistance of roads
FLMinimum resistance in forest (weak)
FLEHRHMinimum resistance in forest (weak) at high elevations with high resistance of roads
FLEHRLMinimum resistance in forest (weak) at high elevations with weak resistance of roads
FLELRHMinimum resistance in forest (weak) at low elevations with high resistance of roads
FLELRLMinimum resistance in forest (weak) at low elevations with weak resistance of roads
FLEMRHMinimum resistance in forest (weak) at middle elevations with high resistance of roads
FLEMRLMinimum resistance in forest (weak) at middle elevations with weak resistance of roads
FLRHMinimum resistance in forest (weak) with high resistance of roads
FLRLMinimum resistance in forest (weak) with low resistance of roads
RHStrong resistance of roads
RLWeak resistance of roads

2.2. Landscape Genetic Simulation with CDPOP

We used CDPOP version 0.84 [32] to simulate the processes of mating and dispersal as functions of each of the 37 landscape models (35 resistance models plus isolation by distance and isolation by barrier). CDPOP is an individual-based, spatially explicit, landscape genetic model that simulates birth, death, mating and dispersal of individuals in complex landscapes as probabilistic functions of movement cost among them. The model represents landscape structure as resistance surfaces and simulates mate selection and dispersal as probabilistic functions of cumulative cost across these resistance surfaces (breeding is simulated with Mendelian inheritance and a k-allele mutation-mutation rate = 0.0005), a commonly used mutation model for microsatellite loci [35,36]. The user specifies the locations and genotypes of the initial population, and the model simulates spatially-explicit population genetic change through time as a function of individual-based movement (mate choice and dispersal), mating, mutation and mortality.
In each of the 37 alternative landscape models, we placed 1,248 individuals in a uniform grid at a 2 km spacing within forested cover (Figure 3). We simulated gene flow among these locations for 500 non-overlapping sexual generations. Previous research has shown that the relationship between genetic structure and landscape resistance equilibrates relatively rapidly, generally within 100 simulated generations [26,37,38]. We stipulated the population to have ten neutral and diploid loci with ten alleles per locus, initially randomly assigned among individuals. We used an inverse square mating and dispersal probability function, with a maximum dispersal cost-weighted distance of 40,000 m (approximately the dispersal ability of black bear, a focal species for this analysis) in ideal habitat (i.e., a resistance value of one or isolation by distance). The number of offspring was based on a Poisson probability with a mean of four, creating an excess of offspring that “dispersed” from the study area, resulting in a constant population across generations [30]. For each of the 37 landscape resistance models, we ran ten Monte Carlo replicate runs in CDPOP to assess stochastic variability.
Figure 3. Example of one resistance model (minimum resistance in forest (strong) at middle elevations with high resistance of roads (FHEMRH), Table 1) and the locations of the 1,248 simulated individuals (yellow dots). The resistance model predicts low resistance (dark areas) in middle elevation forest and high resistance (light areas) in non-forest, extremely low or extremely high elevation or on roads.
Diversity 05 00051 g003

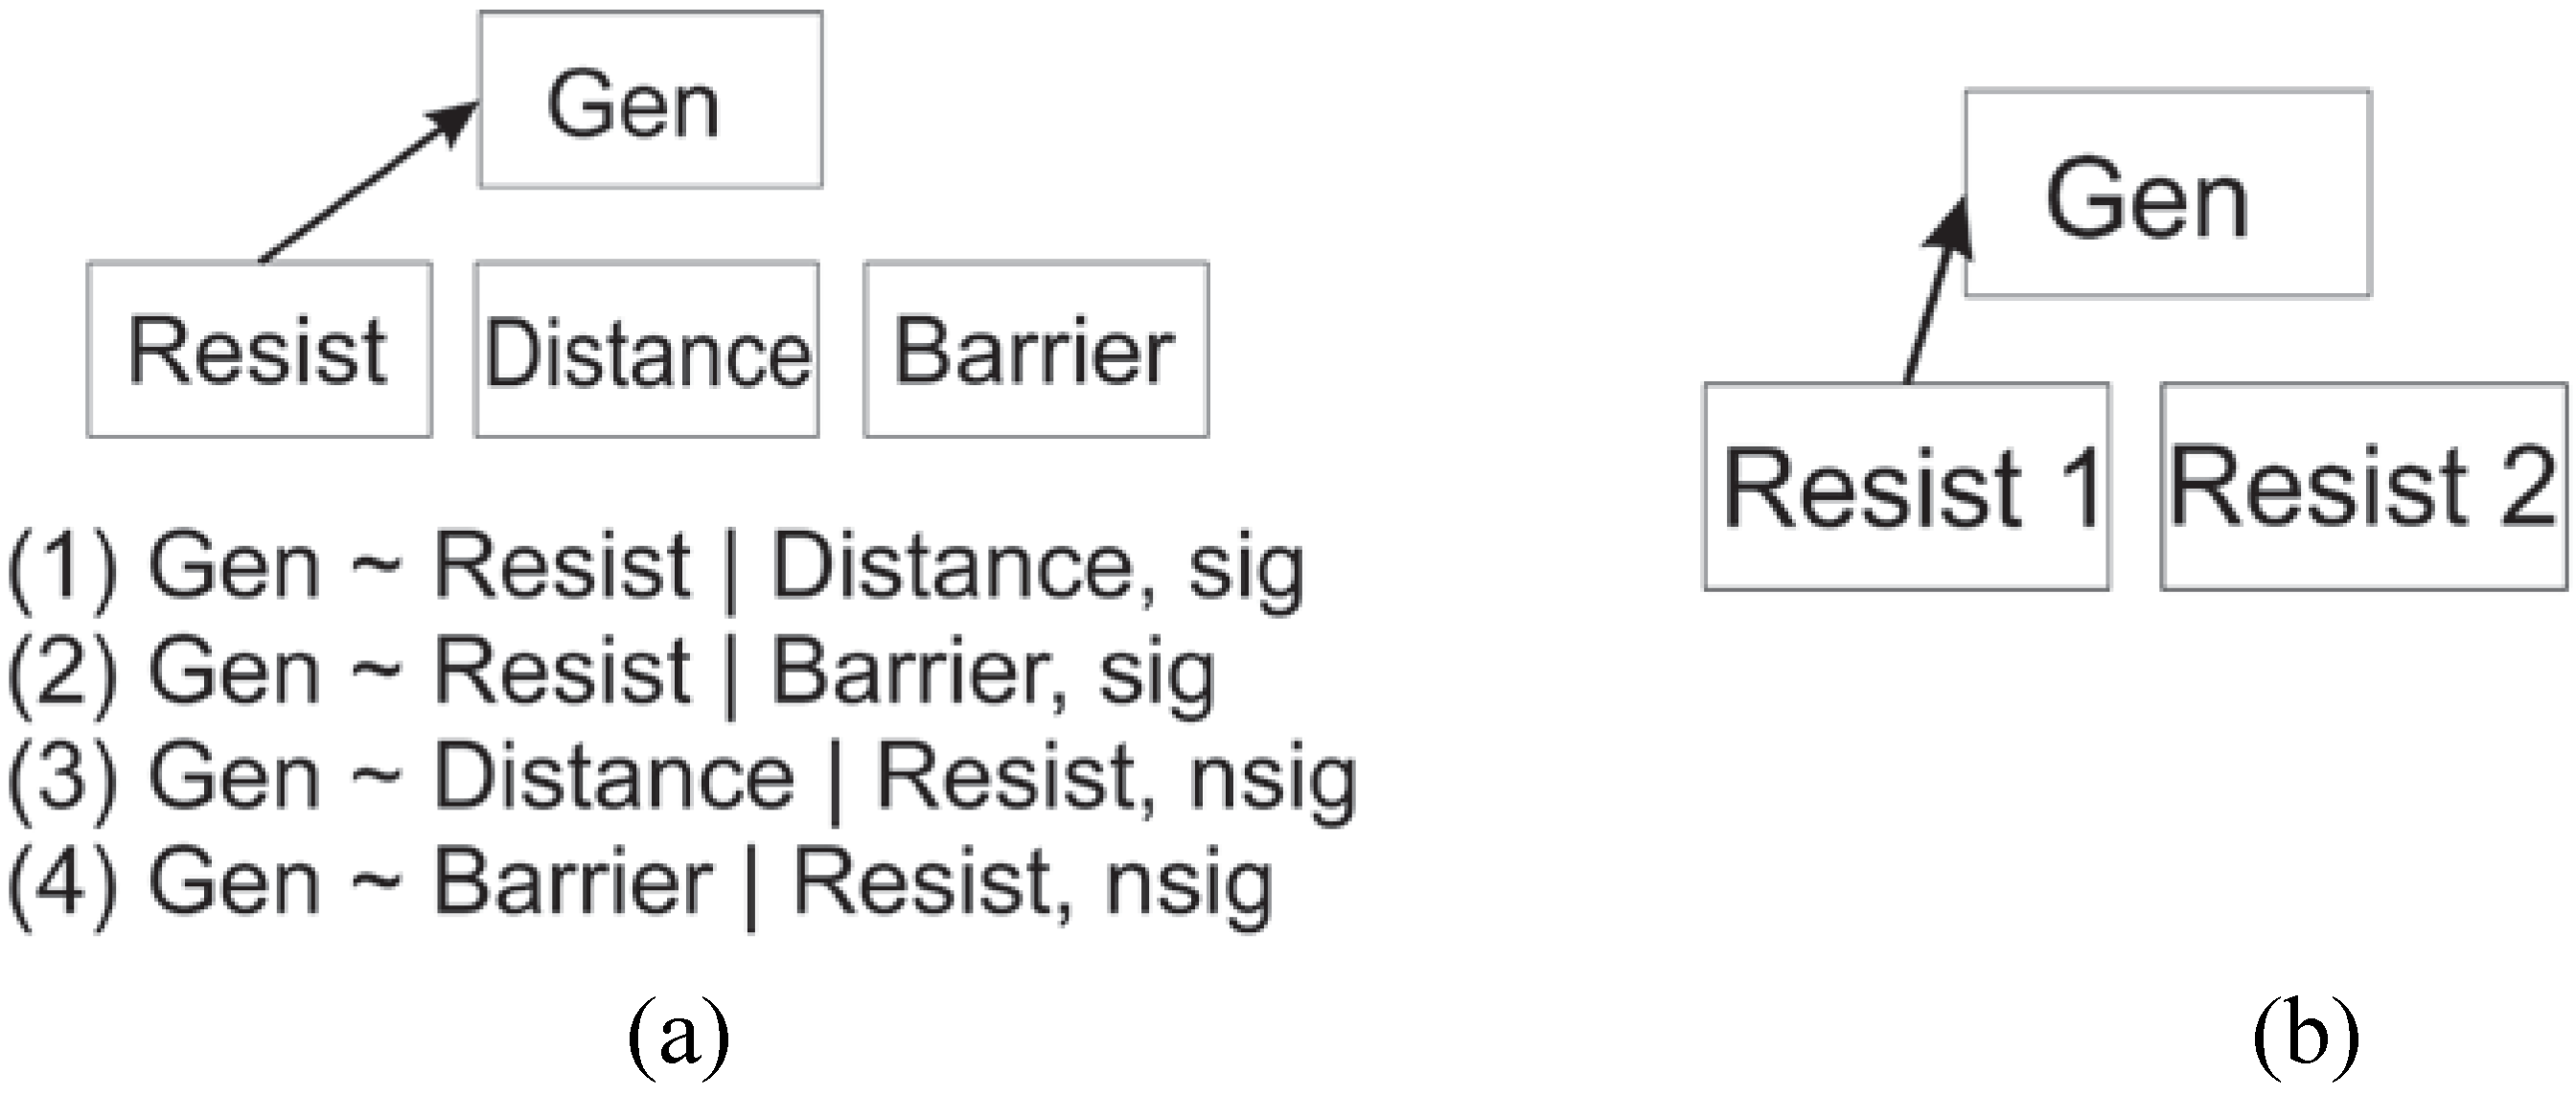
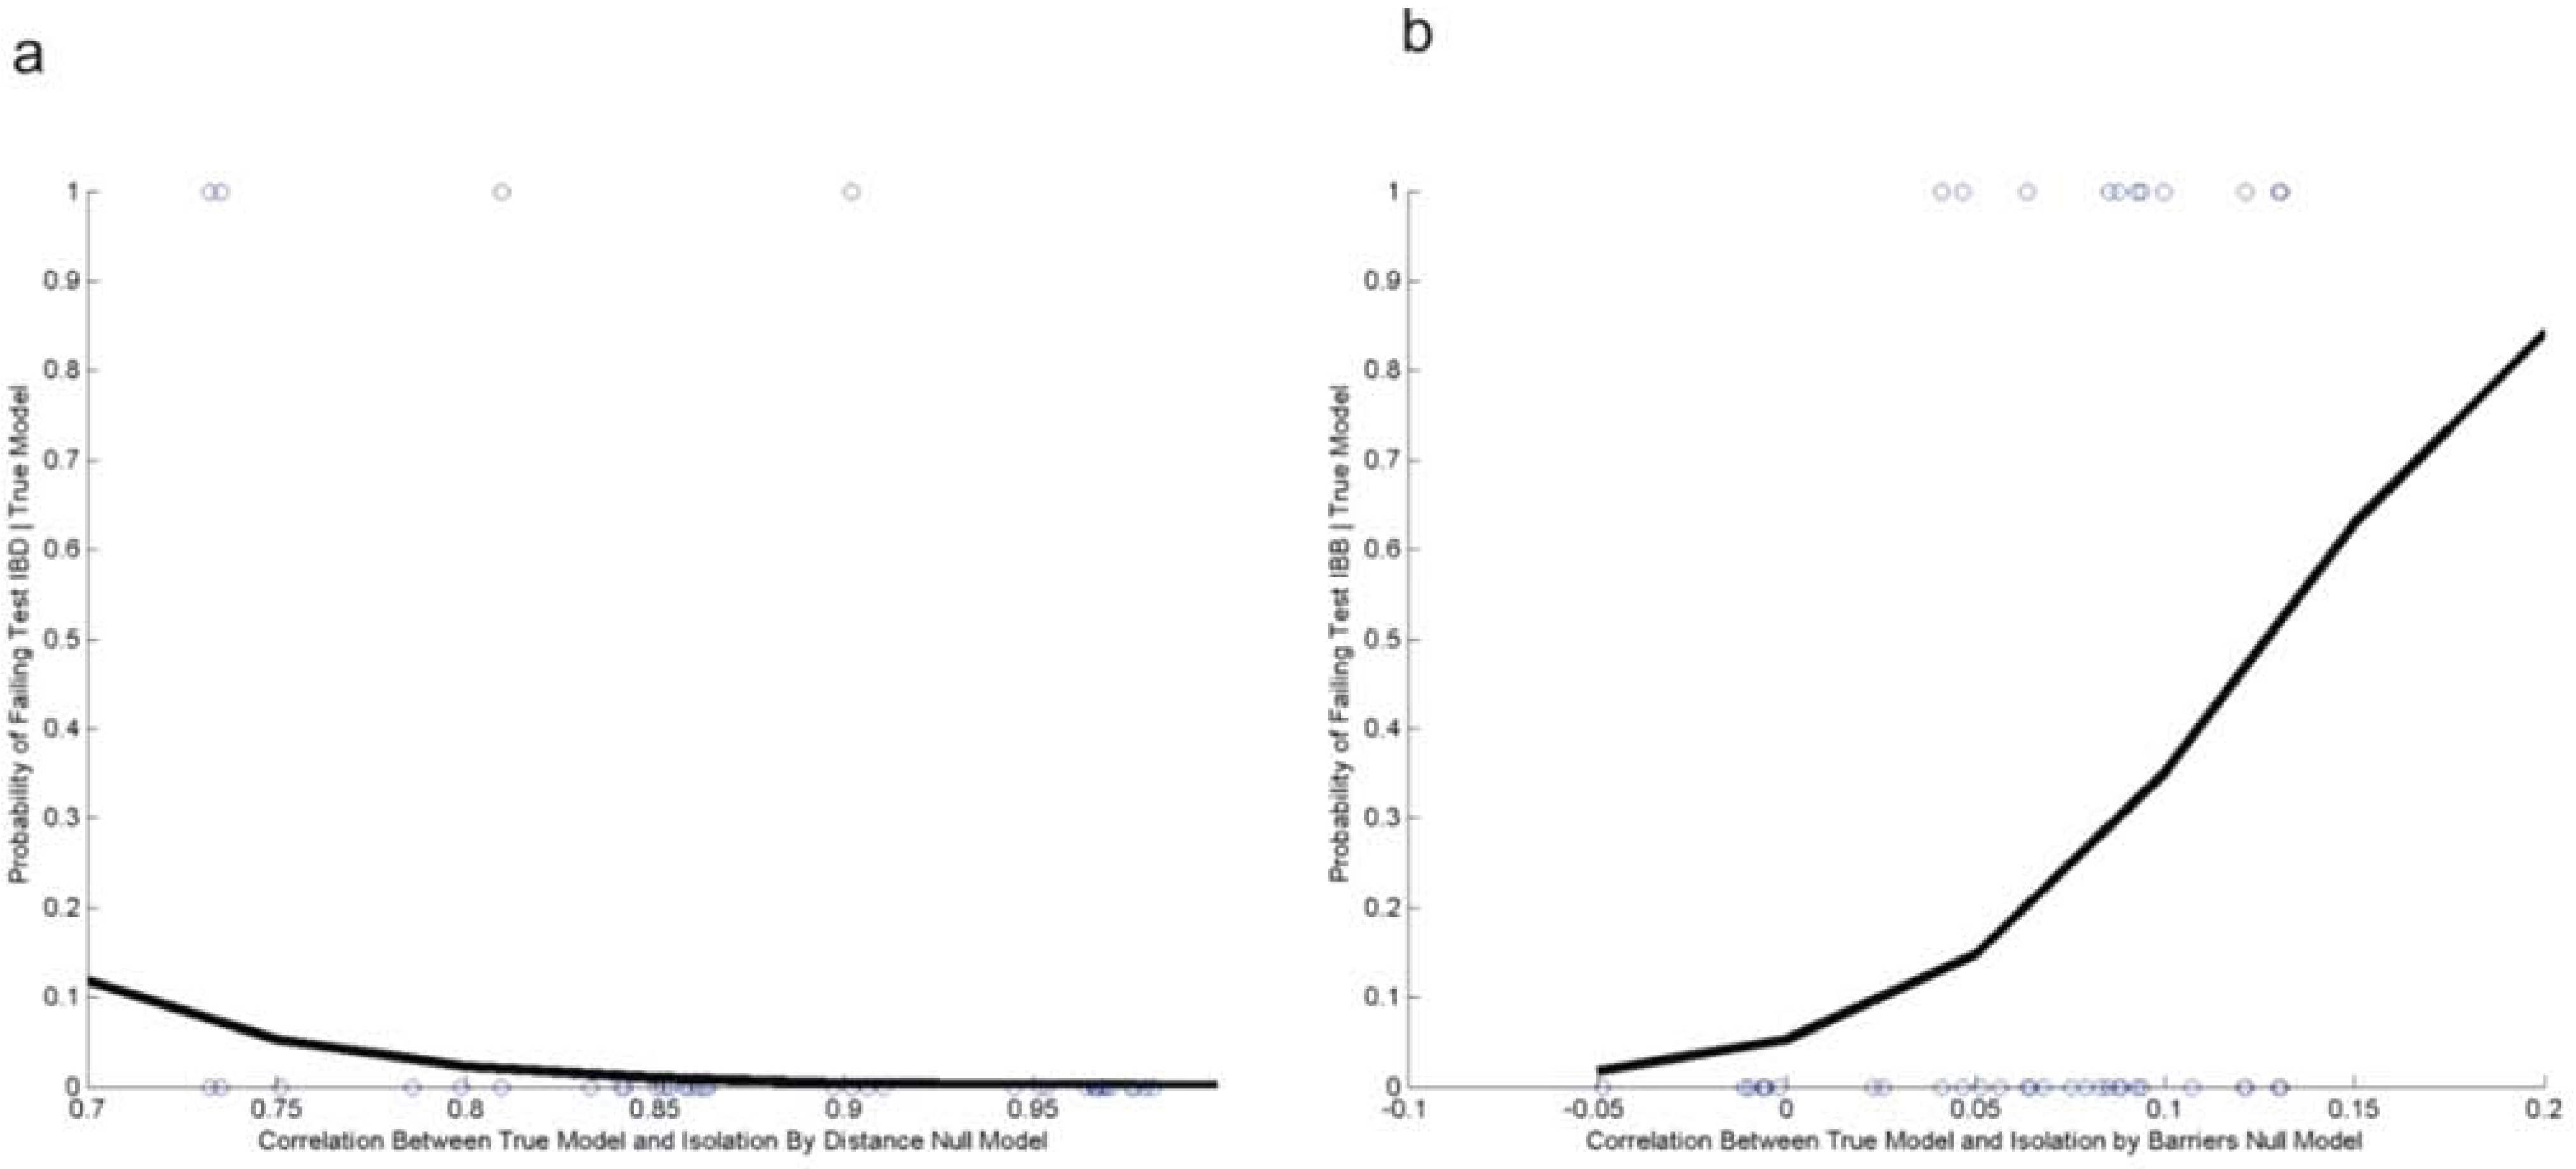
2.3. Evaluating Reliability of the Cushman et al. (2006) Causal Modeling Framework

CDPOP calculated a matrix of pair-wise genetic distances between all 1,248 simulated individuals based on the proportion of shared alleles (DPS; [39]) at generation 500. We then calculated 37 matrices of pair-wise least-cost distance using the COSTDISTANCE function in ArcGIS [40] for each of the 37 different landscape resistance models (Table 1).
Following Cushman et al. [6] and to assess the relationship between genetic and landscape distance matrices, we used Mantel tests [41] as implemented in the “Ecodist” package [42] in R [43]. We calculated simple and partial Mantel r (correlation between genetic distance and cost distance, partialling out Euclidean distance) for all 370 simulated populations (10 replicates times 37 alternative models) at generation 500. We assessed statistical significance with 999 permutations.
For each of the 35 alternative landscape resistance hypotheses, we calculated four partial Mantel tests to assess the degree of association between each genetic distance matrix and landscape distance matrix, partialling out the effect of an alternative landscape distance matrix (Table 2). Causal modeling with distance matrices using partial Mantel tests provides outcomes in terms of significance and non-significance of a series of tests that can be used to reject explanations that are not consistent with the expectations of the causal model. We evaluated the frequency with which causal modeling correctly supported the true resistance model and rejected the alternative hypotheses of isolation by distance and isolation by barrier for each of the 35 landscape resistance models. We used logistic regression to evaluate the nature and strength of the relationship between frequency of each of the four tests meeting the causal modeling expectation and the degree of correlation between the true resistance hypothesis and the null models of isolation by distance and isolation by barrier.
Table 2. The four partial Mantel tests used in the causal modeling framework to assess the degree of association between each genetic distance matrix and three cost distance matrices, representing the two null models (Isolation by Distance, Isolation by Barrier), and the correct landscape resistance model. The expected outcomes are for the situation where the landscape resistance model is a true driver of the observed genetic differentiation.
Test NumberDependent VariableIndependent VariableCovariateExpected Outcome
1Genetic DistanceLandscape Resistance Model Cost DistanceIsolation by DistanceSignificant
2Genetic DistanceLandscape Resistance Model Cost DistanceIsolation by BarrierSignificant
3Genetic DistanceIsolation by DistanceLandscape.Resistance Model Cost DistanceNot Significant
4Genetic DistanceIsolation by BarrierLandscape.Resistance.Model Cost DistanceNot Significant

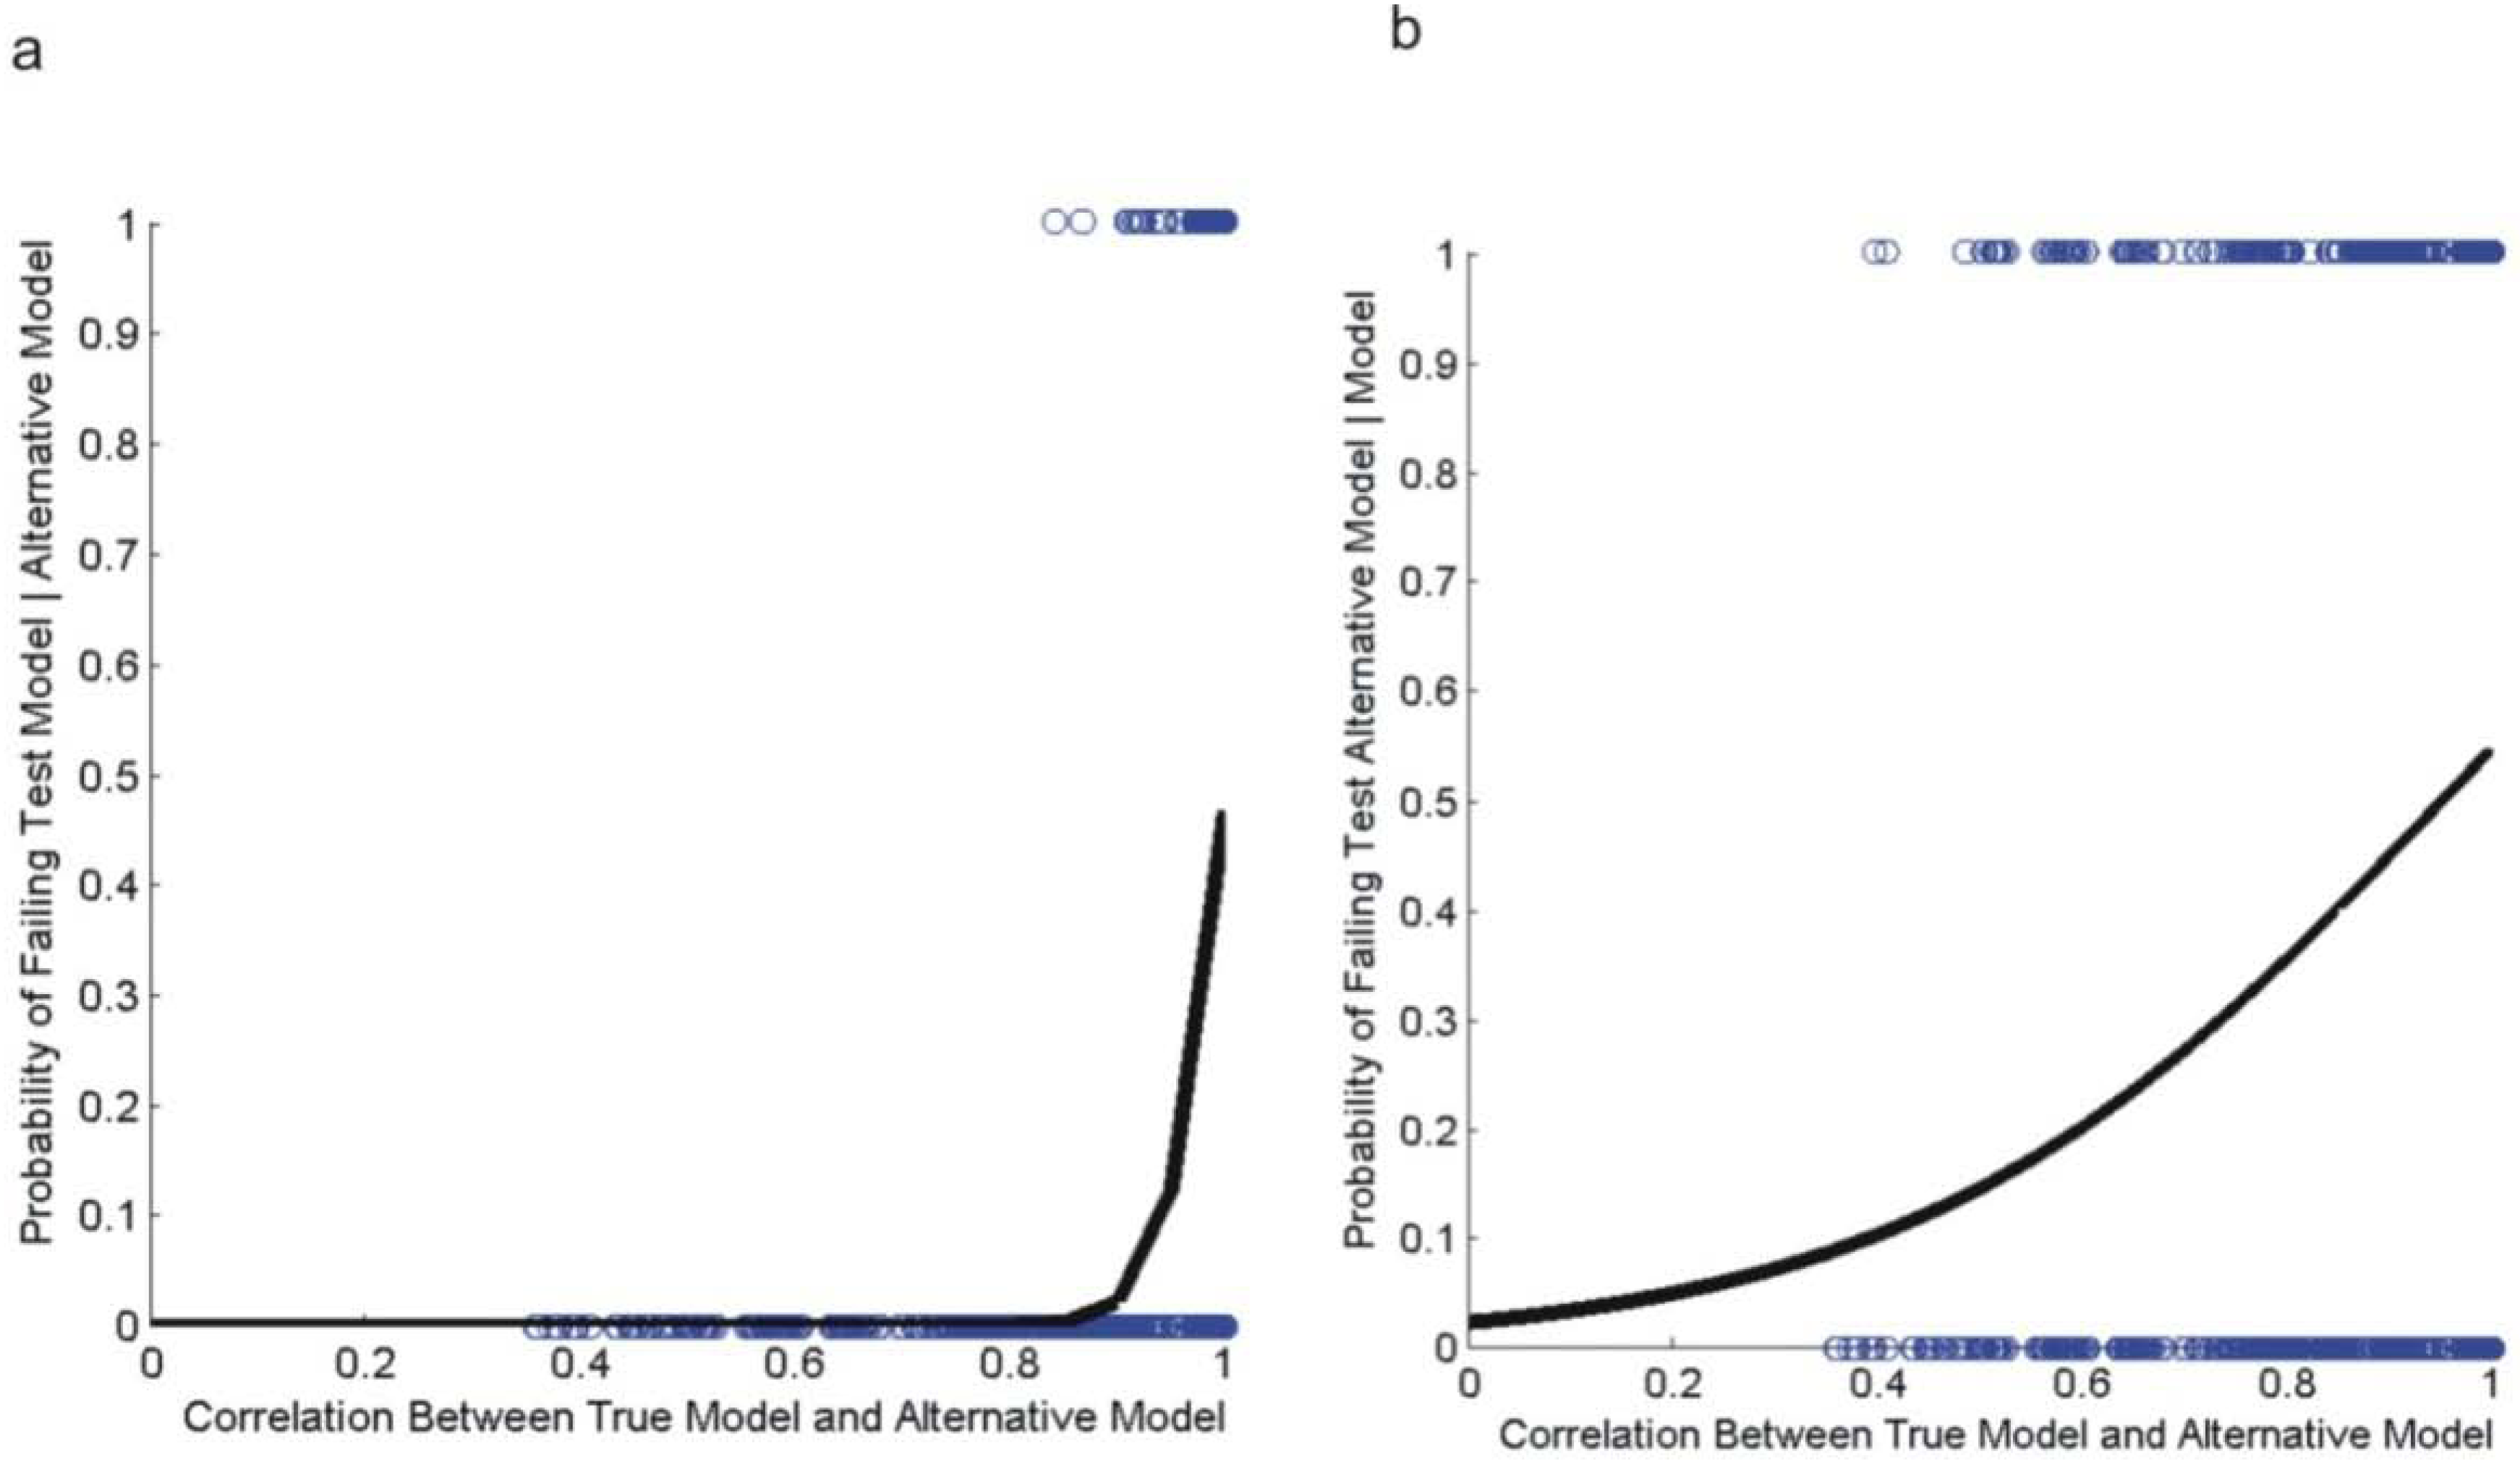
2.4. Evaluating Reliability of the Wasserman et al. (2010) Causal Modeling Framework

Wasserman et al. [11] expanded the causal modeling framework [24,25] to provide more robust landscape genetic inference. In the Wasserman et al. [11] approach, instead of ranking alternative landscape resistance models by partial Mantel p-values (partialling out distance) and then testing the highest ranking model with causal modeling (as described above; [6,31]), all landscape models directly compete with each other without a preliminary ranking step. This approach employs two sets of diagnostic tests: (1) partial Mantel tests between genetic distance and one simulated model, partialling out the effect of each alternative model in turn and (2) partial Mantel tests between genetic distance and each alternative model, partialling out the effect of one simulated model. For example, in the case when hypothesis EH (i.e., resistance lowest at high elevation) was simulated as the true resistance process, we computed two sets of partial Mantel tests: 36 partial Mantel tests consisting of the correlation between genetic distance and the EH hypothesis, partialling out each of the 36 alternative resistance hypotheses in turn (i.e., 34 alternative landscape resistance hypotheses, plus isolation by distance and isolation by barrier), and 36 partial Mantel tests calculating the correlation between genetic distance and each of the 36 alternative hypotheses in turn, partialling out the EH resistance model. For a resistance model to be formally affirmed as the only hypothesis supported, all of the tests in (1) must be significant, and none of the tests in (2) can be significant. This would show that the identified model has a statistically significant ability to predict genetic distances after removing the effects of each of the competing alternative models individually and that none of the competing alternative models have a significant ability to predict genetic distances after removing the effects of the hypothesized model. We calculated the number of times that the simulated resistance model was identified correctly as the driving model, and all alternative hypotheses were rejected. We used logistic regression to evaluate the relationship between frequency of the true resistance model being correctly supported independent of the correlated alternative models and the frequency of the correlated alternative models being correctly rejected based on no relationship with genetic distance, independent of the true resistance hypothesis.

3. Results and Discussion

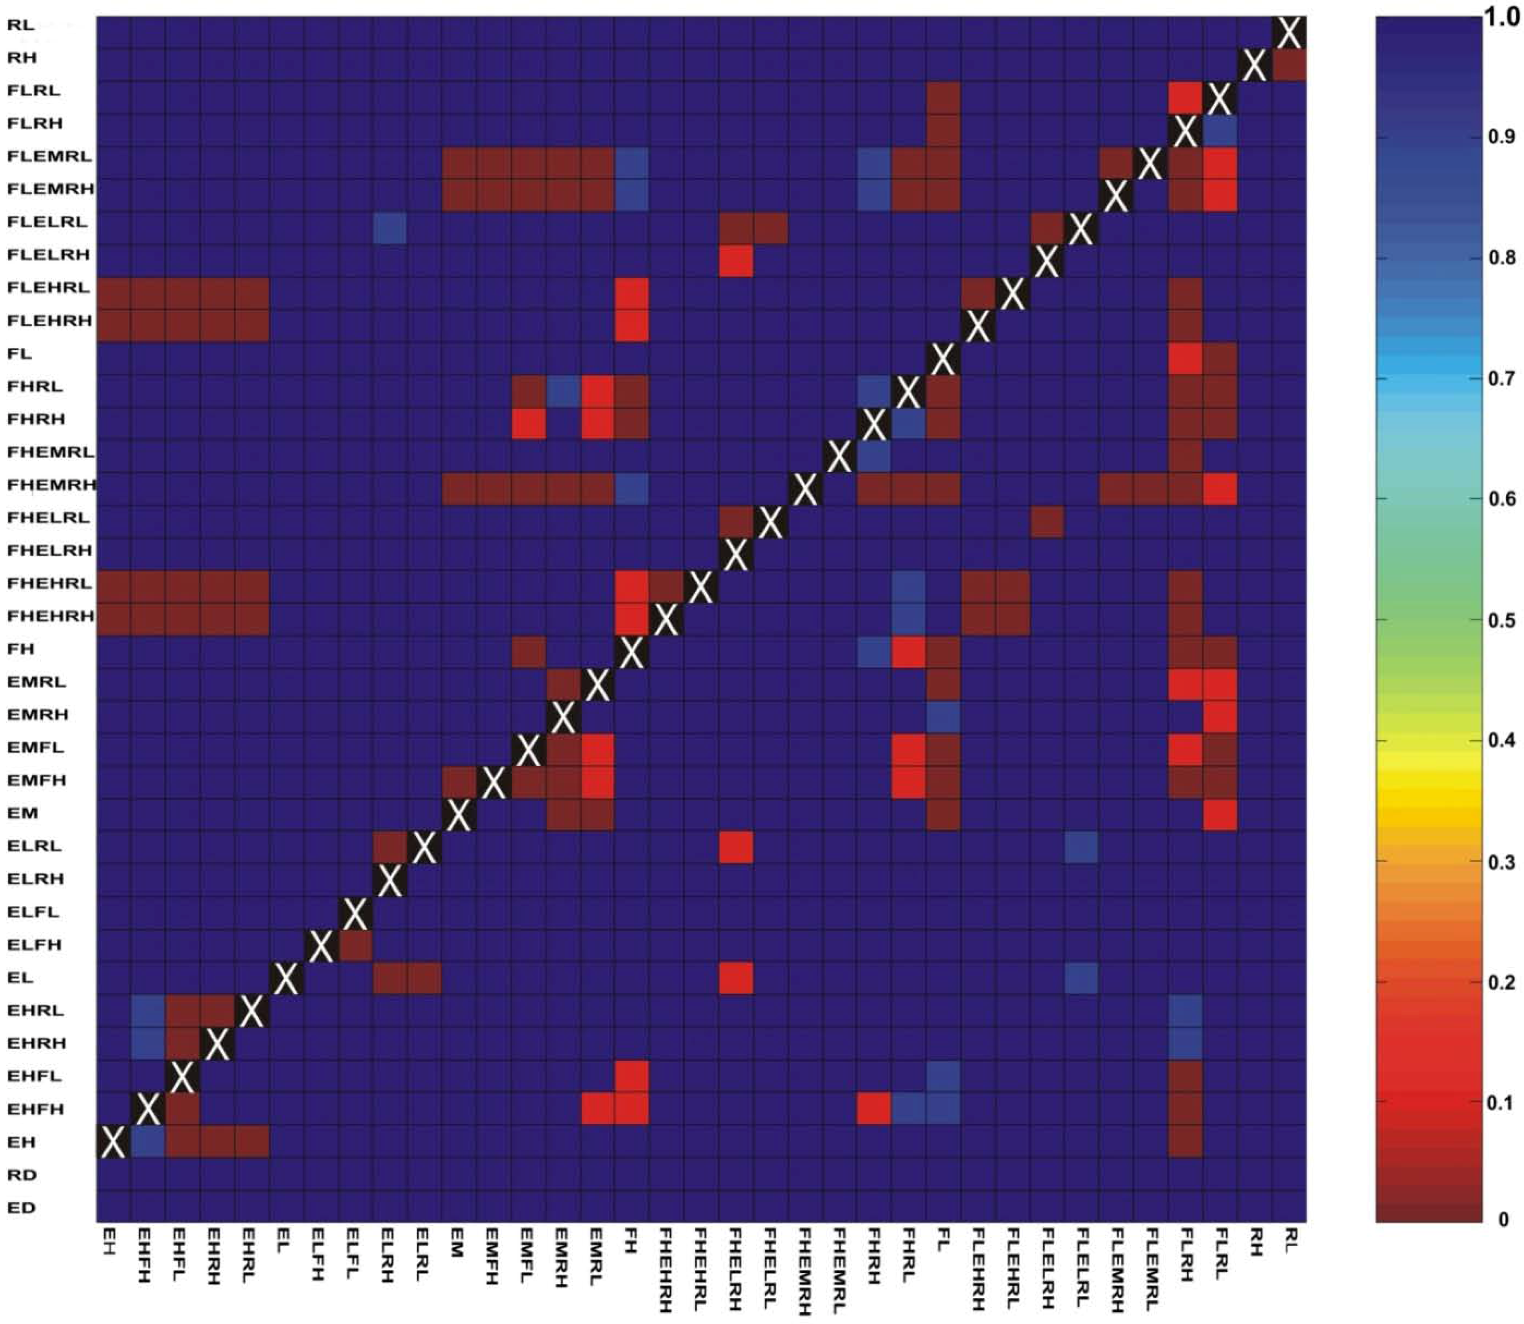
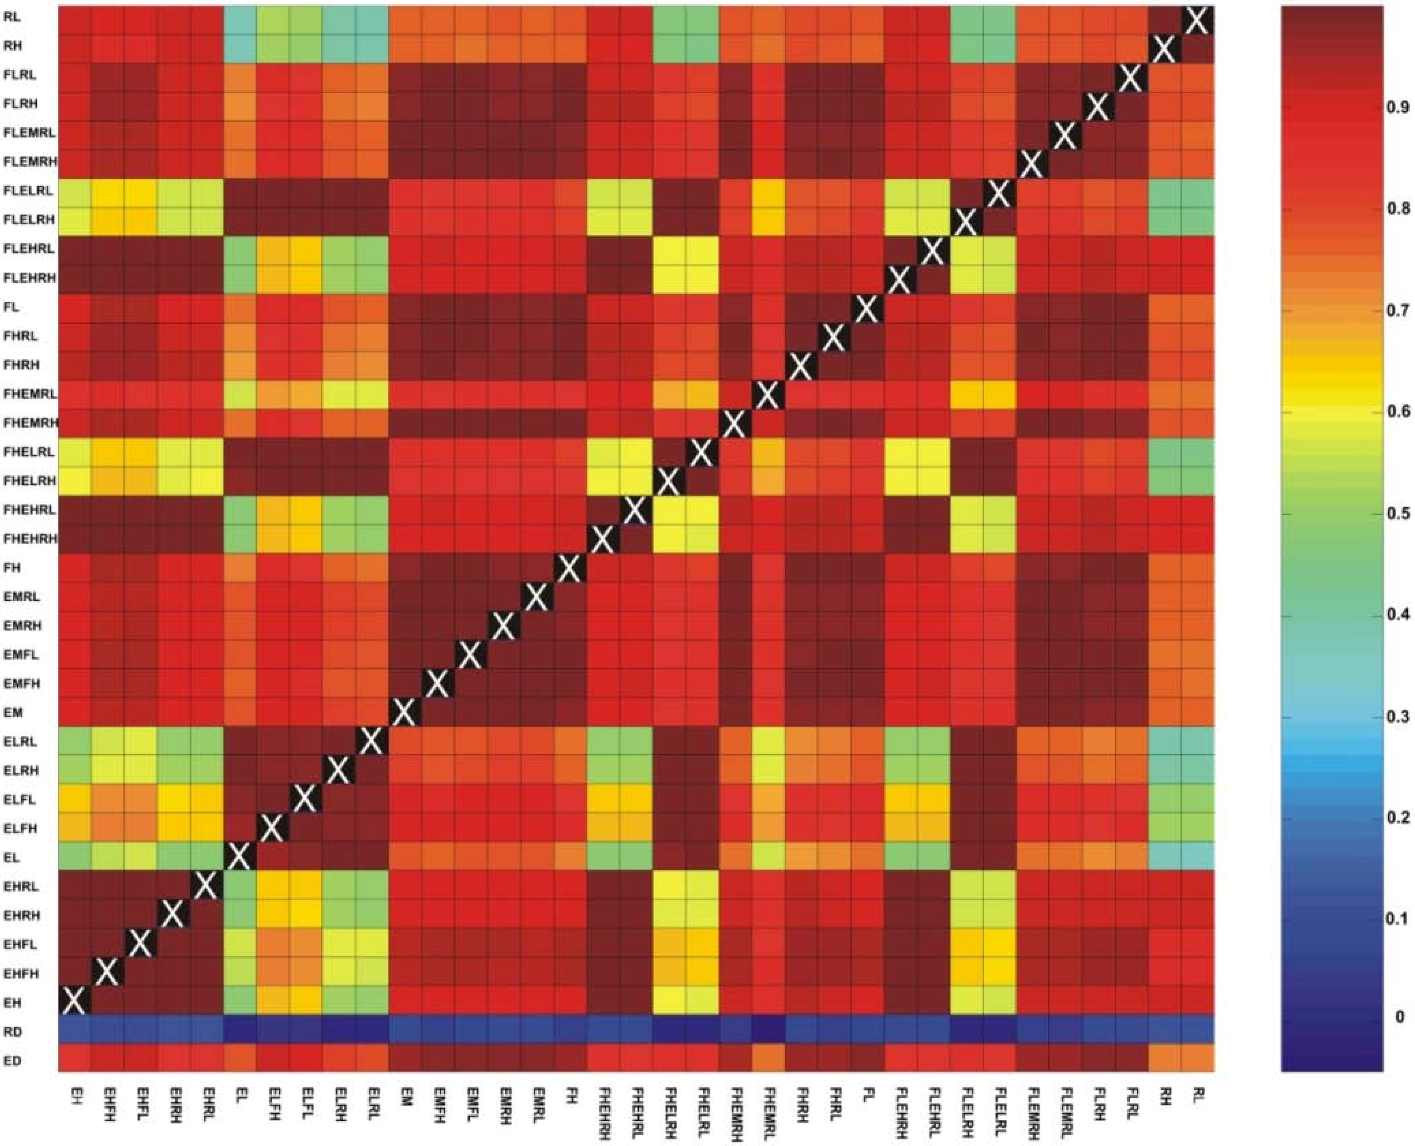
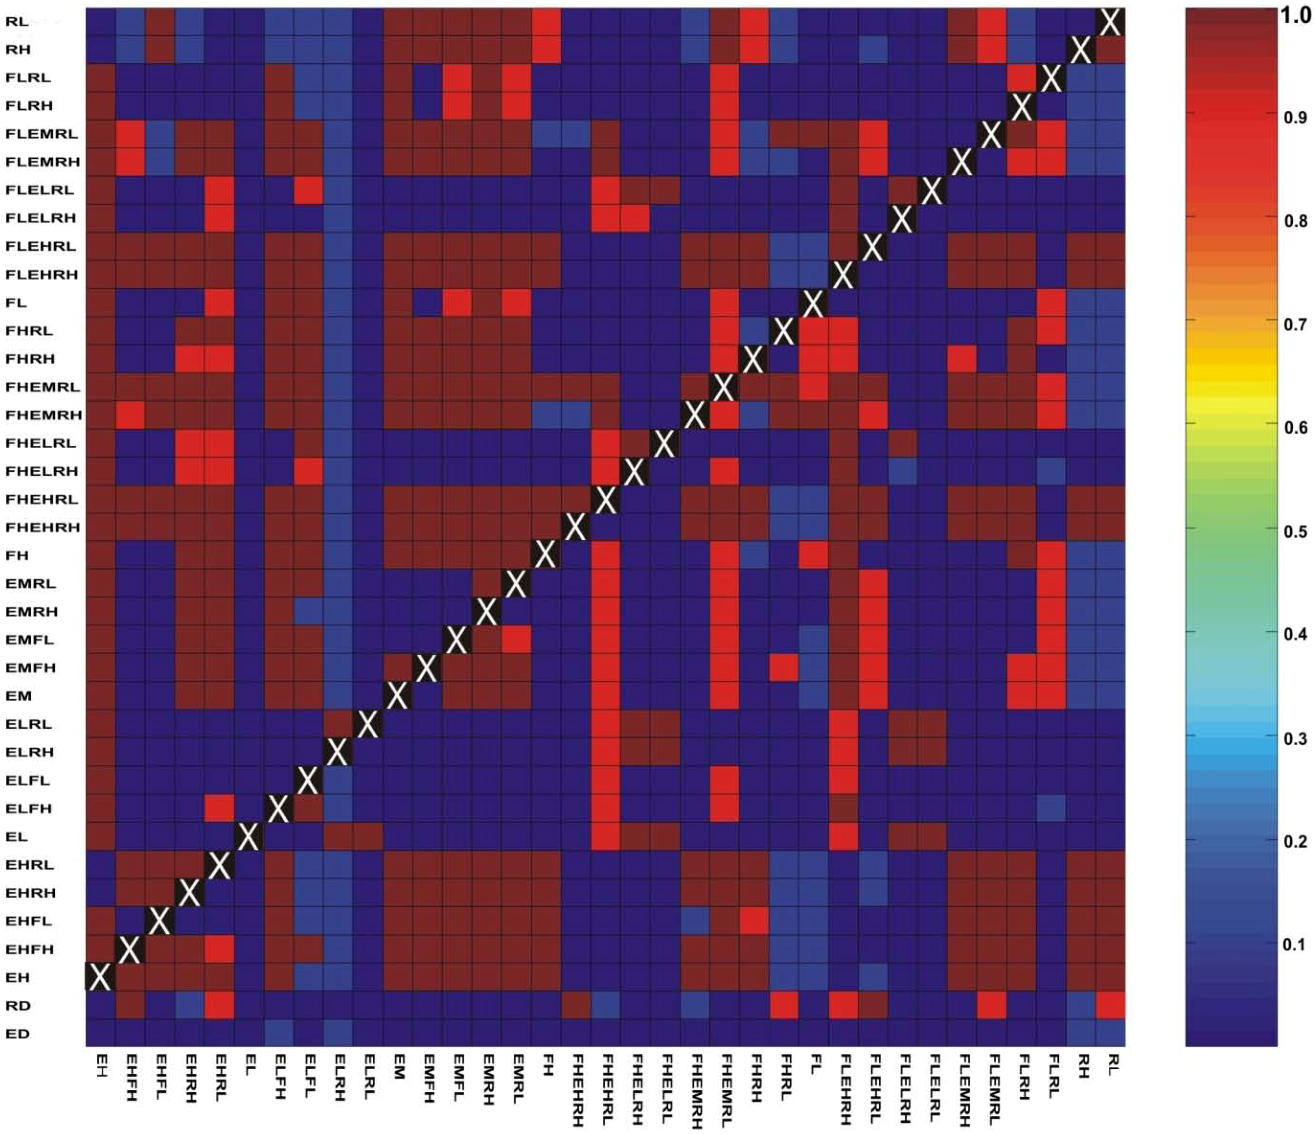
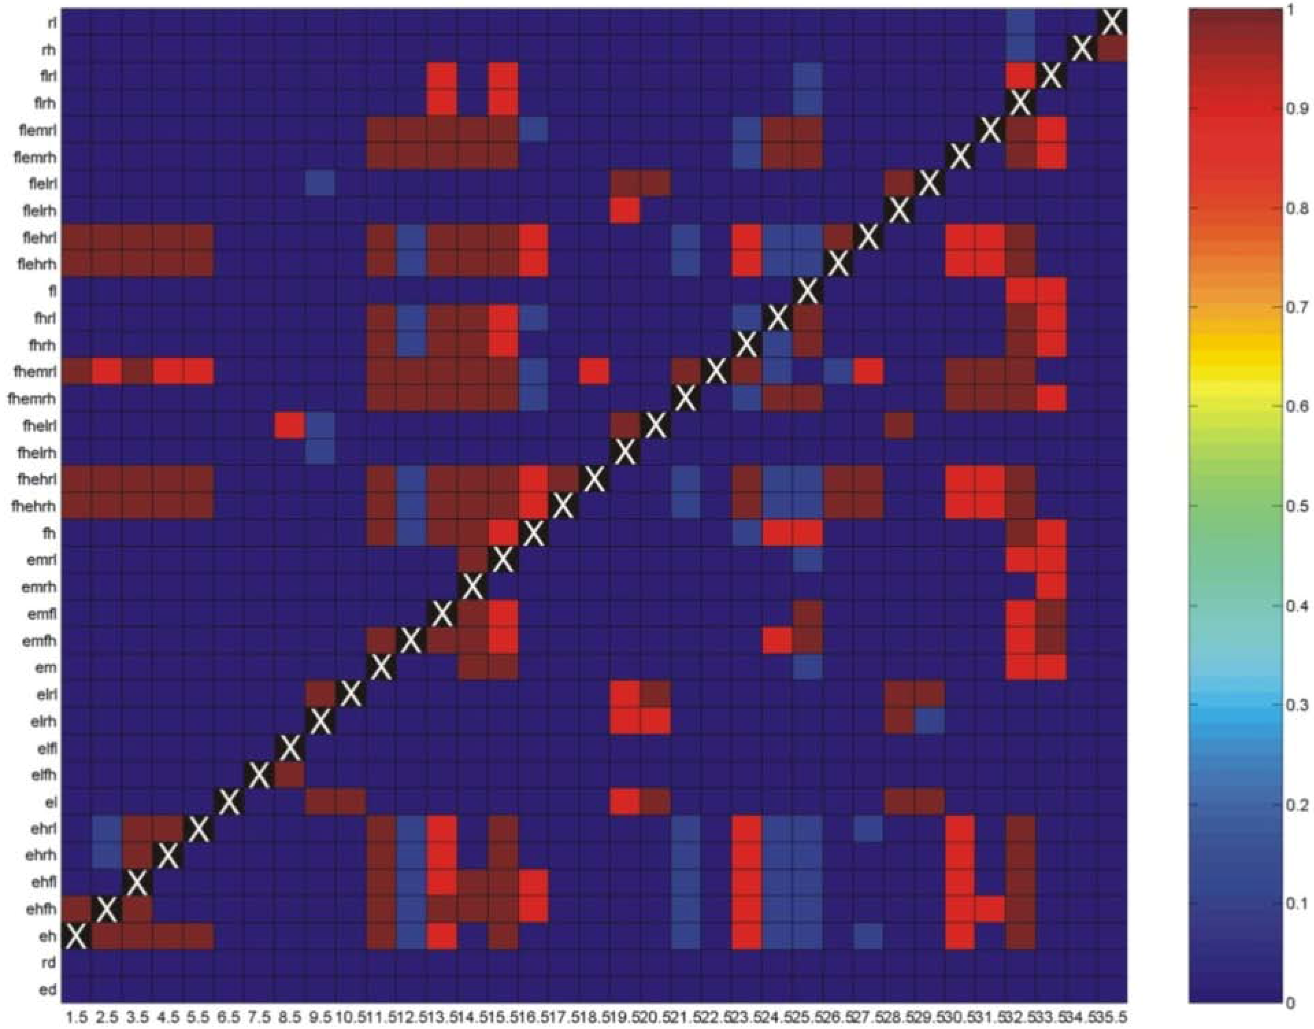
3.1. Correlations among Resistance Hypotheses

We found high correlation of the cost distances among pairs of resistance hypotheses (Figure 4). The average Mantel correlation of cost distances among all combinations of the 35 alternative landscape resistance hypotheses was 0.841. The minimum correlation was 0.359 between the models EL and RL (Table 1). There were more than 50 pairs of resistance hypotheses with a Mantel r larger than 0.99 (Figure 4). These generally were pairs of resistance models that shared the same optimal elevation or the same sensitivity to forest cover or both.
Figure 4. Matrix of Mantel correlations between cost distances between all pairs of 1,248 source points in all pairs of resistance hypotheses. The rows and columns of the matrix represent each of the 35 resistance hypotheses (Table 1), with the bottom two rows representing the two null models of isolation by barrier (rd) and isolation by distance (ed). The color of the cell corresponds to the magnitude of the Mantel r correlation between the cost distances in the pair of resistance hypotheses, indicated by the intersection of the row and column.
Diversity 05 00051 g004

3.2. Evaluating Reliability of Causal Modeling

There were four diagnostic partial Mantel tests in the Cushman et al. [6] method of causal modeling (Figure 1a): (1) simulated model | isolation by distance null model, (2) simulated model | isolation by barriers null model, (3) isolation by distance | simulated model, (4) isolation by barriers | simulated model (Table 2). The symbol | indicates a partial Mantel test, where the variable following the | symbol is partialled out of the Mantel correlation between genetic distance and the variable preceding the | symbol. All runs of each of the 35 alternative resistance hypotheses produced the correct result in the first two of these tests (Figure 5). The results indicated the perfect ability of partial Mantel tests to affirm independent relationships between the true resistance hypothesis and genetic distance, independent of isolation by a barrier or isolation by distance (Tests 1 and 2, Table 2).
Thirty-one of the 35 alternative landscape resistance models had perfect performance on Test 3. Of the four that had less than perfect performance, all performed perfectly in over 80% of model runs. In contrast, 12 of 35 alternative resistance models had less than perfect performance in Test 4. In nine of these, the expectations of Test 4 were not met in the majority of runs, and three alternative resistance models always failed to meet the expectations of Test 4. These were models EHFH, FHEHRH and FLEHRL (Figure 5).
There was a strong association between the correlation of cost-distances between resistance models and the frequency with which they failed to meet Test 3 or Test 4 (Table 3). There was the perfect ability of partial Mantel tests to correctly reject the isolation by distance hypothesis when the correlation between the distance model and the true landscape resistance model was over 0.85 (Figure 6a). The ability to reject a spurious correlation with isolation by distance relationship decreased as the correlation between the true resistance model and the isolation by distance null model decreases, reaching a frequency 0.12 at a Mantel correlation of 0.70 between the isolation by distance model and the true resistance hypothesis (Figure 6a). In contrast, the probability of incorrectly finding support for barriers independent of the true resistance hypothesis increased with the correlation between the resistance model and the barrier null model, reaching a frequency of approximately 0.70 when the correlation between the barrier and true landscape models approached 0.15 (Figure 6b).
In the Wasserman et al. [11] form of causal modeling, there were two partial Mantel tests analogous to those in the Cushman et al. [6] form, including (1) the true model, partialling out the alternative landscape resistance model, and (2) the alternative resistance model, partialling out the true model (Figure 1b). Over 87% of the 1,260 combinations of models met the expectations of Test 1 in all CDPOP runs (Figure 4). Six of the 35 resistance models had significant associations with genetic distance, independent of all 34 alternative landscape resistance models (EL, ELFH, FHEHRL, FHEMRH, FHEMRL, RH; Figure 4). In contrast, only 61% of the 1,260 combinations of models met the expectations of Test 2 in all CDPOP runs, and no resistance models had significant associations with genetic distance independent of all 34 alternative landscape resistance models (Figure 5).
Table 3. Parameters for logistic regression equations predicting whether or not each of the diagnostic partial Mantel tests fails to produce the correct results as a function of the correlation between the true resistance model and the alternative resistance model. IBD | Model: simple causal modeling diagnostic test of whether there is independent (spurious) support for isolation by distance independent of the true model. IBB | Model: simple causal modeling diagnostic test of whether there is independent (spurious) support for isolation by barrier independent of the true model. True | Alternative: causal modeling test of whether there is independent support for the true model independent of the alternative model. Alternative | True: causal modeling test of whether there is independent (spurious) support for the alternative model independent of the true model. The simple causal modeling tests, Model | IBD and Model | IBB, are not shown, as they both had 100% correct performance across all alternative resistance models and model runs (Figure 3). The symbol | indicates a partial Mantel test, where the variable following the | symbol is partialled out of the Mantel correlation between genetic distance and the variable preceding the | symbol.
Test NumberLogistic Regression Model EstimateStd. ErrorZ valuePr(>|z|)
1IBD | ModelIntercept10.2076.2761.6260.1039
DD−17.4517.855−2.2220.0263
2IBB | ModelIntercept−2.88870.3562−8.1115.03 x 10-16
DD22.77083.91555.8166.04 x 10-9
3True | AlternativeIntercept−36.61.187−30.82<2 × 10⁻¹⁶
DD36.4721.21130.11<2 × 10⁻¹⁶
4Alternative | TrueIntercept−3.72340.1289−28.88<2 × 10⁻¹⁶
DD3.9160.147126.62<2 × 10⁻¹⁶
There was the perfect ability of a resistance hypothesis to be shown to be independently supported compared to alternative resistance hypotheses when the correlation between the true and alternative resistance models was less than 0.85 (Figure 7a). The correct model was usually identified, even when the correlation between the true and alternative models was very high (r > 0.98; Figure 8a). In contrast, there was a more than 10% chance of spurious support of the alternative model across all levels of correlation between the true and alternative resistance hypotheses (Figure 8b). The chance of spurious independent correlation between the alternative model and genetic distance, independent of the true simulated hypothesis, increased with increasing correlation between resistance hypotheses, with greater than a 50% chance of independent spurious relationships when the alternative model had a Mantel correlation of over 0.9 with the true resistance hypothesis (Figure 7b).
Figure 5. Frequency of significant independent association between a simulated landscape resistance model and genetic distance. The rows of the matrix represent each of the 37 resistance hypotheses. The first 35 rows are the alternative landscape resistance models, with the bottom two rows representing the two null models of isolation by barrier (rd) and isolation by distance (ed). The columns represent the 35 resistance hypotheses simulated as truth in CDPOP. The color of the cell corresponds to the frequency with which the partial Mantel correlation between the model associated with a given column and genetic distance, partialling out the model associated with a given row, is statistically significant (alpha = 0.05). Cells in blue have a very high frequency of correctly finding independent correlation between the simulated resistance model and genetic distance, while red cells have a high frequency of failing to find significant correlation between the true resistance model and genetic distance, partialling out the model associated with that row of the matrix.
Diversity 05 00051 g005
Figure 6. Frequency of significant spurious association between an alternative resistance model and genetic distance, independent of the simulated landscape resistance model. The rows of the matrix represent each of the 37 landscape models. The first 35 rows are the alternative landscape resistance models, with the bottom two rows representing the two null models of isolation by barrier (rd) and isolation by distance (ed). The columns represent the 35 resistance hypotheses simulated as being true in CDPOP. The color of the cell corresponds to the frequency with which the partial Mantel correlation between the model associated with a given row and genetic distance, partialling out the model associated with a given column, is statistically significant (alpha = 0.05). Cells in blue have a very high frequency of correctly finding independent correlation between the simulated resistance model and genetic distance, while red cells have a high frequency of failing to find significant correlation between the true resistance model and genetic distance, partialling out the model associated with that row of the matrix.
Diversity 05 00051 g006
Figure 7. Binary scatterplots of the frequency of (a) failing to pass Test 1 or (b) Test 2 in comparison with the correlation between the simulated landscape resistance model and a particular null model. The x-axis is the correlation between the cost-distances in the simulated landscape resistance model and the null model. The black line is the probability of failing to meet the respective causal modeling diagnostic test (from logistic regression; Table 3).
Diversity 05 00051 g007
Figure 8. Binary scatterplots of the frequency of failing (a) to pass Test 3 or (b) Test 4 in comparison with the correlation between the simulated landscape resistance model and alternative landscape resistance models. The x-axis is the correlation between the cost-distances in the simulated landscape resistance model and the alternative model. The black line is the probability of failing to meet the respective causal modeling diagnostic test (from logistic regression; Table 3).
Diversity 05 00051 g008

3.3. Evaluation of Hypotheses

As expected, the Cushman et al. [6] form of causal modeling had high power to correctly identify the driving process (i.e., low rate of failing to find significant support for the true model, independent of null models). Extending the results reported in Cushman and Landguth [26] to a wide range of alternative resistance hypotheses, our results indicated the perfect ability of partial Mantel tests to correctly identify relationships between landscape resistance and genetic differentiation, independent of null models of isolation by distance and isolation by barrier. This confirms that partial Mantel tests have high power to identify correlative relationships between landscape resistance and genetic structure. Also, as expected, we found a lesser ability of causal modeling to correctly reject null models that were highly correlated with the true driving process (a higher rate of significant partial Mantel correlation between null models and genetic distance, partialling out the simulated resistance model). This tendency of Mantel tests to more commonly find significant support for correlated alternative models than to fail in finding support for the true resistance hypothesis was consistent with Cushman and Landguth [26], who found higher rates of failing to reject the incorrect null model than failing to affirm the correct resistance hypothesis. However, Cushman and Landguth [26] also found the high ability of causal modeling to correctly evaluate all four diagnostic partial Mantel tests (over 98% power within 40 generations). In contrast, we found considerable variability among resistance hypotheses in the performance of causal modeling. Specifically, causal modeling failed to reject spurious isolation by distance or isolation by barrier models in one-third of the simulated resistance models. Cushman and Landguth [26] used the model FHEMRH as the single resistance model evaluated. Our results confirmed that causal modeling performs very well in distinguishing this particular resistance model from spurious isolation by distance or barrier relationships. Consistent with our expectation, however, the ability of causal modeling to correctly affirm a true resistance model while rejecting spurious relationships with isolation by distance or barriers was highly dependent on the correlation between the true resistance process and the isolation by distance and barrier models.
In the Wasserman et al. [11] form of causal modeling, all alternative landscape resistance models are competed against each other, providing a means of model selection, as well as hypothesis testing. We expected that the Wasserman et al. [11] form of causal modeling would have high power to correctly identify the driving process, independent of all alternative resistance models. However, our results indicated the limited ability of this form of causal modeling to affirm the correct model and reject all alternatives. Specifically, in no case was it able to reject all alternative landscape resistance models and affirm the correct model. Consistent with Wasserman et al. [11], we found much higher rates of finding significant correlations between spurious alternative models and genetic distance, partialling out the true resistance model, than failing to find significant correlations between the true model and genetic distance, partialling out all alternative models. The rate of failing to reject spurious alternative models was strongly positively related to the strength of correlation between the cost distances in simulated resistance hypothesis and those in alternative models that could not be rejected.

3.4. Implications for Landscape Genetic Analyses

Reliable inferences regarding the effects of landscape features on gene flow and population connectivity depend on analytical methods that have high power to correctly identify the driving process and reject spurious, correlated alternatives. Our results indicate that partial Mantel tests in a causal modeling framework have high power to do the former, but have a relatively weak ability to accomplish the latter. There is often a tradeoff between Type I and Type II error rates in statistical analysis. Our results show that partial Mantel tests in an individual-based, causal modeling framework have low Type II error rates (extremely high power to detect a relationship). The Cushman et al. [6] approach to causal modeling had perfect performance in identifying significant correlations between a wide range of landscape models and genetic structure, independent of spurious null models, and the Wasserman et al. [11] approach to causal modeling had nearly perfect performance (over 86%) in correctly identifying independent associations between the true resistance process, independent of a wide variety of highly correlated alternative models. However, both approaches suffer from high Type I error rates of incorrectly finding support for alternative models that are highly correlated with the correct resistance process (see also [44]).
The elevated Type I error rates reported here have several effects on the interpretation of the results of Mantel and partial Mantel tests in landscape genetics. First, as argued by Cushman and Landguth [26], the high sensitivity of simple Mantel tests to spurious correlations suggests that it is essential to adopt analytical frameworks that enable rigorous separation of true from spurious relationships. Our results indicate that causal modeling provides a large improvement over simple Mantel testing. However, the causal modeling approach is also vulnerable to elevated Type I error rates.
We can use this knowledge to provide guidance to interpret the outcomes of the diagnostic partial Mantel tests. First, when one finds that a particular resistance hypothesis is supported independently of alternative models using causal modeling with partial Mantel tests, this is likely to be correct, given that the elevated Type I error is a bias in the opposite direction. Second, when one finds that the resistance hypothesis is not supported independently of the alternative model, but the alternative model is supported independently of the resistance model, this suggests that the proposed resistance model is incorrect and that gene flow could be either governed by the alternative model or another resistance model not tested. Third, when the proposed resistance model is not significantly supported independently of the alternative model and the alternative model is not supported independently of the proposed model, this suggests that gene flow is not governed by either the proposed resistance model or the alternative model. In such cases, genetic structure may be influenced by a third untested resistance hypothesis. The final potential outcome is when the proposed landscape resistance model is supported independently of the alternative model and the alternative model is supported independently of the resistance model. This is the case most commonly seen in the present analysis, due to elevated Type I error rates leading to failure to correctly reject spurious correlations. In this case, it is impossible to determine, using causal modeling, if one of the two models is correct and the other spurious or if gene flow is governed by an untested third model that is correlated with the two.
Given the very high correlation among resistance models (average of over 0.84 in the present study), it is not surprising that causal modeling had less than perfect performance. Given that landscape resistance models are models of cumulative cost-over-distance, it is likely that most alternative models will be highly correlated [26]. No statistical approach will have perfect performance in separating highly correlated alternative resistance models in landscape genetics. However, it would be preferable to use methods that are balanced between Type I and Type II error rates. One way to perhaps balance the apparent bias toward affirmation relative to rejection in causal modeling would be to use a more stringent alpha level to evaluate significance (e.g., 0.01 or 0.005 instead of 0.05). We evaluated the effects of varying alpha from 0.05 to 0.005 by 0.01 increments (Table S1). Changing the alpha level from 0.05 to 0.005 had no effect on the perfect ability of partial Mantel tests to identify correlations between genetic distance and cost distance independent of null models of isolation by distance and isolation by barrier (Model | Null) and moderately decreased the rate of incorrectly finding correlation between null models and genetic distance. This suggests that using a more stringent alpha level may in part ameliorate the problem of partial Mantel tests finding spurious support for correlated alternative hypotheses.
Another way of improving the implementation of causal modeling with partial Mantel tests is to use the relative support, rather than formal rejection thresholds. For example, instead of relying on formal probabilistic statistical hypothesis testing, we propose evaluating the relative support for each of the diagnostic causal modeling tests. In the case of the Wasserman et al. [11] causal modeling approach, one could evaluate models based on the relative support for Test 1 and Test 2. Specifically, we found 100% correct performance in the Cushman et al. [6] form of the causal modeling framework when evaluated based on relative magnitude of partial Mantel r (Figure S1), and over 75% of all combinations of true and alternative model met the expectation of higher relative support of the true model compared to the alternative model (Figure S1). This suggests that causal modeling may be an effective approach in evaluating model support in landscape genetics if evaluated based on relative support for the diagnostic tests, rather than formal hypothesis testing, which suffers from elevated Type I error rates. Thus, we suggest basing model comparison on partial Mantel r rather than the p-value. Significance levels will still be useful in determining if there is a significant relationship between cost distances and genetic distances, but model comparison is best accomplished by comparing the relative magnitudes of the Mantel r values themselves. It should be remembered that the present results are produced for a single case study landscape [6], and while the analysis evaluates a wide range of alternative resistance hypotheses for this landscape, the generality of results to different habitat configurations and dispersal biology will require further work. Also, it should be acknowledged that the genetic distances derived represent a complete sample of the population. When applied to field data, genetic data are likely to be available from only a relatively small proportion of the total population. In some cases, this may lead to weaker correlations and less discrimination between alternative models. However, Landguth et al. [45] showed that the number of individuals sampled from a population does not affect partial Mantel r, but larger samples increases the precision of equilibrium partial Mantel r estimates.

4. Conclusions

We found that partial Mantel tests have very low Type II error rates, but elevated Type I error rates. This leads to frequent identification of support for spurious correlations between alternative resistance hypotheses and genetic distance, independent of the true resistance model. The frequency in which this occurs is positively related to the degree of correlation between true and alternative resistance models. We propose an improvement based on the relative support of the causal modeling diagnostic tests. We show that using the difference between the support among alternative models improves the performance of causal modeling. Specifically, it did not reduce the power of the approach to identify the correct driver, and simultaneously, it decreased the chance of Type I errors in which incorrect alternative models that are highly correlated with the true driving process are spuriously affirmed. Overall, the present study indicates that causal modeling with partial Mantel tests is a large improvement over simple Mantel testing, but that elevated Type I error rates associated with Mantel testing still need to be addressed. The calculation of relative support among a full combination of alternative hypotheses appears to be a robust way of reducing Type I error rates in Mantel testing in individual-based landscape genetics. The large improvement of performance using this method appears to at least partially alleviate the reported bias in partial Mantel tests relating to autocorrelation [21,22,23].

Acknowledgments

This work was supported by the USDS Forest Service Rocky Mountain Research Station.

References

  1. Manel, S.; Schwartz, M.K.; Luikart, G.; Taberlet, P. Landscape genetics: combining landscape ecology and population genetics. Trends Ecol. Evol. 2003, 18, 189–197. [Google Scholar] [CrossRef]
  2. Holderegger, R.; Wagner, H.H. Landscape genetics. Bioscience 2008, 58, 199–207. [Google Scholar] [CrossRef]
  3. Balkenhol, N.; Gugerli, F.; Cushman, S.A.; Waits, L.P.; Coulon, A.; Arntzen, J.W.; Holderegger, R.; Wagner, H.H.; Arens, P.; Campagne, P.; et al. Identifying future research needs in landscape genetics: where to from here? Landscape Ecol. 2009, 24, 455–463. [Google Scholar] [CrossRef]
  4. Segelbacher, G.; Cushman, S.A.; Epperson, B.K.; Fortin, M.-J.; Francois, O.; Hardy, O.J.; Holderegger, R.; Manel, S. Applications of landscape genetics in conservation biology: concepts and challenges. Conserv. Genet. 2010, 11, 375–385. [Google Scholar] [CrossRef]
  5. Spear, S.F.; Peterson, C.R.; Matocq, M.D.; Storfer, A. Landscape genetics of the blotched tiger salamander (Ambystoma tigrinum melanostictum). Mol. Ecol. 2005, 14, 2553–2564. [Google Scholar] [CrossRef]
  6. Cushman, S.A.; McKelvey, K.S.; Hayden, J.; Schwartz, M.K. Gene-flow in complex landscapes: testing multiple models with causal modeling. Am. Nat. 2006, 168, 486–499. [Google Scholar] [CrossRef]
  7. McRae, B.H.; Beier, P. Circuit theory predicts gene flow in plant and animal populations. Proc. Natl. Acad. Sci. USA 2007, 104, 19885–19890. [Google Scholar] [CrossRef]
  8. Pérez-Espona, S.; Pérez-Barbería, F.J.; McLeod, J.E.; Jiggins, C.D.; Gordon, I.J.; Pemberton, J.M. Landscape features affect gene flow of Scottish Highland red deer (Cervus elaphus). Mol. Ecol. 2008, 17, 981–996. [Google Scholar] [CrossRef]
  9. Lee-Yaw, J.A.; Davidson, A.; McRae, B.H.; Green, D.M. Do landscape processes predict phylogeographic patterns in the wood frog? Mol. Ecol. 2009, 18, 1863–1874. [Google Scholar] [CrossRef]
  10. Shirk, A.; Wallin, D.O.; Cushman, S.A.; Rice, R.C.; Warheit, C. Inferring landscape effects on gene flow: a new multi-scale model selection framework. Mol. Ecol. 2010, 19, 3603–1619. [Google Scholar] [CrossRef]
  11. Wasserman, T.N.; Cushman, S.A.; Schwartz, M.K.; Wallin, D.O. Spatial scaling and multi-model inference in landscape genetics: Martes americana in northern Idaho. Landscape Ecol. 2010, 25, 1601–1612. [Google Scholar] [CrossRef]
  12. Murphy, M.A.; Evans, J.S.; Storfer, A. Quantifying Bufo boreas connectivity in Yellowstone National Park with landscape genetics. Ecology 2010, 91, 252–261. [Google Scholar] [CrossRef]
  13. Krist, F.J.; Brown, D.G. GIS modeling of paleo-indian period caribou migrations and viewsheds in northeastern lower Michigan. Photogramm. Eng. Rem. S. 1994, 60, 1129–1137. [Google Scholar]
  14. Walker, R.; Craighead, L. Analyzing wildlife movement corridors in Montana using GIS. Proceedings of the Esri User Conference '97. Available online: http://gis.Esri.com/library/userconf/proc97/proc97/to150/pap116/p116.htm (accessed on 15 February 2013).
  15. McRae, B.H. Isolation by resistance. Evolution 2006, 60, 1551–1561. [Google Scholar]
  16. Mantel, N. The detection of disease clustering and a generalized regression approach. Cancer Res. 1967, 27, 209–220. [Google Scholar]
  17. Smouse, P.E.; Long, J.C.; Sokal, R.R. Multiple regression and correlation extensions of the Mantel test of matrix correspondence. Syst. Zool. 1986, 35, 627–632. [Google Scholar] [CrossRef]
  18. Raufaste, N.; Rousset, F. Are partial Mantel tests adequate? Evolution 2001, 55, 1703–1705. [Google Scholar]
  19. Castellano, S.; Balletto, E. Is the partial Mantel test inadequate? Evolution 2002, 56, 1871–1873. [Google Scholar]
  20. Legendre, P.; Fortin, M.-J. Comparison of the Mantel test and alternative approaches for detecting complex multivariate relationships in the spatial analysis of genetic data. Mol. Ecol. Res. 2010, 10, 831–844. [Google Scholar] [CrossRef]
  21. Guillot, G.; Rousset, F. On the use of simple and partial Mantel tests in the presence of spatial auto-correlation. 2011, arXi, 1112.0651v1. [Google Scholar]
  22. Meirmans, P.G. The trouble with isolation by distance. Mol. Ecol. 2012, 21, 2839–2846. [Google Scholar] [CrossRef]
  23. Amos, J.; Bennet, A.F.; Mac Nally, R.; Newell, G.; Radford, J.Q.; Pavlova, A.; Thompson, J.; White, M.; Sunnucks, P. Predicting landscape genetic consequences of habitat loss, fragmentation and mobility for species of woodland birds. Plos One 2012, 7, e30888. [Google Scholar]
  24. Legendre, P.; Troussellier, M. Aquatic heterotrophic bacteria: modeling in the presence of spatial autocorrelation. Limnol. Oceanogr. 1988, 33, 1055–1067. [Google Scholar] [CrossRef]
  25. Legendre, P. Spatial autocorrelation: trouble or new paradigm? Ecology 1993, 74, 1659–1673. [Google Scholar] [CrossRef]
  26. Cushman, S.A.; Landguth, E.L. Spurious correlations and inference in landscape genetics. Mol. Ecol. 2010, 19, 3592–3602. [Google Scholar] [CrossRef]
  27. Cushman, S.A.; Lewis, J. Movement behavior explains genetic differentiation in American black bear. Landscape Ecol. 2010, 25, 1613–1625. [Google Scholar] [CrossRef]
  28. Wasserman, T.N.; Cushman, S.A.; Shirk, A.S.; Landguth, E.L.; Littell, J.S. Simulating the effects of climate change on population connectivity of American marten (Mates americana) in the northern Rocky Mountains, USA. Landscape Ecol. 2012, 27, 211–225. [Google Scholar] [CrossRef]
  29. Wasserman, T.N.; Cushman, S.A.; Littell, J.S.; Landguth, E.L. Population connectivity and genetic diversity of American marten (Martes Americana) in the United States northern Rocky Mountains in a climate change context. Conserv. Genet. 2012. [Google Scholar] [CrossRef]
  30. Landguth, E.L.; Cushman, S.A. CDPOP: An individual-based, cost-distance spatial population genetics model. Mol. Ecol. Resour. 2010, 10, 156–161. [Google Scholar] [CrossRef]
  31. Short Bull, R.A.; Cushman, S.A.; Mace, R.; Chilton, T.; Kendall, K.C.; Landguth, E.L.; Schwartz, M.K.; McKelvey, K.S.; Allendorf, F.W.; Luikart, G. Why replication is important in landscape genetics: American black bear in the Rocky Mountains. Mol. Ecol. 2011, 20, 1092–1107. [Google Scholar]
  32. Cushman, S.A.; Landguth, E.L. Multi-species connectivity in the northern Rocky Mountains. Ecol Model. 2012, 231, 101–112. [Google Scholar] [CrossRef]
  33. Cushman, S.A.; Landguth, E.L. Ecological associations, dispersal ability and landscape connectivity in the northern Rocky Mountains. Available online: http://www.fs.fed.us/rm/pubs/rmrs_rp090.pdf (accessed on 15 February 2013).
  34. Cushman, S.A.; Landguth, E.L.; Shirk, A.J. Separating the effects of habitat area, fragmentation and matrix resistance on genetic differentiation in complex landscapes. Landscape Ecol. 2012, 27, 369–380. [Google Scholar] [CrossRef]
  35. Balloux, F. EASYPOP (Version 1.7): A computer program for population genetics simulations. J. Hered. 2001, 92, 301–302. [Google Scholar] [CrossRef]
  36. Manel, S.; Berthoud, F.; Bellemain, E.; Gaudeul, M.; Luikart, G.; Swenson, J.E.; Waits, L.P.; Taberlet, P.; Consortium, I. A new individual-based spatial approach for identifying genetic discontinuities in natural populations. Mol. Ecol. Resour. 2007, 16, 2031–2043. [Google Scholar] [CrossRef]
  37. Landguth, E.L.; Cushman, S.A.; Luikart, G.; Murphy, M.A.; Schwartz, M.K.; McKelvey, K.S. Quantifying the lag time to detect barriers in landscape genetics. Mol. Ecol. 2010, 19, 4179–4191. [Google Scholar] [CrossRef]
  38. Jaquiéry, J.; Broquet, T.; Hirzel, A.H.; Yearsley, J.; Perrin, N. Inferring landscape effects on dispersal from genetic distances: How far can we go? Mol. Ecol. 2011, 20, 692–705. [Google Scholar] [CrossRef]
  39. Bowcock, A.M.; Ruiz-Linares, A.; Tomfohrde, J.; Minch, E.; Kidd, J.R.; Cavalli-Sforza, L.L. High resolution of human evolutionary trees with polymorphic micorsatellites. Nature 1994, 368, 455–457. [Google Scholar] [CrossRef]
  40. ESRI (Environmental Systems Research Incorporated). ArcGIS. ESRI, Redlands, CA, USA, 2003.
  41. Mantel, N.A. The detection of disease clustering and a generalized regression approach. Cancer Res. 1967, 27, 209–220. [Google Scholar]
  42. Goslee, S.C.; Urban, D.L. The ecodist package for dissimilarity-based analysis of ecological data. J. Statist. Softw. 2007, 22, 1–19. [Google Scholar]
  43. R Development Core Team. R: A Language and Environment for Statistical Computing; R Foundation for Statistical Computing: Vienna, Austria, 2012. Available online: http://www.R-project.org (accessed on 15 February 2013). ISBN 3-900051-07-0.
  44. Balkenhol, N.; Waits, L.P.; Dezzani, R.J. Statistical approaches in landscape genetics: an evaluation of methods for linking landscape and genetic data. Ecography 2009, 32, 818–830. [Google Scholar] [CrossRef]
  45. Landguth, E.L.; Fedy, B.C.; Oyler-McCance, S.J.; Garey, A.L.; Emel, S.L.; Mumma, M.; Wagner, H.H.; Fortin, M.-J.; Cushman, S.A. Effects of sample size, number of markers, and allelic richness on the detection of spatial genetic patterns. Mol. Ecol. Resour. 2012, 12, 276–284. [Google Scholar] [CrossRef]

Supplementary

Table S1. Effects of changing the alpha level on the success rate of causal modeling across the 35 alternative resistance models simulated. Proportion Model | Null: proportion of the resistance models significantly supported independent of the two null models of isolation by distance and isolation by barriers, using the one-step form of causal modeling proposed by [6]. Proportion Model | Alt Models: proportion of the resistance models significantly supported independent of alternative models using the two-step form of causal modeling proposed by [11]. Proportion Model | Alt Models all: Proportion of simulated models independent of all alternative models across all pairs. Proportion Null | Model: proportion of the time that null models of isolation by distance or isolation by barriers were significant, independent of the simulated resistance model in the [6] method. Proportion Alt Models | Model: proportion of alternative models that are significant, independent of the simulated resistance model in the [6] method. Proportion Alt. Model | Model all: proportion of alternative models, independent of simulated model across all pairs.
Model || Model
AlphaProportion Model | Null Sig (one-step)Proportion Model | Alt. Models Sig. (two-step)Proportion Model | Alt. Models Sig. (all-pairs)Proportion Null | Model Sig (one-step)Proportion Alt. Models | Model Sig. (two-step)Proportion Alt. Models | Model Sig. (all-pairs)
0.0510.8285710.1015870.42857100.506349
0.0410.8285710.1119050.40.0285710.512698
0.0310.8285710.1142860.3714290.0285710.52381
0.0210.8285710.1198410.3428570.0285710.536508
0.0110.8285710.132540.3428570.0285710.554762
0.00910.8285710.132540.3428570.0285710.554762
0.00810.8285710.132540.3428570.0285710.554762
0.00710.8285710.132540.3428570.0285710.554762
0.00610.8285710.132540.3428570.0285710.554762
0.00510.8285710.132540.3428570.0285710.554762
Figure S1. Difference of support for Test 1 and Test 2 in the two-step form of causal modeling (Wasserman, 2010). Rows represent the alternative models and columns the correct, simulated resistance model. The color indicates the difference in partial Mantel r for the test simulated model partialling out the alternative model, and alternative model partialling out the simulated model.
Diversity 05 00051 g009

