<?xml version="1.0" encoding="UTF-8"?>
<!DOCTYPE article PUBLIC "-//NLM//DTD Journal Publishing DTD v2.3 20070202//EN" "journalpublishing.dtd">
<article xmlns:mml="http://www.w3.org/1998/Math/MathML" xmlns:xlink="http://www.w3.org/1999/xlink" xml:lang="en" article-type="research-article">
<front>
<journal-meta>
<journal-id journal-id-type="publisher-id">Diversity</journal-id>
<journal-title>Diversity</journal-title>
<issn pub-type="epub">1424-2818</issn>
<publisher>
<publisher-name>Molecular Diversity Preservation International (MDPI)</publisher-name></publisher></journal-meta>
<article-meta>
<article-id pub-id-type="doi">10.3390/d3030308</article-id>
<article-id pub-id-type="publisher-id">diversity-03-00308</article-id>
<article-categories>
<subj-group>
<subject>Article</subject></subj-group></article-categories>
<title-group>
<article-title>Soil Rhizosphere Microbial Communities and Enzyme Activities under Organic Farming in Alabama</article-title></title-group>
<contrib-group>
<contrib contrib-type="author">
<name><surname>Gardner</surname><given-names>Terrence</given-names></name><xref ref-type="aff" rid="af1-diversity-03-00308"><sup>1</sup></xref><xref ref-type="aff" rid="af2-diversity-03-00308"><sup>2</sup></xref><xref ref-type="corresp" rid="c1-diversity-03-00308"><sup>*</sup></xref></contrib>
<contrib contrib-type="author">
<name><surname>Acosta-Martinez</surname><given-names>V.</given-names></name><xref ref-type="aff" rid="af1-diversity-03-00308"><sup>1</sup></xref></contrib>
<contrib contrib-type="author">
<name><surname>Senwo</surname><given-names>Zachary</given-names></name><xref ref-type="aff" rid="af2-diversity-03-00308"><sup>2</sup></xref></contrib>
<contrib contrib-type="author">
<name><surname>Dowd</surname><given-names>Scot E.</given-names></name><xref ref-type="aff" rid="af3-diversity-03-00308"><sup>3</sup></xref></contrib></contrib-group>
<aff id="af1-diversity-03-00308">
<label>1</label> USDA-ARS, Cropping Systems Research Laboratory, Wind Erosion and Water Conservation Unit, 3810 4th street, Lubbock, TX 79415, USA; E-Mail: <email>Veronica.acosta-martinez@ars.usda.gov</email></aff>
<aff id="af2-diversity-03-00308">
<label>2</label> Department of Natural Resources and Environmental Sciences, Alabama A&amp;M University, Normal, AL 35762, USA; E-Mail: <email>Zachary.senwo@aamu.edu</email></aff>
<aff id="af3-diversity-03-00308">
<label>3</label> Research and Testing Laboratory and Medical Biofilm Research Institute, 4321 Marsha Sharp Freeway, Lubbock, TX 79407, USA; E-Mail: <email>sdowd@pathogenresearch.org</email></aff>
<author-notes>
<corresp id="c1-diversity-03-00308">
<label>*</label> Author to whom correspondence should be addressed; E-Mail: <email>Terrence.gardner@ars.usda.gov</email>; Tel.: +1-806-723-5254; Fax: +1-806-723-5271.</corresp></author-notes>
<pub-date pub-type="collection">
<year>2011</year></pub-date>
<pub-date pub-type="epub">
<day>19</day>
<month>07</month>
<year>2011</year></pub-date>
<volume>3</volume>
<issue>3</issue>
<fpage>308</fpage>
<lpage>328</lpage>
<history>
<date date-type="received">
<day>22</day>
<month>04</month>
<year>2011</year></date>
<date date-type="rev-recd">
<day>20</day>
<month>06</month>
<year>2011</year></date>
<date date-type="accepted">
<day>27</day>
<month>06</month>
<year>2011</year></date></history>
<permissions>
<copyright-statement>© 2011 by the authors; licensee MDPI, Basel, Switzerland.</copyright-statement>
<copyright-year>2011</copyright-year>
<license>
<p>This article is an open access article distributed under the terms and conditions of the Creative Commons Attribution license (http://creativecommons.org/licenses/by/3.0/).</p></license></permissions>
<abstract>
<p>Evaluation of the soil rhizosphere has been limited by the lack of robust assessments that can explore the vast complex structure and diversity of soil microbial communities. Our objective was to combine fatty acid methyl ester (FAME) and pyrosequencing techniques to evaluate soil microbial community structure and diversity. In addition, we evaluated biogeochemical functionality of the microbial communities via enzymatic activities of nutrient cycling. Samples were taken from a silt loam at 0–10 and 10–20 cm in an organic farm under lettuce (<italic>Lactuca sativa</italic>), potato (<italic>Solanum tuberosum</italic>), onion (<italic>Allium cepa L</italic>), broccoli (<italic>Brassica oleracea var. botrytis</italic>) and Tall fescue pasture grass (<italic>Festuca arundinacea</italic>). Several FAMEs (<italic>a</italic>15:0, <italic>i</italic>15:0, <italic>i</italic>15:1, <italic>i</italic>16:0, <italic>a</italic>17:0, <italic>i</italic>17:0, 10Me17:0, <italic>cy</italic>17:0, 16:1ω5c and 18:1ω9c) varied among the crop rhizospheres. FAME profiles of the soil microbial community under pasture showed a higher fungal:bacterial ratio compared to the soil under lettuce, potato, onion, and broccoli. Soil under potato showed higher sum of fungal FAME indicators compared to broccoli, onion and lettuce. Microbial biomass C and enzyme activities associated with pasture and potato were higher than the other rhizospheres. The lowest soil microbial biomass C and enzyme activities were found under onion. Pyrosequencing revealed significant differences regarding the maximum operational taxonomic units (OTU) at 3% dissimilarity level (roughly corresponding to the bacterial species level) at 0–10 cm (581.7–770.0) compared to 10–20 cm (563.3–727.7) soil depths. The lowest OTUs detected at 0–10 cm were under broccoli (581.7); whereas the lowest OTUs found at 10–20 cm were under potato (563.3). The predominant phyla (85%) in this soil at both depths were <italic>Bacteroidetes</italic> (<italic>i.e.</italic>, <italic>Flavobacteria</italic>, <italic>Sphingobacteria</italic>), and <italic>Proteobacteria. Flavobacteriaceae</italic> and <italic>Xanthomonadaceae</italic> were predominant under broccoli. <italic>Rhizobiaceae</italic>, <italic>Hyphomicrobiaceae</italic>, and <italic>Acidobacteriaceae</italic> were more abundant under pasture compared to the cultivated soils under broccoli, potato, onion and lettuce. This study found significant differences in microbial community structure and diversity, and enzyme activities of nutrient cycling in this organic farming system under different rhizospheres, which can have implications in soil health and metabolic functioning, and the yield and nutritional value of each crop.</p></abstract>
<kwd-group>
<kwd>pyrosequencing</kwd>
<kwd>bacterial diversity</kwd>
<kwd>FAME analysis</kwd>
<kwd>enzyme activities</kwd>
<kwd>cropping systems</kwd></kwd-group></article-meta></front>
<body>
<sec sec-type="intro">
<label>1.</label>
<title>Introduction</title>
<p>Organic farming obtained recognition since the end of the 20th Century due to increased public awareness of the negative impacts of intensive agricultural practices (<italic>i.e.</italic>, fertilization, tillage, and pesticide application) on the environment and food safety [<xref ref-type="bibr" rid="b1-diversity-03-00308">1</xref>-<xref ref-type="bibr" rid="b6-diversity-03-00308">6</xref>]. Organic farming practices attempt to preserve environmental biodiversity by crop diversification and avoiding chemical products using organic based composting techniques for fertilizer (<italic>i.e.</italic>, manure) [<xref ref-type="bibr" rid="b7-diversity-03-00308">7</xref>,<xref ref-type="bibr" rid="b8-diversity-03-00308">8</xref>]. The pioneers of the organic farming movement in 1940 emphasized as its main focus to maintain or improve soil health, the capacity of soil to function as a vital living system within land-use boundaries [<xref ref-type="bibr" rid="b9-diversity-03-00308">9</xref>], which is dependent on soil decomposition processes and nutrient cycling [<xref ref-type="bibr" rid="b6-diversity-03-00308">6</xref>-<xref ref-type="bibr" rid="b8-diversity-03-00308">8</xref>] driven by the soil microbial communities. Microbial communities are key drivers in ecosystem functioning and sustainability because they are the main source of necessary enzymes capable of decomposing plant-derived compounds [<xref ref-type="bibr" rid="b7-diversity-03-00308">7</xref>]. Microbial communities associated to the rhizosphere, defined as the volume of soil adjacent to and influenced by plant root, are important to plant health and soil fertility [<xref ref-type="bibr" rid="b10-diversity-03-00308">10</xref>]. The rhizosphere of most crops can exert an influence on the soil microbial communities within the first 0.1 m of soil [<xref ref-type="bibr" rid="b11-diversity-03-00308">11</xref>]. Root exudates from different plants can stimulate the growth of unique bacterial and fungal populations in the vicinity of roots [<xref ref-type="bibr" rid="b12-diversity-03-00308">12</xref>]. Thus, determining the size and composition of soil microbial communities associated with different rhizospheres under organic farming practices is essential in order to evaluate above- and below-ground agroecosystem health and functioning.</p>
<p>Studies evaluating the microbial communities associated with different rhizospheres should include a combination of different techniques to explore the composition at different levels including molecular techniques [<xref ref-type="bibr" rid="b13-diversity-03-00308">13</xref>-<xref ref-type="bibr" rid="b16-diversity-03-00308">16</xref>] and fatty acid profiling such as Phospholipid fatty acid analysis (PLFA) or Fatty acid methyl ester (FAME) methods [<xref ref-type="bibr" rid="b17-diversity-03-00308">17</xref>-<xref ref-type="bibr" rid="b19-diversity-03-00308">19</xref>]. Fatty acid profiling can provide information of the overall soil microbial community structure by describing the abundance of major microbial groups with indicator fatty acids for fungal populations (16:1ω5c, 18:3ω6c, 18:1ω9c and 18:2ω6c) and bacterial populations including Gram-positive bacteria (<italic>i.e.</italic>, <italic>i</italic>15:0, <italic>a</italic>15:0, <italic>i</italic>17:0, <italic>a</italic>17:0), Gram-negative bacteria (<italic>i.e.</italic>, <italic>cy</italic>17:0, <italic>cy</italic>19:0, <italic>i</italic>13:0 3OH and <italic>i</italic>17:0 3OH) and actinomycetes (10Me16:0, 10Me17:0 and 10Me18:0). Along with fatty acid profiling, more detailed exploration of microbial community composition, to the species level, has been possible with molecular fingerprinting techniques. Recent advances in sequencing technology, such as the development of pyrosequencing, has been described as a promising technique to better characterize microbial diversity in natural environments compared with traditional molecular biological techniques involving cloning [<xref ref-type="bibr" rid="b20-diversity-03-00308">20</xref>-<xref ref-type="bibr" rid="b22-diversity-03-00308">22</xref>]. Pyrosequencing coupled with the 454 Genome Sequencer FLX System (Roche, Nutley, New Jersey) provides a fast and massive sequencing approach (<italic>i.e.</italic>, 400–600 MB output per run in a day), which can provide several unique sequences or operational taxonomic units (OTUs; roughly corresponding to the species level) in soils.</p>
<p>In Alabama, organic farming is a newly emerging practice. For example, the first organic farm (Tune Farm, Falkville, AL) was certified in 2003. Thus, information is needed on the microbial communities associated to organic rhizospheres to help producers in the selection of sustainable crop rotations and management practices in this region. We evaluated soil microbial communities under an undisturbed pasture of Tall fescue grass (<italic>Festuca arundinacea</italic>) and from lettuce (<italic>Lactuca sativa</italic>), potato (<italic>Solanum tuberosum</italic>), onion (<italic>Allium cepa L</italic>), and broccoli (<italic>Brassica oleracea var. botrytis</italic>), which were previously under potato for the prior two years. The microbial community composition was evaluated using the ester linked (EL)-FAME and pyrosequencing analyses under the different rhizospheres. We also explored the relationship of the FAME indicators of fungal and bacterial populations, and bacterial phyla distribution from pyrosequencing with other soil properties such as microbial biomass C and N, total C and N, and soil biogeochemical functionality assessed using enzyme activities of nutrient cycling. By coupling robust information regarding the vast diversity of the soil microbial community via FAME profiling and pyrosequencing with an assessment of biogeochemical functionality via enzymatic activities of nutrient cycling, we aim to increase the understanding of microbial communities associated to fundamental biogeochemical processes under different rhizospheres.</p></sec>
<sec sec-type="methods">
<label>2.</label>
<title>Material and Methods</title>
<sec>
<label>2.1.</label>
<title>Description of Experimental Site and Management</title>
<p>The Tune Organic Farm is located in Morgan County, Falkville, Alabama [-86°54′20″ (−86.905572) west longitude; 34°20′9″ (34.335921) north latitude; elevation]. The land at this site is characterized by 0 to 4% slopes. The soil is characterized as silt loam (12.8% clay, 71.8% silt and 15.4% sand; fine-loamy, mixed, semiactive), and it is classified as a mesic Typic Fragiudult. This soil has an average pH of 6.5 and 2.25 total C kg<sup>−1</sup> soil. The farm is located in a region with a mean annual precipitation of 1406 mm (55 in) with most of the precipitation occurring from January through May and October through December. The total area evaluated comprises 4.4 ha (11 acres) under irrigation with county water with spigot located on the soil surface and covered with mulch between 25.4 mm (1 inch) and 58.8 mm (2.31 inches). Prior to receiving certification as an organic production system in 2003, Tune Organic Farm had practiced uncertified organic production system since 1988.</p>
<p>Prior to this study, this farm only underwent organic potato and pasture (predominantly <italic>Festuca arundinacea</italic> grasses) production (2006–2008). The soil was conventionally tilled (raised beds) in October 2006, followed by hand weed control. The farm utilized alternative cropping rotation management practices using winter crops as recommended by USDA, such as rye (<italic>Secale cereal</italic> L.), hairy vetch (<italic>Vicia hirsuta</italic>) or buckwheat (<italic>Fagopyrum esculentum</italic>). In 2007, the farm underwent a minimum biannual minimum tillage (0–15 cm) occurring every November after the winter crop harvest; disking and leveling with a field cultivator in April before summer crop planting. Mulch tillage tilling to depths of 25 and 51 mm (∼1 and 2 inches) was incorporated using a rotary field cultivator before planting. Potato (Yukon Gold cv.), lettuce (Pirat Butterhead cv.), broccoli (Green Sprouting Calabrese cv.) and onion (Mustang Yellow cv.) were planted in early March.</p></sec>
<sec>
<label>2.2.</label>
<title>Soil Sampling</title>
<p>Soil surface samples were taken within the first week of May 2009 under potato, lettuce, broccoli, onion and an undisturbed pasture. Except for pasture, this sampling corresponds to 9 weeks after planting. For each crop, three sampling locations were randomly selected. A composite soil sample was taken at each sampling location within the rhizosphere only (samples were not taken within furrows) by combining three soil cores (2.5 cm dia.) and then split into 0–10 and 10–20 cm depths.</p></sec>
<sec>
<label>2.3.</label>
<title>Microbial Community Structure and Diversity According to FAME Analysis</title>
<p>The ester linked (EL)-FAME method was performed as described by Schutter and Dick [<xref ref-type="bibr" rid="b23-diversity-03-00308">23</xref>]. The following 4 steps were performed: (1) saponification and methylation of ester-linked fatty acids by incubation of 3 g of soil in 15 mL of 0.2 M KOH in methanol at 37 °C for 1h. During that time, the samples are vortexed every 10 min, and an addition of 3 mL of 1.0 M acetic acid to neutralize the pH of the mixture at the end of incubation; (2) Partitioning of the FAMEs into an organic phase by adding 10 mL of hexane followed by centrifugation at 480 × g for 10 min; (3) Transfer of the hexane layer to a clean glass test tube and evaporation of the hexane under a stream of N<sub>2</sub>; and (4) Dissolve FAMEs in 0.5 mL of 1:1 hexane:methyl-tert butyl ether and transferred to a GC vial for analysis. Using this protocol, the extracted FAMEs were analyzed in a 6890 GC Series II (Hewlett Packard, Wilmington, DE, USA) equipped with a flame ionization detector and a fused silica capillary column (25 m × 0.2 mm) using H<sub>2</sub> (ultra high purity) as the carrier gas. The temperature program was ramped from 170 °C to 250 °C at 5 °C min<sup>−1</sup> as previously done by Acosta-Martinez <italic>et al.</italic> [<xref ref-type="bibr" rid="b21-diversity-03-00308">21</xref>]. Fatty acids were identified and quantified by comparison of retention times and peak areas to components of MIDI standards. FAME concentrations (nmol g<sup>−1</sup> soil) were calculated by comparing peak areas to an analytical standard (19:0, Sigma Chemical Co., St. Louis, MO, USA) calibration curve. The FAMEs are described by the number of C atoms, followed by a colon, the number of double bonds and then by the position of the first double bond from the methyl (ω) end of the molecule. Cis isomers are indicated by c, and branched fatty acids are indicated by the prefixes <italic>i</italic> and <italic>a</italic> for iso and anteiso, respectively. Other notations are Me for methyl, OH for hydroxyl and cy for cyclopropane.</p></sec>
<sec>
<label>2.4.</label>
<title>Bacterial Community Structure and Diversity According to Pyrosequencing Analysis</title>
<p>DNA was extracted from approximately 0.5 g of soil (oven dry basis of field-moist soil) using the Fast DNA Spin Kit for soil (QBIOgene, Carlsbad, CA, USA) following the manufacturer's instructions. The DNA extracted (1 μL) was quantified using Nanodrop ND-1000 spectrophotometer (Nanodrop Technologies, Wilmington, DE, USA). The integrity of the DNA extracted from the soils was confirmed by running DNA extracts on 0.8% agarose gel with 0.5 × TBE buffer (45 mM Tris-borate, 1 mM EDTA, pH 8.0). The 16S rDNA bacterial tag-encoded FLX amplicon pyrosequencing technique was used as described by Dowd <italic>et al.</italic> [<xref ref-type="bibr" rid="b24-diversity-03-00308">24</xref>] and Acosta-Martínez <italic>et al.</italic> [<xref ref-type="bibr" rid="b21-diversity-03-00308">21</xref>,<xref ref-type="bibr" rid="b22-diversity-03-00308">22</xref>] for characterization of soil bacterial community composition. We used the new bacterial tag-encoded FLX-Titanium amplicon pyrosequencing (bTEFAP) approach, which is based upon the same original principles of the method described by Acosta-Martínez <italic>et al.</italic> [<xref ref-type="bibr" rid="b21-diversity-03-00308">21</xref>,<xref ref-type="bibr" rid="b22-diversity-03-00308">22</xref>], but instead utilizing the Titanium reagent procedures [<xref ref-type="bibr" rid="b25-diversity-03-00308">25</xref>] and a one-step PCR rather than a two-step labeling reaction, a mixture of Hot Start and HotStar high fidelity taq polymerases, and amplicons originating from the 27F region numbered in relation to <italic>E. coli</italic> rRNA. Quality trimmed sequences (∼Q20) averaging 410 bp with range of 250–520 bp obtained from the FLX sequencing run were processed using a custom scripted bioinformatics pipeline (Research and Testing Laboratory, Lubbock, TX). Sequences which were less than 250 bp after quality trimming were not considered. Samples were depleted of definite chimeras using B2C2 software, which is described and freely available from Research and Testing Laboratory (Lubbock, TX, USA; <ext-link xlink:href="http://www.researchandtesting.com/B2C2.html" ext-link-type="uri">www.researchandtesting.com/B2C2.html</ext-link>) [<xref ref-type="bibr" rid="b26-diversity-03-00308">26</xref>]. The resulting sequences averaging 4216 sequences per sample were then evaluated using BLASTn [<xref ref-type="bibr" rid="b27-diversity-03-00308">27</xref>] against a monthly updated custom 16S database derived from GenBank [<xref ref-type="bibr" rid="b28-diversity-03-00308">28</xref>]. Phylogenetic assignments were based upon NCBI taxonomic designations.</p></sec>
<sec>
<label>2.5.</label>
<title>Additional Soil Analyses</title>
<p>Microbial biomass carbon (MBC) and nitrogen (MBN) were determined on a 15 g oven-dry equivalents field-moist soil sample (&lt;2 mm) in 0.5 M K<sub>2</sub>SO<sub>4</sub> (1:5 w/v) after chloroform fumigation [<xref ref-type="bibr" rid="b29-diversity-03-00308">29</xref>,<xref ref-type="bibr" rid="b30-diversity-03-00308">30</xref>]. Total organic C and N concentrations in the extracts from the fumigated (24 h) and non-fumigated (control) soil were quantified by a CN analyzer (Shimadzu Model TOC-V/<sub>CPH</sub>-TN, Japan). The non-fumigated control values were subtracted from the fumigated values. The MBC and MBN were calculated using a k<sub>EC</sub> factor of 0.45 [<xref ref-type="bibr" rid="b31-diversity-03-00308">31</xref>] and k<sub>EN</sub> factor of 0.54 [<xref ref-type="bibr" rid="b32-diversity-03-00308">32</xref>], respectively. Each sample had duplicate analyses and results are expressed on a moisture-free basis. Moisture was determined after drying at 105 °C for 48 h.</p>
<p>A subsample of the soil was air-dried (&lt;2 mm) for selected analyses. For example, soil pH was measured using a 1:2.5 air-dried soil to water solution ratio using an Orion conductivity meter (model-160). Enzyme activities important for C (β-glucosidase), C and N (β-glucosaminidase), P (acid phosphatase) and S (arylsulfatase) cycling were evaluated using 1 g of air-dried soil with their appropriate substrate and incubated for 1 h (37 °C) at their optimal pH as described previously [<xref ref-type="bibr" rid="b33-diversity-03-00308">33</xref>,<xref ref-type="bibr" rid="b34-diversity-03-00308">34</xref>]. Soil texture was assessed using the pipette method [<xref ref-type="bibr" rid="b35-diversity-03-00308">35</xref>]. Total C, N, and S were determined in subsamples of air-dried soil, sieved to &lt;180 μm, by automated dry combustion method using a vario Max CNS analyzer.</p></sec>
<sec>
<label>2.6.</label>
<title>Statistical Analysis</title>
<p>To compare FAME indicators under different rhizospheres in this organic production system on a multivariate scale, we used principal components analysis (PCA) using PC-ORD software (version 5, MjM Software Design). In the PCA, square root transformations were performed on all FAMEs to create a more normally distributed data set and to reduce the coefficient of variation among FAMEs. The square root transformation is similar to log transformations, which is commonly used in ecological studies [<xref ref-type="bibr" rid="b36-diversity-03-00308">36</xref>]. The PCAs were performed using cross-products matrix with variance/covariance centered and calculating scores for FAMEs by weighted averaging. In addition, a non-metric multidimensional scaling (NMS) plot, non-parametric method, was used to provide graphical ordination of the FAME indicators, microbial biomass and enzyme activities under different rhizospheres with two synthetic axes. Data were transformed by the different rhizospheres using the ‘general relativization’ procedure in PC-ORD [<xref ref-type="bibr" rid="b36-diversity-03-00308">36</xref>]. ‘Relativization’ in multivariate analysis removes the potentially strong influence of absolute abundance on community data. Indicator species' analysis and correlations with the main matrix are presented when appropriate to facilitate the identification of variables that are important descriptors of differences among soil microbial community (FAME) structure, microbial biomass and biogeochemical cycling [<xref ref-type="bibr" rid="b37-diversity-03-00308">37</xref>,<xref ref-type="bibr" rid="b38-diversity-03-00308">38</xref>].</p>
<p>
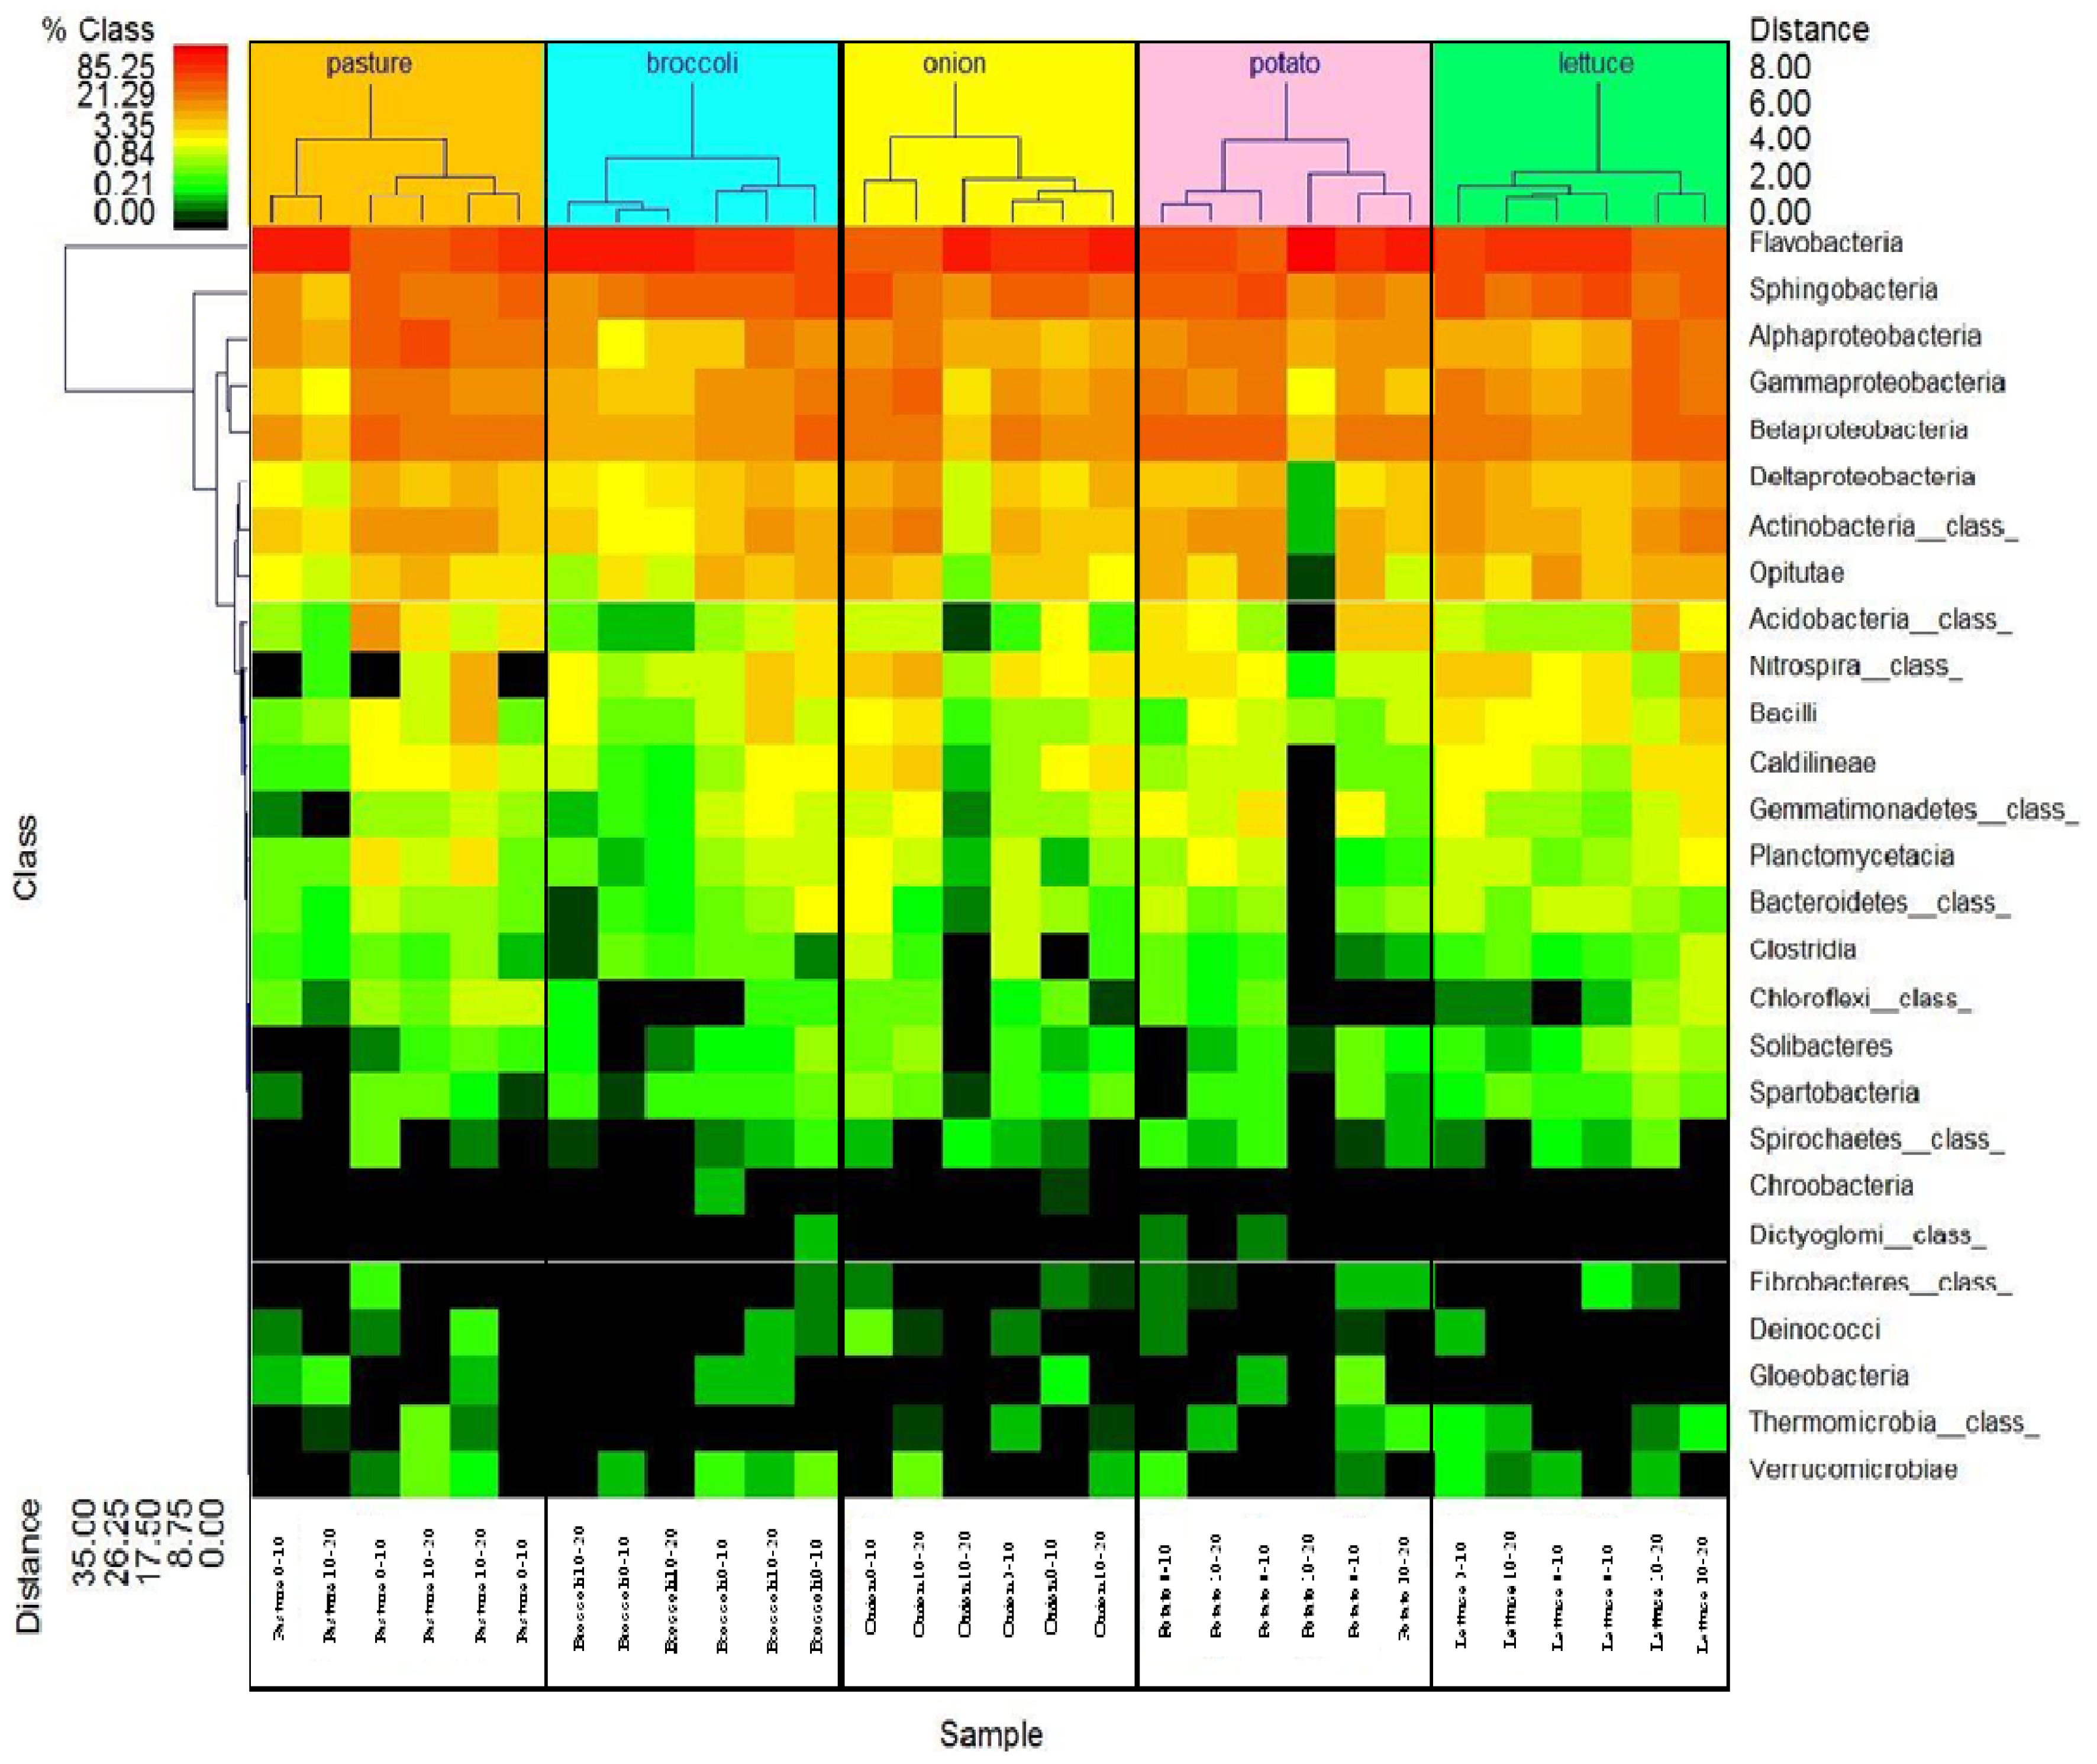
A double dendogram was performed using comparative functions and multivariate hierarchical clustering methods of NCSS 2007 (NCSS, Kaysville, Utah) based upon the top 27 most abundant bacterial classes including the weighted-pair group clustering method and the Manhattan distance method with no scaling. For bacterial diversity and richness analysis, multiple sequence alignment was performed using MUSCLE (with parameter -maxiters 1, -diags1 and -sv) [<xref ref-type="bibr" rid="b39-diversity-03-00308">39</xref>]. Based on the alignment, a distance matrix was constructed using DNAdist from PHYLIP version 3.6 with default parameters from Felsenstein [<xref ref-type="bibr" rid="b40-diversity-03-00308">40</xref>,<xref ref-type="bibr" rid="b41-diversity-03-00308">41</xref>]. These pairwise distances served as input to DOTUR [<xref ref-type="bibr" rid="b42-diversity-03-00308">42</xref>] for clustering the sequences into OTUs of defined sequence similarity that ranged from 0% to 20% dissimilarity. At 3% dissimilarity, we expect that we can obtain accurate estimation of the majority of species present in a given sample. The clusters based upon dissimilarity of 3%, served as OTUs for generating predictive rarefaction models and for making calculations with the richness (diversity) indexes Ace and Chao1 [<xref ref-type="bibr" rid="b43-diversity-03-00308">43</xref>] in DOTUR. The heat map colors indicated a variation on the relative percentage of bacteria in this soil that ranged from &lt;0.00% in black up to 85% in red. Manhattan distance for the relative percentage data is calculated between rows <italic>j</italic> and <italic>k</italic>, where: <italic>δ<sub>ijk</sub></italic> = <italic>z<sub>ij</sub></italic> − <italic>z<sub>jk</sub></italic> and <italic>P</italic> is the percentage of similarity between samples:
<disp-formula id="FD1">
<label>(1)</label>
<mml:math id="mm1" display="block">
<mml:semantics id="sm1">
<mml:mrow>
<mml:msub>
<mml:mi>d</mml:mi>
<mml:mrow>
<mml:mtext mathvariant="italic">jk</mml:mtext></mml:mrow></mml:msub>
<mml:mo>=</mml:mo>
<mml:mfrac>
<mml:mrow>
<mml:msubsup>
<mml:mo>∑</mml:mo>
<mml:mrow>
<mml:mi>i</mml:mi>
<mml:mo>=</mml:mo>
<mml:mn>1</mml:mn></mml:mrow>
<mml:mi>P</mml:mi></mml:msubsup>
<mml:mrow>
<mml:mo stretchy="false">|</mml:mo>
<mml:msub>
<mml:mi>δ</mml:mi>
<mml:mrow>
<mml:mtext mathvariant="italic">ijk</mml:mtext></mml:mrow></mml:msub></mml:mrow>
<mml:mo stretchy="false">|</mml:mo></mml:mrow>
<mml:mrow>
<mml:mi>P</mml:mi></mml:mrow></mml:mfrac></mml:mrow></mml:semantics></mml:math></disp-formula></p></sec></sec>
<sec sec-type="results">
<label>3.</label>
<title>Results</title>
<sec>
<label>3.1.</label>
<title>Selected Soil Properties</title>
<p>At 0–10 cm, total C ranged in this soil from 2.03 to 3.00 g kg<sup>−1</sup> soil while total N ranged from 0.17 to 0.28 g kg<sup>−1</sup> soil (<xref ref-type="table" rid="t1-diversity-03-00308">Table 1</xref>). Soil pH (∼6.80) was significantly higher under broccoli, onion and lettuce compared to pasture and potato (<italic>P</italic> &lt; 0.05). Soil associated with the onion rhizosphere exhibited lower levels of MBC and MBN compared to the other rhizospheres. Enzyme activities varied across the different rhizospheres, but trends differed depending on the enzyme. For example, β-glucosidase activity was higher under potato (264 mg PN kg<sup>−1</sup> soil h<sup>−1</sup>) compared to the other rhizospheres (121–159 mg PN kg<sup>−1</sup> soil h<sup>−1</sup>), whereas β-glucosaminidase activity was highest in soil under pasture, broccoli and potato (54.50–64 mg PN kg<sup>−1</sup> soil h<sup>−1</sup>) compared to onion and lettuce (28.10–35.30 mg PN kg<sup>−1</sup> soil h<sup>−1</sup>). Acid phosphatase activity was higher in soil under broccoli (534 mg PN kg<sup>−1</sup> soil h<sup>−1</sup>), followed by pasture and potato (average: 443 mg PN kg<sup>−1</sup> soil h<sup>−1</sup>), and the lowest activities were found under onion and lettuce (average: 362.5 mg PN kg<sup>−1</sup> soil h<sup>−1</sup>). Arylsulfatase activity was more similar among the rhizospheres (144–227 mg PN kg<sup>−1</sup> soil h<sup>−1</sup>) but was lowest under onion. In summary, soil properties (overall) exhibited higher levels at 0–10 cm compared to 10–20 cm in this organic production system, except for soil pH.</p>
<p>At 10–20 cm, soil under pasture and potato showed the highest MBN (average: 32.5 mg N kg<sup>−1</sup> soil), and the highest activities of β-glucosaminidase (average: 17.5 mg PN kg<sup>−1</sup> soil h<sup>−1</sup>) and arylsulfatase (110 mg PN kg<sup>−1</sup> soil h<sup>−1</sup>). Soil MBC demonstrated the lowest levels under broccoli (68.00 mg C kg<sup>−1</sup> soil) and onion (56.00 mg C kg<sup>−1</sup> soil) compared to the other rhizospheres. Soil pH demonstrated the highest values under onion (7.08) and lowest under potato (6.03).</p></sec>
<sec>
<label>3.2.</label>
<title>Microbial Community Structure using FAME Analyses</title>
<p>
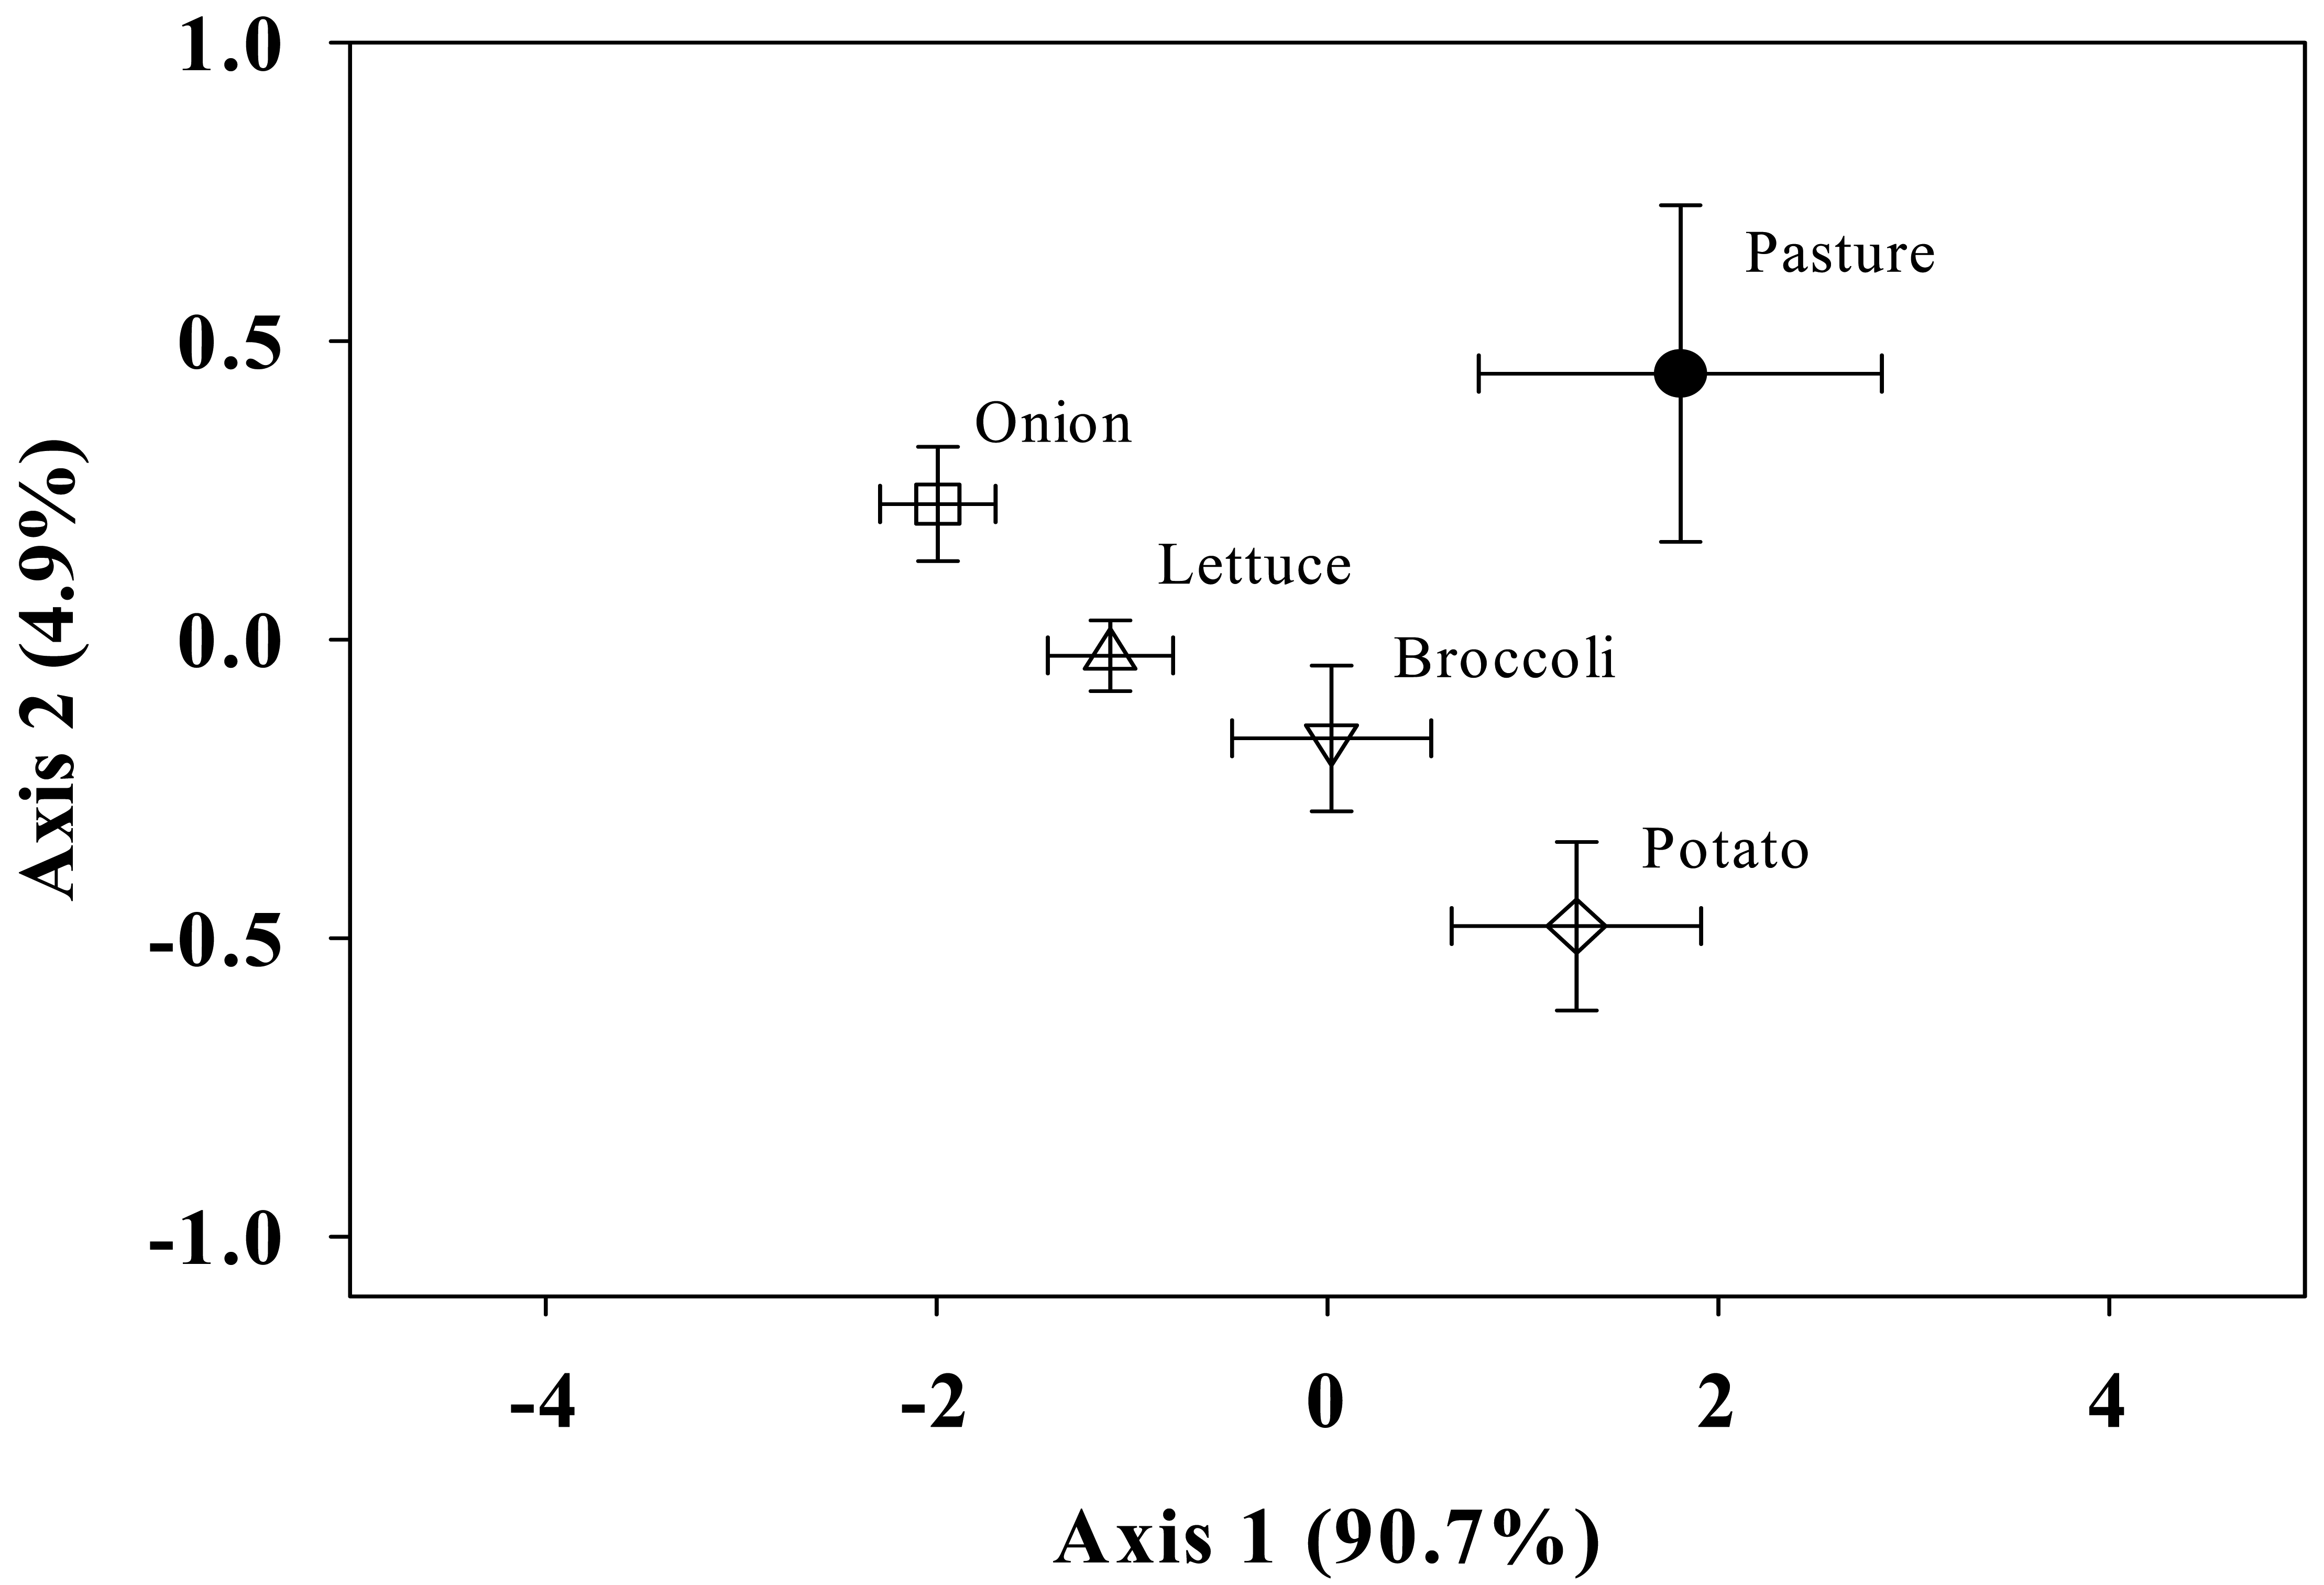
Using PCA to compare the FAME profiles within the rhizospheres at 0–10 cm, we found significant overall differences in the microbial community structure among the rhizospheres within the first PC axis, which accounted for the greatest variation among these samples (90.7%) (<xref ref-type="fig" rid="f1-diversity-03-00308">Figure 1</xref>). A significant correlation was found between the Eigenvector scores of soil under potato, broccoli, and pasture, which were significantly different (<italic>P</italic> &lt; 0.007) from soil under onion. The scores obtained for the FAME profiles under broccoli were not significantly different from those obtained under lettuce, and the same applies for the scores obtained under lettuce compared to onion.</p>
<p>The trends observed in the PCA were due to distinct differences in the soil fungal FAME indicators among the rhizospheres (<xref ref-type="table" rid="t2-diversity-03-00308">Table 2</xref>). This trend was found for the fungal FAMEs: pasture &gt; potato &gt; broccoli &gt; lettuce &gt; onion. Soil bacterial FAME indicators, Gram+, Gram–, and actinomycetes, were higher under potato, followed by pasture, broccoli, and lettuce, and the lowest under onion. The only FAME indicator for Gram– populations detected in this soil was <italic>cy</italic>17:0, which ranged across all rhizospheres from 36.93 to 70.53 nmols g<sup>−1</sup> soil. Pasture and broccoli were not significantly different from one another for any bacterial FAME indicator. Soil under potato showed significantly greater abundance of actinomycetes (32.8 nmols g<sup>−1</sup> soil) indicators compared to onion and lettuce (14.87 and 20.00 nmols g<sup>−1</sup> soil, respectively). Overall, our results indicate that there are more significant differences in the fungal community (sum ranged 345–854) than bacterial community (sum ranged 417–779) among these rhizospheres.</p>
<p>
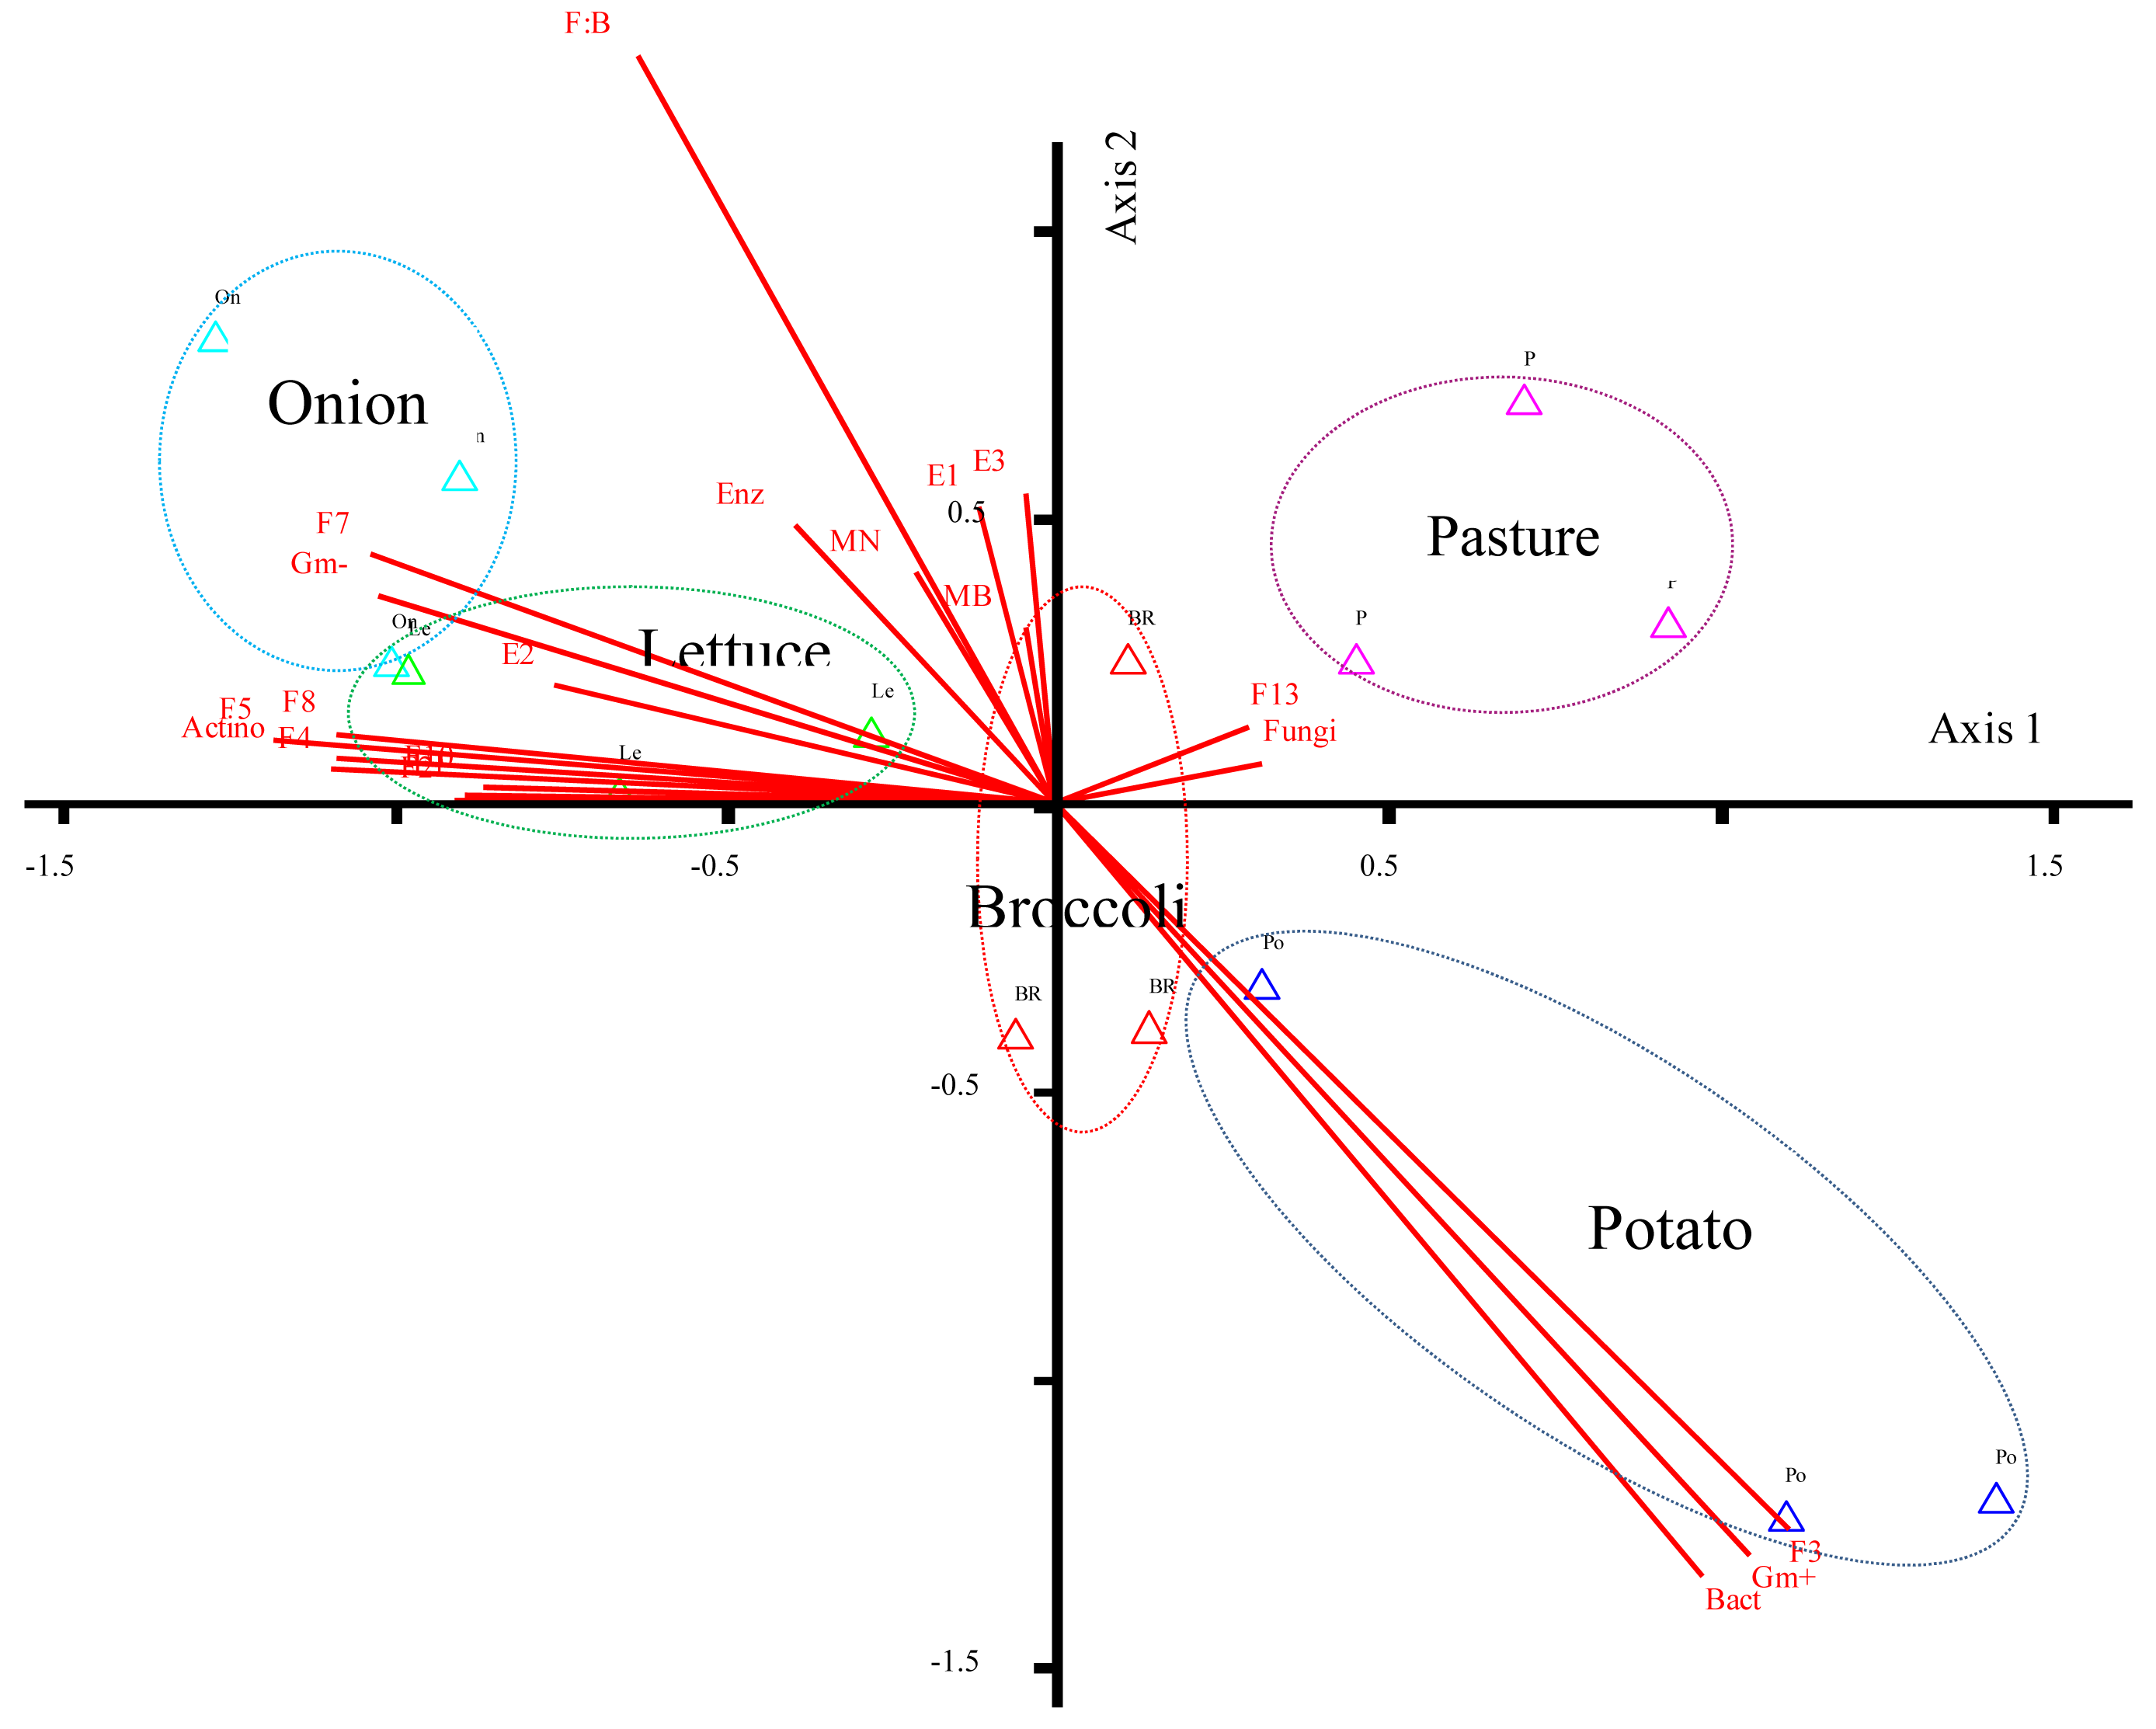
Our non-metric multidimensional scaling (NMDS) plot revealed correlations among the FAME indicators for bacterial and fungal populations, microbial biomass and enzyme activities under the rhizospheres evaluated (<xref ref-type="fig" rid="f2-diversity-03-00308">Figure 2</xref>). The first axis explained 89% of the variability among this data set. The NMDS plot displayed soil fungal FAMEs (<italic>i.e.</italic>, F13) positively correlated to soil under pasture while β-glucosidase activity (E2) and FAME indicators for Gram− populations (<italic>i.e.</italic>, F7) were most correlated to soil under onion. FAME indicators for actinomycetes (<italic>i.e.</italic>, F8), some bacterial FAMEs (F5 and F8) and β-glucosidase activity (E2) were correlated to soil under lettuce. Gram+ bacterial FAMEs were correlated to soil under potato. Soil under broccoli grouped near the centroid of the plot, and demonstrated little to no correlation with all soil properties relative to the other rhizospheres. As a result of these trends it seems obvious that soil fungi demonstrate either no relationship or negative relationships with all the other rhizospheres except pasture. Furthermore, lettuce and onion demonstrate similar soil properties, as both are characterized as having distinctly different soil microbial properties from pasture or potato rhizospheres.</p></sec>
<sec>
<label>3.3.</label>
<title>Soil Bacterial Diversity According to Pyrosequencing</title>
<p>The hierarchal clustering double dendogram (heatmap) shown in <xref ref-type="fig" rid="f3-diversity-03-00308">Figure 3</xref> was used to evaluate the relative percentage of the top 27 bacteria (Y-axis) in this soil under organic production at 0–10 and 10–20 cm depths (X-axis). It is possible to visualize that the predominant class/phyla at both soil depths (up to 85% of abundance), despite different crop rhizospheres, were <italic>Flavobacteria</italic>, <italic>Sphingobacteria</italic> and <italic>Proteobacteria</italic> (red to orange color in the heat map). Less abundant bacteria in this soil (0.21–0.84%) were <italic>Acidobacteria</italic>, <italic>Bacteroidetes</italic>, <italic>Spartobacteria</italic>, <italic>Solibacteres</italic>, <italic>Chloroflexi</italic> class and <italic>Gemmatimonadetes</italic> (class) (green in the heat map). Rare bacterial occurrences (&lt;0.21%) were <italic>Chroobacteria</italic>, <italic>Dictyoglomi</italic> (class), <italic>Gloebacteria</italic>, and <italic>Thermomicrobia</italic> (class) (black in the heat map). According to this double dendrogram, it seems that certain bacteria were absent under potato at 10–20 cm depth: <italic>Caldinilineae</italic>, <italic>Gemmatimonadetes</italic>, <italic>Planctomycetacia</italic>, <italic>Bacterioidetes</italic> (class), <italic>Clostridia</italic>, <italic>Chloroflexi</italic> (class), <italic>Solibacteres</italic>, <italic>Spartobacteria</italic> or <italic>Deinococci</italic>.</p>
<p>Seventeen bacterial families were predominant among the different rhizospheres at 0–10 cm (<xref ref-type="table" rid="t3-diversity-03-00308">Table 3</xref>). The three most predominant families were <italic>Flavobacteriaceae</italic>, <italic>Sphingobacteriacea</italic>, and <italic>Flexibacteraceae. Flexibacteraceae</italic>, <italic>Xanthomonadaceae</italic>, <italic>Rhodocyclaceae</italic>, <italic>Opitutaceae</italic>, and <italic>Streptomycetaceae</italic> were lower under pasture compared to the other rhizospheres. Interestingly, some of these bacteria were highest under broccoli (<italic>Flavobacteriaceae</italic>, <italic>Sphingobacteriacea</italic>, <italic>Flexibacteraceae</italic>, <italic>Xanthomonadaceae</italic>, and <italic>Opitutaceae</italic>). Certain bacteria highest under pasture tended to be very low (0–0.89%) under the other rhizospheres (<italic>i.e.</italic>, <italic>Rhizobiaceae</italic>, <italic>Acidobacteriaceae</italic>, and <italic>Bradyrhizobiaceae</italic>). For instance, <italic>Bradyrhizobiaceae</italic> revealed the highest relative abundance under pasture (1.97%) and was barely detected under broccoli and lettuce (&lt;0.24%). <italic>Streptomycetaceae</italic> was higher under onion compared to the other rhizospheres. <italic>Polyangiaceae</italic> showed the highest levels under lettuce. <italic>Oxalobacteriaceae</italic>, <italic>Rhodocyclaceae</italic>, and <italic>Comamonadaceae</italic> were highest under potato.</p>
<p>The bacterial diversity indexes, ACE and Chao1, at 3% dissimilarity were higher at 0–10 cm than at 10–20 cm under pasture, potato, and lettuce (<xref ref-type="table" rid="t4-diversity-03-00308">Table 4</xref>). In addition, these indexes tended to be higher under potato than the other rhizospheres at 0–10 cm. At the lower depth of 10–20 cm, soil under onion showed the highest levels of these indexes among these rhizospheres.</p></sec></sec>
<sec sec-type="discussion">
<label>4.</label>
<title>Discussion</title>
<sec>
<label>4.1.</label>
<title>Microbial Community Composition According to the FAME Analyses, and Linkage to Enzyme Activity Trends</title>
<p>Our findings demonstrate distinct contrasts in both soil microbial community characteristics and enzyme activities across the rhizospheres evaluated. The first distinct difference found in the microbial community structure was the highest fungal:bacterial ratio under pasture compared to the other rhizospheres. These results are consistent with other studies reporting higher fungal populations, including mycorrhiza, under non–disturbed soils compared to cultivated soils [<xref ref-type="bibr" rid="b21-diversity-03-00308">21</xref>,<xref ref-type="bibr" rid="b44-diversity-03-00308">44</xref>]. Soil under potato also showed higher fungal populations compared to the rhizospheres of lettuce, broccoli, and onion, which may be explained by the lower soil pH (close to 6) under potato. Blagodatskaya and Anderson [<xref ref-type="bibr" rid="b45-diversity-03-00308">45</xref>] reported that fungi are found in higher abundance in acidic soils than alkaline soils, and that soil pH influenced the percent fungal–to–bacterial ratio to a greater degree than substrate in their study. This farm had been under potato production for the two years prior to establishing different crops, which may have caused a long–lasting accumulation of certain substrates or fungal spores involved in arbuscular mycorrhizae (AM) associations and/or decreased the soil pH enough to encourage higher fungal populations under potato compared to the other crops. The findings of higher fungal populations under pasture and potato compared to lettuce, onion, and broccoli can have an impact on soil processes. Previous studies have reported that soil microbial communities with higher fungal: bacterial ratios have been associated to potential benefits in C sequestration as fungal populations tend to have higher C assimilation efficiencies than bacterial populations and store higher amounts of the C they metabolize [<xref ref-type="bibr" rid="b46-diversity-03-00308">46</xref>].</p>
<p>The different rhizospheres showed differences in the group of enzyme activities evaluated, which may reveal variations in C, N, P, and S biogeochemical cycling among these rhizospheres. The fact that the potato rhizosphere demonstrated the highest fungal FAMEs, but also highest activities of β-glucosidase and β-glucosaminidase are of ecological significance to C and N cycling, respectively [<xref ref-type="bibr" rid="b46-diversity-03-00308">46</xref>,<xref ref-type="bibr" rid="b47-diversity-03-00308">47</xref>]. However, soil under broccoli demonstrated the highest acid phosphatase activity, followed by pasture, which have important implications of higher P transformation and turnover under broccoli and pasture. Higher levels of acid phosphatase activity have been shown in other pasture soils by Speir and Ross [<xref ref-type="bibr" rid="b48-diversity-03-00308">48</xref>] but no study highlighted higher levels of this enzyme activity under broccoli compared to other vegetables. Various studies in respect to relationships between phosphatase activity and mineralization of organic P in the rhizosphere may be attributed to the complex interaction of many factors including plant species, soil properties (form and level of P, pH, soil moisture), and time (different stages of plant growth) [<xref ref-type="bibr" rid="b49-diversity-03-00308">49</xref>,<xref ref-type="bibr" rid="b50-diversity-03-00308">50</xref>].</p>
<p>Another distinctive trend in this organically managed system was the lowest levels of FAME indicators for Gram+ and Gram− bacterial populations and fungal populations detected under onion compared to the other rhizospheres. Total FAMEs and microbial biomass (MBC and MBN), indicators for microbial population size, were lower under onion. As microbial communities are the main source of enzymes in soil, the lower microbial biomass under onion may explain the lower enzyme activities also found [<xref ref-type="bibr" rid="b14-diversity-03-00308">14</xref>]. These findings suggested lower biogeochemical cycling potential under onion compared to broccoli, lettuce, potato, and pasture.</p></sec>
<sec>
<label>4.2.</label>
<title>Soil Bacterial Communities According to Pyrosequencing and Linkage to Enzyme Activity Trends</title>
<p>Assessing soil bacterial diversity using pyrosequencing promises to expand our understanding of the distribution of major bacterial groups in soil, which contribute to essential soil processes including soil organic matter incorporation, aggregation and nutrient cycling [<xref ref-type="bibr" rid="b21-diversity-03-00308">21</xref>,<xref ref-type="bibr" rid="b51-diversity-03-00308">51</xref>]. However, we are only beginning to explore how plants influence the make-up of their own rhizosphere microbial communities [<xref ref-type="bibr" rid="b52-diversity-03-00308">52</xref>], and how it may be linked to soil functioning. Pyrosequencing allowed us to explore up to 6,000 sequences and revealed between 494–868 unique operational taxonomic units (OTU; roughly corresponding to the species level) at the 3% dissimilarity level for this soil under organic production. This technique allowed us to explore almost 7 times higher resolution (number of sequences) than previously possible [<xref ref-type="bibr" rid="b20-diversity-03-00308">20</xref>,<xref ref-type="bibr" rid="b53-diversity-03-00308">53</xref>]. In agreement with other soil microbial ecology research efforts, this study detected higher overall abundances of the major bacterial phyla in soil: <italic>Acidobacteria</italic>, <italic>Actinobacteria</italic>, <italic>Proteobacteria</italic>, <italic>Verrucomicrobia</italic>, <italic>Bacteroidetes</italic>, <italic>Firmicutes</italic>, <italic>Chloroflexi</italic>, <italic>Planctomycetes</italic> and <italic>Gemmatimonadetes</italic> [<xref ref-type="bibr" rid="b54-diversity-03-00308">54</xref>,<xref ref-type="bibr" rid="b55-diversity-03-00308">55</xref>]. However, our study provided data demonstrating the varying distribution among the major bacterial phyla across soils with different rhizospheric characteristics. For example, other studies have shown a high predominance of <italic>Acidobacteria</italic> among other bacterial phyla [<xref ref-type="bibr" rid="b56-diversity-03-00308">56</xref>]. In this soil, the three most predominant bacteria have been linked to soil organic matter dynamics, which showed this trend: <italic>Bacteroidetes</italic> (<italic>Flavobacteria</italic> and <italic>Sphingobacteria</italic>) &gt; <italic>Proteobacteria</italic> &gt; <italic>Actinobacteria</italic>. Previous studies have emphasized that <italic>Flavobacteriaceae</italic> are recognized for their role in soil metabolic functioning [<xref ref-type="bibr" rid="b57-diversity-03-00308">57</xref>], and it is possible that they could provide a strong contribution to the mineralization of primary-produced organic matter in this organic soil [<xref ref-type="bibr" rid="b58-diversity-03-00308">58</xref>]. The higher percentage of <italic>Proteobacteria</italic> in soils is well known and it has been reported in several other studies that this bacteria encompasses an enormous level of morphological, physiological and metabolic diversity that could play a significant role in global C, N, and S cycling [<xref ref-type="bibr" rid="b21-diversity-03-00308">21</xref>,<xref ref-type="bibr" rid="b59-diversity-03-00308">59</xref>]. <italic>Actinobacteria</italic>, also found predominant in this organic soil, has been recognized as important in organic matter dynamics [<xref ref-type="bibr" rid="b22-diversity-03-00308">22</xref>].</p>
<p>Previous studies have indicated that root exudates and plant species strongly determine the bacterial composition in the rhizosphere, producing plant genotype-specific community structures in the same soil [<xref ref-type="bibr" rid="b60-diversity-03-00308">60</xref>–<xref ref-type="bibr" rid="b63-diversity-03-00308">63</xref>]. In addition to the fact that pasture demonstrated the highest fungal:bacterial ratios compared to the other rhizospheres, we found distinct differences in bacterial communities in pasture compared to the other rhizospheres. <italic>Rhizobiaceae</italic>, <italic>Hyphomicrobiaceae</italic>, <italic>Bradyrhizobiaceae</italic>, <italic>Acetobacteriaceae</italic>, <italic>Conexibacteriaceae</italic>, and <italic>Burkholderiacea</italic> were up to 2 times higher under pasture compared to the other rhizospheres. These <italic>Proteobacteria</italic> (<italic>Bradyrhizobiaceae</italic>, <italic>Hyphomicrobiaceae</italic>, and <italic>Acetobacteriaceae</italic>) represent key bacteria involved in soil C and N cycling [<xref ref-type="bibr" rid="b21-diversity-03-00308">21</xref>,<xref ref-type="bibr" rid="b59-diversity-03-00308">59</xref>]. The predominance of many bacteria under pasture, including <italic>Acidobacteriaceae</italic>, may reflect the combined effects of very different root systems and their exudates (<italic>i.e.</italic>, type and amounts), and differences in soil properties (<italic>i.e.</italic>, lower soil pH, less disturbance) compared to the other rhizospheres.</p>
<p>Soil under potato revealed higher abundance of bacteria belonging to the β-<italic>Proteobacteria</italic> (class) (<italic>i.e.</italic>, <italic>Rhodocyclaceae</italic>, <italic>Comamonadaceae</italic>, and <italic>Oxalobacteraceae</italic>), which has been found to have a significant role in C cycling. Other studies have linked β-<italic>Proteobacteria</italic> to the degradation of halogenated compounds [<xref ref-type="bibr" rid="b64-diversity-03-00308">64</xref>], biological phosphate removal [<xref ref-type="bibr" rid="b65-diversity-03-00308">65</xref>], denitrification and reduction of (per) chlorates [<xref ref-type="bibr" rid="b66-diversity-03-00308">66</xref>,<xref ref-type="bibr" rid="b67-diversity-03-00308">67</xref>], and N fixation [<xref ref-type="bibr" rid="b68-diversity-03-00308">68</xref>]. The overall findings of a different microbial community structure (<italic>i.e.</italic>, higher fungal FAMEs and certain <italic>Proteobacteria</italic>) under potato may explain the higher β-glucosidase and β-glucosaminidase activities (involved in C and N cycling, respectively) compared to lettuce, onion and broccoli. Previously, Manter <italic>et al.</italic> [<xref ref-type="bibr" rid="b69-diversity-03-00308">69</xref>] showed highly diverse and cultivar specific bacterial endophyte community in potato roots using pyrosequencing; their study included the potato variety studied here. The study by Manter <italic>et al.</italic> [<xref ref-type="bibr" rid="b69-diversity-03-00308">69</xref>] reported the presence of <italic>Rheinheimera</italic>, <italic>Dydobacter</italic>, <italic>Devosia</italic>, <italic>Pedobacter</italic>, and <italic>Pseudoxanthomonas</italic> as endophyte communities of potato and emphasized these were not previously identified as endophytes for this crop. However, we did not find any of these bacteria in the soil evaluated under potato, which could be due to several factors including the soil, climate, and environmental interactions.</p>
<p>High abundances of bacteria in the <italic>Streptomycetaceae</italic> family were associated with onion rhizosphere; which also demonstrated the lowest soil microbial biomass and enzyme activities compared to the other rhizospheres. This seems to be an interesting finding because bacteria in the <italic>Streptomycetaceae</italic> family are known to produce secondary metabolites which can present antagonistic activities against phytopathogens and could provide plant protection [<xref ref-type="bibr" rid="b70-diversity-03-00308">70</xref>] and influence the microbial populations in the competitive rhizosphere surroundings [<xref ref-type="bibr" rid="b71-diversity-03-00308">71</xref>,<xref ref-type="bibr" rid="b72-diversity-03-00308">72</xref>]. For example, studies have reported evidence on <italic>Streptomycetaceae</italic> members' potential biocontrol towards infection by pathogenic fungi populations of <italic>Fusarium oxysporum</italic>, the causal agent of onion wilt [<xref ref-type="bibr" rid="b73-diversity-03-00308">73</xref>]. In addition, onions produce polyphenols, a secondary metabolite, in the daily food intake [<xref ref-type="bibr" rid="b74-diversity-03-00308">74</xref>,<xref ref-type="bibr" rid="b75-diversity-03-00308">75</xref>] and a rich source of flavonoids [<xref ref-type="bibr" rid="b76-diversity-03-00308">76</xref>], which have shown anti–fungal activity <italic>in vitro</italic> [<xref ref-type="bibr" rid="b77-diversity-03-00308">77</xref>]. This could explain the low presence of fungal FAME indicators in the soil rhizosphere under onion. Our hypothesis of onion's negative influence on the surrounding microbial populations may also be supported by the increases in bacterial diversity indexes with depth. Bacterial diversity indexes under onion were within the ranges of the other rhizospheres at 0–10 cm, but the indexes became higher under onion compared to the other rhizospheres at 10–20 cm; possibly due to less influence of the onion roots at the lower soil depth.</p>
<p>In this organic farming system under similar management, variations in soil moisture under the different rhizospheres could also explain the differences observed in bacterial distribution. Soil moisture was correlated with higher levels of soil total N, total C, total S, MBC, and enzyme activity supporting previous research findings [<xref ref-type="bibr" rid="b78-diversity-03-00308">78</xref>,<xref ref-type="bibr" rid="b79-diversity-03-00308">79</xref>]. Previous studies have also reported the influence of soil moisture on enzyme activities indirectly through increasing microbial growth and substrate availability [<xref ref-type="bibr" rid="b80-diversity-03-00308">80</xref>]. This pattern was followed by total C, MBN, and acid phosphatase, similar to findings obtained by Burke <italic>et al.</italic> [<xref ref-type="bibr" rid="b81-diversity-03-00308">81</xref>] in different systems. Singh <italic>et al.</italic> [<xref ref-type="bibr" rid="b82-diversity-03-00308">82</xref>] reported that soil moisture stimulates microorganism activities that enabled organic matter decomposition. In addition, the differences in the root systems and exudates must play another dominant effect in the microbial communities, exemplified by the lowest microbial communities and enzyme activities under onion compared to the other rhizospheres under same management.</p></sec></sec>
<sec sec-type="conclusions">
<label>5.</label>
<title>Conclusions</title>
<p>Our study demonstrated distinct differences among the rhizospheres evaluated here by combining a high-throughput technique as pyrosequencing with FAME profiling. Distinct differences were also found on the metabolic functional capacity of the microbial community under the different rhizospheres according to enzyme activities of nutrient cycling. Soil under potato and pasture showed the highest fungal:bacterial ratios compared to soil under lettuce, onion, and broccoli. In contrast to pasture and potato, onion showed the lowest microbial biomass, sum of fungal and bacterial FAME indicators, and enzyme activities. Onion rhizosphere also showed a high abundance of the <italic>Streptomycetaceae</italic> family, which are known to produce secondary metabolites that can exert antagonistic activities against phytopathogens. The possibility that this bacterial family may have reduced important members of this soil microbial community, as reflected in the enzyme activities and microbial biomass, should be explored. Our study approach may serve as the basis for future studies trying to identify microbial communities important in soil processes and health, plant productivity and the nutritional value of crops.</p></sec></body>
<back>
<sec sec-type="display-objects">
<title>Figures and Tables</title>
<fig id="f1-diversity-03-00308" position="float">
<label>Figure 1.</label>
<caption>
<p>Principal component analysis (PCA) of soil microbial community composition according to 10 fatty acid methyl ester (FAME) indicators for fungal and bacterial populations under different rhizospheres in an organic production system.</p></caption>
<graphic xlink:href="diversity-03-00308f1.gif"/></fig>
<fig id="f2-diversity-03-00308" position="float">
<label>Figure 2.</label>
<caption>
<p>Non-metric multidimensional scaling (NMDS) plot of the relationship between soil microbial community composition (according to 13 FAMEs), enzyme activities and microbial biomass under different rhizospheres in an organic production system. The figure shows FAMEs for bacterial populations according to F1–5 for Gm+ (Gram+), F6–7 for Gm− (Gram−) and F8–10 for actinomycetes (Actino) while the fungal populations are represented by F11–13. Fungal:bacterial ratios are shown as F:B. The enzyme activities are represented (Enz) with E labels such as E1 for arylsulfatase, E2 for β-glucosidase, E3 for β-glucosaminidase and E4 acid phosphatase. Microbial biomass is shown as MB (MC for microbial biomass C or MN for microbial biomass N).</p></caption>
<graphic xlink:href="diversity-03-00308f2.gif"/></fig>
<fig id="f3-diversity-03-00308" position="float">
<label>Figure 3.</label>
<caption>
<p>Double hierarchal dendogram to evaluate bacteria distribution in this soil as affected by the different rhizospheres in an organic production system.</p></caption>
<graphic xlink:href="diversity-03-00308f3.gif"/></fig>
<table-wrap id="t1-diversity-03-00308" position="float">
<label>Table 1.</label>
<caption>
<p>Selected soil properties studied under different rhizospheres in an organic production system.</p></caption>
<table frame="box" rules="all">
<thead>
<tr>
<th align="center" valign="middle"><bold>Soil Properties</bold></th>
<th align="center" valign="middle"><bold>Depth (cm)</bold></th>
<th align="center" valign="middle"><bold>Pasture</bold></th>
<th align="center" valign="middle"><bold>Broccoli</bold></th>
<th align="center" valign="middle"><bold>Onion</bold></th>
<th align="center" valign="middle"><bold>Potato</bold></th>
<th align="center" valign="middle"><bold>Lettuce</bold></th></tr></thead>
<tbody>
<tr>
<td align="left" valign="top">Total C (g C kg<sup>−1</sup> soil)</td>
<td align="center" valign="top">0–10</td>
<td align="center" valign="top">2.26(0.100)</td>
<td align="center" valign="top">3.00 (0.400)</td>
<td align="center" valign="top">2.03(0.200)</td>
<td align="center" valign="top">2.08(0.300)</td>
<td align="center" valign="top">2.20(0.100)</td></tr>
<tr>
<td align="left" valign="top"/>
<td align="center" valign="top">10–20</td>
<td align="center" valign="top">1.01(0.160)</td>
<td align="center" valign="top">0.87 (0.200)</td>
<td align="center" valign="top">0.90(0.200)</td>
<td align="center" valign="top">0.97(0.100)</td>
<td align="center" valign="top">1.02(0.010)</td></tr>
<tr>
<td align="left" valign="top">Total N (g N kg<sup>−1</sup> soil)</td>
<td align="center" valign="top">0–10</td>
<td align="center" valign="top">0.17(0.010)</td>
<td align="center" valign="top">0.28 (0.030)</td>
<td align="center" valign="top">0.20(0.010)</td>
<td align="center" valign="top">0.19(0.020)</td>
<td align="center" valign="top">0.22(0.010)</td></tr>
<tr>
<td align="left" valign="top"/>
<td align="center" valign="top">10–20</td>
<td align="center" valign="top">0.10(0.010)</td>
<td align="center" valign="top">0.10 (0.020)</td>
<td align="center" valign="top">0.10(0.010)</td>
<td align="center" valign="top">0.11(0.003)</td></tr>
<tr>
<td align="left" valign="top">Total S (g S kg<sup>−1</sup> soil)</td>
<td align="center" valign="top">0–10</td>
<td align="center" valign="top">0.03(0.001)</td>
<td align="center" valign="top">0.03 (0.003)</td>
<td align="center" valign="top">0.02(0.003)</td>
<td align="center" valign="top">0.03(0.002)</td>
<td align="center" valign="top">0.03(0.002)</td></tr>
<tr>
<td align="left" valign="top"/>
<td align="center" valign="top">10–20</td>
<td align="center" valign="top">0.02(0.002)</td>
<td align="center" valign="top">0.02 (0.001)</td>
<td align="center" valign="top">0.01(0.001)</td>
<td align="center" valign="top">0.02(0.002)</td>
<td align="center" valign="top">0.02(0.002)</td></tr>
<tr>
<td align="left" valign="top">Soil pH</td>
<td align="center" valign="top">0–10</td>
<td align="center" valign="top">6.17(0.200)</td>
<td align="center" valign="top">6.79 (0.100)</td>
<td align="center" valign="top">6.84(0.100)</td>
<td align="center" valign="top">6.03(0.200)</td>
<td align="center" valign="top">6.80(0.030)</td></tr>
<tr>
<td align="left" valign="top"/>
<td align="center" valign="top">10–20</td>
<td align="center" valign="top">6.74(0.200)</td>
<td align="center" valign="top">6.83 (0.100)</td>
<td align="center" valign="top">7.08(0.100)</td>
<td align="center" valign="top">6.03(0.200)</td>
<td align="center" valign="top">6.73(0.300)</td></tr>
<tr>
<td align="left" valign="top">Microbial Biomass</td>
<td align="center" valign="top"/>
<td align="center" valign="top"/></tr>
<tr>
<td align="left" valign="top"> MBC (mg C kg<sup>−1</sup> soil)</td>
<td align="center" valign="top">0–10</td>
<td align="center" valign="top">386.00(22.00)</td>
<td align="center" valign="top">369.00(33.00)</td>
<td align="center" valign="top">192.00(25.00)</td>
<td align="center" valign="top">271.00(42.00)</td>
<td align="center" valign="top">394.00(57.00)</td></tr>
<tr>
<td align="left" valign="top"/>
<td align="center" valign="top">10–20</td>
<td align="center" valign="top">171.00(47.00)</td>
<td align="center" valign="top">68.00(16.00)</td>
<td align="center" valign="top">56.00(9.00)</td>
<td align="center" valign="top">120.00(11.00)</td>
<td align="center" valign="top">141.00(26.00)</td></tr>
<tr>
<td align="left" valign="top"> MBN (mg N kg<sup>−1</sup> soil)</td>
<td align="center" valign="top">0–10</td>
<td align="center" valign="top">76.00 (1.40)</td>
<td align="center" valign="top">82.00(6.50)</td>
<td align="center" valign="top">51.00(5.00)</td>
<td align="center" valign="top">76.00(11.00)</td>
<td align="center" valign="top">81.00(11.00)</td></tr>
<tr>
<td align="left" valign="top"/>
<td align="center" valign="top">10–20</td>
<td align="center" valign="top">32.00 (.00)</td>
<td align="center" valign="top">17.00(3.00)</td>
<td align="center" valign="top">15.00(2.00)</td>
<td align="center" valign="top">33.00(7.00)</td>
<td align="center" valign="top">27.00(3.00)</td></tr>
<tr>
<td align="left" valign="top">Enzyme Activities</td>
<td align="center" valign="top"/>
<td align="center" valign="top"/></tr>
<tr>
<td align="left" valign="top">(mg PN kg<sup>−1</sup> soil h<sup>−1</sup>)</td>
<td align="center" valign="top"/>
<td align="center" valign="top"/></tr>
<tr>
<td align="left" valign="top"> <italic>β</italic>-Glucosidase activity</td>
<td align="center" valign="top">0–10</td>
<td align="center" valign="top">121.00(18.00)</td>
<td align="center" valign="top">159.00(12.00)</td>
<td align="center" valign="top">133.00(4.00)</td>
<td align="center" valign="top">264.00(36.00)</td>
<td align="center" valign="top">158.00(13.00)</td></tr>
<tr>
<td align="left" valign="top"/>
<td align="center" valign="top">10–20</td>
<td align="center" valign="top">29.72 (7.00)</td>
<td align="center" valign="top">28.21 (7.00)</td>
<td align="center" valign="top">25.50(5.00)</td>
<td align="center" valign="top">46.24 (5.00)</td>
<td align="center" valign="top">32.71(4.00)</td></tr>
<tr>
<td align="left" valign="top"> <italic>β</italic>-Glucosaminidase activity</td>
<td align="center" valign="top">0–10</td>
<td align="center" valign="top">64.00 (3.30)</td>
<td align="center" valign="top">54.50 (3.10)</td>
<td align="center" valign="top">28.10(1.40)</td>
<td align="center" valign="top">63.20 (8.10)</td>
<td align="center" valign="top">35.30(7.20)</td></tr>
<tr>
<td align="left" valign="top"/>
<td align="center" valign="top">10–20</td>
<td align="center" valign="top">15.05(3.00)</td>
<td align="center" valign="top">13.74(3.00)</td>
<td align="center" valign="top">6.82(0.70)</td>
<td align="center" valign="top">19.16(2.00)</td>
<td align="center" valign="top">13.40(5.00)</td></tr>
<tr>
<td align="left" valign="top"> Acid Phosphatase activity</td>
<td align="center" valign="top">0–10</td>
<td align="center" valign="top">420.00(43.00)</td>
<td align="center" valign="top">534.00(35.00)</td>
<td align="center" valign="top">345.00(9.00)</td>
<td align="center" valign="top">466.00(30.00)</td>
<td align="center" valign="top">380.00(52.00)</td></tr>
<tr>
<td align="left" valign="top"/>
<td align="center" valign="top">10–20</td>
<td align="center" valign="top">141.00(44.00)</td>
<td align="center" valign="top">155.00(23.00)</td>
<td align="center" valign="top">119.00(6.00)</td>
<td align="center" valign="top">188.00(26.00)</td>
<td align="center" valign="top">138.00(18.00)</td></tr>
<tr>
<td align="left" valign="top"> Arylsulfatase activity</td>
<td align="center" valign="top">0–10</td>
<td align="center" valign="top">227.00(37.00)</td>
<td align="center" valign="top">205.00(43.00)</td>
<td align="center" valign="top">144.00(17.00)</td>
<td align="center" valign="top">227.00(23.00)</td>
<td align="center" valign="top">197.00(17.00)</td></tr>
<tr>
<td align="left" valign="top"/>
<td align="center" valign="top">10–20</td>
<td align="center" valign="top">109.00(35.00)</td>
<td align="center" valign="top">74.00(12.00)</td>
<td align="center" valign="top">49.00(2.00)</td>
<td align="center" valign="top">101.00(6.00)</td>
<td align="center" valign="top">84.00(21.00)</td></tr></tbody></table>
<table-wrap-foot><fn id="tfn1-diversity-03-00308">
<p>Values in parenthesis () are the standard error of the mean (n = 3).</p></fn></table-wrap-foot></table-wrap>
<table-wrap id="t2-diversity-03-00308" position="float">
<label>Table 2.</label>
<caption>
<p>Soil microbial community composition according to FAME indicators under different rhizospheres in an organic production system (0–10 cm).</p></caption>
<table frame="hsides" rules="groups">
<thead>
<tr>
<th align="left" valign="top"><bold>FAME Indicators</bold></th>
<th align="center" valign="top"><bold>Pasture</bold></th>
<th align="center" valign="top"><bold>Broccoli</bold></th>
<th align="center" valign="top"><bold>Onion</bold></th>
<th align="center" valign="top"><bold>Potato</bold></th>
<th align="center" valign="top"><bold>Lettuce</bold></th></tr>
<tr>
<th valign="bottom" colspan="6">
<hr/></th></tr>
<tr>
<th align="left" valign="top"><bold>Bacteria (B)</bold></th>
<th colspan="5" align="center" valign="top"><bold>nmols g<sup>−1</sup> soil</bold></th></tr></thead>
<tbody>
<tr>
<td colspan="6" align="left" valign="top">Gram +</td></tr>
<tr>
<td align="left" valign="top"> <italic>a</italic>15:0</td>
<td align="center" valign="top">110.78(5.57)</td>
<td align="center" valign="top">119.66(09.83)</td>
<td align="center" valign="top">75.68 (7.33)</td>
<td align="center" valign="top">138.13(12.21)</td>
<td align="center" valign="top">163.05(4.90)</td></tr>
<tr>
<td align="left" valign="top"> <italic>i</italic>15:0</td>
<td align="center" valign="top">187.61(18.96)</td>
<td align="center" valign="top">195.21(14.56)</td>
<td align="center" valign="top">130.43(12.02)</td>
<td align="center" valign="top">242.64(21.07)</td>
<td align="center" valign="top">163.05(7.68)</td></tr>
<tr>
<td align="left" valign="top"> <italic>i</italic>15:1</td>
<td align="center" valign="top">14.34(0.43)</td>
<td align="center" valign="top">12.76(2.25)</td>
<td align="center" valign="top">6.70(1.12)</td>
<td align="center" valign="top">16.33(2.41)</td>
<td align="center" valign="top">8.28(0.22)</td></tr>
<tr>
<td align="left" valign="top"> <italic>i</italic>16:0</td>
<td align="center" valign="top">98.11(3.62)</td>
<td align="center" valign="top">102.90(6.52)</td>
<td align="center" valign="top">67.81(4.77)</td>
<td align="center" valign="top">140.63(15.51)</td>
<td align="center" valign="top">86.96(5.45)</td></tr>
<tr>
<td align="left" valign="top"> <italic>a</italic>17:0</td>
<td align="center" valign="top">53.76(2.33)</td>
<td align="center" valign="top">59.47(3.76)</td>
<td align="center" valign="top">42.07(3.92)</td>
<td align="center" valign="top">64.31(6.96)</td>
<td align="center" valign="top">53.55(3.25)</td></tr>
<tr>
<td align="left" valign="top"> <italic>i</italic>17:0</td>
<td align="center" valign="top">58.36(4.83)</td>
<td align="center" valign="top">60.80(3.99)</td>
<td align="center" valign="top">43.09(3.62)</td>
<td align="center" valign="top">74.21(6.56)</td>
<td align="center" valign="top">56.62(3.26)</td></tr>
<tr>
<td colspan="6" align="left" valign="top">Gram−</td></tr>
<tr>
<td align="left" valign="top"> <italic>cy</italic>17:0</td>
<td align="center" valign="top">61.19(2.09)</td>
<td align="center" valign="top">63.70(5.69)</td>
<td align="center" valign="top">36.93(6.02)</td>
<td align="center" valign="top">70.53(7.22)</td>
<td align="center" valign="top">50.10(2.82)</td></tr>
<tr>
<td colspan="6" align="left" valign="top">Actinomycetes</td></tr>
<tr>
<td align="left" valign="top"> 10Me17:0</td>
<td align="center" valign="top">25.71(0.40)</td>
<td align="center" valign="top">21.49(1.33)</td>
<td align="center" valign="top">14.87(0.54)</td>
<td align="center" valign="top">32.81(3.61)</td>
<td align="center" valign="top">20.00(1.29)</td></tr>
<tr>
<td colspan="6" align="left" valign="top"><bold>Fungi (F)</bold></td></tr>
<tr>
<td align="left" valign="top"> 16:1 5c</td>
<td align="center" valign="top">275.98(59.81)</td>
<td align="center" valign="top">163.83(46.32)</td>
<td align="center" valign="top">92.21 (20.10)</td>
<td align="center" valign="top">204.00(46.21)</td>
<td align="center" valign="top">127.92(22.05)</td></tr>
<tr>
<td align="left" valign="top"> 18:1 9c</td>
<td align="center" valign="top">578.96(105.10)</td>
<td align="center" valign="top">421.95(50.39)</td>
<td align="center" valign="top">253.43(24.01)</td>
<td align="center" valign="top">526.73(52.48)</td>
<td align="center" valign="top">323.10(29.10)</td></tr>
<tr>
<td align="left" valign="top">Total (nmol g<sup>−1</sup> oil)</td>
<td align="center" valign="top">1464.80</td>
<td align="center" valign="top">1221.75</td>
<td align="center" valign="top">763.19</td>
<td align="center" valign="top">1510.33</td>
<td align="center" valign="top">1052.62</td></tr>
<tr>
<td align="left" valign="top">Sum F indicators</td>
<td align="center" valign="top">854.94</td>
<td align="center" valign="top">585.78</td>
<td align="center" valign="top">345.64</td>
<td align="center" valign="top">730.73</td>
<td align="center" valign="top">450.99</td></tr>
<tr>
<td align="left" valign="top">Sum B indicators</td>
<td align="center" valign="top">609.85</td>
<td align="center" valign="top">635.97</td>
<td align="center" valign="top">417.56</td>
<td align="center" valign="top">779.60</td>
<td align="center" valign="top">601.63</td></tr>
<tr>
<td align="left" valign="top">F:B ratios</td>
<td align="center" valign="top">1.40</td>
<td align="center" valign="top">0.92</td>
<td align="center" valign="top">0.83</td>
<td align="center" valign="top">0.93</td>
<td align="center" valign="top">0.75</td></tr></tbody></table>
<table-wrap-foot><fn id="tfn2-diversity-03-00308">
<p>Values in parenthesis () are the standard error of the mean (n = 3).</p></fn></table-wrap-foot></table-wrap>
<table-wrap id="t3-diversity-03-00308" position="float">
<label>Table 3.</label>
<caption>
<p>Top predominant bacterial families under different rhizospheres in an organic production system (0–10 cm).</p></caption>
<table frame="hsides" rules="groups">
<thead>
<tr>
<th align="left" valign="top"><bold>Relative abundance bacteria (%)</bold></th>
<th align="center" valign="top"><bold>Pasture</bold></th>
<th align="center" valign="top"><bold>Broccoli</bold></th>
<th align="center" valign="top"><bold>Potato</bold></th>
<th align="center" valign="top"><bold>Onion</bold></th>
<th align="center" valign="top"><bold>Lettuce</bold></th>
<th align="center" valign="top"><bold>Total</bold></th></tr></thead>
<tbody>
<tr>
<td align="left" valign="top"><italic>Flavobacteriaceae</italic></td>
<td align="center" valign="top">36.24</td>
<td align="center" valign="top">46.83*</td>
<td align="center" valign="top">22.42</td>
<td align="center" valign="top">33.85</td>
<td align="center" valign="top">33.35</td>
<td align="center" valign="top">36.06</td></tr>
<tr>
<td align="left" valign="top"><italic>Sphingobacteriaceae</italic></td>
<td align="center" valign="top">5.03</td>
<td align="center" valign="top">6.41*</td>
<td align="center" valign="top">5.07</td>
<td align="center" valign="top">4.40</td>
<td align="center" valign="top">4.90</td>
<td align="center" valign="top">7.73</td></tr>
<tr>
<td align="left" valign="top"><italic>Flexibacteraceae</italic></td>
<td align="center" valign="top"><bold>3.39</bold></td>
<td align="center" valign="top">11.71*</td>
<td align="center" valign="top">9.26</td>
<td align="center" valign="top">5.99</td>
<td align="center" valign="top">7.03</td>
<td align="center" valign="top">11.49</td></tr>
<tr>
<td align="left" valign="top"><italic>Xanthomonadaceae</italic></td>
<td align="center" valign="top"><bold>3.02</bold></td>
<td align="center" valign="top">5.83*</td>
<td align="center" valign="top">4.42</td>
<td align="center" valign="top">3.59</td>
<td align="center" valign="top">4.24</td>
<td align="center" valign="top">5.74</td></tr>
<tr>
<td align="left" valign="top"><italic>Rhodocyclaceae</italic></td>
<td align="center" valign="top"><bold>2.91</bold></td>
<td align="center" valign="top">3.77</td>
<td align="center" valign="top">4.08*</td>
<td align="center" valign="top">3.25</td>
<td align="center" valign="top">3.21</td>
<td align="center" valign="top">4.95</td></tr>
<tr>
<td align="left" valign="top"><italic>Rhizobiaceae</italic></td>
<td align="center" valign="top">2.45*</td>
<td align="center" valign="top">0.34</td>
<td align="center" valign="top">0.90</td>
<td align="center" valign="top">0.97</td>
<td align="center" valign="top">0.60</td>
<td align="center" valign="top">1.01</td></tr>
<tr>
<td align="left" valign="top"><italic>Hyphomicrobiaceae</italic></td>
<td align="center" valign="top">2.31*</td>
<td align="center" valign="top">1.39</td>
<td align="center" valign="top">2.28</td>
<td align="center" valign="top">2.10</td>
<td align="center" valign="top">1.88</td>
<td align="center" valign="top">2.00</td></tr>
<tr>
<td align="left" valign="top"><italic>Acidobacteriaceae</italic></td>
<td align="center" valign="top">2.10*</td>
<td align="center" valign="top">0.64</td>
<td align="center" valign="top">1.46</td>
<td align="center" valign="top">0.75</td>
<td align="center" valign="top">0.59</td>
<td align="center" valign="top">1.17</td></tr>
<tr>
<td align="left" valign="top"><italic>Bradyrhizobiaceae</italic></td>
<td align="center" valign="top">1.97*</td>
<td align="center" valign="top">0.24</td>
<td align="center" valign="top">0.88</td>
<td align="center" valign="top">0.37</td>
<td align="center" valign="top">0.00</td>
<td align="center" valign="top">0.61</td></tr>
<tr>
<td align="left" valign="top"><italic>Acetobacteraceae</italic></td>
<td align="center" valign="top">1.96*</td>
<td align="center" valign="top">0.65</td>
<td align="center" valign="top">0.89</td>
<td align="center" valign="top">0.51</td>
<td align="center" valign="top">0.85</td>
<td align="center" valign="top">0.85</td></tr>
<tr>
<td align="left" valign="top"><italic>Oxalobacteraceae</italic></td>
<td align="center" valign="top">1.82</td>
<td align="center" valign="top">0.46</td>
<td align="center" valign="top">3.27*</td>
<td align="center" valign="top">1.02</td>
<td align="center" valign="top">0.50</td>
<td align="center" valign="top">1.38</td></tr>
<tr>
<td align="left" valign="top"><italic>Comamonadaceae</italic></td>
<td align="center" valign="top">1.63</td>
<td align="center" valign="top">2.26</td>
<td align="center" valign="top">2.64*</td>
<td align="center" valign="top">3.02</td>
<td align="center" valign="top">1.55</td>
<td align="center" valign="top">2.02</td></tr>
<tr>
<td align="left" valign="top"><italic>Opitutaceae</italic></td>
<td align="center" valign="top"><bold>1.44</bold></td>
<td align="center" valign="top">3.67*</td>
<td align="center" valign="top">3.51</td>
<td align="center" valign="top">3.12</td>
<td align="center" valign="top">3.37</td>
<td align="center" valign="top">3.83</td></tr>
<tr>
<td align="left" valign="top"><italic>Conexibacteraceae</italic></td>
<td align="center" valign="top">1.30*</td>
<td align="center" valign="top">0.30</td>
<td align="center" valign="top">1.25</td>
<td align="center" valign="top">0.64</td>
<td align="center" valign="top">1.06</td>
<td align="center" valign="top">0.86</td></tr>
<tr>
<td align="left" valign="top"><italic>Streptomycetaceae</italic></td>
<td align="center" valign="top"><bold>1.17</bold></td>
<td align="center" valign="top">1.61</td>
<td align="center" valign="top">2.48</td>
<td align="center" valign="top">3.06*</td>
<td align="center" valign="top">2.63</td>
<td align="center" valign="top">1.92</td></tr>
<tr>
<td align="left" valign="top"><italic>Polyangiaceae</italic></td>
<td align="center" valign="top">1.08</td>
<td align="center" valign="top">0.82</td>
<td align="center" valign="top">1.31</td>
<td align="center" valign="top">1.65</td>
<td align="center" valign="top">1.82*</td>
<td align="center" valign="top">1.21</td></tr>
<tr>
<td align="left" valign="top"><italic>Burkholderiaceae</italic></td>
<td align="center" valign="top">1.01*</td>
<td align="center" valign="top">0.33</td>
<td align="center" valign="top">0.83</td>
<td align="center" valign="top">0.47</td>
<td align="center" valign="top">0.50</td>
<td align="center" valign="top">1.63</td></tr></tbody></table>
<table-wrap-foot><fn id="tfn3-diversity-03-00308">
<p>In bold are the bacteria lower in pasture and those with (*) represent higher bacterial abundance in the rhizosphere specified.</p></fn></table-wrap-foot></table-wrap>
<table-wrap id="t4-diversity-03-00308" position="float">
<label>Table 4.</label>
<caption>
<p>Soil bacterial diversity indexes studied under different rhizospheres in an organic production system.</p></caption>
<table frame="hsides" rules="groups">
<thead>
<tr>
<th align="left" valign="top"><bold>Diversity index</bold></th>
<th align="center" valign="top"><bold>Soil depth (cm)</bold></th>
<th align="center" valign="top"><bold>Pasture</bold></th>
<th align="center" valign="top"><bold>Broccoli</bold></th>
<th align="center" valign="top"><bold>Onion</bold></th>
<th align="center" valign="top"><bold>Potato</bold></th>
<th align="center" valign="top"><bold>Lettuce</bold></th></tr></thead>
<tbody>
<tr>
<td align="left" valign="top" rowspan="2">Ace (3%)</td>
<td align="center" valign="top">0–10</td>
<td align="center" valign="top">988.49</td>
<td align="center" valign="top">767.10</td>
<td align="center" valign="top">922.15</td>
<td align="center" valign="top">1112.09</td>
<td align="center" valign="top">1058.30</td></tr>
<tr>
<td align="center" valign="top">10–20</td>
<td align="center" valign="top">855.66</td>
<td align="center" valign="top">984.62</td>
<td align="center" valign="top">1184.99</td>
<td align="center" valign="top">916.81</td>
<td align="center" valign="top">1008.47</td></tr>
<tr>
<td align="left" valign="top" rowspan="2">Chao1 (3%)</td>
<td align="center" valign="top">0–10</td>
<td align="center" valign="top">937.24</td>
<td align="center" valign="top">745.39</td>
<td align="center" valign="top">948.23</td>
<td align="center" valign="top">1069.88</td>
<td align="center" valign="top">1046.80</td></tr>
<tr>
<td align="center" valign="top">10–20</td>
<td align="center" valign="top">848.91</td>
<td align="center" valign="top">951.54</td>
<td align="center" valign="top">1145.92</td>
<td align="center" valign="top">889.71</td>
<td align="center" valign="top">978.53</td></tr>
<tr>
<td align="left" valign="top" rowspan="2">OTU (3%)</td>
<td align="center" valign="top">0–10</td>
<td align="center" valign="top">673.00</td>
<td align="center" valign="top">581.67</td>
<td align="center" valign="top">609.00</td>
<td align="center" valign="top">770.00</td>
<td align="center" valign="top">729.33</td></tr>
<tr>
<td align="center" valign="top">10–20</td>
<td align="center" valign="top">567.33</td>
<td align="center" valign="top">699.67</td>
<td align="center" valign="top">727.67</td>
<td align="center" valign="top">563.33</td>
<td align="center" valign="top">648.00</td></tr>
<tr>
<td align="left" valign="top" rowspan="2">Rarefaction(3%)</td>
<td align="center" valign="top">0–10</td>
<td align="center" valign="top">852.26</td>
<td align="center" valign="top">800.94</td>
<td align="center" valign="top">815.89</td>
<td align="center" valign="top">1002.21</td>
<td align="center" valign="top">936.69</td></tr>
<tr>
<td align="center" valign="top">10–20</td>
<td align="center" valign="top">763.91</td>
<td align="center" valign="top">931.31</td>
<td align="center" valign="top">938.14</td>
<td align="center" valign="top">778.01</td>
<td align="center" valign="top">813.38</td></tr></tbody></table></table-wrap></sec>
<ack>
<p>The work was supported by USDA-ARS-Evans-Allen funds provided to Alabama A&amp;M University, Normal, AL. We thank Diane Tune for allowing us to conduct this study at the Tune Farm. We are also grateful to Colin Bell at USDA-ARS in Lubbock, TX for his technical and editorial revision.</p></ack>
<ref-list>
<title>References and Notes</title>
<ref id="b1-diversity-03-00308"><label>1.</label><citation citation-type="journal"><person-group person-group-type="author"><name><surname>Reganold</surname><given-names>J.P.</given-names></name><name><surname>Elliott</surname><given-names>L.F.</given-names></name><name><surname>Unger</surname><given-names>Y.L.</given-names></name></person-group><article-title>Long-term effects of organic and conventional farming on soil erosion</article-title><source>Nature</source><year>1987</year><volume>330</volume><fpage>370</fpage><lpage>372</lpage><pub-id pub-id-type="doi">10.1038/330370a0</pub-id></citation></ref>
<ref id="b2-diversity-03-00308"><label>2.</label><citation citation-type="journal"><person-group person-group-type="author"><name><surname>Drinkwater</surname><given-names>L.E.</given-names></name><name><surname>Letourneau</surname><given-names>D.K.</given-names></name><name><surname>Workneh</surname><given-names>F.</given-names></name><name><surname>van Bruggen</surname><given-names>A.H.C.</given-names></name><name><surname>Shennan</surname><given-names>C.</given-names></name></person-group><article-title>Fundamental differences between conventional and organic tomato agroecosystems in California</article-title><source>Ecol. Appl.</source><year>1995</year><volume>9</volume><fpage>629</fpage><lpage>631</lpage></citation></ref>
<ref id="b3-diversity-03-00308"><label>3.</label><citation citation-type="journal"><person-group person-group-type="author"><name><surname>Kreuger</surname><given-names>J.</given-names></name><name><surname>Peterson</surname><given-names>M.</given-names></name><name><surname>Lundgren</surname><given-names>E.</given-names></name></person-group><article-title>Agricultural inputs of pesticide residues to stream and pond sediments in a small catchment in southern Sweden</article-title><source>Bull. Environ. Contam.</source><year>1999</year><volume>62</volume><fpage>55</fpage><lpage>62</lpage><pub-id pub-id-type="doi">10.1007/s001289900841</pub-id></citation></ref>
<ref id="b4-diversity-03-00308"><label>4.</label><citation citation-type="journal"><person-group person-group-type="author"><name><surname>Mader</surname><given-names>P.</given-names></name><name><surname>Fliessbach</surname><given-names>A.</given-names></name><name><surname>Dubois</surname><given-names>D.</given-names></name><name><surname>Gunst</surname><given-names>L.</given-names></name><name><surname>Fried</surname><given-names>P.</given-names></name><name><surname>Niggli</surname><given-names>U.</given-names></name></person-group><article-title>Soil fertility and biodiversity in organic farming</article-title><source>Science</source><year>2002</year><volume>296</volume><fpage>1694</fpage><lpage>1697</lpage><pub-id pub-id-type="doi">10.1126/science.1071148</pub-id><pub-id pub-id-type="pmid">12040197</pub-id></citation></ref>
<ref id="b5-diversity-03-00308"><label>5.</label><citation citation-type="journal"><person-group person-group-type="author"><name><surname>Bengtsson</surname><given-names>J.</given-names></name><name><surname>Ahnstrom</surname><given-names>J.</given-names></name><name><surname>Weibull</surname><given-names>A.C.</given-names></name></person-group><article-title>The effects of organic agriculture on biodiversity and abundance: A meta-analysis</article-title><source>J. Appl. Ecol.</source><year>2005</year><volume>42</volume><fpage>261</fpage><lpage>269</lpage><pub-id pub-id-type="doi">10.1111/j.1365-2664.2005.01005.x</pub-id></citation></ref>
<ref id="b6-diversity-03-00308"><label>6.</label><citation citation-type="journal"><person-group person-group-type="author"><name><surname>Stockdale</surname><given-names>E.A.</given-names></name><name><surname>Watson</surname><given-names>C.A.</given-names></name></person-group><article-title>Biological indicators of soil quality in organic farming systems</article-title><source>Renew. Agr. Food Syst.</source><year>2009</year><volume>24</volume><fpage>308</fpage><lpage>318</lpage><pub-id pub-id-type="doi">10.1017/S1742170509990172</pub-id></citation></ref>
<ref id="b7-diversity-03-00308"><label>7.</label><citation citation-type="journal"><person-group person-group-type="author"><name><surname>Kandeler</surname><given-names>E.</given-names></name><name><surname>Kampichler</surname><given-names>C.</given-names></name><name><surname>Horak</surname><given-names>O.</given-names></name></person-group><article-title>Influence of heavy metals on the functional diversity of soil communities</article-title><source>Biol. Fertil. Soils</source><year>1996</year><volume>23</volume><fpage>299</fpage><lpage>306</lpage><pub-id pub-id-type="doi">10.1007/BF00335958</pub-id></citation></ref>
<ref id="b8-diversity-03-00308"><label>8.</label><citation citation-type="book"><person-group person-group-type="author"><name><surname>Howard</surname><given-names>A.</given-names></name></person-group><source>An Agricultural Testament</source><publisher-name>Oxford University Press</publisher-name><publisher-loc>New York, NY, USA</publisher-loc><year>1943</year></citation></ref>
<ref id="b9-diversity-03-00308"><label>9.</label><citation citation-type="journal"><person-group person-group-type="author"><name><surname>Karlen</surname><given-names>D.L.</given-names></name><name><surname>Andrews</surname><given-names>S.S.</given-names></name><name><surname>Doran</surname><given-names>J.W.</given-names></name></person-group><article-title>Soil quality: Current concepts and applications</article-title><source>Adv. Agron.</source><year>2001</year><volume>74</volume><fpage>1</fpage><lpage>40</lpage></citation></ref>
<ref id="b10-diversity-03-00308"><label>10.</label><citation citation-type="book"><person-group person-group-type="author"><name><surname>Sørensen</surname><given-names>J.</given-names></name></person-group><article-title>Modern soil microbiology</article-title><source>The Rhizosphere as a Habitat for Soil Microorganisms</source><person-group person-group-type="editor"><name><surname>van Elsas</surname><given-names>J.D.</given-names></name><name><surname>Trevors</surname><given-names>J.T.</given-names></name><name><surname>Wellington</surname><given-names>E.M.H.</given-names></name></person-group><publisher-name>Marcel Dekker, Inc.</publisher-name><publisher-loc>New York, NY, USA</publisher-loc><year>1997</year><fpage>21</fpage><lpage>45</lpage></citation></ref>
<ref id="b11-diversity-03-00308"><label>11.</label><citation citation-type="journal"><person-group person-group-type="author"><name><surname>Gregory</surname><given-names>P.J.</given-names></name></person-group><article-title>Roots, rhizosphere and soil: The route to a better understanding of soil science?</article-title><source>Eur. J. Soil Sci.</source><year>2006</year><volume>57</volume><fpage>2</fpage><lpage>12</lpage><pub-id pub-id-type="doi">10.1111/j.1365-2389.2005.00778.x</pub-id></citation></ref>
<ref id="b12-diversity-03-00308"><label>12.</label><citation citation-type="journal"><person-group person-group-type="author"><name><surname>Rovira</surname><given-names>A.D.</given-names></name></person-group><article-title>Interactions between plant roots and soil micro-organisms</article-title><source>Annu. Rev. Microbiol.</source><year>1965</year><volume>18</volume><fpage>241</fpage><lpage>266</lpage></citation></ref>
<ref id="b13-diversity-03-00308"><label>13.</label><citation citation-type="journal"><person-group person-group-type="author"><name><surname>Smalla</surname><given-names>K.</given-names></name><name><surname>Wieland</surname><given-names>G.</given-names></name><name><surname>Buchner</surname><given-names>A.</given-names></name><name><surname>Zock</surname><given-names>A.</given-names></name><name><surname>Parzy</surname><given-names>J.</given-names></name><name><surname>Kaiser</surname><given-names>S.</given-names></name><name><surname>Roskot</surname><given-names>N.</given-names></name><name><surname>Heuer</surname><given-names>H.</given-names></name><name><surname>Berg</surname><given-names>G.</given-names></name></person-group><article-title>Bulk and rhizosphere soil bacterial communities studied by denaturing gradient gel electrophoresis: Plant-dependent enrichment and seasonal shifts revealed</article-title><source>Appl. Environ. Microbiol.</source><year>2001</year><volume>67</volume><fpage>4742</fpage><lpage>4751</lpage><pub-id pub-id-type="doi">10.1128/AEM.67.10.4742-4751.2001</pub-id><pub-id pub-id-type="pmid">11571180</pub-id></citation></ref>
<ref id="b14-diversity-03-00308"><label>14.</label><citation citation-type="journal"><person-group person-group-type="author"><name><surname>Kandeler</surname><given-names>E.</given-names></name><name><surname>Marschner</surname><given-names>P.</given-names></name><name><surname>Tscherko</surname><given-names>D.</given-names></name><name><surname>Gahoonia</surname><given-names>T.S.</given-names></name><name><surname>Nielsen</surname><given-names>N.E.</given-names></name></person-group><article-title>Microbial community composition and functional diversity in the rhizosphere of maize</article-title><source>Plant Soil</source><year>2002</year><volume>238</volume><fpage>301</fpage><lpage>312</lpage><pub-id pub-id-type="doi">10.1023/A:1014479220689</pub-id></citation></ref>
<ref id="b15-diversity-03-00308"><label>15.</label><citation citation-type="journal"><person-group person-group-type="author"><name><surname>Kuske</surname><given-names>C.R.</given-names></name><name><surname>Ticknor</surname><given-names>L.O.</given-names></name><name><surname>Miller</surname><given-names>M.E.</given-names></name><name><surname>Dunbar</surname><given-names>J.M.</given-names></name><name><surname>Davis</surname><given-names>J.A.</given-names></name><name><surname>Bams</surname><given-names>S.M.</given-names></name><name><surname>Belnap</surname><given-names>J.</given-names></name></person-group><article-title>Comparison of soil bacterial communities in rhizospheres of three plant species and the interspaces in an arid grassland</article-title><source>Appl. Environ. Microbiol.</source><year>2002</year><volume>68</volume><fpage>1854</fpage><lpage>1863</lpage><pub-id pub-id-type="doi">10.1128/AEM.68.4.1854-1863.2002</pub-id><pub-id pub-id-type="pmid">11916705</pub-id></citation></ref>
<ref id="b16-diversity-03-00308"><label>16.</label><citation citation-type="journal"><person-group person-group-type="author"><name><surname>Watts</surname><given-names>D.B.</given-names></name><name><surname>Torbert</surname><given-names>A.H.</given-names></name><name><surname>Feng</surname><given-names>Y.</given-names></name><name><surname>Prior</surname><given-names>S.A.</given-names></name></person-group><article-title>Soil microbial community dynamics as influenced by composted dairy manure, soil properties, and landscape position</article-title><source>Soil Sci.</source><year>2010</year><volume>175</volume><fpage>474</fpage><lpage>486</lpage><pub-id pub-id-type="doi">10.1097/SS.0b013e3181f7964f</pub-id></citation></ref>
<ref id="b17-diversity-03-00308"><label>17.</label><citation citation-type="journal"><person-group person-group-type="author"><name><surname>Zelles</surname><given-names>L.</given-names></name></person-group><article-title>Fatty acid patterns of phospholipids and lipopolysaccharides in the characterisation of microbial communities in soil: A review</article-title><source>Biol. Fertil. Soils</source><year>1999</year><volume>29</volume><fpage>111</fpage><lpage>129</lpage><pub-id pub-id-type="doi">10.1007/s003740050533</pub-id></citation></ref>
<ref id="b18-diversity-03-00308"><label>18.</label><citation citation-type="journal"><person-group person-group-type="author"><name><surname>Miethling</surname><given-names>R.</given-names></name><name><surname>Wieland</surname><given-names>G.</given-names></name><name><surname>Backhaus</surname><given-names>H.</given-names></name><name><surname>Tebbe</surname><given-names>C.C.</given-names></name></person-group><article-title>Variation of microbial rhizosphere communities in response to crop species, soil origin, and inoculation with Sinorhizobium nelitoti L33</article-title><source>Microb. Ecol.</source><year>2000</year><volume>41</volume><fpage>43</fpage><lpage>56</lpage></citation></ref>
<ref id="b19-diversity-03-00308"><label>19.</label><citation citation-type="journal"><person-group person-group-type="author"><name><surname>Yao</surname><given-names>H.</given-names></name><name><surname>Wu</surname><given-names>F.</given-names></name></person-group><article-title>Soil microbial community structure in cucumber rhizosphere of different resistance cultivars to fusarium wilt</article-title><source>FEMS Microbiol. Ecol.</source><year>2010</year><volume>72</volume><fpage>456</fpage><lpage>463</lpage><pub-id pub-id-type="doi">10.1111/j.1574-6941.2010.00859.x</pub-id><pub-id pub-id-type="pmid">20370829</pub-id></citation></ref>
<ref id="b20-diversity-03-00308"><label>20.</label><citation citation-type="journal"><person-group person-group-type="author"><name><surname>Roesch</surname><given-names>L.F.W.</given-names></name><name><surname>Fulthorps</surname><given-names>R.R.</given-names></name><name><surname>Riva</surname><given-names>A.</given-names></name><name><surname>Casella</surname><given-names>G.</given-names></name><name><surname>Hadwin</surname><given-names>A.K.</given-names></name><name><surname>Kent</surname><given-names>A.D.</given-names></name><name><surname>Daroub</surname><given-names>S.H.</given-names></name><name><surname>Camargo</surname><given-names>F.A.O.</given-names></name><name><surname>Farmerie</surname><given-names>W.G.</given-names></name><name><surname>Triplett</surname><given-names>E.W.</given-names></name></person-group><article-title>Pyrosequencing enumerates and contrasts soil microbial diversity</article-title><source>ISME J.</source><year>2007</year><volume>1</volume><fpage>283</fpage><lpage>290</lpage><pub-id pub-id-type="pmid">18043639</pub-id></citation></ref>
<ref id="b21-diversity-03-00308"><label>21.</label><citation citation-type="journal"><person-group person-group-type="author"><name><surname>Acosta–Martinez</surname><given-names>V.</given-names></name><name><surname>Dowd</surname><given-names>S.E.</given-names></name><name><surname>Bell</surname><given-names>C.</given-names></name><name><surname>Lascano</surname><given-names>R.</given-names></name><name><surname>Booker</surname><given-names>J.D.</given-names></name><name><surname>Zobeck</surname><given-names>T.M.</given-names></name><name><surname>Upchurch</surname><given-names>D.R.</given-names></name></person-group><article-title>Microbial community comparison as affected by dryland cropping systems and tillage in a semiarid sandy soil</article-title><source>Diversity</source><year>2010</year><volume>2</volume><fpage>910</fpage><lpage>931</lpage><pub-id pub-id-type="doi">10.3390/d2060910</pub-id></citation></ref>
<ref id="b22-diversity-03-00308"><label>22.</label><citation citation-type="journal"><person-group person-group-type="author"><name><surname>Acosta–Martinez</surname><given-names>V.</given-names></name><name><surname>Dowd</surname><given-names>V.</given-names></name><name><surname>Sun</surname><given-names>Y.</given-names></name><name><surname>Allen</surname><given-names>V.</given-names></name></person-group><article-title>Tag–encoded pyrosequencing analysis of bacterial diversity in a single soil type as affected by management and land use</article-title><source>Soil Biol. Biochem.</source><year>2008</year><volume>40</volume><fpage>2762</fpage><lpage>2770</lpage><pub-id pub-id-type="doi">10.1016/j.soilbio.2008.07.022</pub-id></citation></ref>
<ref id="b23-diversity-03-00308"><label>23.</label><citation citation-type="journal"><person-group person-group-type="author"><name><surname>Schutter</surname><given-names>M.E.</given-names></name><name><surname>Dick</surname><given-names>R.P.</given-names></name></person-group><article-title>Comparison of fatty acid methyl ester (FAME) methods for characterizing microbial communities</article-title><source>Soil Sci. Soc. Am. J.</source><year>2000</year><volume>64</volume><fpage>1659</fpage><lpage>1668</lpage><pub-id pub-id-type="doi">10.2136/sssaj2000.6451659x</pub-id></citation></ref>
<ref id="b24-diversity-03-00308"><label>24.</label><citation citation-type="journal"><person-group person-group-type="author"><name><surname>Dowd</surname><given-names>S.E.</given-names></name><name><surname>Callaway</surname><given-names>T.R.</given-names></name><name><surname>Wolcott</surname><given-names>R.D.</given-names></name><name><surname>Sun</surname><given-names>Y.</given-names></name><name><surname>McKeehan</surname><given-names>T.</given-names></name><name><surname>Hagevoort</surname><given-names>R.G.</given-names></name><name><surname>Edrington</surname><given-names>T.S.</given-names></name></person-group><article-title>Evaluation of the bacterial diversity in the feces of cattle using 16S rDNA bacterial tag–encoded FLX amplicon pyrosequencing (bTEFAP)</article-title><source>BMC Microbiol.</source><year>2008</year><volume>8</volume><fpage>125</fpage><pub-id pub-id-type="doi">10.1186/1471-2180-8-125</pub-id><pub-id pub-id-type="pmid">18652685</pub-id></citation></ref>
<ref id="b25-diversity-03-00308"><label>25.</label><citation citation-type="web"><article-title>Roche Applied Science Home Page, Indianapolis, IN, USA, 1996–2011</article-title><comment>Available online: <ext-link xlink:href="https://www.roche-applied-science.com" ext-link-type="uri">https://www.roche-applied-science.com</ext-link> (accessed on 27 May 2011)</comment></citation></ref>
<ref id="b26-diversity-03-00308"><label>26.</label><citation citation-type="web"><person-group person-group-type="author"><collab>Microbial Diversity Analysis Service</collab></person-group><publisher-name>Research and Testing Laboratories, LLC</publisher-name><publisher-loc>Lubbock, TX, USA</publisher-loc><year>2011</year><comment>Available online: <ext-link xlink:href="http://www.researchandtesting.com/Diversity.html" ext-link-type="uri">http://www.researchandtesting.com/Diversity.html</ext-link> (accessed on 27 May 2011)</comment></citation></ref>
<ref id="b27-diversity-03-00308"><label>27.</label><citation citation-type="journal"><person-group person-group-type="author"><name><surname>Altschul</surname><given-names>S.F.</given-names></name><name><surname>Gish</surname><given-names>W.</given-names></name><name><surname>Miller</surname><given-names>W.</given-names></name></person-group><article-title>Basic local alignment search tool</article-title><source>J. Mol. Biol.</source><year>1990</year><volume>215</volume><fpage>403</fpage><lpage>410</lpage><pub-id pub-id-type="pmid">2231712</pub-id></citation></ref>
<ref id="b28-diversity-03-00308"><label>28.</label><citation citation-type="web"><article-title>NCBI Home Page, Bethesda, MD, USA, 2011</article-title><comment>Available online: <ext-link xlink:href="http://www.ncbi.nlm.nih.gov/" ext-link-type="uri">http://www.ncbi.nlm.nih.gov/</ext-link> (accessed on 11 April 2011)</comment></citation></ref>
<ref id="b29-diversity-03-00308"><label>29.</label><citation citation-type="journal"><person-group person-group-type="author"><name><surname>Brookes</surname><given-names>P.C.</given-names></name><name><surname>Landman</surname><given-names>A.</given-names></name><name><surname>Pruden</surname><given-names>G.</given-names></name><name><surname>Jenkinson</surname><given-names>D.S.</given-names></name></person-group><article-title>Chloroform fumigation and the release of soil nitrogen: A rapid direct extraction method to measure microbial biomass nitrogen in soil</article-title><source>Soil Biol. Biochem.</source><year>1985</year><volume>17</volume><fpage>837</fpage><lpage>842</lpage><pub-id pub-id-type="doi">10.1016/0038-0717(85)90144-0</pub-id></citation></ref>
<ref id="b30-diversity-03-00308"><label>30.</label><citation citation-type="journal"><person-group person-group-type="author"><name><surname>Vance</surname><given-names>E.D.</given-names></name><name><surname>Brookes</surname><given-names>P.C.</given-names></name><name><surname>Jenkinson</surname><given-names>D.S.</given-names></name></person-group><article-title>An extraction method for measuring microbial biomass C</article-title><source>Soil Biol. Biochem.</source><year>1987</year><volume>19</volume><fpage>703</fpage><lpage>707</lpage><pub-id pub-id-type="doi">10.1016/0038-0717(87)90052-6</pub-id></citation></ref>
<ref id="b31-diversity-03-00308"><label>31.</label><citation citation-type="journal"><person-group person-group-type="author"><name><surname>Wu</surname><given-names>J.</given-names></name><name><surname>Joegensen</surname><given-names>R.G.</given-names></name><name><surname>Pommerening</surname><given-names>B.</given-names></name><name><surname>Chaussod</surname><given-names>R.</given-names></name><name><surname>Brookes</surname><given-names>P.C.</given-names></name></person-group><article-title>Measurement of soil microbial biomass C by fumigation: A automated procedure</article-title><source>Soil Biol. Biochem.</source><year>1990</year><volume>22</volume><fpage>1167</fpage><lpage>1169</lpage><pub-id pub-id-type="doi">10.1016/0038-0717(90)90046-3</pub-id></citation></ref>
<ref id="b32-diversity-03-00308"><label>32.</label><citation citation-type="book"><person-group person-group-type="author"><name><surname>Jenkinson</surname><given-names>D.S.</given-names></name></person-group><article-title>Determination of microbial biomass carbon and nitrogen in soil</article-title><source>Advances in Nitrogen Cycling in Agricultural Ecosystems</source><person-group person-group-type="editor"><name><surname>Wilson</surname><given-names>J.R.</given-names></name></person-group><publisher-name>CAB Int.</publisher-name><publisher-loc>Walling-ford, UK</publisher-loc><comment>Marcel Dekker, New York, NY, USA</comment><year>1988</year><fpage>368</fpage><lpage>386</lpage></citation></ref>
<ref id="b33-diversity-03-00308"><label>33.</label><citation citation-type="book"><person-group person-group-type="author"><name><surname>Tabatabai</surname><given-names>M.A.</given-names></name></person-group><article-title>Soil enzymes</article-title><source>Methods of Soil Analysis: Microbiological and Biochemical Properties</source><person-group person-group-type="editor"><name><surname>Weaver</surname><given-names>R.W.</given-names></name><name><surname>Angle</surname><given-names>J.S.</given-names></name><name><surname>Botttomley</surname><given-names>P.S.</given-names></name></person-group><series>SSSA Book Series No. 5</series><publisher-name>Soil Science Society of America</publisher-name><publisher-loc>Madison, WI, USA</publisher-loc><year>1994</year><fpage>775</fpage><lpage>833</lpage></citation></ref>
<ref id="b34-diversity-03-00308"><label>34.</label><citation citation-type="journal"><person-group person-group-type="author"><name><surname>Parham</surname><given-names>J.A.</given-names></name><name><surname>Deng</surname><given-names>S.P.</given-names></name></person-group><article-title>Detection, quantification and characterization of β-glucosaminidase activity in soil</article-title><source>Soil Biol. Biochem.</source><year>2000</year><volume>32</volume><fpage>1183</fpage><lpage>1190</lpage><pub-id pub-id-type="doi">10.1016/S0038-0717(00)00034-1</pub-id></citation></ref>
<ref id="b35-diversity-03-00308"><label>35.</label><citation citation-type="book"><person-group person-group-type="author"><name><surname>Gee</surname><given-names>G.W.</given-names></name><name><surname>Bauder</surname><given-names>J.W.</given-names></name></person-group><article-title>Particle-size analysis</article-title><source>Methods of soil analysis</source><edition>2nd ed.</edition><comment>Part 1 Agron. Monogr. 9</comment><person-group person-group-type="editor"><name><surname>Klute</surname><given-names>A.</given-names></name></person-group><series>Book Series No. 5</series><publisher-name>American Society of Agronomy and Soil Science Society of America</publisher-name><publisher-loc>Madison, WI, USA</publisher-loc><year>1986</year><fpage>383</fpage><lpage>412</lpage></citation></ref>
<ref id="b36-diversity-03-00308"><label>36.</label><citation citation-type="book"><person-group person-group-type="author"><name><surname>McCune</surname><given-names>B.</given-names></name><name><surname>Mefford</surname><given-names>M.J.</given-names></name></person-group><source>PC-ORD. Multivariate Analysis of Ecological Data, Version 5</source><publisher-name>MjM Software Design</publisher-name><publisher-loc>Gleneden Beach, OR, USA</publisher-loc><year>1999</year></citation></ref>
<ref id="b37-diversity-03-00308"><label>37.</label><citation citation-type="book"><person-group person-group-type="author"><name><surname>Digby</surname><given-names>P.G.N.</given-names></name><name><surname>Kempton</surname><given-names>R.A.</given-names></name></person-group><source>Multivariate Analysis of Ecological Communities</source><publisher-name>Chapman and Hall</publisher-name><publisher-loc>London, UK</publisher-loc><year>1987</year></citation></ref>
<ref id="b38-diversity-03-00308"><label>38.</label><citation citation-type="journal"><person-group person-group-type="author"><name><surname>Cavigelli</surname><given-names>M.A.</given-names></name><name><surname>Robertson</surname><given-names>G.P.</given-names></name><name><surname>Klug</surname><given-names>M.J.</given-names></name></person-group><article-title>Fatty acid methyl ester (FAME) profiles as measures of soil microbial community structure</article-title><source>Plant Soil</source><year>1995</year><volume>170</volume><fpage>99</fpage><lpage>113</lpage><pub-id pub-id-type="doi">10.1007/BF02183058</pub-id></citation></ref>
<ref id="b39-diversity-03-00308"><label>39.</label><citation citation-type="journal"><person-group person-group-type="author"><name><surname>Edgar</surname><given-names>R.C.</given-names></name></person-group><article-title>Local homology recognition and distance measures in linear time using compressed amino acid alphabets</article-title><source>Nucl. Acids Res.</source><year>2004</year><volume>32</volume><fpage>380</fpage><lpage>385</lpage><pub-id pub-id-type="doi">10.1093/nar/gkh180</pub-id><pub-id pub-id-type="pmid">14729922</pub-id></citation></ref>
<ref id="b40-diversity-03-00308"><label>40.</label><citation citation-type="journal"><person-group person-group-type="author"><name><surname>Felsenstein</surname><given-names>J.P.</given-names></name></person-group><article-title>Phylogeny Inference Package, version 3.2</article-title><source>Cladistics</source><year>1989</year><volume>5</volume><fpage>164</fpage><lpage>166</lpage></citation></ref>
<ref id="b41-diversity-03-00308"><label>41.</label><citation citation-type="book"><person-group person-group-type="author"><name><surname>Felsenstein</surname><given-names>J.P.</given-names></name></person-group><source>Phylogeny Inference Package, version 3.6</source><publisher-name>Department of Genome Sciences, University of Washington</publisher-name><publisher-loc>Seattle, WA, USA</publisher-loc><year>2005</year></citation></ref>
<ref id="b42-diversity-03-00308"><label>42.</label><citation citation-type="journal"><person-group person-group-type="author"><name><surname>Schloss</surname><given-names>P.D.</given-names></name><name><surname>Handelsman</surname><given-names>J.</given-names></name></person-group><article-title>Introducing DOTUR, a computer program for defining operational taxonomic units and estimating species richness</article-title><source>Appl. Environ. Microbiol.</source><year>2005</year><volume>71</volume><fpage>1501</fpage><lpage>1506</lpage><pub-id pub-id-type="doi">10.1128/AEM.71.3.1501-1506.2005</pub-id><pub-id pub-id-type="pmid">15746353</pub-id></citation></ref>
<ref id="b43-diversity-03-00308"><label>43.</label><citation citation-type="journal"><person-group person-group-type="author"><name><surname>Chao</surname><given-names>A.</given-names></name><name><surname>Bunge</surname><given-names>J.</given-names></name></person-group><article-title>Estimating the number of species in a stochastic abundance model</article-title><source>Biometrics</source><year>2002</year><volume>58</volume><fpage>531</fpage><lpage>539</lpage><pub-id pub-id-type="doi">10.1111/j.0006-341X.2002.00531.x</pub-id><pub-id pub-id-type="pmid">12229987</pub-id></citation></ref>
<ref id="b44-diversity-03-00308"><label>44.</label><citation citation-type="journal"><person-group person-group-type="author"><name><surname>Bossio</surname><given-names>D.A.</given-names></name><name><surname>Scow</surname><given-names>K.M.</given-names></name><name><surname>Gunpala</surname><given-names>N.</given-names></name><name><surname>Graham</surname><given-names>K.J.</given-names></name></person-group><article-title>Determination of soil microbial communities: Effect of agricultural management, season, and soil type on phospholipid fatty acid profiles</article-title><source>Microbiol. Ecol.</source><year>1998</year><volume>36</volume><fpage>1</fpage><lpage>12</lpage><pub-id pub-id-type="doi">10.1007/s002489900087</pub-id></citation></ref>
<ref id="b45-diversity-03-00308"><label>45.</label><citation citation-type="journal"><person-group person-group-type="author"><name><surname>Blagodatskaya</surname><given-names>E.V.</given-names></name><name><surname>Anderson</surname><given-names>T.H.</given-names></name></person-group><article-title>Interactive effects of pH and substrate quality on the fungal-to-bacterial ratio and qCO<sub>2</sub> of microbial communities in forest soils</article-title><source>Soil Biol. Biochem.</source><year>1998</year><volume>30</volume><fpage>1269</fpage><lpage>1274</lpage><pub-id pub-id-type="doi">10.1016/S0038-0717(98)00050-9</pub-id></citation></ref>
<ref id="b46-diversity-03-00308"><label>46.</label><citation citation-type="journal"><person-group person-group-type="author"><name><surname>Bailey</surname><given-names>V.L.</given-names></name><name><surname>Smith</surname><given-names>J.L.</given-names></name><name><surname>Bolton</surname><given-names>H.</given-names></name></person-group><article-title>Fungal-to-bacterial ratios in soils investigated for enhanced C sequestration</article-title><source>Soil Biol. Biochem.</source><year>2002</year><volume>34</volume><fpage>997</fpage><lpage>1007</lpage><pub-id pub-id-type="doi">10.1016/S0038-0717(02)00033-0</pub-id></citation></ref>
<ref id="b47-diversity-03-00308"><label>47.</label><citation citation-type="journal"><person-group person-group-type="author"><name><surname>Sotomayor-Ramirez</surname><given-names>D.</given-names></name><name><surname>Espinosa</surname><given-names>Y.</given-names></name><name><surname>Acosta-Martinez</surname><given-names>V.</given-names></name></person-group><article-title>Land use effects on microbial biomass C, -glucosidase and -glucosaminidase activities, and availability, storage, and age of organic C in soil</article-title><source>Biol. Fertil. Soils</source><year>2009</year><volume>45</volume><fpage>487</fpage><lpage>497</lpage><pub-id pub-id-type="doi">10.1007/s00374-009-0359-x</pub-id></citation></ref>
<ref id="b48-diversity-03-00308"><label>48.</label><citation citation-type="journal"><person-group person-group-type="author"><name><surname>Speir</surname><given-names>T.W.</given-names></name><name><surname>Ross</surname><given-names>D.J.</given-names></name></person-group><article-title>Effects of storage on the activities of protease, urease, phosphatase, and sulphatase in three soils under pasture</article-title><source>N. Z. J. Soil Sci.</source><year>1975</year><volume>18</volume><fpage>231</fpage><lpage>237</lpage></citation></ref>
<ref id="b49-diversity-03-00308"><label>49.</label><citation citation-type="journal"><person-group person-group-type="author"><name><surname>McKenzie</surname><given-names>R.H.</given-names></name><name><surname>Stewart</surname><given-names>J.W.B.</given-names></name><name><surname>Dormaar</surname><given-names>J.F.</given-names></name><name><surname>Schaalje</surname><given-names>G.B.</given-names></name></person-group><article-title>Long-term crop rotation and fertilizer effects on phosphorus transformations. II. In a Luvisolic soil</article-title><source>Can. J. Soil Sci.</source><year>1992</year><volume>72</volume><fpage>581</fpage><lpage>589</lpage><pub-id pub-id-type="doi">10.4141/cjss92-048</pub-id></citation></ref>
<ref id="b50-diversity-03-00308"><label>50.</label><citation citation-type="journal"><person-group person-group-type="author"><name><surname>McKenzie</surname><given-names>R.H.</given-names></name><name><surname>Stewart</surname><given-names>J.W.B.</given-names></name><name><surname>Dormaar</surname><given-names>J.F.</given-names></name><name><surname>Schaalje</surname><given-names>G.B.</given-names></name></person-group><article-title>Long-term crop rotation and fertilizer effects on phosphorus transformations. I. In a Chernozemic soil</article-title><source>Can. J. Soil Sci.</source><year>1992</year><volume>72</volume><fpage>569</fpage><lpage>579</lpage><pub-id pub-id-type="doi">10.4141/cjss92-047</pub-id></citation></ref>
<ref id="b51-diversity-03-00308"><label>51.</label><citation citation-type="journal"><person-group person-group-type="author"><name><surname>Lynch</surname><given-names>J.</given-names></name><name><surname>Bragg</surname><given-names>E.</given-names></name></person-group><article-title>Microorganisms and soil aggregate stability</article-title><source>Adv. Soil Sci.</source><year>1985</year><volume>2</volume><fpage>133</fpage><lpage>171</lpage></citation></ref>
<ref id="b52-diversity-03-00308"><label>52.</label><citation citation-type="journal"><person-group person-group-type="author"><name><surname>Miller</surname><given-names>H.J.</given-names></name><name><surname>Henken</surname><given-names>G.</given-names></name><name><surname>van Veen</surname><given-names>J.A.</given-names></name></person-group><article-title>Variation and composition of bacterial populations in the rhizosphere of maize, wheat and grass cultivars, wheat and grass cultivars</article-title><source>Can. J. Microbiol.</source><year>1989</year><volume>35</volume><fpage>656</fpage><lpage>660</lpage><pub-id pub-id-type="doi">10.1139/m89-106</pub-id></citation></ref>
<ref id="b53-diversity-03-00308"><label>53.</label><citation citation-type="journal"><person-group person-group-type="author"><name><surname>Jangid</surname><given-names>K.</given-names></name><name><surname>Williams</surname><given-names>M.A.</given-names></name><name><surname>Franzluebbers</surname><given-names>A.J.</given-names></name><name><surname>Sanderlin</surname><given-names>J.S.</given-names></name><name><surname>Reeves</surname><given-names>J.H.</given-names></name><name><surname>Jenkins</surname><given-names>M.B.</given-names></name><name><surname>Endale</surname><given-names>D.M.</given-names></name><name><surname>Coleman</surname><given-names>D.C.</given-names></name><name><surname>Whitman</surname><given-names>W.B.</given-names></name></person-group><article-title>Relative impacts of land-use, management intensity and fertilization upon soil microbial community structure in agricultural systems</article-title><source>Soil Biol. Biochem.</source><year>2008</year><volume>40</volume><fpage>2843</fpage><lpage>2853</lpage><pub-id pub-id-type="doi">10.1016/j.soilbio.2008.07.030</pub-id></citation></ref>
<ref id="b54-diversity-03-00308"><label>54.</label><citation citation-type="journal"><person-group person-group-type="author"><name><surname>Janssen</surname><given-names>P.H.</given-names></name></person-group><article-title>Identifying the dominant soil bacteria taxa in libraries of 16S rRNA and 16S rRNA genes</article-title><source>Appl. Environ. Microbiol.</source><year>2006</year><volume>72</volume><fpage>1719</fpage><lpage>1728</lpage><pub-id pub-id-type="doi">10.1128/AEM.72.3.1719-1728.2006</pub-id><pub-id pub-id-type="pmid">16517615</pub-id></citation></ref>
<ref id="b55-diversity-03-00308"><label>55.</label><citation citation-type="journal"><person-group person-group-type="author"><name><surname>Spain</surname><given-names>A.M.</given-names></name><name><surname>Krumholz</surname><given-names>L.R.</given-names></name><name><surname>Elshahed</surname><given-names>M.S.</given-names></name></person-group><article-title>Abundance, composition, diversity and novelty of soil Proteobacteria</article-title><source>ISME J.</source><year>2009</year><volume>3</volume><fpage>992</fpage><lpage>1000</lpage><pub-id pub-id-type="doi">10.1038/ismej.2009.43</pub-id><pub-id pub-id-type="pmid">19404326</pub-id></citation></ref>
<ref id="b56-diversity-03-00308"><label>56.</label><citation citation-type="journal"><person-group person-group-type="author"><name><surname>Lauber</surname><given-names>C.L.</given-names></name><name><surname>Hamady</surname><given-names>M.</given-names></name><name><surname>Knight</surname><given-names>R.</given-names></name><name><surname>Fierer</surname><given-names>N.</given-names></name></person-group><article-title>Pyrosequencing-based assessment of soil pH as a predictor of soil bacterial community structure at the continental scale</article-title><source>Appl. Environ. Microbiol.</source><year>2009</year><volume>75</volume><fpage>5111</fpage><lpage>5120</lpage><pub-id pub-id-type="doi">10.1128/AEM.00335-09</pub-id><pub-id pub-id-type="pmid">19502440</pub-id></citation></ref>
<ref id="b57-diversity-03-00308"><label>57.</label><citation citation-type="journal"><person-group person-group-type="author"><name><surname>Kirchman</surname><given-names>D.L.</given-names></name></person-group><article-title>The ecology of <italic>Cytophaga-Flavobacteria</italic> in aquatic environments</article-title><source>FEMS Microbiol. Ecol.</source><year>2002</year><volume>39</volume><fpage>91</fpage><lpage>100</lpage><pub-id pub-id-type="pmid">19709188</pub-id></citation></ref>
<ref id="b58-diversity-03-00308"><label>58.</label><citation citation-type="journal"><person-group person-group-type="author"><name><surname>Bowman</surname><given-names>J.P.</given-names></name><name><surname>Nichols</surname><given-names>D.S.</given-names></name></person-group><article-title>Novel members of the family <italic>Flavobacteriaceae</italic> from Antarctic maritime habitats including <italic>Subsaximicrobium wynnwilliamsii</italic> gen. nov., sp. nov., <italic>Subsaximicrobium saxinquilinus</italic> sp. nov., <italic>Subsaxibacter broadyi</italic> gen. nov., sp. nov., <italic>Lacinutrix copepodicola</italic> gen. nov., sp. nov., and novel species of the genera <italic>Bizionia</italic>, <italic>Gelidibacter</italic> and <italic>Gillisia</italic></article-title><source>Int. J. Syst. Evol. Microbiol.</source><year>2005</year><volume>55</volume><fpage>1471</fpage><lpage>1486</lpage><pub-id pub-id-type="doi">10.1099/ijs.0.63527-0</pub-id><pub-id pub-id-type="pmid">16014468</pub-id></citation></ref>
<ref id="b59-diversity-03-00308"><label>59.</label><citation citation-type="book"><person-group person-group-type="author"><name><surname>Kersters</surname><given-names>K.</given-names></name><name><surname>De Vos</surname><given-names>P.</given-names></name><name><surname>Gillis</surname><given-names>M.</given-names></name><name><surname>Swings</surname><given-names>J.</given-names></name><name><surname>Vandamme</surname><given-names>P.</given-names></name><name><surname>Stackebrandt</surname><given-names>E.</given-names></name></person-group><article-title>Introduction to the Proteobacteria</article-title><source>The Prokaryotes</source><edition>3rd ed.</edition><person-group person-group-type="editor"><name><surname>Dwarkin</surname><given-names>M.</given-names></name><name><surname>Falkow</surname><given-names>S.</given-names></name><name><surname>Rosenberg</surname><given-names>E.</given-names></name><name><surname>Schleifer</surname><given-names>K.H.</given-names></name><name><surname>Stackebrandt</surname><given-names>E.</given-names></name></person-group><publisher-name>Springer-Verlag</publisher-name><publisher-loc>New York, NY, USA</publisher-loc><year>2006</year><volume>5</volume><fpage>3</fpage><lpage>37</lpage></citation></ref>
<ref id="b60-diversity-03-00308"><label>60.</label><citation citation-type="journal"><person-group person-group-type="author"><name><surname>Marschner</surname><given-names>P.</given-names></name><name><surname>Yang</surname><given-names>C.H.</given-names></name><name><surname>Lieberei</surname><given-names>R.</given-names></name><name><surname>Crowley</surname><given-names>D.E.</given-names></name></person-group><article-title>Soil and plant specific effects on bacterial community composition in the rhizosphere</article-title><source>Soil Biol. Biochem.</source><year>2001</year><volume>33</volume><fpage>1437</fpage><lpage>1445</lpage><pub-id pub-id-type="doi">10.1016/S0038-0717(01)00052-9</pub-id></citation></ref>
<ref id="b61-diversity-03-00308"><label>61.</label><citation citation-type="journal"><person-group person-group-type="author"><name><surname>Kent</surname><given-names>A.D.</given-names></name><name><surname>Triplett</surname><given-names>E.W.</given-names></name></person-group><article-title>Microbial communities and their interaction in soil and rhizosphere ecosystems</article-title><source>Annu. Rev. Microbiol.</source><year>2002</year><volume>56</volume><fpage>211</fpage><lpage>236</lpage><pub-id pub-id-type="doi">10.1146/annurev.micro.56.012302.161120</pub-id><pub-id pub-id-type="pmid">12142496</pub-id></citation></ref>
<ref id="b62-diversity-03-00308"><label>62.</label><citation citation-type="book"><person-group person-group-type="author"><name><surname>Singh</surname><given-names>G.</given-names></name><name><surname>Mukerji</surname><given-names>K.G.</given-names></name></person-group><article-title>Root exudates as determinant of rhizospheric microbial biodiversity</article-title><source>Microbial Activity in the Rhizosphere</source><person-group person-group-type="editor"><name><surname>Mukerji</surname><given-names>K.G.</given-names></name><name><surname>Manoharachary</surname><given-names>C.</given-names></name><name><surname>Singh</surname><given-names>J.</given-names></name></person-group><publisher-name>Springer-Verlag</publisher-name><publisher-loc>Berlin, Germany</publisher-loc><year>2006</year><fpage>39</fpage><lpage>53</lpage></citation></ref>
<ref id="b63-diversity-03-00308"><label>63.</label><citation citation-type="journal"><person-group person-group-type="author"><name><surname>Ulrich</surname><given-names>A.</given-names></name><name><surname>Becker</surname><given-names>R.</given-names></name></person-group><article-title>Soil parental material is a key determinant of the bacterial community structure in arable soils</article-title><source>FEMS Microbiol. Ecol.</source><year>2006</year><volume>56</volume><fpage>430</fpage><lpage>443</lpage><pub-id pub-id-type="doi">10.1111/j.1574-6941.2006.00085.x</pub-id><pub-id pub-id-type="pmid">16689875</pub-id></citation></ref>
<ref id="b64-diversity-03-00308"><label>64.</label><citation citation-type="journal"><person-group person-group-type="author"><name><surname>Song</surname><given-names>B.</given-names></name><name><surname>Palleroni</surname><given-names>N.J.</given-names></name><name><surname>Haggblom</surname><given-names>M.M.</given-names></name></person-group><article-title>Isolation and characterization of diverse halobenzoate-degrading denitrifying bacteria from soils and sediments</article-title><source>Appl. Environ. Microbiol.</source><year>2000</year><volume>66</volume><fpage>3446</fpage><lpage>3453</lpage><pub-id pub-id-type="doi">10.1128/AEM.66.8.3446-3453.2000</pub-id><pub-id pub-id-type="pmid">10919805</pub-id></citation></ref>
<ref id="b65-diversity-03-00308"><label>65.</label><citation citation-type="journal"><person-group person-group-type="author"><name><surname>Bond</surname><given-names>P.L.</given-names></name><name><surname>Hugenholtz</surname><given-names>P.</given-names></name><name><surname>Keller</surname><given-names>J.</given-names></name><name><surname>Blackall</surname><given-names>L.L.</given-names></name></person-group><article-title>Bacterial community structures of phosphate-removing and nonphosphate-removing activated sludges from sequencing batch reactors</article-title><source>Appl. Environ. Microbiol.</source><year>1995</year><volume>61</volume><fpage>1910</fpage><lpage>1916</lpage><pub-id pub-id-type="pmid">7544094</pub-id></citation></ref>
<ref id="b66-diversity-03-00308"><label>66.</label><citation citation-type="journal"><person-group person-group-type="author"><name><surname>Achenbach</surname><given-names>L.A.</given-names></name><name><surname>Michaelidou</surname><given-names>U.</given-names></name><name><surname>Bruce</surname><given-names>R.A.</given-names></name><name><surname>Fryman</surname><given-names>J.</given-names></name><name><surname>Coates</surname><given-names>J.D.</given-names></name></person-group><article-title><italic>Echloromonas agitata</italic> gen. nov., sp. nov. and <italic>Dechlorosoma suillum</italic> gen. nov., sp. nov., two novel environmentally dominant (per)chlorate-reducing bacteria and their phylogenetic position</article-title><source>Int. J. Syst. Evol. Microbiol.</source><year>2001</year><volume>51</volume><fpage>527</fpage><lpage>533</lpage><pub-id pub-id-type="pmid">11321099</pub-id></citation></ref>
<ref id="b67-diversity-03-00308"><label>67.</label><citation citation-type="journal"><person-group person-group-type="author"><name><surname>Coates</surname><given-names>J.D.</given-names></name><name><surname>Michaelidou</surname><given-names>U.</given-names></name><name><surname>Bruce</surname><given-names>R.A.</given-names></name><name><surname>O'Connor</surname><given-names>S.M.</given-names></name><name><surname>Crespi</surname><given-names>J.N.</given-names></name><name><surname>Achenbach</surname><given-names>L.A.</given-names></name></person-group><article-title>Ubiquity and diversity of dissimilatory (per) chlorate-reducing bacteria</article-title><source>Appl. Environ. Microbiol.</source><year>1999</year><volume>65</volume><fpage>5234</fpage><lpage>5241</lpage><pub-id pub-id-type="pmid">10583970</pub-id></citation></ref>
<ref id="b68-diversity-03-00308"><label>68.</label><citation citation-type="journal"><person-group person-group-type="author"><name><surname>Xie</surname><given-names>C.</given-names></name><name><surname>Yokota</surname><given-names>A.</given-names></name></person-group><article-title>Phylogenetic analyses of the nitrogenfixing genus Derxia</article-title><source>J. Gen. Appl. Microbiol.</source><year>2004</year><volume>50</volume><fpage>129</fpage><lpage>135</lpage><pub-id pub-id-type="doi">10.2323/jgam.50.129</pub-id><pub-id pub-id-type="pmid">15486821</pub-id></citation></ref>
<ref id="b69-diversity-03-00308"><label>69.</label><citation citation-type="journal"><person-group person-group-type="author"><name><surname>Manter</surname><given-names>D.K.</given-names></name><name><surname>Delgado</surname><given-names>J.A.</given-names></name><name><surname>Holm</surname><given-names>D.G.</given-names></name><name><surname>Stong</surname><given-names>R.A.</given-names></name></person-group><article-title>Pyrosequencing reveals a highly diverse and cultivar-specific bacterial endophyte community in potato roots</article-title><source>Microbiol. Ecol.</source><year>2010</year><volume>60</volume><fpage>157</fpage><lpage>166</lpage><pub-id pub-id-type="doi">10.1007/s00248-010-9658-x</pub-id></citation></ref>
<ref id="b70-diversity-03-00308"><label>70.</label><citation citation-type="journal"><person-group person-group-type="author"><name><surname>Lehr</surname><given-names>N.A.</given-names></name><name><surname>Schrey</surname><given-names>S.D.</given-names></name><name><surname>Hampp</surname><given-names>R.</given-names></name><name><surname>Tarkka</surname><given-names>M.T.</given-names></name></person-group><article-title>Root inoculation with a forest soil streptomycete leads to locally and systemically increased resistance against phytopathogens in Norway spruce</article-title><source>New Phytol.</source><year>2008</year><volume>177</volume><fpage>965</fpage><lpage>976</lpage><pub-id pub-id-type="doi">10.1111/j.1469-8137.2007.02322.x</pub-id><pub-id pub-id-type="pmid">18086220</pub-id></citation></ref>
<ref id="b71-diversity-03-00308"><label>71.</label><citation citation-type="journal"><person-group person-group-type="author"><name><surname>Huddleston</surname><given-names>A.S.</given-names></name><name><surname>Cresswell</surname><given-names>N.</given-names></name><name><surname>Neves</surname><given-names>M.C.</given-names></name><name><surname>Beringer</surname><given-names>J.E.</given-names></name><name><surname>Baumberg</surname><given-names>S</given-names></name><name><surname>Thomas</surname><given-names>D.I.</given-names></name><name><surname>Wellington</surname><given-names>E.M.</given-names></name></person-group><article-title>Molecular detection of streptomycin-producing streptomycetes in Brazilian soils</article-title><source>Appl. Environ. Microbiol.</source><year>1997</year><volume>63</volume><fpage>1288</fpage><lpage>1297</lpage><pub-id pub-id-type="pmid">9097426</pub-id></citation></ref>
<ref id="b72-diversity-03-00308"><label>72.</label><citation citation-type="journal"><person-group person-group-type="author"><name><surname>Emmert</surname><given-names>E.A.</given-names></name><name><surname>Handelsman</surname><given-names>J.</given-names></name></person-group><article-title>Biocontrol of plant disease: A (gram−) positive perspective</article-title><source>FEMS Microbiol. Lett.</source><year>1999</year><volume>171</volume><fpage>1</fpage><lpage>9</lpage><pub-id pub-id-type="doi">10.1111/j.1574-6968.1999.tb13405.x</pub-id><pub-id pub-id-type="pmid">9987836</pub-id></citation></ref>
<ref id="b73-diversity-03-00308"><label>73.</label><citation citation-type="journal"><person-group person-group-type="author"><name><surname>Sharifi–Tehrani</surname><given-names>A.</given-names></name><name><surname>Ramezani</surname><given-names>M.</given-names></name></person-group><article-title>Biological control of <italic>Fusarium oxysporum</italic>, the causal agent of onion wilt by antagonistic bacteria</article-title><source>Commun. Agric. Appl. Biol. Sci.</source><year>2003</year><volume>68</volume><fpage>543</fpage><lpage>547</lpage><pub-id pub-id-type="pmid">15151288</pub-id></citation></ref>
<ref id="b74-diversity-03-00308"><label>74.</label><citation citation-type="journal"><person-group person-group-type="author"><name><surname>Brat</surname><given-names>P.</given-names></name><name><surname>George</surname><given-names>S.</given-names></name><name><surname>Bellamy</surname><given-names>A.</given-names></name><name><surname>Du Chaffaut</surname><given-names>L.</given-names></name><name><surname>Scalbert</surname><given-names>A.</given-names></name><name><surname>Mennen</surname><given-names>L.</given-names></name><name><surname>Arnault</surname><given-names>N.</given-names></name><name><surname>Amiot</surname><given-names>M.J.</given-names></name></person-group><article-title>Daily polyphenol intake in France from fruit and vegetables</article-title><source>J. Nutr.</source><year>2006</year><volume>136</volume><fpage>2368</fpage><lpage>2373</lpage><pub-id pub-id-type="pmid">16920856</pub-id></citation></ref>
<ref id="b75-diversity-03-00308"><label>75.</label><citation citation-type="journal"><person-group person-group-type="author"><name><surname>Sampson</surname><given-names>L.</given-names></name><name><surname>Rimm</surname><given-names>E.</given-names></name><name><surname>Hollman</surname><given-names>P.C.H.</given-names></name><name><surname>de Vries</surname><given-names>J.H.M.</given-names></name><name><surname>Katan</surname><given-names>M.B.</given-names></name></person-group><article-title>Flavonol and flavone intakes in US health professionals</article-title><source>J. Am. Diet. Assoc.</source><year>2002</year><volume>102</volume><fpage>1414</fpage><lpage>1420</lpage><pub-id pub-id-type="doi">10.1016/S0002-8223(02)90314-7</pub-id><pub-id pub-id-type="pmid">12396158</pub-id></citation></ref>
<ref id="b76-diversity-03-00308"><label>76.</label><citation citation-type="journal"><person-group person-group-type="author"><name><surname>Hollmann</surname><given-names>P.C.H.</given-names></name><name><surname>Arts</surname><given-names>I.C.W.</given-names></name></person-group><article-title>Flavonols, flavones and flavanols—Nature, occurence and dietary burden</article-title><source>J. Sci. Food Agric.</source><year>2000</year><volume>80</volume><fpage>1081</fpage><lpage>1093</lpage><pub-id pub-id-type="doi">10.1002/(SICI)1097-0010(20000515)80:7&lt;1081::AID-JSFA566&gt;3.0.CO;2-G</pub-id></citation></ref>
<ref id="b77-diversity-03-00308"><label>77.</label><citation citation-type="journal"><person-group person-group-type="author"><name><surname>Galeotti</surname><given-names>F.</given-names></name><name><surname>Barile</surname><given-names>E.</given-names></name><name><surname>Curir</surname><given-names>P.</given-names></name><name><surname>Dolci</surname><given-names>M.</given-names></name><name><surname>Lanzotti</surname><given-names>V.</given-names></name></person-group><article-title>Flavonoids from carnation (<italic>Dianthus caryophyllus</italic>) and their antifungal activity</article-title><source>Phytochem. Lett.</source><year>2008</year><volume>1</volume><fpage>44</fpage><lpage>48</lpage><pub-id pub-id-type="doi">10.1016/j.phytol.2007.10.001</pub-id></citation></ref>
<ref id="b78-diversity-03-00308"><label>78.</label><citation citation-type="journal"><person-group person-group-type="author"><name><surname>Deng</surname><given-names>S.P.</given-names></name><name><surname>Tabatabai</surname><given-names>M.A.</given-names></name></person-group><article-title>Cellulase activity of soils</article-title><source>Soil Biol. Biochem.</source><year>1994</year><volume>26</volume><fpage>1347</fpage><lpage>1354</lpage><pub-id pub-id-type="doi">10.1016/0038-0717(94)90216-X</pub-id></citation></ref>
<ref id="b79-diversity-03-00308"><label>79.</label><citation citation-type="journal"><person-group person-group-type="author"><name><surname>Pavel</surname><given-names>R.</given-names></name><name><surname>Doyle</surname><given-names>J.</given-names></name><name><surname>Steinberger</surname><given-names>Y.</given-names></name></person-group><article-title>Seasonal pattern of cellulase concentration in desert soil</article-title><source>Soil Biol. Biochem.</source><year>2004</year><volume>36</volume><fpage>549</fpage><lpage>554</lpage><pub-id pub-id-type="doi">10.1016/j.soilbio.2003.10.024</pub-id></citation></ref>
<ref id="b80-diversity-03-00308"><label>80.</label><citation citation-type="journal"><person-group person-group-type="author"><name><surname>Frey</surname><given-names>S.D.</given-names></name><name><surname>Elliott</surname><given-names>E.T.</given-names></name><name><surname>Paustian</surname><given-names>K.</given-names></name></person-group><article-title>Bacterial and fungal abundance and biomass in conventional and no-tillage agroecosystems along two climatic gradients</article-title><source>Soil Biol. Biochem.</source><year>1999</year><volume>31</volume><fpage>573</fpage><lpage>585</lpage><pub-id pub-id-type="doi">10.1016/S0038-0717(98)00161-8</pub-id></citation></ref>
<ref id="b81-diversity-03-00308"><label>81.</label><citation citation-type="journal"><person-group person-group-type="author"><name><surname>Burke</surname><given-names>I.C.</given-names></name><name><surname>Yonker</surname><given-names>C.M.</given-names></name><name><surname>Parton</surname><given-names>W.J.</given-names></name><name><surname>Cole</surname><given-names>C.V.</given-names></name><name><surname>Flach</surname><given-names>K.</given-names></name><name><surname>Schimel</surname><given-names>D.S.</given-names></name></person-group><article-title>Texture, climate, and cultivation effects on soil organic matter content in U.S. grassland soils</article-title><source>Soil Sci. Soc. Am. J.</source><year>1989</year><volume>53</volume><fpage>800</fpage><lpage>805</lpage><pub-id pub-id-type="doi">10.2136/sssaj1989.03615995005300030029x</pub-id></citation></ref>
<ref id="b82-diversity-03-00308"><label>82.</label><citation citation-type="journal"><person-group person-group-type="author"><name><surname>Singh</surname><given-names>B.K.</given-names></name><name><surname>Bardgett</surname><given-names>R.D.</given-names></name><name><surname>Smith</surname><given-names>P.</given-names></name><name><surname>Reay</surname><given-names>D.</given-names></name></person-group><article-title>Microorganisms and climate change: Terrestrial feedbacks and mitigation options</article-title><source>Nat. Rev.</source><year>2010</year><volume>6</volume><fpage>779</fpage><lpage>790</lpage></citation></ref></ref-list>
<fn-group><fn id="fn1-diversity-03-00308">
<p><bold>USDA Disclaimer:</bold> Trade names and company names are included for the benefit of the reader and do not infer any endorsement or preferential treatment of the product by Alabama A&amp;M University (AAMU) or USDA-ARS. USDA-ARS and AAMU are equal opportunity providers and employers.</p></fn></fn-group></back></article>
