Article

Conservation Genetics of Crested Newt Species Triturus cristatus and T. carnifex within a Contact Zone in Central Europe: Impact of Interspecific Introgression and Gene Flow

1
Department of Organismic Biology, University of Salzburg, Hellbrunnerstr. 34, A-5020 Salzburg, Austria
2
Department of Zoology, Comenius University, Mlynská dolina B-1, SK-84215 Bratislava, Slovak Republic
*
Author to whom correspondence should be addressed.
Diversity 2010, 2(1), 28-46; https://doi.org/10.3390/d2010028
Submission received: 4 November 2009 / Accepted: 19 December 2009 / Published: 31 December 2009
(This article belongs to the Special Issue Amphibian Conservation)

Abstract

:
We have studied the population genetic structure of slightly admixed populations of crested newts (Triturus cristatus and T. carnifex) in a continuously fragmented landscape, located in northern Salzburg (Austria) and neighbouring Bavaria (Germany). Crested newts are listed as Critically Endangered in the provincial Red List of Salzburg and strictly protected by the EU Habitats Directive. We used seven polymorphic microsatellite loci to evaluate genetic diversity and processes that may determine the genetic architecture of populations. Genetic diversity was moderate, pairwise FST-values were comparatively high showing significant genetic differentiation and limited gene flow. Isolation by distance was significant for the whole data set, but not significant when calculated for T. cristatus- and T. carnifex-like populations separately. Bayesian analyses of population structure, using three different programs showed similar results. Spatial statistics reveal that the geographical isolation of populations is very high.

1. Introduction

Amphibians have attracted a considerable amount of interest from scientists as they undergo a steady worldwide decline [1,2,3,4]. In central European countries this development largely is caused by destroyed, diminished or disrupted natural habitats, due to human land use during the last decades. Intensive agriculture, drainage of wetlands and river regulations first were the driving forces for such developments. Nowadays, habitat loss continues in connection with growing amount of infrastructure, housing development or commercial areas in human dominated areas. As a consequence natural landscapes are fragmented and isolation of local populations in discrete habitat patches increases, while the surrounding areas are unfavourable and dispersal is limited. This issue has become of high importance for conservation biology at large [5,6] and for amphibian conservation in particular [7,8,9].
Many amphibian species are thought to have comparably low dispersal rates and high site fidelity [10,11,12]. Whether amphibians exist in metapopulations is largely dependant on the hypothesis of limited dispersal, and dispersal capabilities are higher than assumed in previous studies [13,14]. Though the traditional assumption of populations being reflected in breeding ponds as unique genetic entities has to be refined, recent studies show that a majority of ponds can be distinguished genetically from close neighbours [15,16]. Therefore amphibians are highly suitable models for addressing questions of conservation, genetic diversity and the definition of population boundaries [17,18].
Reliable estimates of population differentiation are crucial for conservation biology, where it is often necessary to understand whether populations are genetically isolated from each other and therefore subject to genetic drift. At the beginning of population genetic studies, populations were defined on a priori basis. F-statistics and in particular FST [19], were used to estimate the connectivity and patterns of gene flow among populations [20]. Recently Bayesian methods, which use genotype information for the assignment of population membership of individuals, have become widely used in this field [21]. In such studies, microsatellites are the most frequently used markers. They combine high variability with nuclear co-dominant inheritance and can be typed following non-invasive sampling. Moreover, microsatellite loci are sufficiently variable to uncover patterns of gene flow over small geographical scales, in order to infer historic dispersal [22]. They have been stated as highly useful for studies relevant to amphibian conservation [23] and recently were applied among a wide variety of endangered amphibian species.
Crested newts can generally be described as large bodied, philopatric newts with high adaptation to the aquatic habitat [24] and comparably low mobility [25,26]. They have contiguous distributions over large parts of Europe and adjacent Asia. The Northern crested newt, Triturus cristatus (Laurenti, 1768) and the Italian crested newt, T. carnifex (Laurenti, 1768) are two closely related species within this group. While T. cristatus is distributed over large areas from Northern and Central Europe to the Ural Mountains in Russia, T. carnifex occurs in countries surrounding the north of the Adriatic Sea, as well as parts of Switzerland, Austria and the Czech Republic [24,27]. Their natural ranges are parapatric, or narrowly sympatric in some areas in Central Europe. One of these areas, where introgression and hybridization occur within populations, is located near Salzburg, Austria [28,29].
The IUCN Red List of threatened species lists both studied species as Least concern, mainly due to their comparably wide distribution [30,31]. However, on the regional level, the conservation status of crested newts in the province of Salzburg is unfavourable due to a considerable decline in population numbers and distribution area. Historical data show a wider distribution, particularly in the lowland areas surrounding the city of Salzburg, which is lost nowadays [32]. Crested newts are therefore rated as Critically Endangered in the current provincial Red List of Salzburg [33]. The remaining populations are gradually isolated due to geographical distance and migration barriers like regulated rivers, high traffic roads and intensive agriculture.
The aims of the study were: (1) to analyse the genetic structure of populations, (2) to evaluate whether processes like past hybridization or contemporary gene flow influenced by habitat fragmentation determine the genetic architecture of studied populations and (3) to provide general implications for conservation measures.

2. Methods

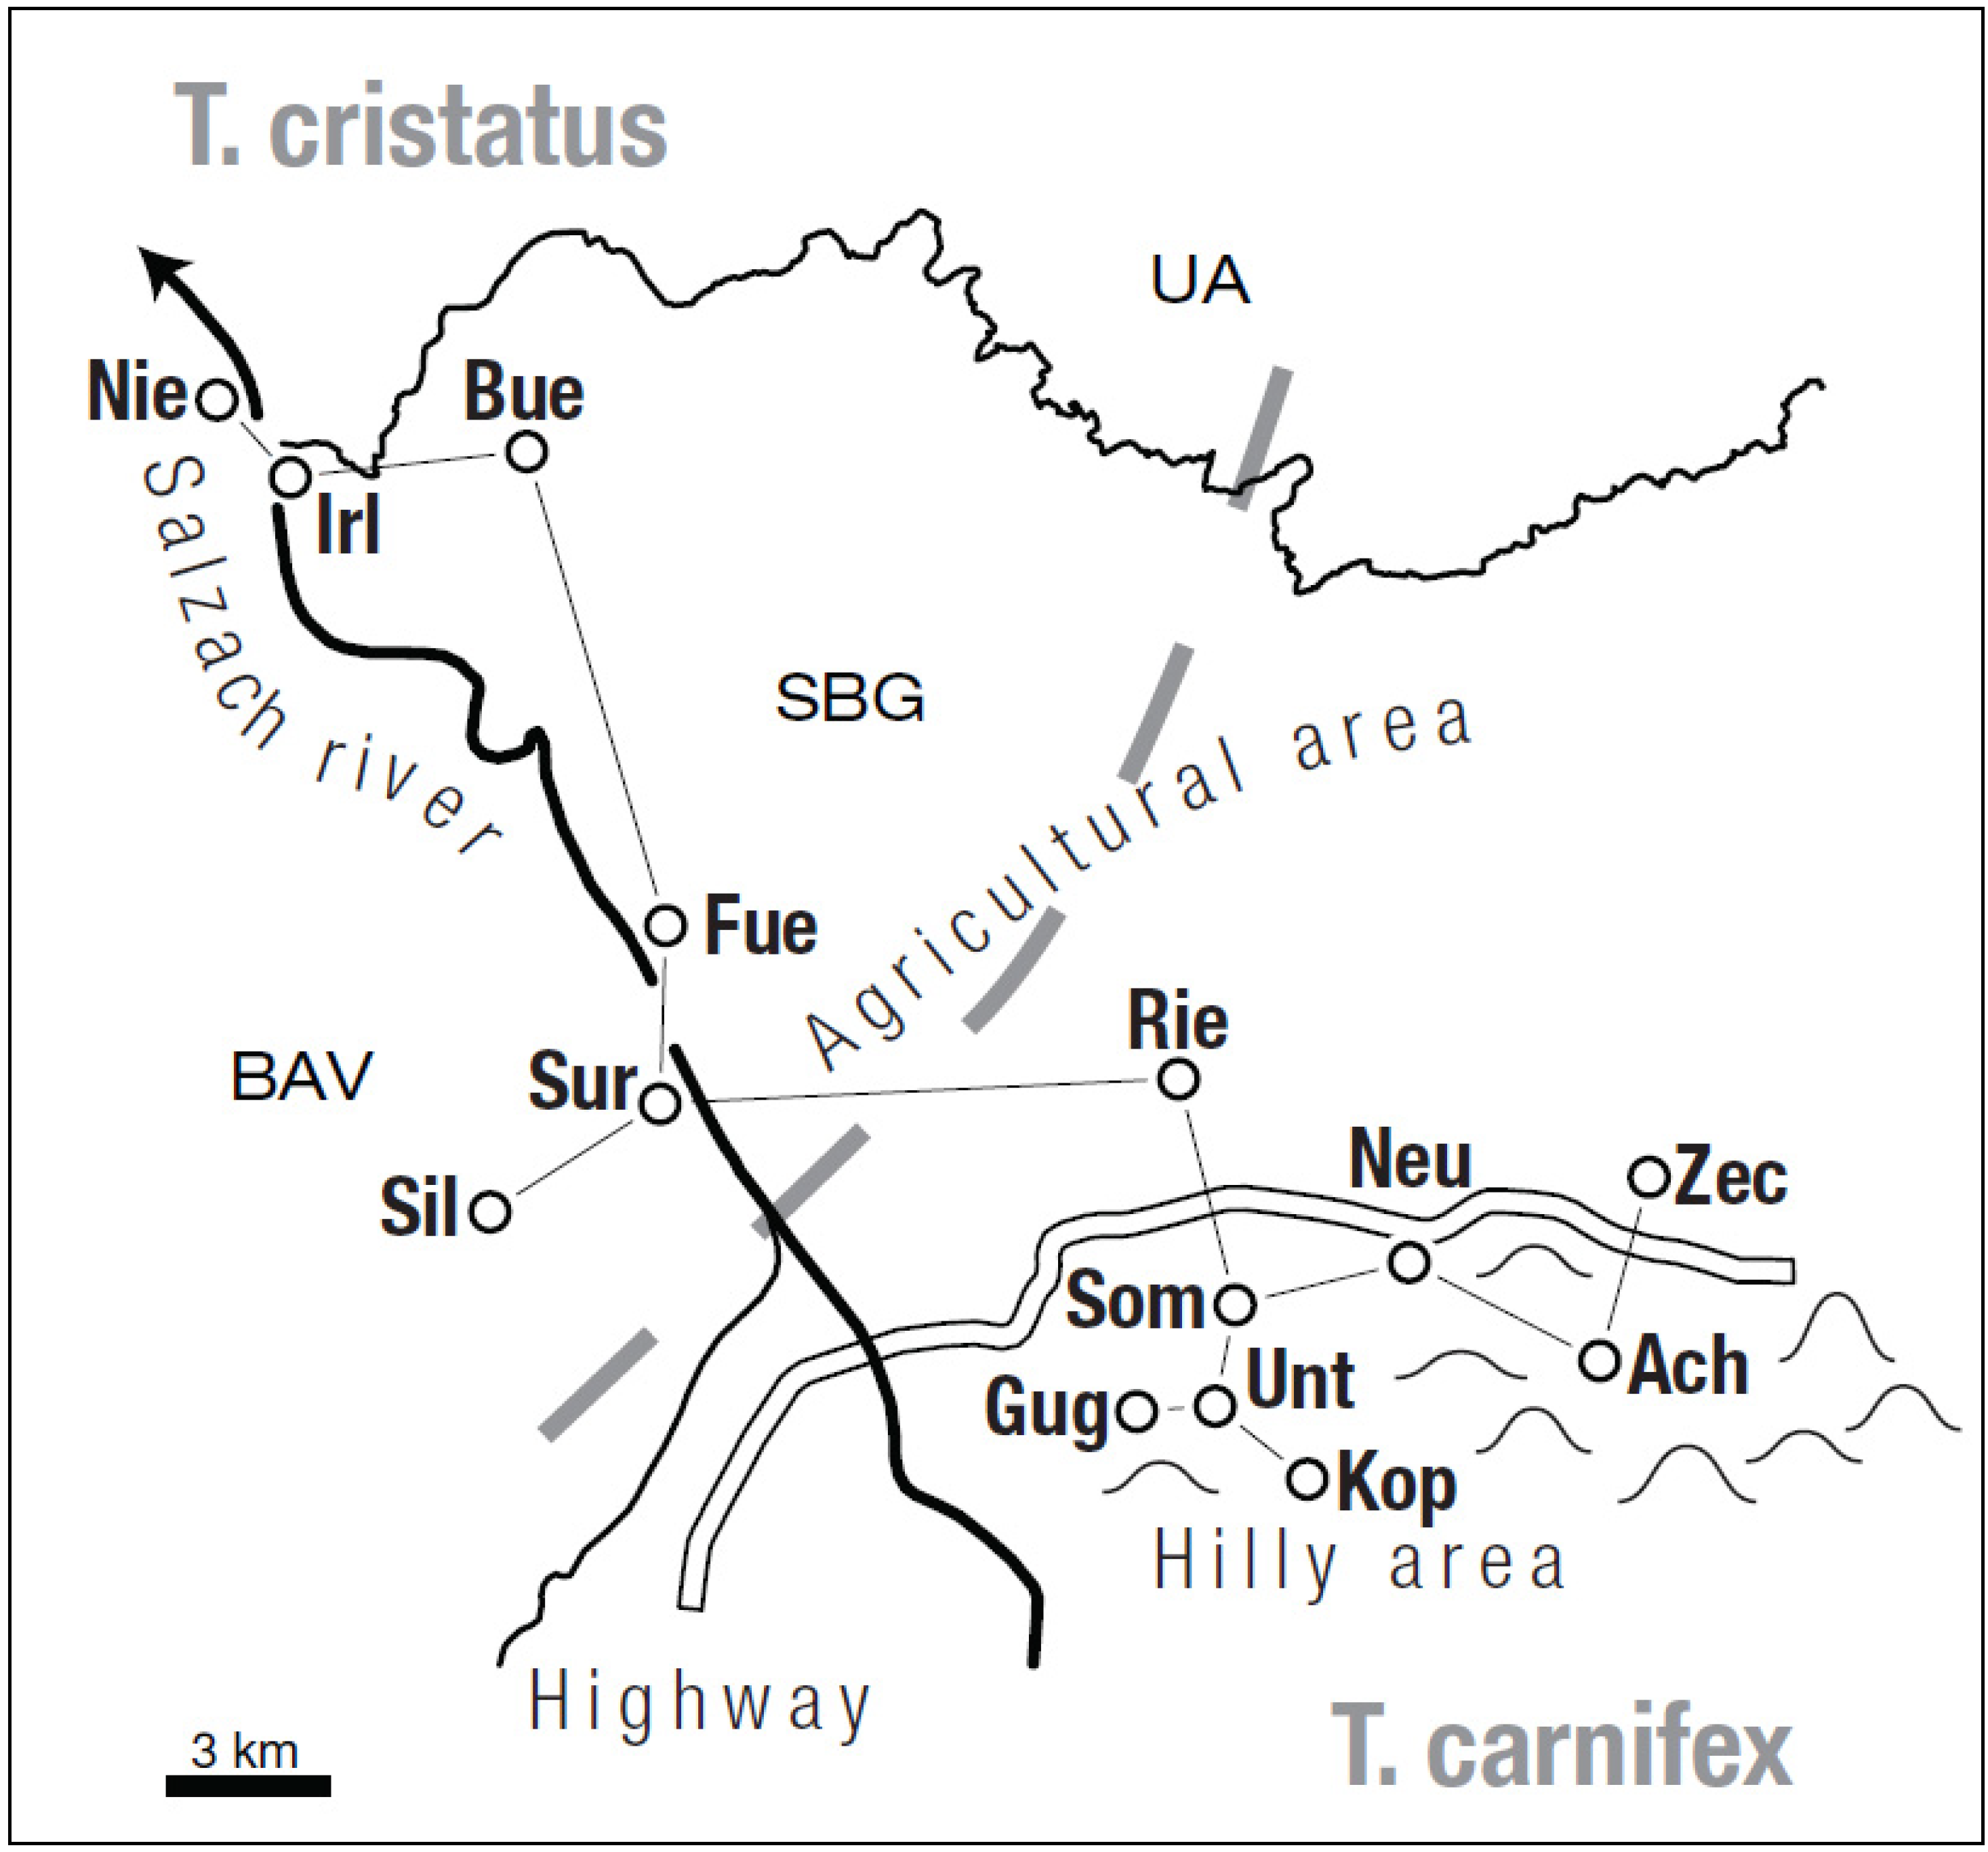
2.1. Study Area and Sample Collection

Our study was located in an area of approximately 25 × 35 km in the Austrian district of “Salzburg-Umgebung” and small parts of the neighbouring Bavarian district of “Berchtesgadener Land” (Germany). The landscape north and northeast of the city of Salzburg is composed of three main features. The valley of the river Salzach in N-S-direction at about 400 m a.s.l., a hilly area between 500 and 900 m a.s.l. in W-E direction, and an agricultural area in between. The whole region has to a large extent been subject to significant changes and is pressurised by human land use. The river Salzach shapes a natural border between Germany (Bavaria) and Austria (Salzburg, Upper Austria) in this area. It has lost most of its former typical dynamical characteristics of an Alpine river due to ongoing regulation measures and gradual straightening. Thus it also provides a barrier for amphibian migration since many decades. A dense net of moderate to high traffic roads represent a second type of barrier that continuously increases in importance. The highway A1, which was built between 1940s and 1970s to connect Vienna and Salzburg, represents the oldest and most effective of these barriers (Figure 1).
In 2004 and 2005 we sampled 145 individuals from 14 study localities. Geographical positions were determined with a dGPS. Distances between localities were measured in QUANTUM-GIS [34]. Samples from populations in Bavaria had been collected by toe-clipping of adult newts during an unpublished mapping survey. Tissue of Austrian newts was gained by collecting buccal cells with sterile cotton buds, which were stored in 96% ethanol. This method allows efficient and reliable genotyping of microsatellites in amphibians in a non-destructive way [35,36]. As we decided to use non-destructive sampling techniques on adult individuals due to the rarity of the studied species, sample sizes for some populations are comparatively low. Since all sampled populations are located within a contact zone, we assigned them to respective taxa as T. cristatus-like and T. carnifex-like on the basis of previous analyses using species-specific mtDNA (cyt b), and microsatellite markers [29]. The locations of sampling sites and the number of sampled individuals for each locality are shown in Table 1 and Figure 1.
Table 1. Sampling localities with abbreviations in parentheses, country of origin (G = Germany, A = Austria), number of sampled individuals (N) and geographical coordinates.
LocalityCountryNLatitude (°N)Longitude (°E)
T. cristatus-like
Niederau (Nie)G648° 00´12° 51´
Sillersdorf (Sil)G547° 51´12° 55´
Surheim (Sur)G747° 52´12° 58´
Irlach (Irl)A747° 59´12° 52´
Bürmoos (Bue)A1647° 59´12° 56´
Fürwag (Fue)A1747° 54´12° 58´
T. carnifex-like
Ried (Rie)A2047° 52´13° 06´
Guggenthal (Gug)A747° 49´13° 06´
Unterkoppl (Unt)A747° 49´13° 07´
Sommeregg (Som)A1847° 50´13° 07´
Neuhofen (Neu)A1547° 50´13° 10´
Koppl (Kop)A247° 48´13° 08´
Zecherl (Zec)A1147° 58´13° 14´
Achleiten (Ach)A747° 49´13° 13´
Figure 1. Study area with positions of sampled localities and a relative neighbour graph (RNG) showing distances between nearest neighbours; borders of Salzburg province (fine line); BAV = Bavaria, SBG = Salzburg, UA = Upper Austria.
Diversity 02 00028 g001

2.2. DNA-Extraction and Microsatellite Genotyping

DNA was extracted from buccal cells or toe tips using NucleoSpin Tissue Kit (Macherey-Nagel). We scored seven highly polymorphic microsatellite loci (Tcri13, Tcri29, Tcri32, Tcri35, Tcri36, Tcri43, and Tcri46), designed originally from a T. cristatus library [37]. Total reaction volumes of 10 µL were used with final concentration of 0.1 mM dNTPs, 2−3 mM MgCl2 (depending on the locus), 0.1 mM of each primer, 0.25 U DNA Polymerase (Fermentas) and DNA sample in the manufacture’s buffer (750 mM Tris-HCl pH 8.8, 200 mM (NH4)2SO4, 0.1% Tween 20). Thermal profiles for all microsatellite loci consisted of 2 min initial denaturation at 94ºC followed by 39 cycles of 1 min at 94 °C, annealing for 1 min at 53 °C and elongation at 72 °C for 2 min. An additional 5 min period for elongation at 72 °C followed the last cycle. For routine genotyping, primers were commercially labeled with fluorochromes (HEX, FAM, TET and NED), and PCR products were run on an automated ABI 310 DNA sequencer. Allele sizes were surveyed using ABI Genescan software and Tamra 500 size standard (Applied Biosystems).

2.3. Genetic Diversity

Allele frequencies and FIS coefficients [38] were computed using GENEPOP 3.3 [39]. Observed (Ho) and expected (He) heterozygosity were estimated using the program SPAGeDi 1.1 [40]. Heterozygote deficit for each population and locus and across all loci in a population were tested by the score test (U test) available in GENEPOP 3.3 [39]. Estimates of exact P-values of this test were performed using a Markov chain algorithm based on 10.000 iterations. Measures of allelic richness (mean number of alleles per locus) were corrected for variation in sample size by using the rarefaction method, implemented in the program FSTAT 2.9.3.2 [41]. To test for the presence of null alleles for each population and locus we used the program MICRO-CHECKER applying the Bonferroni correction for significance of results [42]. Only populations with N ≥ 5 were analyzed, therefore locality Kop was omitted from the analysis.

2.4. Population Differentiation and Isolation by Distance Pattern

F-statistics [19,43] were used to determine genetic differentiation between crested newt populations. FST-values were estimated [38] and their significance was tested with permutation tests based on 10.000 iterations using GENEPOP 3.3 [39]. The Mantel test [44] was employed to asses the correlation between geographical and genetic distances (Isolation by distance-pattern) in pooled data, as well as in T. carnifex-like and T. cristatus-like populations separately, using SPAGeDi 1.1 [40]. Only populations with N ≥ 5 were analyzed, therefore locality Kop was omitted from the analysis.

2.5. Spatial Genetic Structure (Bayesian Approach)

For tests considering the population structure of crested newts in the study area we applied three different programs using Bayesian approaches. The program Structure 2.1 [45,46] uses a Bayesian clustering approach and assigns individual genotypes to a predefined number of populations (K) in a given sample (X). We performed clustering analysis assuming that newts belong to an unknown number of K genetically distinct clusters, without providing any prior population information. The admixture model was applied for a minimum of K = 1 to a maximum of K = 10. For each value of K we performed three runs to evaluate the consistency of the results, using 106 runs after a burn-in period of the Markov-chain of 105 runs [45]. To estimate the correct number of clusters we calculated ΔK [47]. Subsequently we analysed the assigned groups again individually to reveal further substructure.
Secondly, we used the Bayesian clustering method implemented in the program Baps 3.2 [48,49]. This method allows a more hierarchical analysis treating the partition among groups of individuals as the parameter of main interest. It treats both the allele frequencies of the molecular markers and the number of genetically diverged groups in population as random variables, and uses stochastic optimization to infer the posterior mode of the genetic structure. We applied this program to the whole data set using the option clustering of groups of individuals.
Thirdly, the program Geneland [50,51], implemented in the R-freeware-package [52], was used. This code combines microsatellite genotypes with geographical information (coordinates of sampling locations). Adopting the approach in [53], in the first line of analysis the most probably number of populations (K) was inferred with 5 × 10⁵ Markov chain Monte Carlo iterations (MCMC). We allowed the number of K to vary between 1 and 30. The maximum rate of the Poisson process was fixed at 500 and the maximum number of nuclei in the Poisson-Voronoi tesselation was set at 1.500. We used the Dirichlet method for allele frequencies [50,51] and performed 10 MCMC runs to verify the consistency of results and obtained negligible variation in these replicates with the most probable value for K being stable at six. This number of clusters was fixed for the second part of analysis (5 × 10⁵ MCMC iterations using a burn-in of 5 × 10⁴ iterations) including the spatial information. Parameters of the Voronoi-tesselation remained the same to those of the runs with variable K. The posterior probability of population membership and the modal population of each individual were calculated on a spatial domain spanning 50 pixels along the x- and y-axis. Again, the consistency of results was evaluated by 10 replictate runs. Because the samples were taken from specific sites (breeding ponds), we randomly assigned a slightly different coordinate (5−10 meters divergent), to each sample to generate unique coordinates [18].

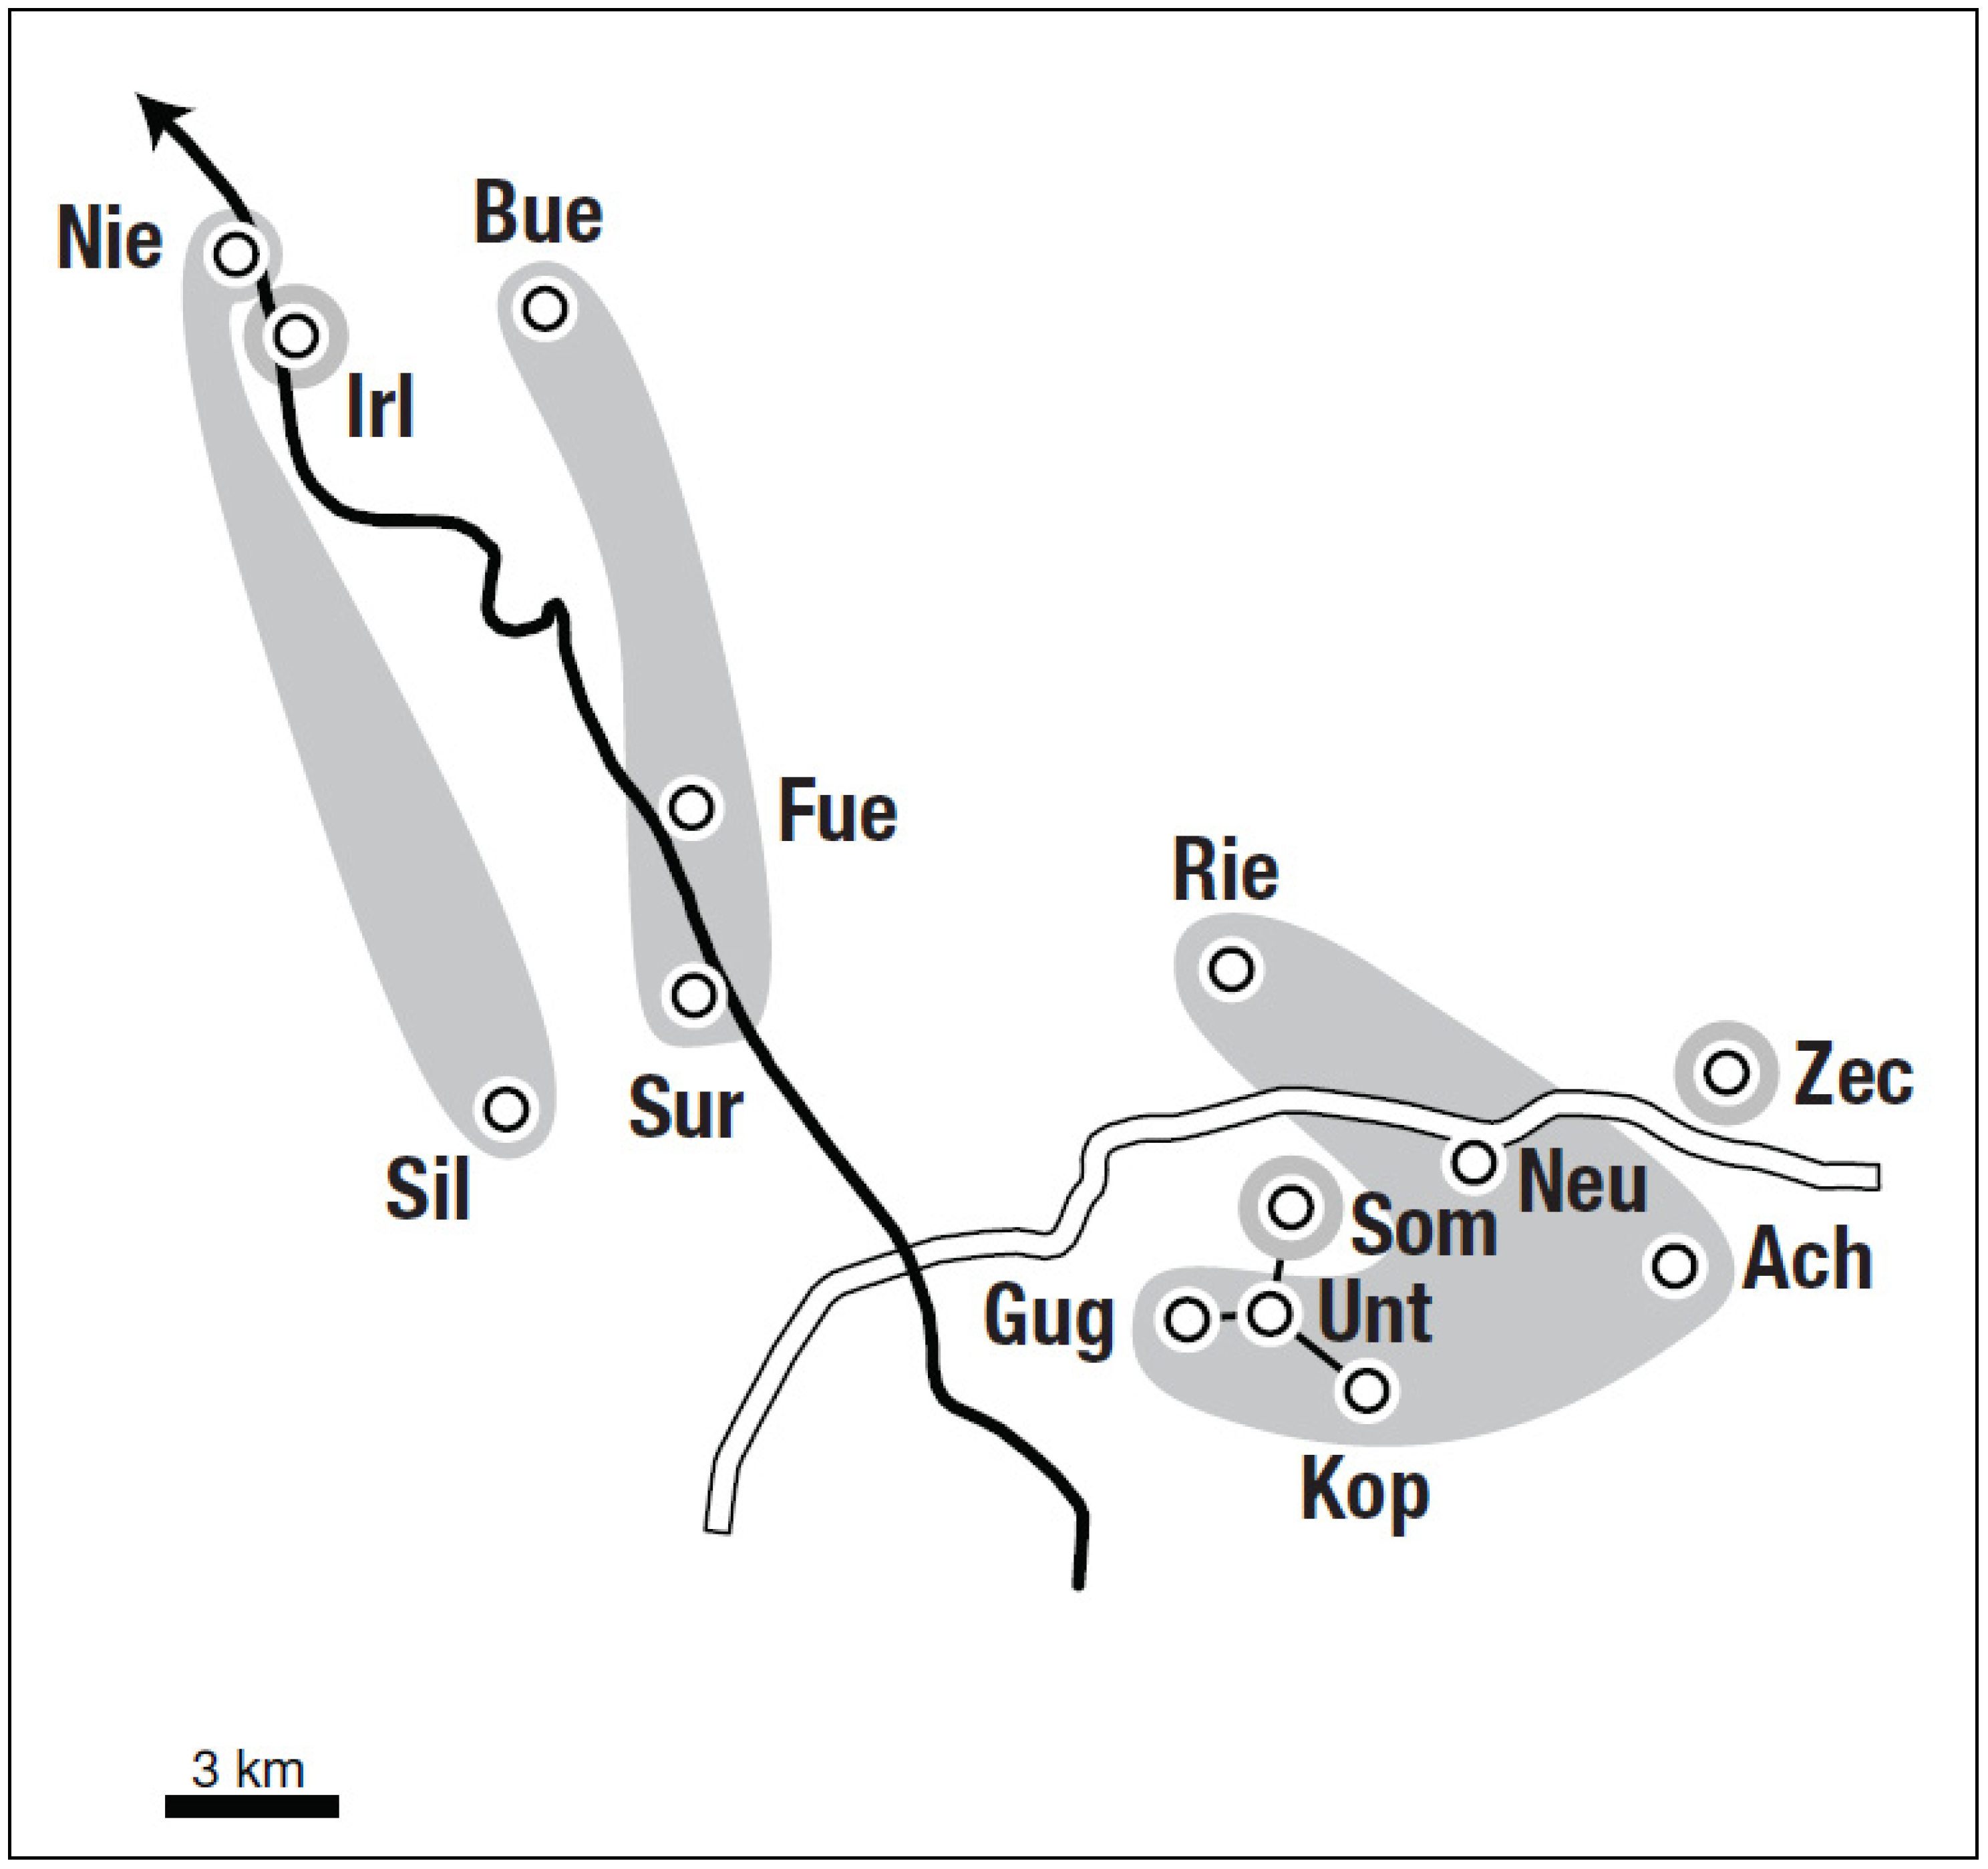
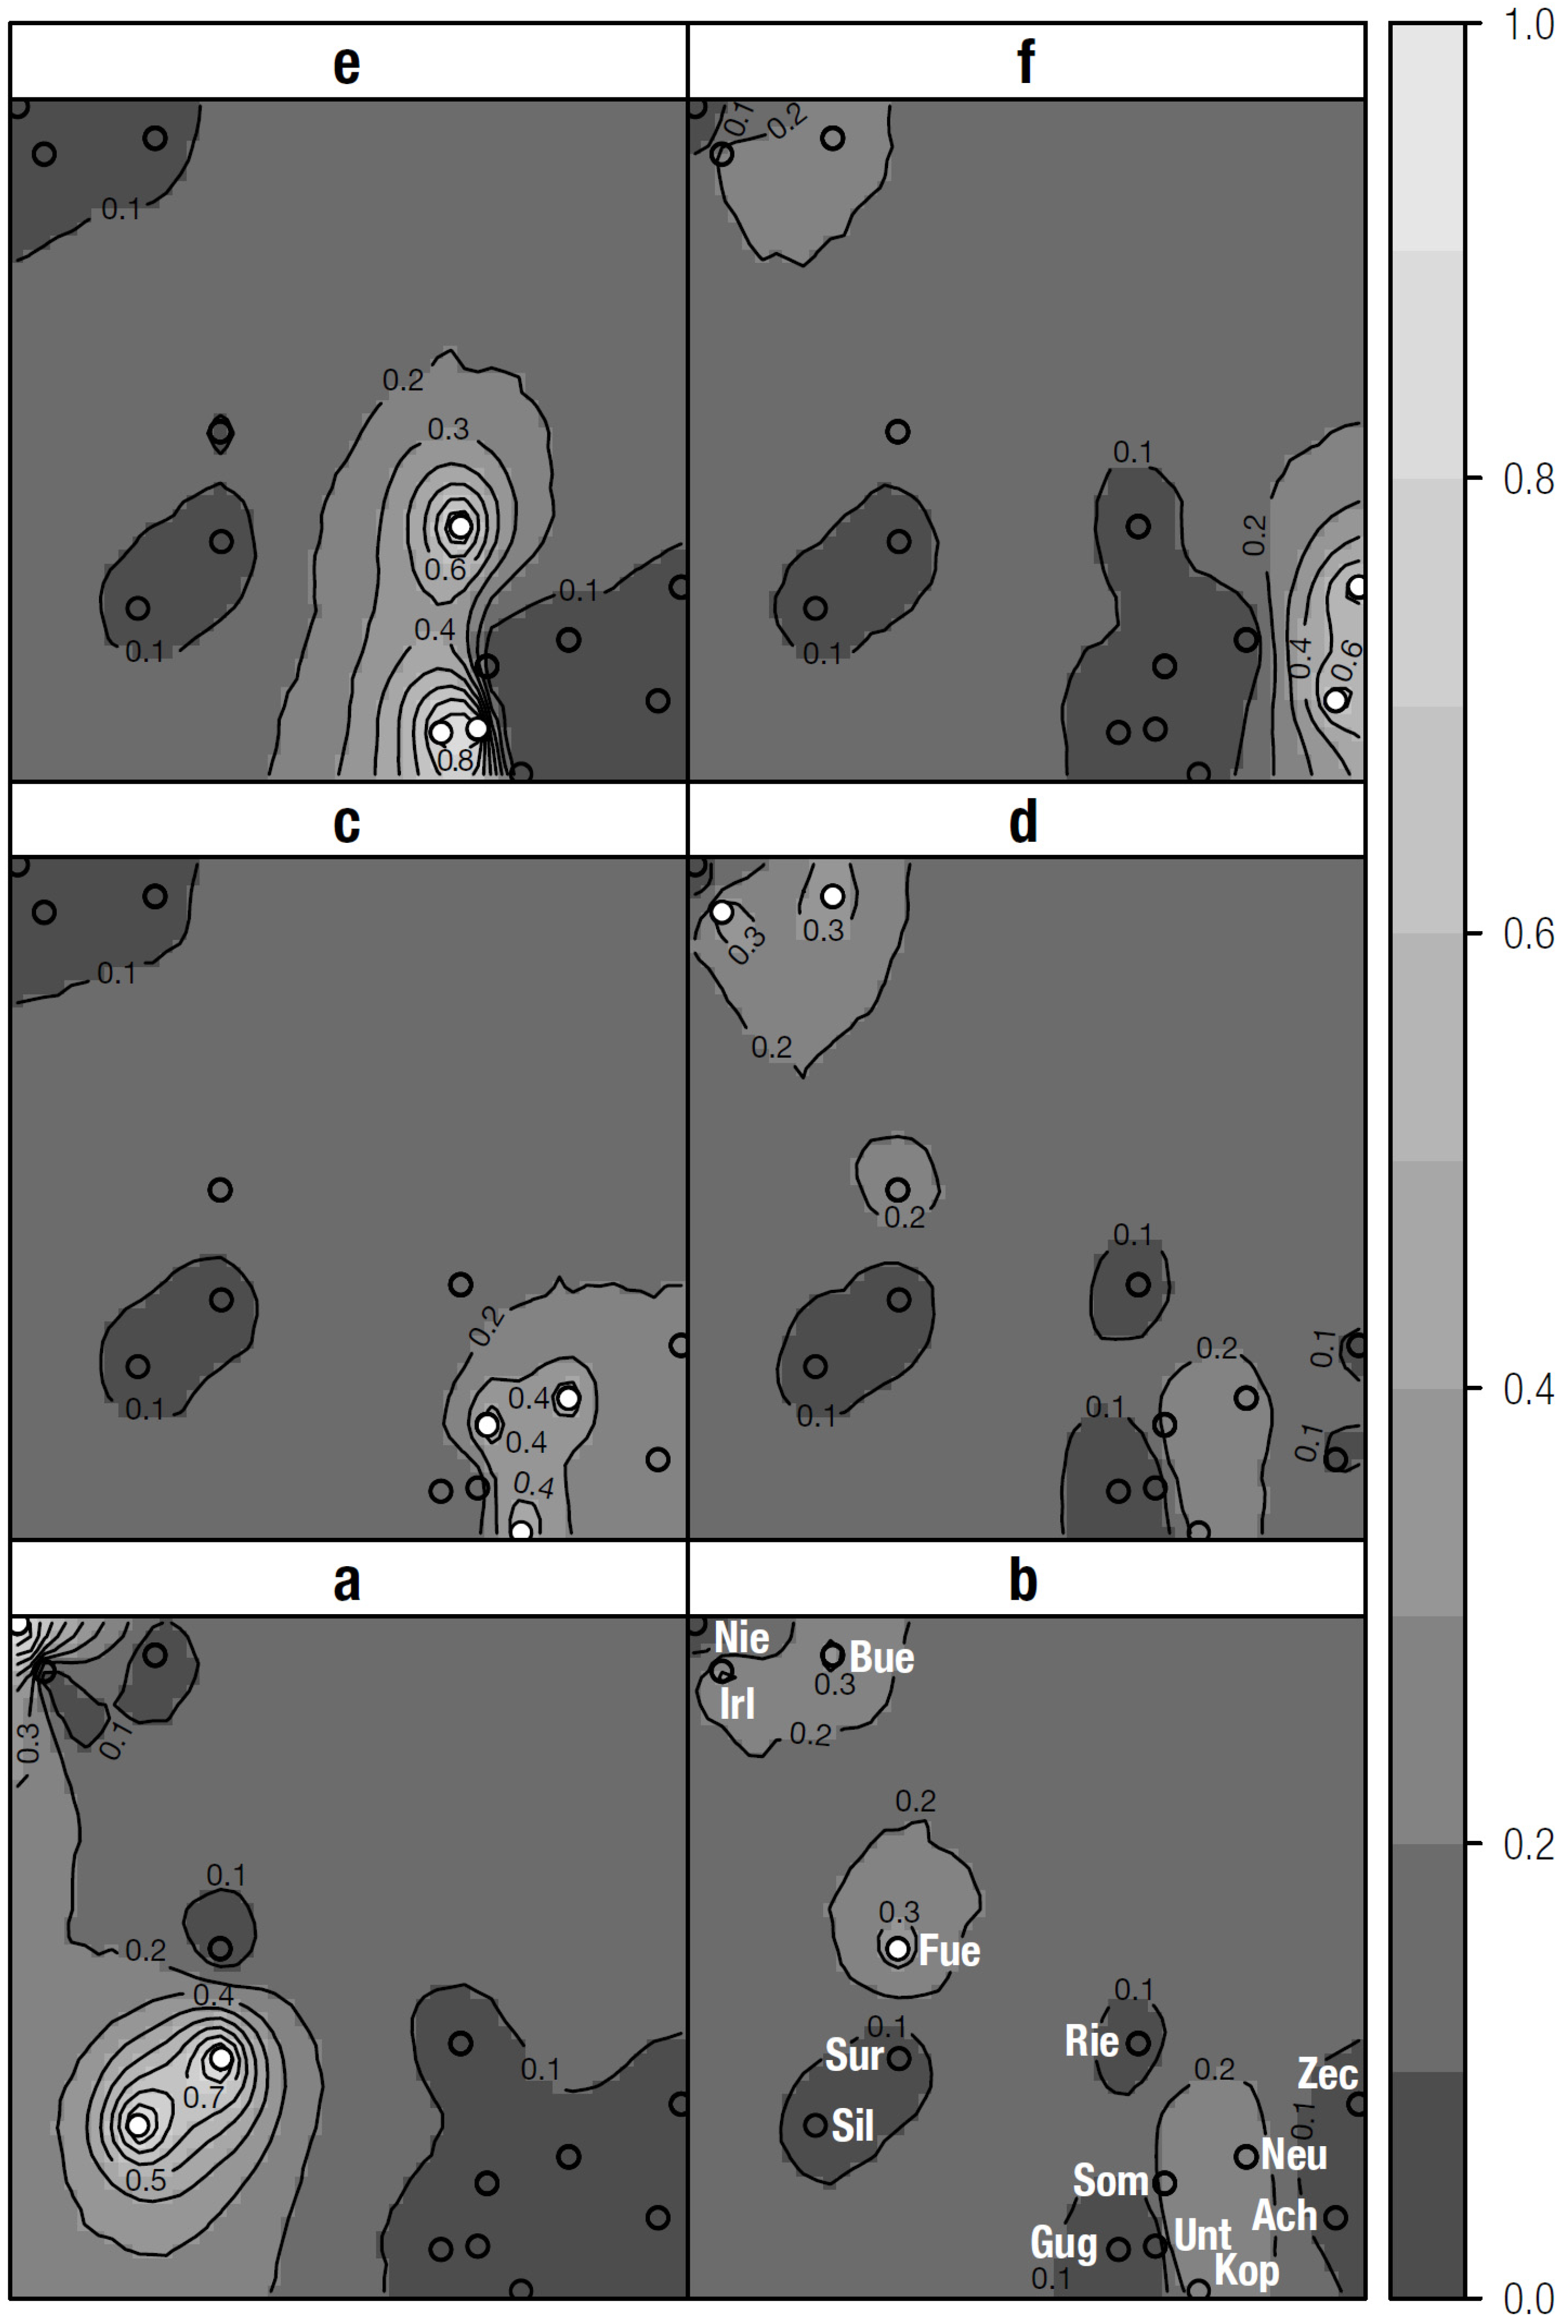
2.6. Spatial Patterns

To extract perceptually meaningful structure of the populations point pattern the relative neighbour graph (RNG) and the neighbourhood contiguity by distance graph (NCDG) were employed. The RNG [54] for a 2d point set is defined by the relation, x and y are neighbours if:
d(x,y) <= min(max(d(x,z),d(y,z))| z in S)
where d () is the distance, S is the set of points and z is an arbitrary point in S. The RNG restricts the definition of a neighbour in order to obtain small sets. It is a graph where all pairs of relative neighbours are connected by an edge. The NCDG graph identifies neighbours of region points by Euclidean distance between lower (greater than) and upper (less than or equal to) bounds. The lower bound was set to the minimal distance found for the point set. The upper bound was fixed to an ecological meaningful value representing a dispersal distance hypothesis. We used a lower bound of 3.000 m, since most studies about migrations of crested newts show annual maxima at about 1.000 m [55] and age at maturity is most probably 2−3 years [56]. Graphing and analysis were carried out using the R software framework [52].

3. Results and Discussion

3.1. Genetic Diversity within and between Populations

We found between seven and 18 alleles per locus and between 14 and 35 per population, as well as a total of 97 alleles over all loci. Significant deviations from Hardy-Weinberg equilibrium were observed within six populations (Sur, Bue, Rie, Som, Zec and Ach; Table 2). A significant deficit of heterozygotes calculated over all loci was found in the same populations except Som (Table 2).
Table 2. Average expected (He) and observed (Ho) heterozygosity, number of alleles, allelic richness, probability of Hardy-Weinberg disequilibrium (heterozygote deficit) per locality, average FIS per locality. Single asterisks (*) indicate significant, double asterisks (**) highly significant results; population Kop was not analysed.
LocalityHeHoNr. of allelesAllelic richnessHW (p)FIS
Nie0.480.48212.850.0940.152
Sil0.340.37142.000.4720.028
Sur0.590.49293.620.004**0.228**
Irl0.580.49222.910.865−0.060
Bue0.590.55203.400.02*0.061*
Fue0.550.58262.950.254−0.019
Rie0.570.5273.520.002**0.122**
Gug0.650.65352.930.927−0.188
Unt0.620.5343.130.503−0.006
Som0.550.54253.330.044*0.106
Neu0.630.51163.280.382−0.013
Zec0.630.42333.530.005*0.225**
Ach0.680.57213.750.001**0.255**
Loci Tcri-29 (p = 0.019) Tcri-32 (p < 0.001), Tcri-35 (p < 0.001) and Tcri-46 (p = 0.007) showed significant heterozygote deficit using pooled data from all populations. However, there was no population where more than two loci exhibit heterozygote deficit. Only the populations Rie (Tcri-13, Tcri-35), Zec (Tcri-35, Tcri-46), Bue (Tcri-32, Tcri-35), Fue (Tcri-32), Som (Tcri-32) and Ach (Tcri-35) revealed significant heterozygote deficit in specific loci. HE ranged between 0.34 (Sil) and 0.68 (Ach), while HO ranged between 0.37 (Sil) and 0.65 (Gug). In most populations average values of HO were lower compared to HE, but no evidence for the presence of null alleles in our data set was found. Allelic richness ranged between 2.00 (Sil) and 3.75 (Ach; Table 2).
Pairwise FST values ranged between 0.01 and 0.76 (0.21 across all loci) for pooled data and in most cases the differentiation was highly significant. For T. cristatus-like populations values ranged between 0.01 and 0.52. Only two Bavarian population pairs (Sil–Sur and Nie–Sur) showed no significant genetic differentiation. Values for T. carnifex-like populations ranged between 0.03 and 0.37, with two population pairs (Unt–Ach & Neu–Ach) being not significantly differentiated. The maximum geographical distance between these populations is 10.5 km. All values comparing population pairs from the two different groups were significantly differentiated (Table 3). The Mantel test for detecting isolation by distance showed a significant relationship between geographical and genetic distance (P = 0.01) in pooled data, whereas results for T. cristatus-like (P = 0.58) and T. carnifex-like populations (P = 0.68) measured separately were not significant.
The studied populations show considerable differentiation and limited gene flow. Generally genetic diversity of crested newt populations across Bavaria and Salzburg is low, most probably due to postglacial colonisation by only few founder individuals [29]. Values for expected (He) and observed (Ho) heterozygosity were comparatively high for all populations, but Sil. While average values of heterozygosity were slightly higher (He = 0.50–0.84) in Czech and Slovak populations of T. cristatus [57], similar results with microsatellites were obtained for T. cristatus populations in Western France [58] and Eastern Germany [59]. A study on a recovering metapopulation of the European tree frog (Hyla arborea), which was carried out in the Netherlands, in a nearly equal area according to size and anthropogenic influence, also showed heterozygosity values similar to our study with HE varying from 0.39 to 0.59 [60], while isolated and partially inbreeding H. arborea populations in Denmark showed slightly lower values ranging from 0.35 to 0.50 [8]. Expected heterozygosity was much lower (0.21–0.32) in depleted populations of the Italian agile frog (Rana latastei) on the very margin of its range in Switzerland [61]. The average allelic richness was comparably low in our study reaching from 2.00 in population Sil to 3.75 in population Ach. In Crested newt populations from Germany (1.92 to 5.11 per locus and population) and even for populations of the vulnerable endemic Mallorcan midwife toad (Alytes muletensis; 2.6 to 6.2), considerably higher values of allelic richness were calculated, using microsatellites [59,62].
In a previous study using cytb and microsatellite markers [29], hybrid individuals were detected in five (Nie, Irl, Rie, Som and Zec) out of 14 studied populations. Introgression was found in all populations, except Sil, Sur, Gug and Unt [29]. Significant heterozygote deficit (FIS) and deviations from HW equilibrium were found both in populations with and without hybrids. It could be supposed that if selection against heterozygotes acts in hybrid populations, it should affect more loci. According to these results, it seems that selection against heterozygotes (hybrids) is not the prevalent mechanism acting in studied populations. The presence of null alleles could not be detected as a cause for heterozygote deficit and lower Ho compared to He. An alternative explanation could be the Wahlund effect, meaning that spatially or chronologically isolated groups of individuals in between populations prevent a complete admixture of total populations. This effect has been at least taken into account as a cause of deviations from HWE in some studies on crested newts [59,63]. Nevertheless historical and sub-recent data show that the number of populations in this area was considerably higher only some decades ago with fairly low inter-pond distances [32].
Table 3. The pairwise measure of genetic differentiation (FST, lower triangle) and geographic distances (in km, upper triangle) between populations. These values were used in isolation by distance tests (see results). All FST-values are significant unless indicated with asterisks (*).
NieSilSurIrlBueFueRieGugUntSomNeuZecAch
Nie 17.6 17 2 6.2 14.1 24 28.1 29.2 28 30.1 33.4 34.7
Sil0.18 4.315.815.86.914.51415.615.5192423.2
Sur0.01*0.09* 15.113.83.610.611.61312.415.620.320
Irl0.330.520.16 4.91222.126.127.1262631.332.7
Bue0.110.100.060.25 10.118.723.424.422.924.727.629
Fue0.120.210.040.230.04 11.114.115.114.216.820.921.3
Rie0.360.450.280.270.250.33 6.96.94.869.910.5
Gug0.300.640.330.260.410.490.13 1.736.511.79.6
Unt0.480.610.360.300.330.420.100.04 2.24.910.17.9
Som0.430.540.290.420.300.260.230.370.36 3.797.6
Neu0.530.760.450.460.460.520.100.090.100.32 5.14.5
Zec0.510.740.420.420.410.430.210.100.150.210.13 3.9
Ach0.350.630.240.340.360.370.040.060.06*0.200.03*0.06
We could not detect a clear isolation by distance pattern in our analysis. Only pooled data from T. cristatus-like and T. carnifex-like populations showed significant results, which can be explained by the limited amount of introgression and gene flow on the edges of the hybrid zone and the loss of a central region due to disappearance of populations. However, it could also be influenced by the small number of sampled populations and sampled individuals per population. Pairwise FST-values between populations showed moderate to strong differentiation [20,43]. T. cristatus-like populations appear slightly more differentiated according to FST-values but it can be assumed that this result may be the consequence of them being on average further apart (Chapter 3.3, Figure 1). Population Irl shows the highest amount of differentiation, while the differences of the other populations on both sides of the river Salzach are only moderate. T. carnifex-like populations show comparatively high genetic homogeneity and are characterised by good concordance between spatial and genetic distance between populations, although FST-values in most instances are moderate. Only the populations Zec, and particularly Som, do not follow this trend. As Bayesian analyses partially generated similar results, the populations Irl, Som and to a certain extent Zec may be regarded as particularly isolated populations. Causes for this development are discussed below. We refrained from measuring the number of migrants per generation based on FST, due to low sample sizes and comparatively large distances. It can be supposed that non significant partial tests (T. cristatus-like and T. carnifex-like populations) indicate low statistical power of the regression-based approach when a limited number of populations is analyzed. For instance, a study on two salmonid species revealed no evidence for correlation between genetic and geographic distances using the Mantel test, analyzing ten or fifteen populations [64].

3.2. Spatial Genetic Structure (Bayesian Approach)

The Bayesian model-based clustering analysis implemented in the software Structure 2.0 in the first run supported a model with two genetic subpopulations based on our 14 sampled geographical locations. Though the model with K = 2 does not show the maximal Ln P (D) value (−2570.6)—the highest level was calculated for K = 7 (−2346.3)—the model was supported by the highest ΔK value (627.59) with Ln P (D) increasing only slightly at larger K values. All models with higher K-values showed inconsistent and heavily substructured results. Therefore K = 2 was selected as the best fit model [44,45,46]. A second run with individual analyses of the two groups showed no clear further substructure for T. carnifex-like populations (K = 1, ΔK = 131,76). However, in T. cristatus-like populations individuals from the locality Som formed a new subgroup, clearly separated from the other localities (K = 2, ΔK = 337,75). The results show a bipartition between formerly known T. cristatus-like and T. carnifex-like populations with the two exceptions Irl and Som (Table 4).
Table 4. Membership of surveyed populations to clusters assessed using three Bayesian methods; average q indicates the probability of populations being assigned to the clusters in structure analysis.
LocalityStructure run 1
Cluster (average q)
Structure run 2
Cluster (average q)
Baps clustersGeneland clusters
T. cristatus-Nie1 (0.992)1a (0.966)11
likeSil1 (0.991)1a (0.973)11
Sur1 (0.971)1a (0.901)21
Irl2 (0.857)2 (1.000)34
Bue1 (0.975)1a (0.890)24
Fue1 (0.988)1a (0.916)22
T. carnifex-Rie2 (0.882)2 (1.000)45
likeGug2 (0.985)2 (1.000)45
Unt2 (0.975)2 (1.000)45
Som1 (0.870)1b (0.954)53
Neu2 (0.972)2 (1.000)43
Kop2 (0.905)2 (1.000)43
Zec2 (0.814)2 (1.000)66
Ach2 (0.966)2 (1.000)46
The hierarchical analysis with Baps showed the most likely partition for six clusters out of 14 populations (posterior probability p = 0.866). One large cluster (C4) was composed of six T. carnifex-like populations. Two clusters consisted of T. cristatus-like populations with three (C2) and two (C1) populations. C2 showed a connection across the Salzach River. The populations Zec (C6), Irl (C3) and Som (C5) represented their own genetic units, the latter two being the populations assigned to the different taxa in the Structure analysis (Table 4, Figure 2). The second most likely partition also consisted of 6 clusters with the only difference of population Sur moving from C2 to C1, shaping a purely Bavarian cluster (posterior probability p = 0.068).
Figure 2. Neighbourhood contiguity by distance graph (NCDG) of sampled localities assuming upper bounds of 3.000 m, as well as genetic clusters (C1-C6) calculated by Baps (highlighted in grey, posterior probability p = 0.866); “Salzach” river (bold line), highway A1 (white line).
Diversity 02 00028 g002
In the first run, Geneland results strongly supported the existence of six population clusters. Further analyses using a fixed K of 6 were checked for consistency of results and allocations of clusters were based on the highest posterior probability values among the different outputs The six inferred clusters constitute a cline from north-west to south-east with posterior probabilities ranging between 0.3 and 0.8. No assignment of T. cristatus-like populations to mainly T. carnifex-like clusters and vice versa was observed. Nevertheless some comparably distant populations showed notable similarity (Table 4, Figure 3).
We obtained comparatively divergent results for the genetic structure of studied populations, which partially are reflected in corresponding pairwise FST-values. This scenario was also observed in other empirical studies comparing two [16,53] or three [18] different programs. While analyses with Baps and Geneland both indicated the presence of six clusters with partially different composition, Structure results differed considerably. One general statement was supported by all three programs. In this former hybrid zone with a currently low amount of admixed individuals [29], two large clusters, corresponding to T. cristatus-like and T. carnifex-like populations can be assigned, which have lost contact due to the loss of a large number of populations in between during the last decades [32].
Figure 3. Maps of posterior probabilities for clusters 1-6 (i.e., a-f) obtained by analysis with Geneland.
Diversity 02 00028 g003
All assignment probabilities in Structure analysis, averaged across all individuals of a sampled locality are above a desirable value of 0.8. However, the populations Irl and Som were assigned to different species than detected in a study using microsatellites and mtDNA [29], and Som even formed a distinct subgroup. Structure appears to be slightly less sensitive than the other two programs in this special case of two species and many more or less admixed populations. On the other hand Structure appears to perform weakly when number of loci or—as in our case—sample sizes is low [65]. Baps and Geneland indicated more genetically distinct groups of populations than Structure. The same outcome was reported by Rowe and Beebee [18] in their study on natterjack toads (Bufo calamita) in Great Britain. However, the opposite was observed in both tests with simulated [65] and empirical data [16], where Structure tended to overestimate K. In the latter study the most probable number of K was estimated using posterior probability Ln P (D) and not ΔK. Both Baps and Geneland analysis indicated three distinct groups for T. cristatus-like and T. carnifex-like populations, with only minor differences. Baps seems to be more appropriate to relate genetic with spatial structure than Structure [16], but reliably detects different gene pools only under very restricted migration [65], which might be the case for most populations in our study. The two populations Irl and Som, which were assigned to the different species group, here again appeared as independent clusters. This outcome is also congruent with the results of pairwise FST analysis, where the two populations show considerably strong differentiation from next neighbours, despite low spatial distance. Geneland is even integrating geographical data but sometimes creates “ghost” populations that do not correspond to any sampled localities [53]. While Baps generated one cluster which included one Bavarian (Sur) and two Austrian (Fue and Bue) populations, and one large cluster of six geographically close T. carnifex-like populations, Geneland results were similar to a cline from NW to SE, as observed in the former hybrid zone. Particularly in the centre of this former hybrid zone, posterior probabilities of assigned clusters were comparatively low. Comparing results of pairwise FST values and Bayesian analysis the results generated by Baps showed the highest concurrence.

3.3. Spatial Patterns

The relative neighbour graph (RNG) for our sampled localities (integrated in Figure 1) shows geographical distances of neighbouring localities ranging between 1.6 km and 4.9 km (mean = 3.2 km, median = 3.7 km). Six out of 14 distances are below 3.0 km, which is incorporated in the neighbourhood contiguity by distance graph (NCDG) shown in Figure 2. However, in two cases (Irl-Nie, Fue-Sur) distances are low but populations are separated by the river Salzach. According to this information all studied localities apart from the four T. carnifex-like localities (Gug, Unt, Kop and Som) are geographically isolated due to large distances. Average geographical distances between T. cristatus-like localities (12.6 km) are larger than between T. carnifex-localities (6.7 km).
While genetic analyses can provide an overview on sub-recent and to some extent contemporary developments of populations, spatial statistics show the effective situation in the field. In this study we focussed on geographical distances, being aware of the fact that for instance habitat structures or differences in altitude greatly contribute to the exchange of genetic information. Landscape genetics, the combination of genetic analysis, geographical and land use data (GIS-techniques) is an important field for future studies on small geographical scales [53,66,67]. In a study on negative effects of habitat fragmentation on tree frogs (Hyla arborea) in the Netherlands it was concluded, that the mean distance between occupied habitat patches must be <1 km for persistent amphibian populations, on the basis of their data and related studies dealing with amphibian species in Europe [7]. Studies on migration of crested newts show annual maxima of about 1 km [55]. However these data in most cases consider movements of adult individuals, while colonisation and dispersal most probably is achieved by juveniles, and knowledge on their migration distances, as well as causes of being adventurous rather than philopatric remain unclear. Initially occupied crested newt ponds are likely to persist if populations are larger than 40 females or lie within 0.5 km of a typical source pond [68].
All nearest neighbour-distances of studied populations in northern Salzburg and neighbouring Salzach valley in Bavaria are larger than these values with a minimum of 1.6 km. The majority even shows distances of 3 km and more. Without a systematic approach of enhancement measures these populations, which still show comparatively moderate genetic diversity, may become increasingly isolated and are at high extinction risk in the near future. The problem of population isolation is amplified due to low population sizes of 100-200 individuals [69], as well as the high number of roads and the increasing amount of traffic in this area. The direct negative effects of road density on amphibian species of low vagility have been shown in several exemplary studies. The probability for different European amphibian species of getting killed crossing a road with medium traffic load range from 34 to 61% [70]. Genetic studies on the depleting effects of urbanization and road density on ranid frogs [9,71], or general habitat fragmentation on tree frog populations [8] are examples for developments that might arrive at crested newt populations in Salzburg and Bavaria in the near future.

4. Conclusions

Because of the newts’ high level of legal protection and rarity in the study area in Austria, we decided to use adult individuals and non-destructive sampling methods. The use of adult individuals is obviously reflected by limited sample sizes, reducing the power of statistics on genetic diversity and differentiation within and between populations.
The answer to the question, which processes determine the genetic architecture of studied populations is complex. According to our data, the regulated and straightened river Salzach represents a migration barrier, which already is reflected in population structure. In the province of Salzburg, negative effects of the motorway or other high traffic roads can only be hypothetical. Although in some analyses, single populations appear distinct, no clear pattern can be detected. T. cristatus-like populations, which are located in proximity to lowland forests of the Salzach River also constitute one conservation unit, showing a generally strong differentiation according to FST and considerable distinctiveness of the population Irl according to Structure and Baps analyses. In Geneland the population Fue is forming a distinct cluster, however with low posterior probability. T. carnifex-populations are less differentiated, with exemption of the population Som and to some extent Zec (in Baps analysis). Only in Geneland analyses, these populations seem more distinct with clusters probably representing hybrid zone or colonisation history [29]. We assume that the loss of many populations and suitable habitat, as well as the resulting reduction of gene flow between populations have contributed most to the current population structure, whereas effects of the former hybrid zone are low. Additional analyses on the presence and effects of barriers, e.g., via landscape genetics would be important to further enhance and improve the significance of results.
For the prevention of a continuous loss of crested newt populations due to stochastic or anthropogenic processes and the associated genetic drift currently a species specific conservation action plan for crested newts in Salzburg is developed on the basis of our studies. An instructive case study on European tree frogs has shown that well aimed habitat enhancement measures, including the creation of new aquatic habitats as well as migration corridors can help genetically depleted and isolated populations to recover within two decades [60]. Nevertheless crested newts are less vagile and therefore on the one hand less affected by habitat fragmentation, but on the other hand more slowly in colonising new habitat patches. Important considerations for the development of habitat enhancement measures are first to use existing conservation units as source populations and start with measures in the vicinity of these populations, continuously trying to achieve large scale connections. Secondly GIS-approaches can be of great help for identifying potential sites for pond creation [72]. In this connection urbanization and road density must be taken in account due to barriers for migration and dispersal and for preventing habitat manipulation, such as introduction of allochthonous fish [73].

Acknowledgements

The authors want to express their gratitude to the Provincial Government of Salzburg, especially M. Jerabek, for support. M. Franzen & H.-J. Gruber provided samples from three localities in Bavaria. We also want to thank R. Rieder for technical help and J. Pialek and staff from Studenec for hospitality. M. Kyek, R. Fuchs, H. Ackerl and three anonymous referees gave valuable comments that greatly improved previous drafts of the manuscript and F. Webster provided help in terms of language style. Permits were granted by the Provincial Government of Salzburg (Nr. 21301-RI-548/9-2003). A.M. was funded by a grant from the University of Salzburg (Nr. 262/2005). P.M. was funded by the Grant Agency of the Czech Republic (project 206/01/0695) and the Grant Agency of the Slovak Republic VEGA (project 1/4332/07).

References

  1. Houlahan, J.E.; Findlay, C.S.; Schmidt, B.R.; Meyer, A.H.; Kuzmin, S.L. Quantitative evidence for global amphibian population declines. Nature 2000, 404, 752–755. [Google Scholar] [CrossRef] [PubMed]
  2. Stuart, S.N.; Chanson, J.S.; Cox, N.A.; Young, B.E.; Rodrigues, A.S.L.; Fischman, D.L.; Waller, R.W. Status and trends of amphibian declines and extinctions worldwide. Science 2004, 306, 1783–1786. [Google Scholar] [CrossRef] [PubMed]
  3. Beebee, T.J.C.; Griffiths, R.A. The amphibian decline crisis: a watershed for conservation biology? Biol. Conserv. 2005, 125, 271–285. [Google Scholar] [CrossRef]
  4. Beebee, T.J.C.; Wilkinson, J.W.; Buckley, J. Amphibian declines are not uniquely high amongst the vertebrates: trend determination and the British perspective. Diversity 2009, 1, 67–88. [Google Scholar] [CrossRef]
  5. Diamond, J.M. The present, past and future of human caused extinctions. Philos. T. Roy. Soc. B 1989, 325, 469–477. [Google Scholar] [CrossRef]
  6. Fahrig, L. Effects of habitat fragmentation on biodiversity. Annu. Rev. Ecol. Evo. S. 2003, 34, 487–515. [Google Scholar] [CrossRef]
  7. Vos, C.C.; Chardon, J.P. Effects of habitat fragmentation and road density on the distribution pattern of the moor frog Rana arvalis. J. Appl. Ecol. 1998, 35, 44–56. [Google Scholar] [CrossRef]
  8. Andersen, L.W.; Fog, K.; Damgaard, C. Habitat fragmentation causes bottlenecks and inbreeding in the European tree frog (Hyla arborea). P. R. Soc. B 2004, 271, 1293–1302. [Google Scholar] [CrossRef]
  9. Lesbarrères, D.; Primmer, C.R.; Lodé, T.; Merilä, J. The effects of 20 years of highway presence on the genetic structure of Rana dalmatina populations. Ecoscience 2006, 13, 531–538. [Google Scholar] [CrossRef]
  10. Blaustein, A.R.; Wake, D.B.; Sousa, W.P. Amphibian declines: judging stability, persistence, and susceptibility of populations to local and global extinctions. Conserv. Biol. 1994, 8, 60–71. [Google Scholar] [CrossRef]
  11. Marsh, D.M.; Trenham, P.C. Metapopulation dynamics and amphibian conservation. Conserv. Biol. 2001, 15, 40–49. [Google Scholar] [CrossRef]
  12. Jehle, R.; Sinsch, U. Wanderleistung und Orientierung von Amphibien: eine Übersicht. Zeitschrift für Feldherpetologie 2007, 14, 137–152. [Google Scholar]
  13. Alford, R.A.; Richards, S.J. Global amphibian declines: a problem in applied ecology. Annu. Rev. Ecol. Syst. 1999, 30, 133–165. [Google Scholar] [CrossRef]
  14. Smith, M.A.; Green, D.M. Dispersal and the metapopulation paradigm in amphibian ecology and conservation: are all amphibian populations metapopulations? Ecography 2005, 28, 110–128. [Google Scholar] [CrossRef]
  15. Scribner, K.T.; Arntzen, J.W.; Cruddace, N.; Oldham, R.S.; Burke, T. Environmental correlates of toad abundance and population genetic diversity. Biol. Conserv. 2001, 98, 201–210. [Google Scholar] [CrossRef]
  16. Jehle, R.; Burke, T.; Arntzen, J.W. Delineating fine-scale genetic units in amphibians: probing the primacy of ponds. Conserv. Genet. 2005, 6, 227–234. [Google Scholar] [CrossRef]
  17. Beebee, T.J.C. Conservation genetics of amphibians. Heredity 2005, 95, 423–427. [Google Scholar] [CrossRef] [PubMed]
  18. Rowe, G.; Beebee, T.J.C. Defining population boundaries: use of three Bayesian approaches with microsatellite data from British natterjack toads (Bufo calamita). Mol. Ecol. 2007, 16, 785–796. [Google Scholar] [CrossRef] [PubMed]
  19. Wright, S. The genetical structure of populations. Annals of Eugenics 1951, 15, 323–354. [Google Scholar] [CrossRef] [PubMed]
  20. Balloux, F.; Lugon-Moulin, N. The estimation of population differentiation with microsatellite markers. Mol. Ecol. 2002, 11, 155–165. [Google Scholar] [CrossRef] [PubMed]
  21. Manel, S.; Gaggiotti, O.E.; Waples, R.S. Assignment methods: matching biological questions with appropriate techniques. Trends. Ecol. Evol. 2005, 20, 136–142. [Google Scholar] [CrossRef] [PubMed]
  22. Goldstein, D.B.; Schlötterer, C. Microsatellites: evolution and applications; Oxford University Press: Oxford, UK, 1999. [Google Scholar]
  23. Jehle, R.; Arntzen, J.W. Microsatellite markers in amphibian conservation genetics. Herpetol. J. 2002, 12, 1–9. [Google Scholar]
  24. Arntzen, J.W. Triturus Cristatus Superspezies—Kammmolch-Artenkreis. In Handbuch der Reptilien und Amphibien Europas; Grossenbacher, K., Thiesmeier, B., Eds.; Aula-Verlag: Wiesbaden, Germany, 2003; Volume 4, pp. 422–486. [Google Scholar]
  25. Jehle, R.; Arntzen, J.W. Post-breeding migrations of newts (Triturus cristatus, T. marmoratus) with contrasting ecological requirements. J. Zool. 2000, 251, 297–306. [Google Scholar]
  26. Schabetsberger, R.; Jehle, R.; Maletzky, A.; Pesta, J.; Sztatecsny, M. Delineation of terrestrial reserves for amphibians based on post-breeding migration distances: a case study with Italian crested newts (Triturus c. carnifex) at high altitude. Biol. Conserv. 2004, 117, 95–104. [Google Scholar]
  27. Arntzen, J.W.; Espregueira Themudo, G.; Wielstra, B. The phylogeny of crested newts (Triturus cristatus superspecies): nuclear and mitochondrial genetic characters suggest a hard polytomy, in line with the paleogeography of the centre of origin. Contributions to Zoology 2007, 76, 261–278. [Google Scholar]
  28. Freytag, G.E. Über Triturus cristatus bei Salzburg (Amphibia: Caudata: Salamandridae). Salamandra 1978, 14, 45–46. [Google Scholar]
  29. Maletzky, A.; Mikulíček, P.; Franzen, M.; Goldschmid, A.; Gruber, H.-J.; Horak, A.; Kyek, M. Introgression and hybridization and introgression between two species of crested newts (Triturus cristatus and T. carnifex) along contact zones in Germany and Austria: morphological and molecular data. Herpetol. J. 2008, 18, 1–15. [Google Scholar]
  30. Arntzen, J.W.; Kuzmin, S.; Jehle, R.; Beebee, T.J.C.; Tarkhnishvili, D.; Ishchenko, V.; Ananjeva, N.; Orlov, N.; Tuniyev, B.; Denoël, M.; Nyström, P.; Anthony, B.; Schmidt, B.; Ogrodowczyk, A. Triturus cristatus. IUCN Red List of Threatened Species, IUCN 2009, Version 2009.2; 2008. Available online: www.iucnredlist.org (accessed on 14 December 2009).
  31. Romano, A.; Arntzen, J.W.; Denoël, M.; Jehle, R.; Andreone, F.; Anthony, B.; Schmidt, B.; Babik, W.; Schabetsberger, R.; Vogrin, M.; Puky, M.; Lymberakis, P.; Crnobrnja-Isailovic, J.; Ajtic, R.; Corti, C. Triturus carnifex. IUCN Red List of Threatened Species, IUCN 2009, Version 2009.2; 2008. Available online: www.iucnredlist.org (accessed on 14 December 2009). [Google Scholar]
  32. Maletzky, A.; Kyek, M.; Goldschmid, A. Monitoring status, habitat features and amphibian species richness of crested newt (Triturus cristatus superspecies) ponds at the edge of the species range (Salzburg, Austria). Ann. Limnol. – Int. J. Lim. 2007, 43, 107–115. [Google Scholar]
  33. Kyek, M.; Maletzky, A. Atlas und Rote Liste der Amphibien und Reptilien Salzburgs. Naturschutz-Beiträge 2006, 33, 1–240. [Google Scholar]
  34. Quantum GIS Development Team. GNU General Public License. 2009. Available online: http://qgis.osgeo.org (accessed on 14 December 2009).
  35. Pidancier, N.; Miquel, C.; Miaud, C. Buccal swabs as non-destructive tissue sampling method for DNA analysis in amphibians. Herpetol. J. 2003, 13, 175–178. [Google Scholar]
  36. Broquet, T.; Berset-Braendli, L.; Emaresi, G.; Fumagalli, L. Buccal swabs allow efficient and reliable microsatellite genotyping in amphibians. Conserv. Genet. 2007, 8, 509–511. [Google Scholar] [CrossRef]
  37. Krupa, A.P.; Jehle, R.; Dawson, D.; Gentle, L.A.; Gibbs, M.; Arntzen, J.W.; Burke, T. Microsatellite loci in the crested newt (Triturus cristatus), and their utility in other taxa. Conserv. Genet. 2001, 3, 87–89. [Google Scholar]
  38. Weir, B.S.; Cockerham, C.C. Estimating F-statistics for the analysis of population structure. Evolution 1984, 38, 1358–1370. [Google Scholar] [CrossRef]
  39. Raymond, M.; Rousset, F. An exact test for population differentiation. Evolution 1995, 49, 1280–1283. [Google Scholar] [CrossRef]
  40. Hardy, O.J.; Vekemans, X. SPAGeDi: a versatile computer program to analyse spatial genetic structure at the individual or population levels. Mol. Ecol. Notes 2002, 2, 618–620. [Google Scholar] [CrossRef]
  41. Goudet, J. FSTAT (version 1.2): a computer program to calculate F-statistics. J. Hered. 1995, 86, 485–486. [Google Scholar]
  42. Van Oosterhout, C.; Hutchinson, W.F.; Wills, D.P.M.; Shipley, P. MICRO-CHECKER: software for identifying and correcting genotyping errors in microsatellite data. Mol. Ecol. Notes 2004, 4, 535–538. [Google Scholar] [CrossRef]
  43. Wright, S. Evolution and the genetics of populations. Volume 4—Variability within and among natural populations; University of Chicago Press: Chicago, IL, USA, 1978. [Google Scholar]
  44. Sokal, R.R.; Rohlf, F.J. Biometry—The Principles and Practices of Statistics in Biological Research; WH Freeman: New York, NY, USA, 1995. [Google Scholar]
  45. Pritchard, J.K.; Stephens, M.; Donnelly, P. Inference of population structure using multilocus genotype data. Genetics 2000, 155, 945–959. [Google Scholar] [PubMed]
  46. Falush, D.; Stephens, M.; Pritchard, J.K. Inference of population structure using multilocus genotype data: linked loci and correlated allele frequencies. Genetics 2003, 164, 1567–1587. [Google Scholar] [PubMed]
  47. Evanno, G.; Regnault, S.; Goudet, J. Detecting the number of clusters of individuals using the software structure: a simulation study. Mol. Ecol. 2005, 14, 2611–2620. [Google Scholar] [CrossRef] [PubMed]
  48. Corander, J.; Waldmann, P.; Sillanpää, M.J. Bayesian analysis of genetic differentiation between populations. Genetics 2003, 163, 367–374. [Google Scholar] [PubMed]
  49. Corander, J.; Marttinen, P.; Mäntyniemi, S. Bayesian identification of stock mixtures from molecular marker data. Fish. Bull. 2006, 104, 550–558. [Google Scholar]
  50. Guillot, G.; Estoup, A.; Mortier, F.; Cosson, J.F. A spatial statistical model for landscape genetics. Genetics 2005, 170, 1261–1280. [Google Scholar] [CrossRef] [PubMed]
  51. Guillot, G.; Mortimer, F.; Estoup, A. Geneland: a computer program for landscape genetics. Mol. Ecol. Notes 2005, 5, 712–715. [Google Scholar] [CrossRef]
  52. R Development Core Team. R: A language and environment for statistical computing. R Foundation for Statistical Computing, Vienna, Austria. Available online: http://www.R-project.org (accessed on 14 December 2009).
  53. Coulon, A.; Guillot, G.; Cosson, J.-F.; Angibault, M.A.; Aulagnier, S.; Cargnelutti, B.; Galan, M.; Hewison, A.J.M. Genetic structure is influenced by landscape features: empirical evidence from a roe deer population. Mol. Ecol. 2006, 15, 1669–1679. [Google Scholar] [CrossRef] [PubMed]
  54. Toussaint, G.T. The relative neighborhood graph of a finite planar set. Pattern Recogn. 1980, 12, 261–268. [Google Scholar] [CrossRef]
  55. Kupfer, A. Wanderstrecken einzelner Kammmolche (Triturus cristatus) in einem Agrarlebensraum. Zeitschrift für Feldherpetologie 1998, 5, 238–242. [Google Scholar]
  56. Miaud, C.; Joly, P.; Castanet, J. Variation in age structures in a subdivided population of Triturus cristatus. Can. J. Zoolog. 1993, 71, 1874–1879. [Google Scholar] [CrossRef]
  57. Mikulíček, P. Hybridization and genetic differentiation of the crested newts (triturus cristatus superspecies) in central europe—analysis of nuclear markers. PhD thesis, University of Prague, Czech Republic, 2005. [Google Scholar]
  58. Jehle, R.; Arntzen, J.W.; Burke, T.; Krupa, A.P.; Hödl, W. The annual number of breeding adults and the effective population size of syntopic newts (Triturus cristatus, T. marmoratus). Mol. Ecol. 2001, 10, 839–850. [Google Scholar]
  59. Meyer, S.; Grosse, W.-R. Populationsgröße, Altersstruktur und genetische Diversität einer Metapopulation des Kammmolches (Triturus cristatus) in der Kulturlandschaft Sachsen-Anhalts. Zeitschrift für Feldherpetologie 2007, 14, 9–24. [Google Scholar]
  60. Arens, P.; Bugter, R.; van´t Westende, W.; Zolliner, R.; Stronks, J.; Vos, C.C.; Smulders, M.J.M. Microsatellite variation and population structure of a recovering Tree frog (Hyla arborea L.) metapopulation. Conserv. Genet. 2006, 7, 825–834. [Google Scholar]
  61. Garner, T.W.J.; Angelone, S.; Pearman, P.B. Genetic depletion in Swiss populations of Rana latastei: conservation implications. Biol. Conserv. 2003, 114, 371–376. [Google Scholar] [CrossRef]
  62. Kraaijeveld-Smit, F.J.L.; Beebee, T.J.C.; Griffiths, R.A.; Moore, R.D.; Schley, L. Low gene flow but high genetic diversity in the threatened Mallorcan midwife toad Alytes muletensis. Mol. Ecol. 2005, 14, 3307–3315. [Google Scholar] [CrossRef] [PubMed]
  63. Kalezić, M.L.; Hedgecock, D. Genetic variation and differentiation of three common European newts (Triturus) in Yugoslavia. Brit. J. Herpetol. 1980, 6, 49–57. [Google Scholar]
  64. Castric, V.; Bernatchez, L. Individual assignment test reveals differential restriction to dispersal between two salmonids despite no increase of genetic differences with distance. Mol. Ecol. 2004, 13, 1299–1312. [Google Scholar] [CrossRef] [PubMed]
  65. Waples, R.S.; Gaggiotti, O. What is a population? An empirical evaluation of some genetic methods for identifying the number of gene pools and their degree of connectivity. Mol. Ecol. 2006, 15, 1419–1439. [Google Scholar] [CrossRef] [PubMed]
  66. Stevens, V.M.; Verkenne, C.; Vandewoestijne, S.; Wesselingh, R.A.; Baguette, M. Gene flow and functional connectivity in the natterjack toad. Mol. Ecol. 2006, 15, 2333–2344. [Google Scholar] [CrossRef] [PubMed]
  67. Manel, S.; Segelbacher, G. Perspectives and challenges in landscape genetics. Mol. Ecol. 2009, 18, 1821–1822. [Google Scholar] [CrossRef] [PubMed]
  68. Halley, J.M.; Oldham, R.S.; Arntzen, J.W. Predicting the persistence of amphibian populations with the help of a spatial model. J. Appl. Ecol. 1996, 33, 455–470. [Google Scholar] [CrossRef]
  69. Maletzky, A.; Goldschmid, A.; Kyek, M. Crested newt (Triturus cristatus superspecies) populations in Salzburg, Austria, their distribution, size and conservation status. Herpetozoa 2008, 20, 145–163. [Google Scholar]
  70. Hels, T.; Buchwald, E. The effect of road kills on amphibian populations. Biol. Conserv. 2001, 99, 331–340. [Google Scholar] [CrossRef]
  71. Hitchings, S.P.; Beebee, T.J.C. Genetic substructuring as a result of barriers to gene flow in urban Rana temporaria (common frog) populations: implications for biodiversity conservation. Heredity 1997, 79, 117–127. [Google Scholar] [CrossRef] [PubMed]
  72. Pellet, J.; Guisan, A.; Perrin, N. A concentric analysis of the impact of urbanization on the threatened European tree frog in an agricultural landscape. Conserv. Biol. 2004, 18, 1599–1606. [Google Scholar] [CrossRef]
  73. Williams, P.; Biggs, J.; Whitfield, M.; Thorne, A.; Bryant, S.; Fox, G.; Nicolet, P. The Pond Book: a Guide to the Management and Creation of Ponds; Ponds Conservation Trust: Oxford, England, 1999. [Google Scholar]

