Article

Cross-Life Stage Effects of Aquatic Larval Density and Terrestrial Moisture on Growth and Corticosterone in the Spotted Salamander

by
Julie F. Charbonnier
1,*,
Jacquelyn Pearlmutter
2,
James R. Vonesh
1,
Caitlin R. Gabor
3,
Zachery R. Forsburg
3 and
Kristine L. Grayson
2
1
Department of Biology, Virginia Commonwealth University, Richmond, VA 23284, USA
2
Department of Biology, University of Richmond, Richmond, VA 23173, USA
3
Department of Biology, Texas State University, San Marcos, TX 78666, USA
*
Author to whom correspondence should be addressed.
Diversity 2018, 10(3), 68; https://doi.org/10.3390/d10030068
Submission received: 5 June 2018 / Revised: 16 July 2018 / Accepted: 17 July 2018 / Published: 19 July 2018
(This article belongs to the Special Issue Conservation and Ecology of Amphibians)

Abstract

:
For organisms with complex life cycles, conditions experienced during early life stages may constrain later growth and survival. Conversely, compensatory mechanisms may attenuate negative effects from early life stages. We used the spotted salamander, Ambystoma maculatum, to test how aquatic larval density and terrestrial moisture influence juvenile growth, food intake, evaporative water loss and water reuptake rates, and corticosterone levels. We conducted an outdoor mesocosm experiment to manipulate larval density and transferred metamorphosed salamanders into low and high terrestrial moisture treatments in laboratory terrariums. After the larval stage, high-density salamanders were significantly smaller and had higher corticosterone release rates than those from low-density treatments. Salamanders in the low terrestrial moisture treatment consumed fewer roaches, had lower mass-specific growth rates, higher water reuptake, and higher corticosterone release rates than salamanders in high terrestrial moisture treatments. Across moisture treatments, smaller salamanders had higher mass-specific growth rates than larger salamanders. Our results suggest that salamanders can partially compensate for competition in the larval aquatic habitat with increased growth as juveniles, but this response is dependent on terrestrial habitat quality. Thus, the persistence of early life stage effects can be an important, yet context-dependent, component of amphibian life cycles.

1. Introduction

Organisms with complex life cycles pass through ecologically distinct stages during ontogeny and often relocate to new habitats during life history switch points [1]. Early ecological theory predicted that life history switch points allow modularity and independence across life stages by fundamentally remodeling organisms [1,2]. However, there is overwhelming evidence that life stages are interdependent and that variation in environmental quality experienced early in life can have a lasting impact on future performance of organisms [3,4,5,6]. These cross-life stage effects on phenotypes of later life stages are a type of developmental plasticity [7].
While numerous studies have documented cross-life stage effects across taxa, fewer have addressed how these effects may interact with conditions experienced in later life stages [5,8]. The impacts of early life stages on subsequent vital rates may be dependent on the quality of subsequent environments [9]. Environmental conditions in later life stages may erase or exacerbate cross-life stage effects on developmental traits through subsequent compensatory growth or differential allocation [10,11,12]. However, consequences from early life history may constrain an organism’s ability to exhibit such compensatory mechanisms. Organisms that experience low quality environments or stressors early in life can be more susceptible to subsequent variation in environmental quality [13,14]. Quantifying how conditions in early and later life stages interact to shape organismal traits is critical for understanding the importance of cross-life stage effects in diverse environmental contexts.
Amphibians are ideal model organisms for studying cross-life stage effects, as they are highly sensitive to environmental change and their growth and development rates are flexible, allowing them to respond to both abiotic and biotic stressors in their environments [7,15,16,17]. One of the most well-studied environmental factors for larval amphibians is intraspecific competition [18,19,20]. Size is dependent on density in most species of amphibians and is hypothesized to be positively related to survival because smaller metamorphs may have reduced locomotive performance, reduced fat bodies, and be more susceptible to desiccation [21,22,23,24].
Smaller body size may be particularly disadvantageous in dry terrestrial conditions as the risk of desiccation is higher. This is especially true for terrestrial salamanders because they have an elongated body resulting in a higher surface area ratio and can desiccate quickly [25]. Studies show that activity levels and feeding success are higher in moist environments and after rainfall events and decrease during dry periods [26,27]; however, these studies do not account for differences in prey type or abundance in moist and dry environments. Additionally, a large body of literature suggests that reduced survival and growth of multiple amphibian species in clear-cut forests are driven by low moisture levels, particularly when suitable refugia are missing [28,29], as clear-cutting influences the number of suitable refugia and prey items available. In low moisture environments, salamanders may spend more time in refugia to avoid desiccation, thus reducing feeding, especially for small individuals which may desiccate more quickly [25]. One hypothesis is that reduced moisture levels force animals to stay in their burrows and drain their fat reserves, diminishing energy available for growth. If small salamanders desiccate more quickly and are forced to forgo feeding during dry conditions, they may be more adversely affected by reduced soil moisture than larger individuals. Thus, the ability to cope with terrestrial moisture stress may be dependent on early life history conditions, specifically those which reduce initial size at metamorphosis.
Measuring the physiological mechanisms underlining growth and behavioral responses to environmental conditions is crucial for understanding organismal responses to stressors. The hypothalamus–pituitary–interrenal (HPI) axis [30] (homolog of the hypothalamus–pituitary–adrenal axis) responds to environmental stressors by releasing glucocorticoids that can aid in adaptive behavioral responses to environmental change [31,32]. Elevation of glucocorticoids early in life can alter the development of the HPI axis [33,34]. Corticosterone (CORT), the main glucocorticoid in amphibians, helps maintain homeostasis and facilitates adaptive responses to short- and long-term environmental stress [31]. Under chronic stress, elevated CORT can reduce mass and lipid stores, resulting in direct fitness consequences [35]. CORT varies in response to environmental challenges such as competition (density [36]), temperature variation [37,38], food availability [39,40], predation pressure [41,42], social environment [43,44], and anthropogenic disturbances [45,46]. Despite its importance to a wide variety of taxa, and the potential for climate change to substantially alter global patterns of precipitation [47,48], the effects of terrestrial moisture availability on CORT has been less studied [49].
Our objectives were to test how the effects of stress in the larval environment (higher conspecific density) would influence the response to terrestrial environmental stress (reduced terrestrial moisture). We used the spotted salamander, Ambystoma maculatum, a species that utilizes terrestrial burrows during the juvenile phase. Specifically, we tested how larval density and juvenile terrestrial moisture influence growth, food consumption, evaporative water loss and rehydration rates, and CORT five months after metamorphosis (Figure 1). Glennemeier and Denver [36] found that plasma CORT increased when Rana pipiens tadpoles were reared at higher densities or reduced food. We hypothesized that early life experience would affect CORT release rates and growth in later life stages, with smaller salamanders from high larval density treatments being more adversely affected by dry conditions because of their higher rates of water loss and initially higher CORT release rates. Across density treatments, we predicted that low moisture levels would be associated with increased CORT release rates and reduced growth rates [35]. Our study examines the cross-life stage effects of environmental stress on behavioral and physiological responses in an iconic salamander.

2. Materials and Methods
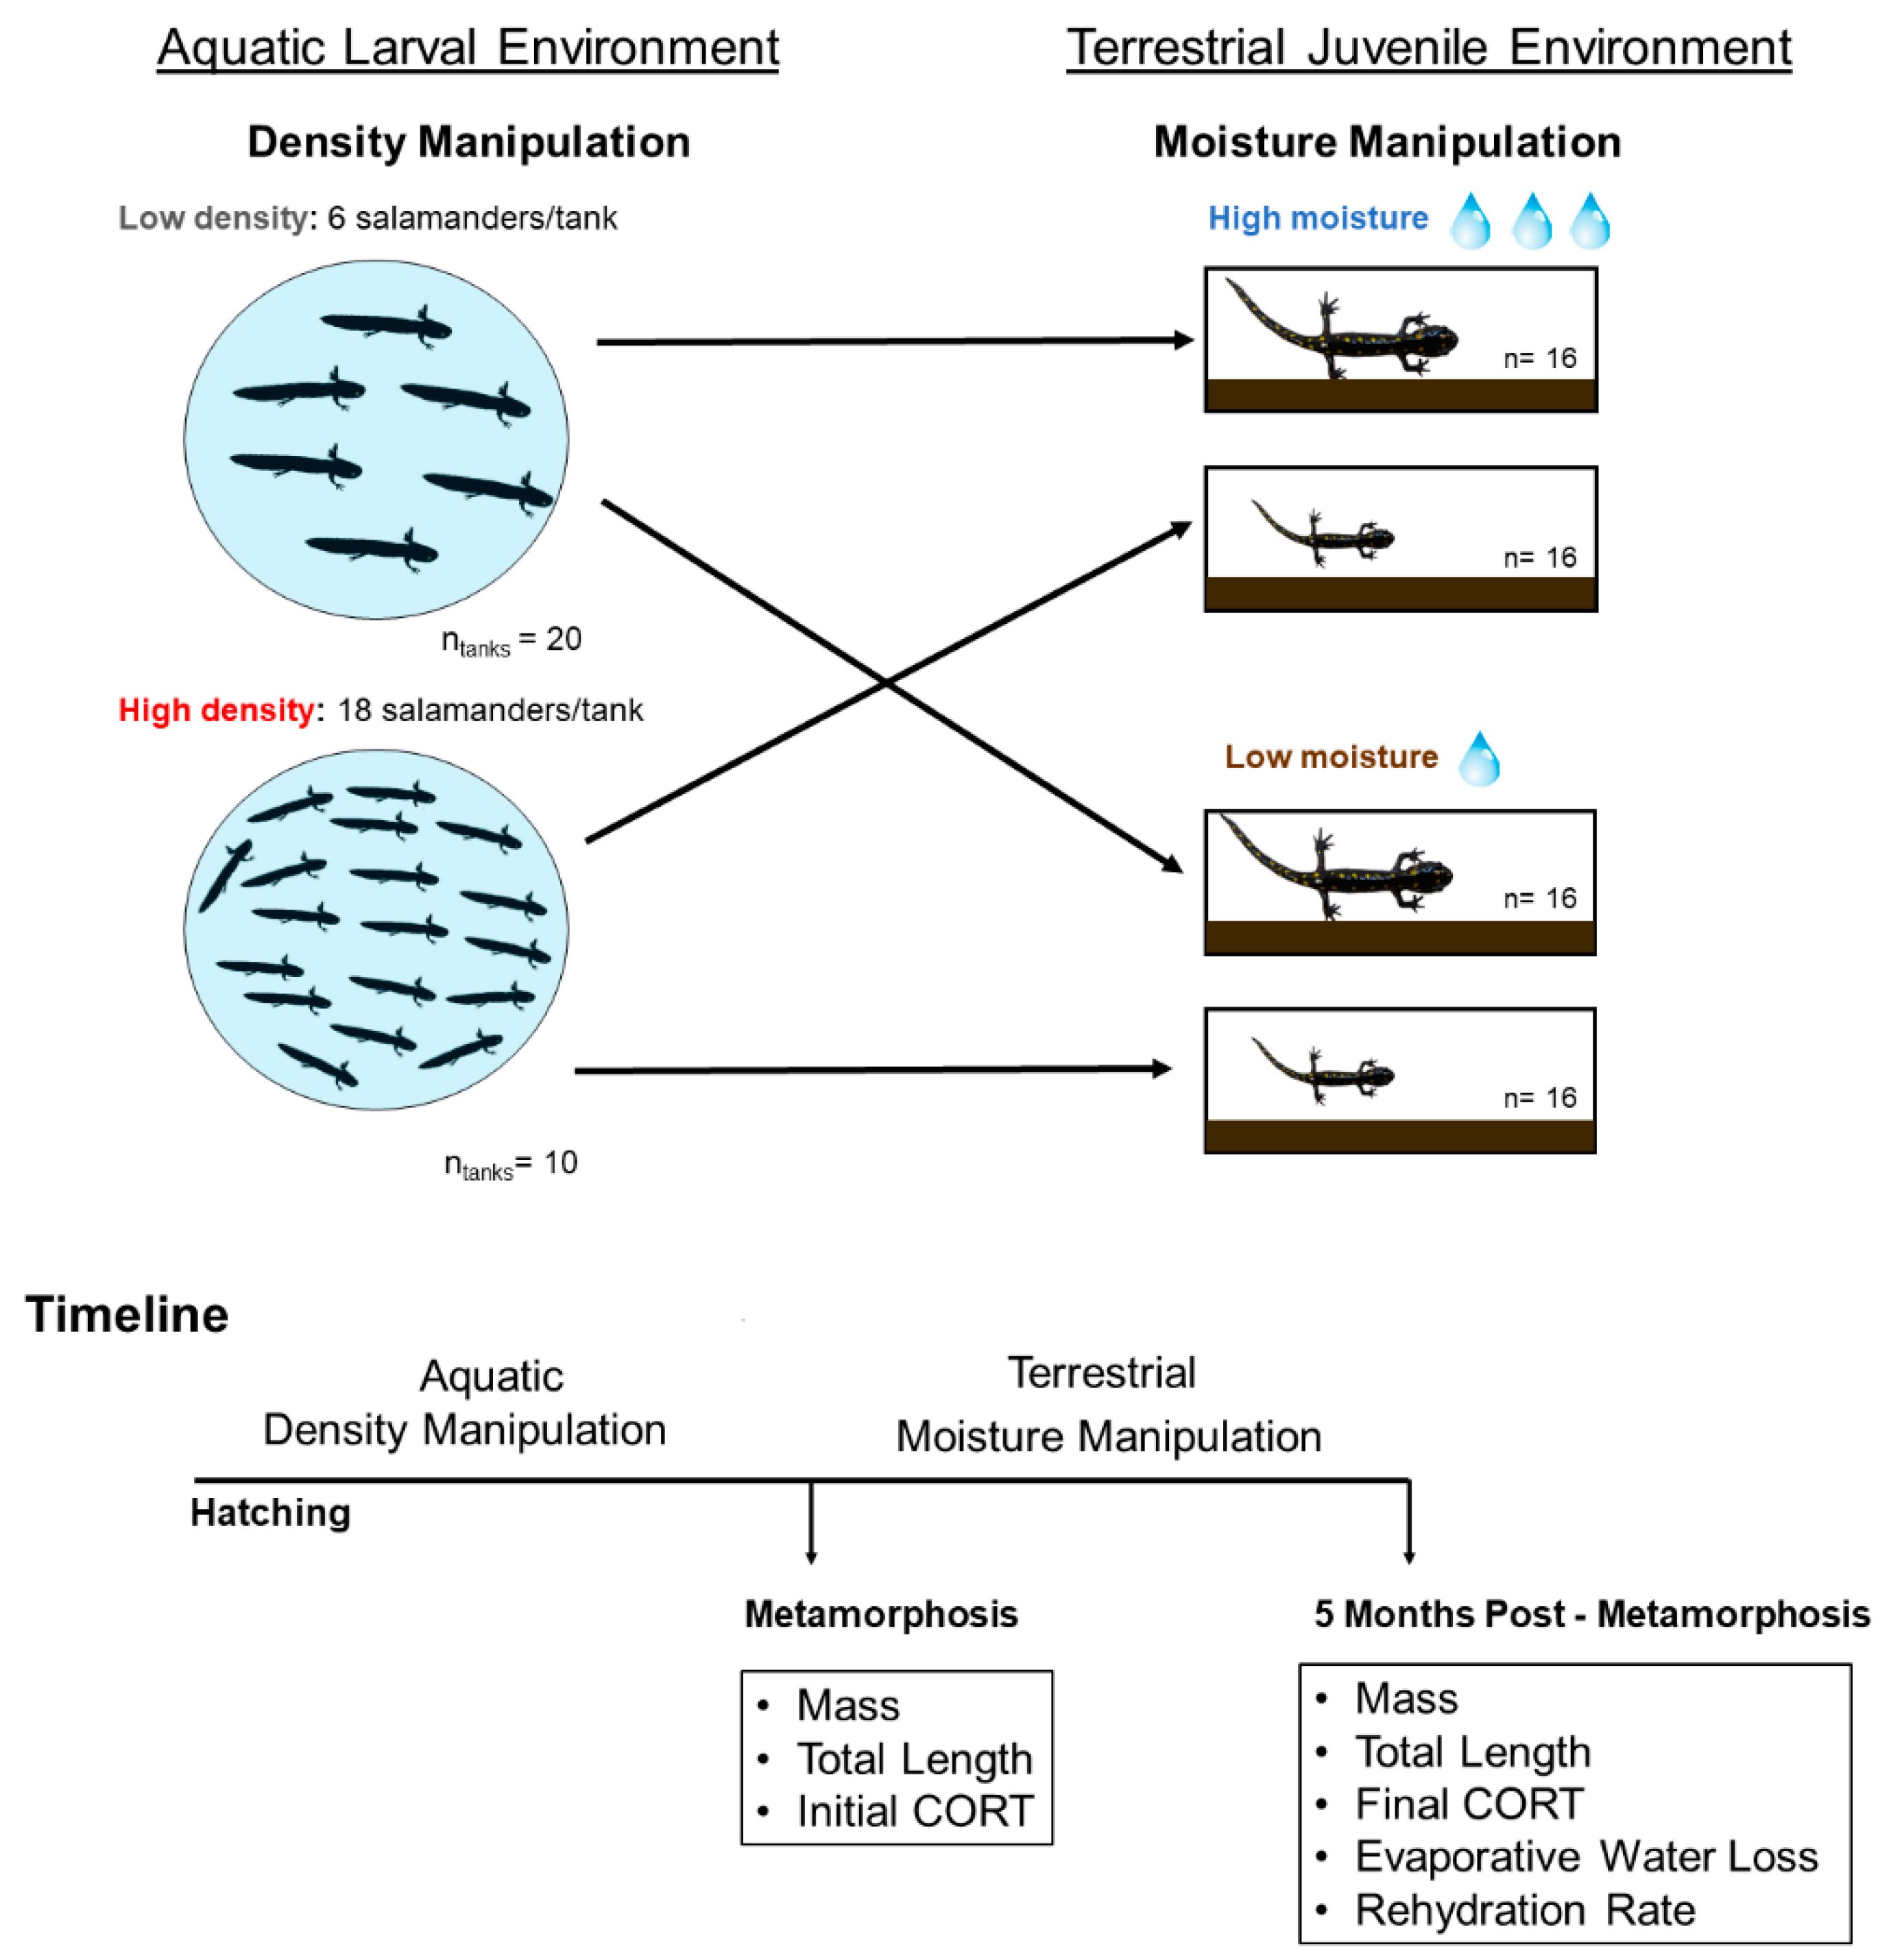
2.1. Study System

Our study species, the spotted salamander (A. maculatum, Family: Ambystomatidae), is found throughout the East Coast of the United States and is locally abundant at our study site. This well-studied species serves as an important indicator of forest and wetland health throughout its range. Females can deposit multiple egg masses on submerged stems in clumps during the spring, which hatch in 40–60 days [50,51,52,53]. Aquatic larvae develop in vernal pools and wetlands for two to five months and emerge from their aquatic habitat after metamorphosis [17]. As terrestrial juveniles and adults, salamanders are fossorial for the majority of the year and utilize subterranean burrows, except when feeding on the surface or during breeding migrations [54,55].

2.2. Larval Density Manipulation

The larval density manipulation portion of this study was conducted at Virginia Commonwealth University (VCU) Rice Rivers Center in Charles City County, Virginia (77°12′30.5” W, 37°19′56.32” N). Between March 2016 and July 2016, we conducted an outdoor mesocosm experiment where we manipulated larval density (Figure 1). We created semi-natural mesocosms on 30 March 2016 by filling 1136 L Rubbermaid tanks (1.7 m diameter, 0.64 m depth) with water from the James River and inoculating them with 2 L of concentrated zooplankton from nearby vernal pools and 2 kg of dry, local leaf litter [56]. The inoculation water was thoroughly mixed before being added to the aquatic tanks. We arranged the mesocosms in three rows of seven at a forest edge and covered them with black insect screen mesh to prevent predatory insects from entering the mesocosms. We collected ten egg masses from vernal pools in the VCU Rice Rivers Center on 23 March 2016. We kept eggs masses in 10 L buckets with vernal pool water until hatching, after which we haphazardly mixed larvae from all egg masses together to minimize egg mass effects. We haphazardly added larvae to tanks on 27 April 2016. Animal handling procedures were reviewed and approved by the VCU Institutional Animal Care and Use Committee (protocol number AD10000450, approved 03/2016).
We reared larvae in two experimental densities: low density (6 larvae per tank, 0.006 larvae/L) and high density (18 larvae per tank, 0.018 larvae/L). We simulated low- and high-density treatments based on field estimates of densities reported in the literature (0.012 larvae/L [57], 0.012–0.036 larvae/L [56]) and the range of what larvae would experience in natural field settings (0.002–0.08 larvae/L [58]). High-density treatments were replicated 10 times and low-density treatments were replicated 20 times for a total of 420 larvae distributed across 30 tanks. Density treatments and larvae were randomly assigned to aquatic tanks.
We monitored aquatic tanks weekly and added 1 L of concentrated zooplankton (3 L of vernal pool water poured through a 80-µm plankton net for each liter of water) to the tanks every other week [56]. For the purpose of this experiment, both low- and high-density aquatic tanks received the same amount of food, since we were interested in the multiple consequences of density such as changes in food abundance and interference competition. Once we observed salamanders with receding gills, we checked tanks daily. We collected larvae every other day and transported them in 1.89 L plastic containers with a wet paper towel to the animal facility at the University of Richmond. We weighed (±0.001 g) and photographed salamanders and recorded larval duration (date entered tank − date of metamorphosis). Salamanders from both experiments were measured digitally from snout to the tip of the tail (total length) using ImageJ [59].
A subset of metamorphosed salamanders (N = 64), 32 from each larval density treatment, were randomly selected for the terrestrial portion of the experiment (Figure 1). For this subset of 64 salamanders, we collected water-borne hormones for CORT analysis on 25 July 2016. We placed each salamander individually in 40 mL of reverse osmosis (RO) water in a petri dish (100 × 15 mm) for 1 h (following [60]). We wore gloves throughout this collection procedure and petri dishes were cleaned with 95% ethanol and rinsed with RO water before use. All sampling events were scheduled between 9:00 and 13:00 h to avoid circadian fluctuations of CORT [61]. After 1 h, we lifted the salamander out of the water sample and returned it to its temporary container. We poured the water sample from each petri dish into a labelled Falcon 50 mL tube, and immediately stored all samples in a −20 °C freezer [62]. We define this measurement of CORT as “Initial CORT”.

2.3. Soil Moisture Manipulation

The juvenile portion of this study took place at the University of Richmond. For this portion of the experiment, animal handling procedures were reviewed and approved by the University of Richmond’s Institutional Animal Care and Use Committee (protocol number 16-05-001, approved 05/2016). Salamanders were held in an ambient temperature laboratory. Metamorphs were held in 1.89 L temporary containers with a wet paper towel and fed three Dubia roaches (Blaptica dubia) once a week until the beginning of the experiment. Temporary containers were cleaned three times per week. This interim period took place until we had a sufficient number of metamorphs from both larval density treatments to begin the experiment (duration for low density = 43.9 days ± 6.0, high density = 39.5 days ± 8.4, x ¯ ± SD). All metamorphs were fed at least once before entering the next experimental stage.
Experimental terrariums consisted of 5.68 L rectangular Sterilite® clear boxes (35.9 cm × 20 cm × 12.4 cm) with a 26 cm × 10 cm top cut out and covered with black insect screen mesh for air flow. We dried organic top soil (Black Kow®, pH = 7) for 48 h at 100 °C and 2.3 kg of dried dirt (~5.7 cm deep) was added to each box. On one end of the box we created a tubular burrow (7.62 cm long) made of black insect screen mesh (7.6 × 2.3 cm mesh). Terrariums also contained a plastic feeding dish (44 mL) in which we added Dubia roaches as prey [typical individual roach mass = 0.02788 g ± 0.008 ( x ¯ ± SE, N = 20)]. Dubia roaches were raised in the laboratory and fed JK’s Dubia Diet.
To determine the effects of larval density and terrestrial moisture on salamander growth, we conducted a 2 × 2 factorial experiment where we assigned high- and low-density salamanders to two terrestrial moisture levels replicated 16 times for total of 64 terrariums. Salamanders were randomly assigned to treatments. The experiment took place for a total of 16 weeks (113 days) from 9 August to 30 November 2016. All salamanders began with 100 mL of water added to boxes to allow them to acclimate to terrariums. Moisture manipulation began on 12 August 2016. Water was added every three days (40 mL for low moisture treatments and 100 mL for high moisture treatments) throughout the terrarium but concentrated on the burrow. In the high moisture treatment, 100 mL allowed the soil to be saturated without standing water. In the low moisture treatments, 40 mL reduced the available moisture by more than half without creating a lethal environment. Salamanders were fed weekly (three Dubia roaches until 10 October, and six roaches after 10 October). Roaches were placed in the plastic feeding dish and could not escape. Because the small feeding dish was placed at the opposite side of the burrow, salamanders had to leave the burrow to feed. We recorded the number of uneaten roaches weekly. Volumetric water content (VWC) (the ratio of volume of water in a given volume of soil to the total soil volume) was measured weekly using TDR 100 Fieldscout® Soil Moisture Meter. Laboratory conditions were a 12:12–h photoperiod. Six additional terrariums were created and randomly assigned to shelves (three additional terrariums per treatment) and did not receive a salamander. We randomly assigned six Onset® HOBO® U23-001 Pro v2 data loggers across the two moisture treatments (three loggers per treatment) to monitor temperature and relative humidity in these additional terrariums.
We measured water-borne hormones again at the end of the 16-week terrestrial moisture manipulation (but before the dehydration and rehydration trials). We repeated the procedure used to measure Initial CORT (described above). During this procedure, salamanders were emerged in 60 mL of RO water instead of 40 mL due to their larger size. We define this measurement as “Final CORT”.

2.4. Dehydration and Rehydration Trials

To test how larval density and terrestrial moisture influenced salamander rates of water loss and water gain, we conducted dehydration and rehydration trials at the end of the terrestrial moisture experiment. Trials were performed in temperature-controlled environmental chambers (Percival® model I22 VL) with the lights off. We recorded temperature and relative humidity in the chambers using Onset® HOBO® U23-001 Pro v2 data loggers. Before starting the experiment, we hydrated salamanders for 2 h by placing them inside individual petri dishes (100 × 15 mm) with 2 cm of RO water. Salamanders were patted dry with paper towels, and their hydrated mass was recorded (±0.001 g). Salamanders were placed in another individual petri dish (100 × 15 mm) and added to the chamber in four blocks (16 salamanders per trial, four salamanders per treatment) spread over two shelves within the chamber. To allow salamanders to desiccate, we did not place a lid on the petri dishes. No salamanders escaped during the experiment. Salamanders were removed from the chamber after 40 min and reweighed. Rehydration trials began immediately after dehydration mass was recorded. For rehydration trials, we placed salamanders in a petri dished filled with 2 cm of RO water and placed them in another chamber. After 25 min, the salamanders were removed, blotted dried, and reweighed [63].

2.5. Water-Borne Hormone Methods

We extracted hormones from water and dried samples following Gabor et al. [60]. We re-suspended the hormone residue with 95% EIA buffer and 5% ethanol for a total of 230 μL. We measured CORT in duplicate for all samples using a CORT enzyme-immuno assay (EIA) kit (Cayman Chemical Company, Inc., Cat. No. 501320, Ann Arbor, MI, USA) on a spectrophotometer plate reader (Biotek® ELx800™) set to 405 nm. This assay is 100% cross-reactive with CORT, 15.8% cross-reactive with 11-deoxycorticosterone and 3.4% with prednisolone. We validated the use of the CORT EIA kits for water-borne hormones for A. maculatum. Hormones were extracted from 9 non-experimental animals following [60]. We re-suspended the dried hormone residue in a total of 230 μL of EIA and ethanol to create the pool sample. Using the pooled sample, we assessed parallelism of the serial dilution curve for five dilution samples (1:1–1:16). The CORT dilution curve was not significantly different from the standard curve (comparison of slopes, t9 = −0.90, p = 0.39). We also spiked the pool sample with each of eight standards to determine the quantitative recovery. The minimum observed recovery was 75%. We found a linear relationship between observed and expected slopes (slope = 1.1; F1,5 = 312.13, r2 = 0.99, p < 0.0001). The sensitivity of the CORT EIA plates ranged from 7.32 to 19.95 pg/mL and all samples were above the sensitivity range of the reader. We ran five EIA plates with four replicates of a pool control sample on each plate. Intra-plate variation of the pool sample varied from 0.99 to 3.6% and the interplate variation was 14.91%.

2.6. Statistical Analyses

Statistical analyses were conducted in R version 3.3.1 [64] using the nlme package [65]. Analyses on survival to metamorphosis, time to metamorphosis, and mass at metamorphosis were conducted on tank means. Survival to metamorphosis and juvenile recruitment (number of emerging salamanders) were analyzed using a general linear model with a binomial distribution. We tested whether log-transformed Initial CORT adjusted for mass (pg/g/h) was influenced by the aquatic larval density manipulation, time to metamorphosis, and days between metamorphosis and the date of the corticosterone trial using a one-way analysis of variance (ANOVA) and linear models.
Because we had multiple soil moisture measurements per terrarium, VWC was analyzed using a repeated-measures mixed linear model with moisture treatment and density treatment as factors and individual terrarium as a random factor. We tested whether days held in temporary containers influenced our response variables using generalized linear models. Mean temperature and relative humidity were analyzed using one-way ANOVAs. We calculated mass-specific growth rate [ln massweek16 − ln massweek1]/113 days and length-specific growth rate [ln total lengthweek16 − ln total lengthweek1]/113 days [13,66]. Percent roaches consumed was calculated as number of roaches eaten/total roaches. Number of roaches consumed was analyzed using a general linear model with a binomial distribution with initial mass, moisture treatment, and density treatment as explanatory variables. We also tested how growth rates (mass- and length-specific) and number of roaches eaten were related using linear regressions. We analyzed whether larval density, terrestrial moisture and their interaction influenced mass- and length-specific growth rates using a two-way ANOVA. We then reran the analysis with size at metamorphosis as a covariate and larval density and terrestrial moisture as factors and all possible interactions.
We analyzed whether larval density, terrestrial moisture and their interaction influenced log-transformed Final CORT release rates adjusted for mass (pg/g/h) using a two-way ANOVA. Because we measured CORT two times per salamander, log-transformed CORT release rates were also analyzed using a repeated-measures mixed linear model with moisture treatment and density treatment as factors and individual and sampling event (initial, final) as random factors.
Dehydration and rehydration rates were estimated using the equation: Evaporative water loss = (M1 − M2)/[RSA × (T2 − T1)] where M1, M2, T1, T2 represent fully hydrated mass (g), final body mass, and stop and end time [67]. RSA represents the respiratory surface area (cm2) and was estimated for A. maculatum as RSA = 8.34(M)0.684 [68]. We also estimated the rehydration rate using the same equation but where M1 represented desiccated mass and M2 rehydrated mass. We analyzed dehydration and rehydration rates using a two-way analysis of covariance with moisture treatment, density treatment and initial mass as factors and block as a random factor. Statistical significance was assessed at α = 0.05.

3. Results

3.1. Larval Density Manipulation

A total of 96 metamorphs emerged from our aquatic tanks: 42 high-density salamanders and 54 low-density salamanders. Three low-density tanks did not produce any salamanders and were excluded from analyses. Mean survival to metamorphosis was two times higher in low-density treatments (low density: 52.9% ± 4.8, high density: 23.3% ± 4.3 ( x ¯ ± SE), χ2 = 25.08, p < 0.0001). Juvenile recruitment (number of emerging salamanders) did not differ between larval treatments (χ2= 1.82, p = 0.18) with 3.2 ± 0.29 salamanders emerging from low (six salamanders per tank)-density tanks and 4.2 ± 0.77 ( x ¯ ± SE) salamanders emerging from high (18 salamanders per tank)-density tanks.
Larval density treatment did not influence time to metamorphosis (low density = 89.5 days ± 1.29, high density = 93.2 days ± 1.09 ( x ¯ ± SE), F1,25 = 3.83, p = 0.06). Salamanders from the low-density treatment were on average 30% heavier at metamorphosis than salamanders from high-density treatments (low density = 1.48 g ± 0.06, high density = 1.12 g ± 0.03 ( x ¯ ± SE), F1,25 = 9.16, p = 0.006). For the subset of salamanders (N = 64, 32 from each larval density treatment) randomly selected for the terrestrial experiment, we measured CORT release rates (Initial CORT) and total length. Similar to the patterns observed across all emerging salamanders, the randomly selected subset of salamanders from low-density tanks were on average 31% heavier than high-density salamanders (F1,62 = 24.8, p < 0.0001). Low-density salamanders had on average 9% (0.575 cm) longer total length (F1,62 = 17.4, p < 0.0001) than high-density salamanders.
We excluded one salamander from Initial CORT measurement because we were unable to extract enough CORT from the sample. Neither time to metamorphosis or days between metamorphosis and the date of the CORT trial influenced Initial CORT release rates and these variables were excluded from subsequent analyses. From the subset of salamanders selected for the terrestrial experiment, we found that high-density salamanders had 28.6% higher Initial CORT release rates (F1,61 = 7.62, p = 0.0076, Figure 2). Mass after the larval portion of the experiment and Initial CORT release rates were significantly negatively correlated (slope = −0.88 ± 0.15 (SE), t-value = −5.70, F1,61 = 32.4, p < 0.0001).

3.2. Moisture, Relative Humidity and Temperature in Terrariums

We successfully manipulated moisture levels in the terrariums. Across the whole experiment, on average, high moisture replicates had 56.2% ± 4.63 (SD) VWC (range: 49.2–63.03) and low moisture replicates had 26.5% ± 6.87 (SD) VWC. On average, VWC was 19.7% ± 1.58 (SE) (range: 14.4–41.4) lower in the low moisture treatment (t-value = −20.4, p < 0.001). Due to air flow and background humidity in the room, soil moisture inadvertently decreased by 0.37% ± 0.06 (SE) per week in high moisture treatment (t-value = 6.09, p < 0.0001) and by 1.45% ± 0.09 (SE) per week in low moisture treatment (t-value = −16.9, p < 0.0001). Relative humidity was high throughout the experiment (mean = 94.8% ± 2.6 (SD)) and did not differ between moisture treatment (F1,4 = 0.25, p = 0.64). Mean temperature during the experiment was 21.06 °C ± 0.25 (SD) and did not differ between treatments (F1,4 = 0.08, p = 0.79).

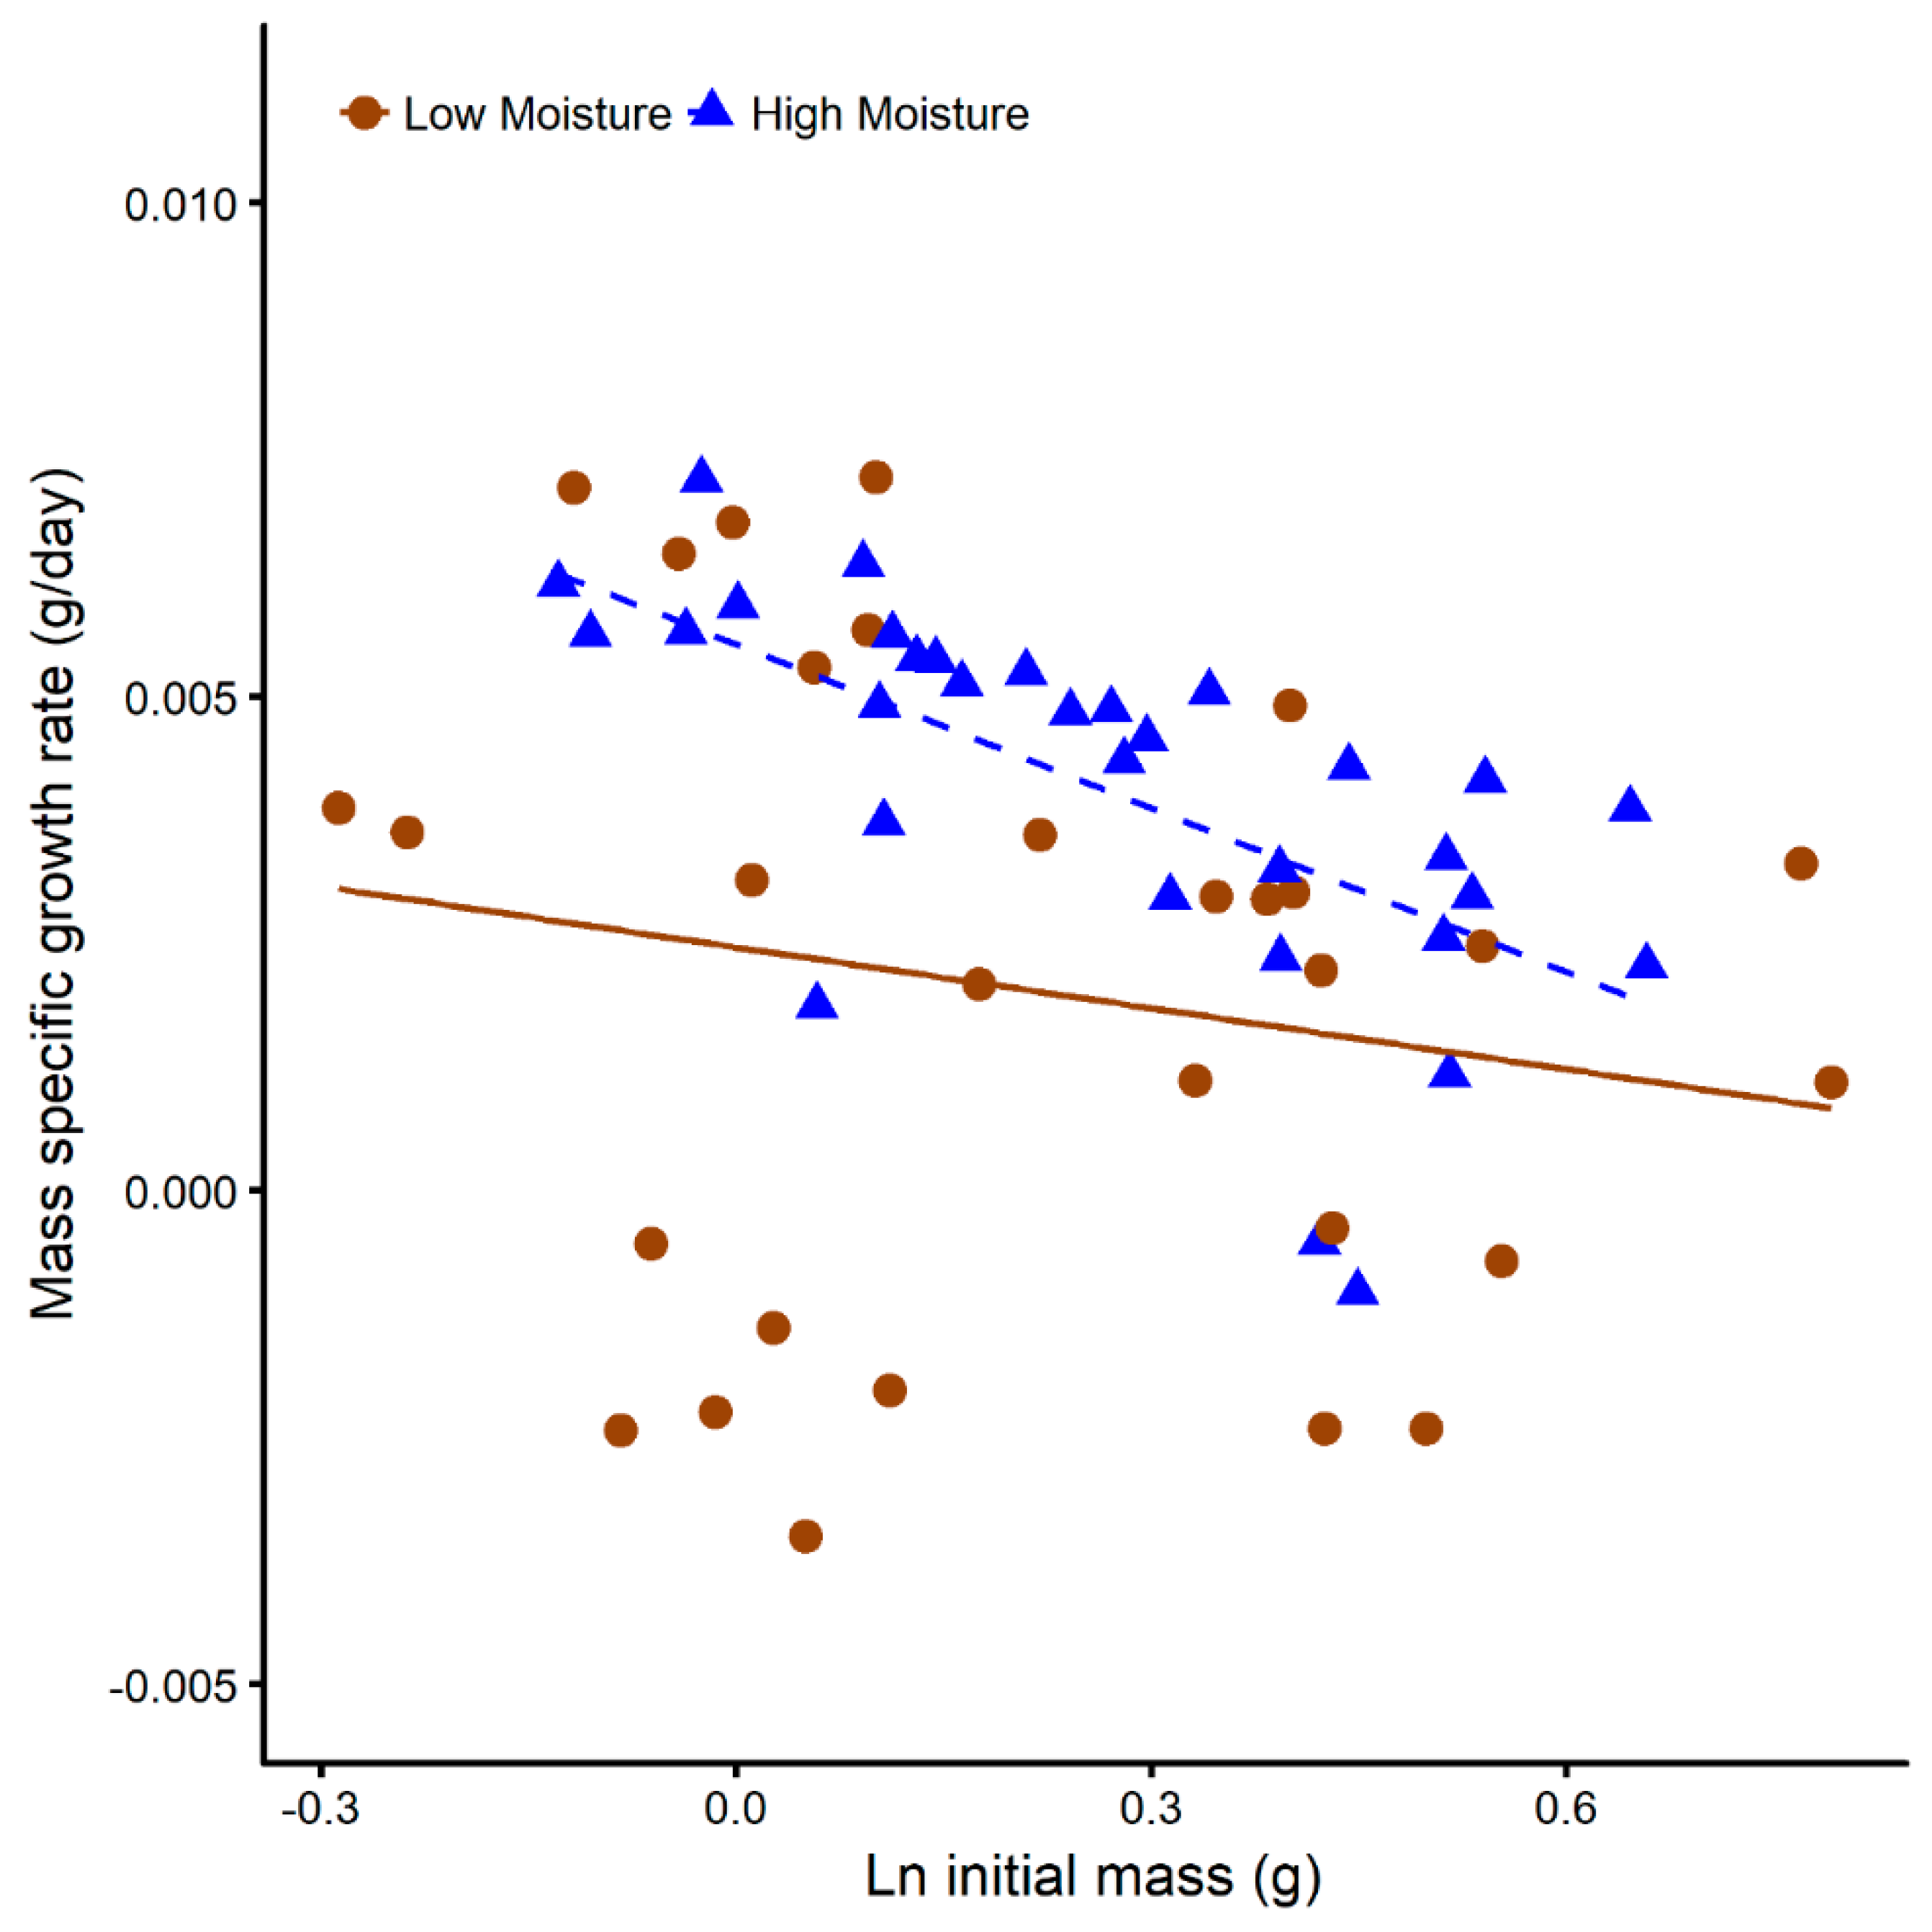
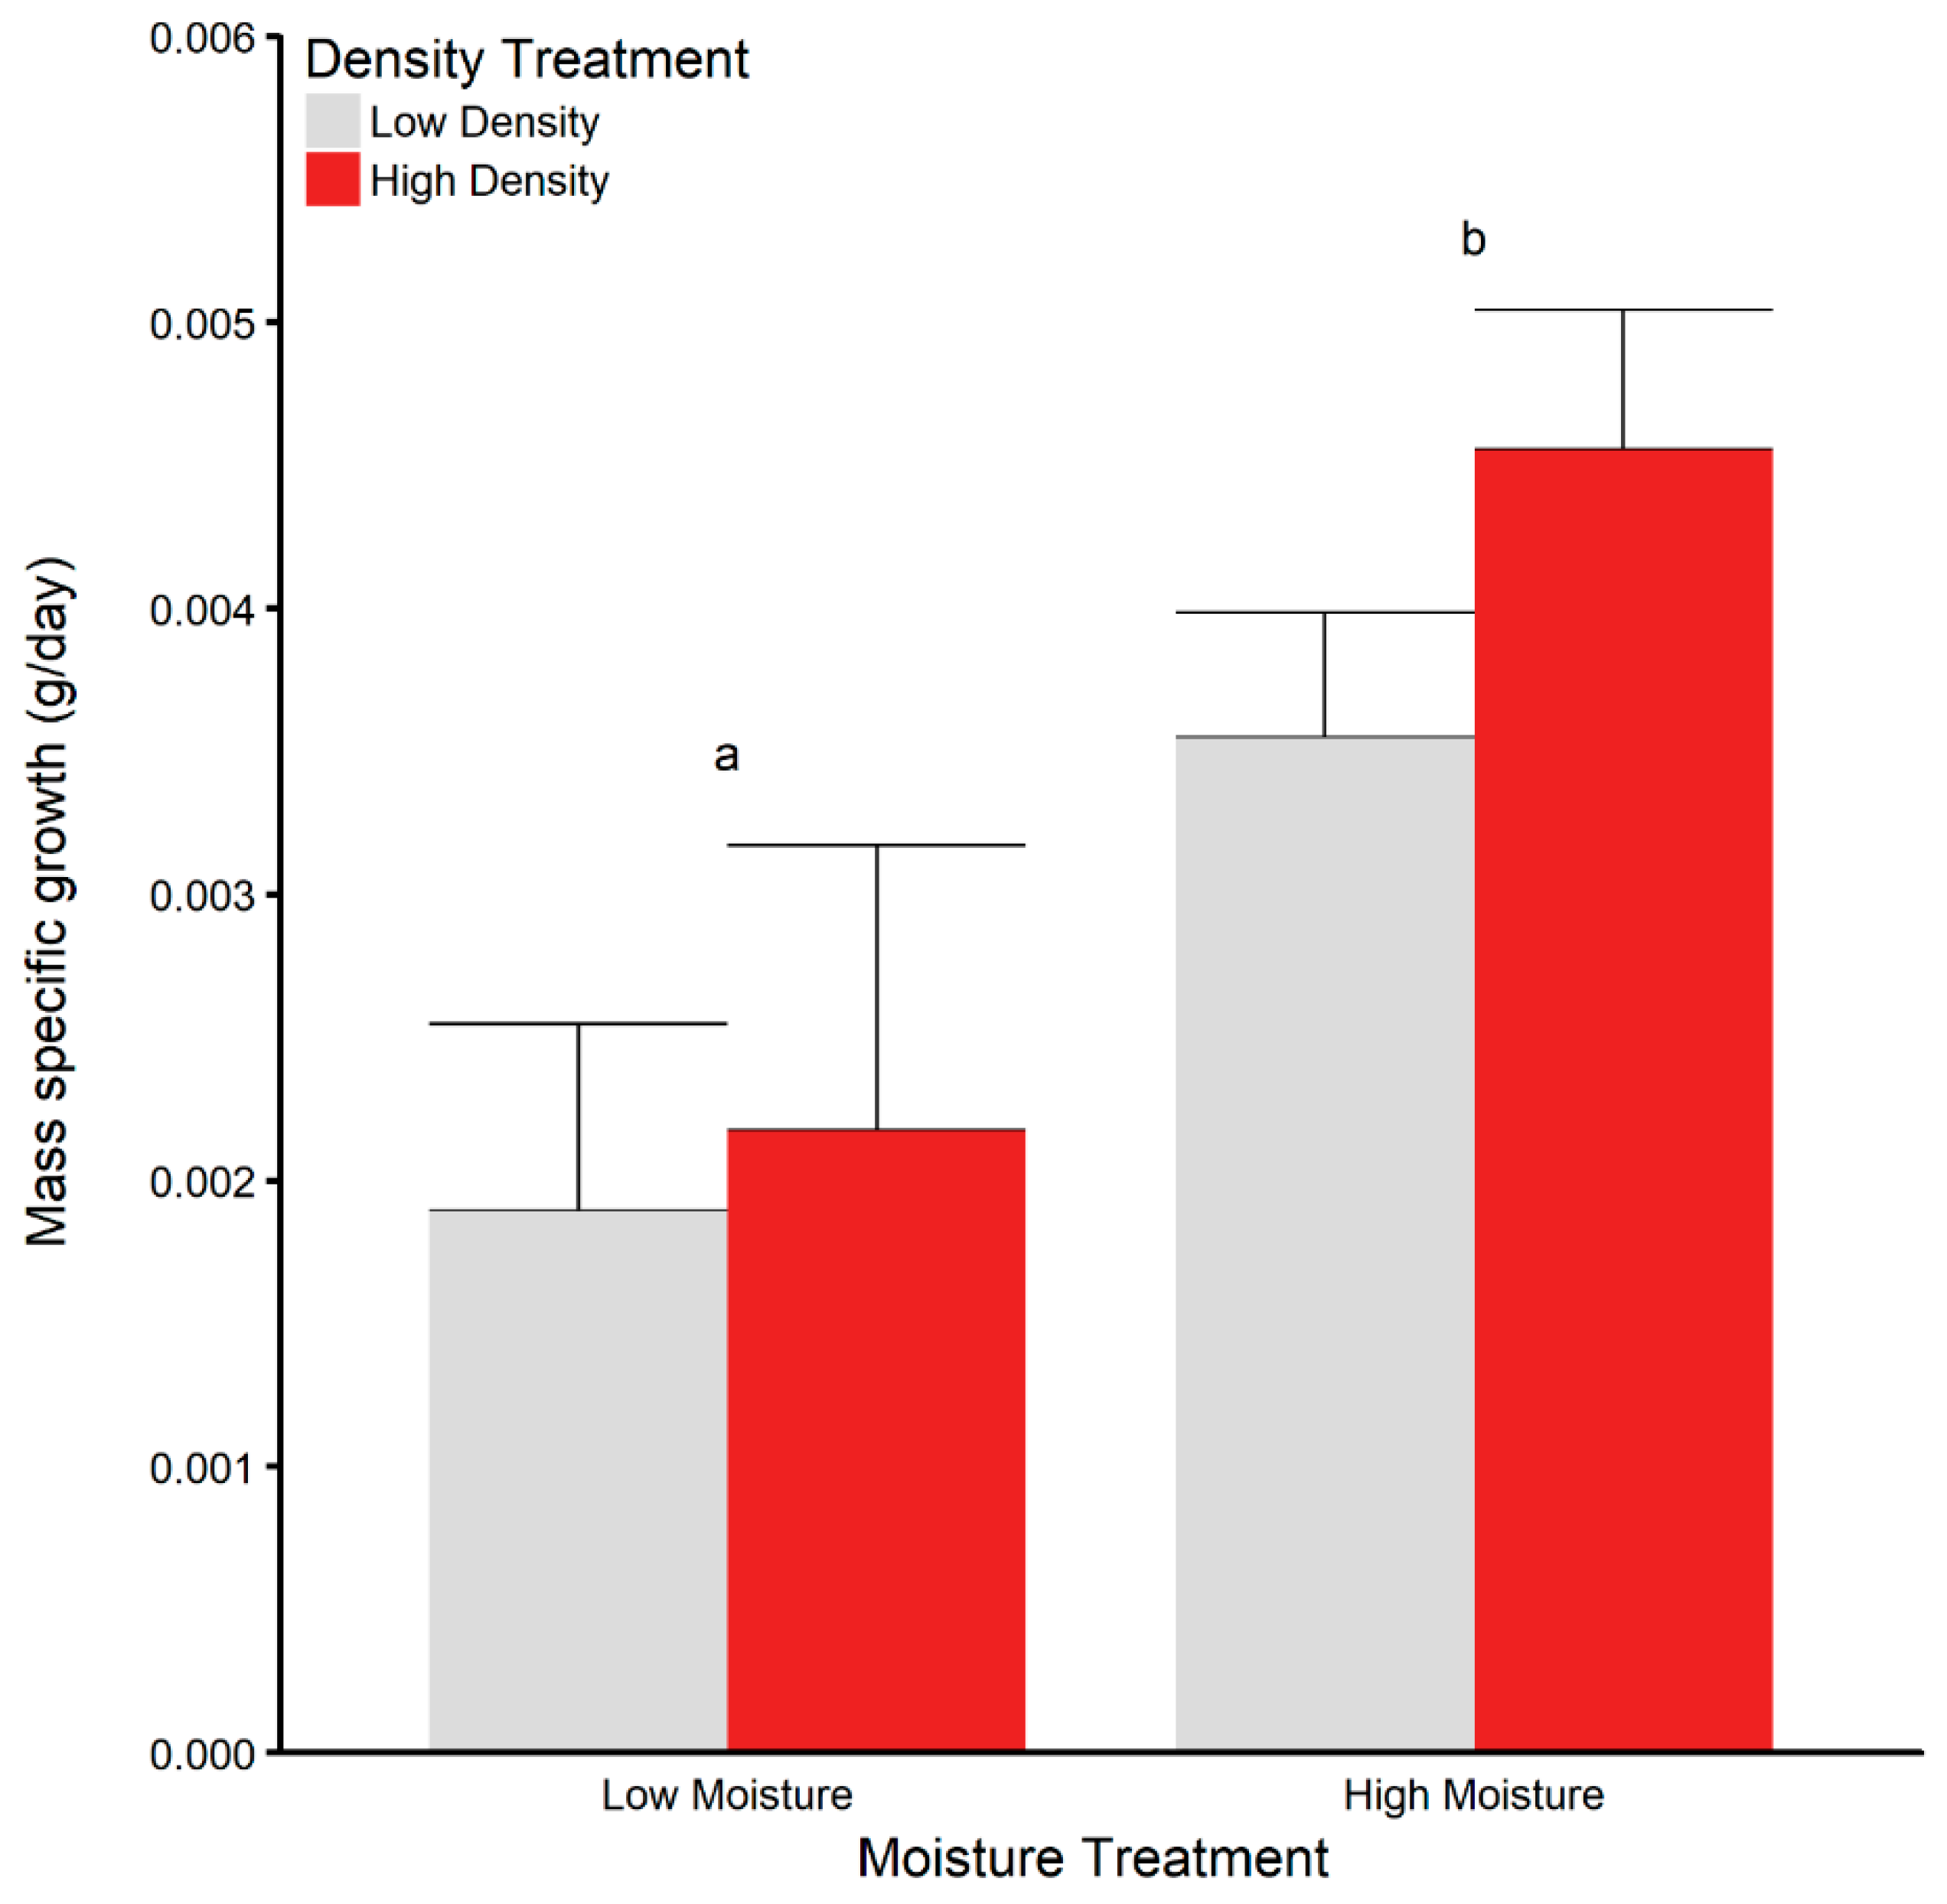
3.3. Juvenile Survival and Growth in Terrariums

Low-density salamanders were held in temporary containers after metamorphosis for an average of 4 days (11.1%) longer than high-density salamanders. Days held in the temporary containers did not influence our response variables and was excluded from analyses.
One salamander died before the end of the experiment (from the high-density, low moisture treatment). Two additional salamanders survived to the end of the experiment but did not exhibit a righting response and were not included in the dehydration and rehydration trials.
Terrestrial moisture influenced mass-specific growth rate over 16 weeks (F1,7 = 11.2, p = 0.0015, Figure 3), but larval density (F1,57 = 1.65, p = 0.20) and the interaction between moisture and density treatment (F1,57 = 0.71, p = 0.40) had no effect. When initial mass at metamorphosis was incorporated, mass-specific growth rates were dependent on moisture treatment (F1,56 = 11.7, p = 0.001) and initial mass (F1,56 = 4.51, p = 0.04, Figure 4). High moisture salamanders across both larval density treatments gained mass twice as fast as salamanders from low moisture treatments (Figure 3), a one-unit increase in ln initial mass resulted in a 0.0035 ± 0.0016 decrease in mass-specific growth rate (t-value = −2.277, p = 0.027, Figure 4). Total length-specific growth rate was not influenced by density treatment (F1,57 = 3.0, p = 0.10), moisture treatment (F1,57 = 2.5, p = 0.12), or their interaction (F1,57 = 1.32, p = 0.26). When we included initial length, length-specific growth rates over 16 weeks were only dependent on initial total length (F1,56 = 10.1, p = 0.002). A one-unit increase in ln total length resulted in a 0.003 ± 0.009 decrease in length-specific growth rate (t-value = −3.185, p = 0.002, Figure S1).
Terrestrial moisture treatment influenced the percentage of roaches eaten (χ2 = 246.0, p < 0.0001), but density treatment (χ2 = 0.08, p = 0.78) and the interaction between moisture and density had no effect (χ2 = 1.1, p = 0.30, Figure 5). When initial body mass was incorporated as a covariate, salamanders from high moisture treatments consumed a greater percentage of roaches (χ2 = 220.0, p < 0.0001), and there was also a moisture treatment by initial mass interaction (χ2 = 18.2, p < 0.0001), a density treatment by initial mass interaction (χ2 = 5.8, p < 0.02), and a three-way interaction of moisture, density and initial size (χ2 = 36.6, p < 0.0001). The total number of roaches eaten was a positive predictor of mass-specific growth rate (R2 = 0.80, F1,60 = 244.1, p < 0.0001) and length-specific growth rate (R2 = 0.35, F1,60 = 31.1, p < 0.0001).

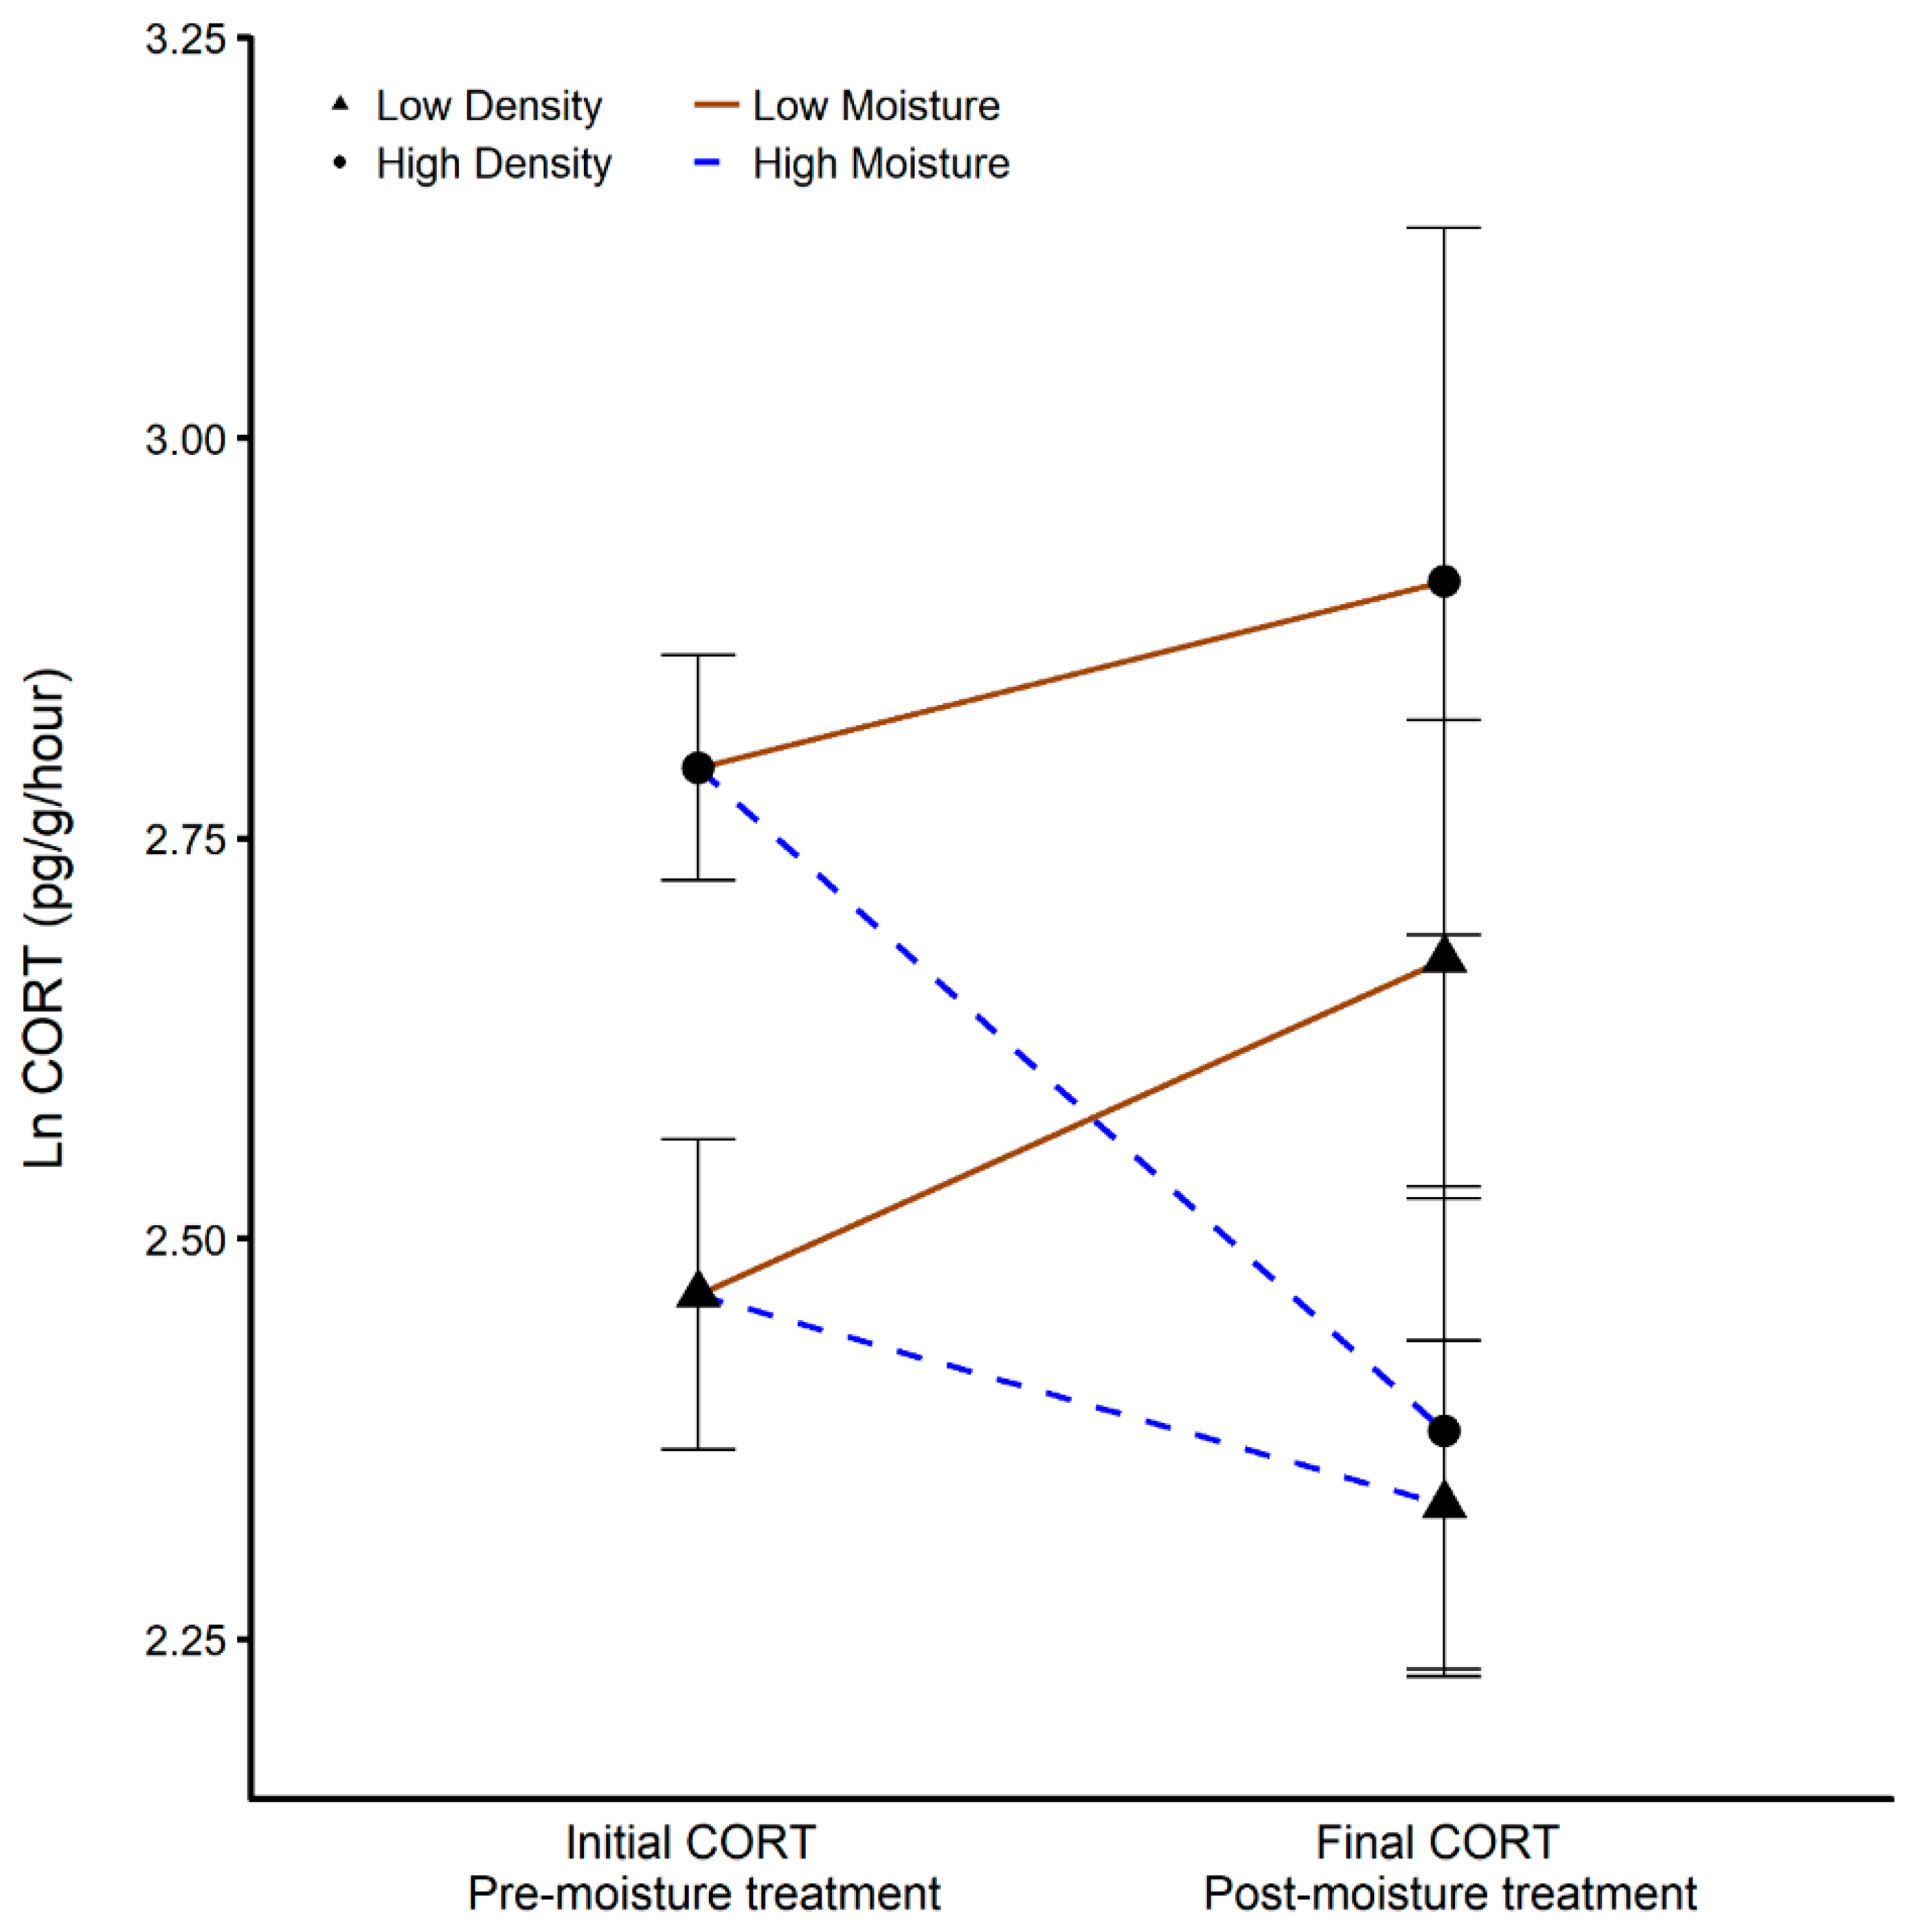
3.4. Corticostrone Release Rate

We excluded two outliers from our analysis of Final CORT release rates as defined by Hoaglin and Welsch [69] and Fox [70]. Salamanders in low moisture treatments had 78% higher Final CORT release rates (F1,56 = 2.80, p = 0.008), and there was no effect of larval density (F1,56 = 0.76, p = 0.39) or the interaction of moisture treatment and density treatment (F1,56 = 0.36, p = 0.55, Figure 2). Using a repeated-measures analysis, CORT release rates over time (Initial CORT, Final CORT) were similarly related to larval density treatment (χ2 = 5.88, p = 0.015) and moisture treatment (χ2 = 8.63, p = 0.003) but there was no interaction between them (χ2 = 0.16, p = 0.69).

3.5. Dehydration and Rehydration Trials

Mean temperature in the blocks during the evaporative water loss experiment ranged from 20.13 to 20.23 °C and mean relative humidity ranged from 26.38 to 34.44%. The blocking variable did not improve the fit and was not retained. Our estimate of evaporative water loss was not influenced by mass, moisture treatment, or density treatment (Table S1, Figure 6A). Mean temperature in the blocks during the rehydration experiment ranged from 19.88 to 19.98 °C and mean relative humidity ranged from 48.64 to 52.56%. The blocking variable did not improve the fit and was not retained. For rehydration rates, two salamanders were excluded because they were statistical outliers as defined by [69,70]. On average, salamanders from low moisture treatments had 30.3% higher rehydration rate than salamanders from high moisture treatments. Salamanders that experienced higher evaporative water loss regained a greater percentage of mass (slope = 0.50 ± 0.18 (SE), t-value = 2.85, p = 0.006, Table S2, Figure 6B).

4. Discussion

As predicted, we found that larvae reared in low-density treatments emerged at larger metamorphic sizes than those reared at high density. Moreover, salamanders from the low-density treatments also had lower CORT release rates. High terrestrial moisture resulted in greater juvenile growth and lower CORT in salamanders from both aquatic density treatments. Our results suggest that low moisture may limit terrestrial growth in the spotted salamander primarily by reducing food intake. Although we did not find that larval density treatment influenced juvenile growth, size at metamorphosis was negatively correlated with terrestrial growth. This suggests that smaller salamanders exhibited compensatory growth, allowing them to gain more mass for their size across terrestrial environments.
In amphibians, larger body size is positively related to survival and reproductive output [71,72]. Suboptimal conditions early in life that influence body size can potentially influence lifetime fitness if these size differences persist. In our experiment, we found that high conspecific density resulted in smaller size at metamorphosis, consistent with previous studies across amphibians and this species [56,73]. Five months after metamorphosis, smaller individuals had gained a greater percentage of their body mass, allowing them to partly make up for their size disadvantage. Such compensatory growth has been demonstrated in other species, and suggests that under certain conditions, effects of early environments may be partially mitigated [74,75].
We found that Initial CORT release rates were greater in salamanders emerging from high-density treatments. Our finding that smaller salamanders had higher CORT release rates is congruent with other studies that have found that salamanders with higher plasma CORT had smaller body mass and increased metabolic rate (reviewed in [76]). Additionally, mass-specific growth across all moisture treatments was influenced by initial mass at metamorphosis. Because of the strong negative correlation between Initial CORT release rates and mass at metamorphosis, this suggests that small salamanders (with higher CORT release rates) grew more. Additionally, salamanders in low terrestrial moisture had higher Final CORT and a greater increase in CORT from the initial sample (Figure 2). This result suggests that salamanders experienced more stressful conditions in the low moisture environments.
As expected, terrestrial growth was dependent on moisture in the terrestrial environment. Salamanders in low moisture treatments ate fewer roaches, which resulted in lower mass-specific growth rates. Compensatory growth is often a result of higher foraging or food intake (or earlier onset of feeding) [77,78], thus dry environments that limit food intake may have inhibited compensatory growth. This work is consistent with past field studies suggesting that reduced foraging rates in Desmognathus ochrophaeus are associated with periods of low precipitation and low moisture habitats [79]. Additionally, Rohr and Palmer [80] observed decreased foraging rates in dry moisture treatments in A. barbouri during a one-week laboratory experiment. Although we did not directly measure foraging in our experiment, salamanders had to leave their burrows to reach the roaches, suggesting that salamanders in the low moisture environment spent less time moving. It is possible, however, that salamanders in dry treatments spent an equal time out of the burrow but chose not to feed. Gomez-Mestre and Tejedo [81] found that Bufo calamita in dry environments were also less efficient at catching prey. The prey in our experiment was confined to a small container, so we assume that salamanders in both low and high moisture treatments were equally efficient at catching the prey.
We did not find differences in evaporative water loss, suggesting that small and large salamanders lost water at a similar rate and that our moisture treatments did not result in changes in desiccation resistance. This is contrary to our prediction, as smaller salamanders are expected to have higher rates of water loss per unit area [23]. While studies have found evidence for geographic variation in desiccation resistance indicative of local adaptation based on gradients of environmental moisture e.g., [82,83] it is notable that we did not find evidence for plasticity in resistance to water loss based on our moisture treatments. This result has important implications for the ability of salamanders to respond to changes in environmental moisture. Although the relationship between dehydration and rehydration has been predicted to be reciprocal [27], we did find that salamanders from the low moisture treatment had slightly higher rates of water uptake. Because of their higher osmotic concentration, desiccated animals should rehydrate more quickly. Indeed, we found that salamanders that experienced higher evaporative water loss gained water more quickly. It is possible that salamanders from low moisture treatments, which were chronically dry, reabsorbed water more quickly. If water reuptake is maximized, then salamanders in dry environments should be able to forage for longer periods of time [63]. It is also possible that our water loss trial did not capture small differences in water loss between salamanders due to lack of exposure to differences in humidity or due to course measurements. Additional fine-scale studies of evaporative water loss could provide additional insights.
Overall, our results suggest that the persistence of cross-life stage effects may be context-dependent [4]. Although early life stages may influence performance traits, whether these effects persist beyond life history switch points is complex. In high moisture environments, small salamanders may be more likely to catch up to larger individuals. In low moisture environments, although small salamanders had higher growth rates than large salamanders, depressed growth rates overall in this treatment indicate that small salamanders will take longer to make up for initial size differences. Additionally, early exposure to high density resulted in elevated CORT release rates, which may aid in compensatory growth later in life especially for smaller salamanders. Additional experiments could further examine the role of elevated CORT early in life on future compensatory growth. Nonetheless, in dry environments the effects of size at metamorphosis are predicted to persist for a longer period than in moist environments, inhibiting the ability of smaller individuals to make up for initial size differences. Persistence of cross-life stage effects will depend on whether individuals can exhibit compensatory growth in diverse environments.

Supplementary Materials

The following are available online at https://www.mdpi.com/1424-2818/10/3/68/s1. Figure S1: Plot of mass-specific length by initial length, Table S1: ANCOVA table for evaporative water loss; Table S2: ANCOVA table for rehydration rates.

Author Contributions

J.F.C., J.R.V. and K.L.G. conceived and designed the experiment. K.L.G. provided project support and resources. J.F.C. and J.P. performed the experiment. Z.R.F. and C.R.G. performed the hormone analysis. J.F.C. and C.R.G. analyzed the data. J.F.C., C.R.G. and K.L.G. wrote the paper and the other authors provided substantial feedback on the manuscript.

Funding

This research was funded by the Thomas F. Huff Graduate Scholarship in Integrative Life Sciences, VCU Rice Rivers Center Student Research Grant, National Science Foundation Graduate Research Fellowship, the University of Richmond School of Arts and Sciences and the University of Richmond Department of Biology.

Acknowledgments

We thank Ryan S. McPeters, Benny Pugh, Lily Thompson, John Devincenzi, Trevor Faske, Carolina Rostan-Zimmer, Louise-Marie Lanzetta, Kayla Sherman and Lindsay Brookman for their assistance in the field and laboratory. We thank Anne Wright and Salvatore Agosta for their help. We thank the VCU Rice Rivers Center and the University of Richmond Department of Biology for use of their facilities. We thank Jennifer O’Donnell for animal facility support. We thank two anonymous reviewers who provided comments that improved the manuscript.

Conflicts of Interest

The authors declare no conflict of interest. The funders had no role in the design of the study; in the collection, analyses, or interpretation of data; in the writing of the manuscript, and in the decision to publish the results.

References

  1. Moran, N.A. Adaptation and constraint in the complex life cycles of animals. Annu. Rev. Ecol. Syst. 1994, 25, 573–600. [Google Scholar] [CrossRef]
  2. Ebenman, B. Evolution in organisms that change their niches during the life cycle. Am. Nat. 1992, 139, 990–1021. [Google Scholar] [CrossRef]
  3. Mousseau, T.A.; Fox, C.W. The adaptive signficance of maternal effects. Trends Ecol. Evol. 1998, 13, 403–407. [Google Scholar] [CrossRef]
  4. Podolsky, R.; Moran, A. Integrating function across marine life cycles. Integr. Comp. Biol. 2006, 46, 577–586. [Google Scholar] [CrossRef] [PubMed] [Green Version]
  5. Pechenik, J. Larval experience and latent effects—Metamorphosis is not a new beginning. Integr. Comp. Biol. 2006, 46, 323–333. [Google Scholar] [CrossRef] [PubMed]
  6. Marshall, D.J.; Morgan, S.G. Ecological and evolutionary consequences of linked life-history stages in the sea. Curr. Biol. 2011, 21, R718–R725. [Google Scholar] [CrossRef] [PubMed]
  7. Gomez-Mestre, I.; Saccoccio, V.L.; Iijima, T.; Collins, E.M.; Rosenthal, G.G.; Warkentin, K.M. The shape of things to come: Linking developmental plasticity to post-metamorphic morphology in anurans. J. Evol. Biol. 2010, 23, 1364–1373. [Google Scholar] [CrossRef] [PubMed] [Green Version]
  8. Allen, R.M.; Marshall, D.J. Phenotypic links among life-history stages are complex and context-dependent in a marine invertebrate: Interactions among offspring size, larval nutrition and postmetamorphic density. Funct. Ecol. 2013, 27, 1358–1366. [Google Scholar] [CrossRef]
  9. Auer, S.K. Phenotypic plasticity in adult life-history strategies compensates for a poor start in life in Trinidadian guppies (Poecilia reticulata). Am. Nat. 2010, 176, 818–829. [Google Scholar] [CrossRef] [PubMed]
  10. Madsen, T.; Shine, R. Silver spoons and snake body sizes: Prey availability early in life influences long-term growth rates of free ranging pythons. J. Anim. Ecol. 2000, 69, 952–959. [Google Scholar] [CrossRef]
  11. Metcalfe, N.B.; Monaghan, P. Compensation for a bad start: Grow now, pay later? Trends Ecol. Evol. 2001, 16, 254–260. [Google Scholar] [CrossRef]
  12. Lindström, J. Early development and fitness in birds and mammals. Trends Ecol. Evol. 1999, 14, 343–348. [Google Scholar] [CrossRef]
  13. Crespi, E.J.; Warne, R.W. Environmental conditions experienced during the tadpole stage alter post-metamorphic glucocorticoid response to stress in an amphibian. Integr. Comp. Biol. 2013, 53, 989–1001. [Google Scholar] [CrossRef] [PubMed]
  14. Rohr, J.R.; Raffel, T.R.; Halstead, N.T.; McMahon, T.A.; Johnson, S.A.; Boughton, R.K.; Martin, L.B. Early-life exposure to a herbicide has enduring effects on pathogen-induced mortality. Proc. R. Soc. B Biol. Sci. 2013, 280, 20131502. [Google Scholar] [CrossRef]
  15. Smith-Gill, S.J.; Berven, K.A. Predicting amphibian metamorphosis. Am. Nat. 1979, 113, 563–585. [Google Scholar] [CrossRef]
  16. Leips, J.; Travis, J. Metamorphic responses to changing food levels in two species of Hylid frogs. Ecology 1994, 75, 1345–1356. [Google Scholar] [CrossRef]
  17. Wilbur, H.M.; Collins, J.P. Ecological aspects of amphibian metamorphosis. Science 1973, 182, 1305–1314. [Google Scholar] [CrossRef] [PubMed]
  18. Skelly, D.K. Experimental venue and estimation of interaction strength. Ecology 2002, 83, 2097–2101. [Google Scholar] [CrossRef]
  19. Brockelman, W.Y. An analysis of density effects and predation in Bufo americanus tadpoles. Ecology 1969, 50, 632–644. [Google Scholar] [CrossRef]
  20. Wilbur, H.M. Density-dependent aspects of growth and metamorphosis in Bufo americanus. Ecology 1977, 58, 196–200. [Google Scholar] [CrossRef]
  21. Scott, D.E.; Casey, E.D.; Donovan, M.F.; Lynch, T.K. Amphibian lipid levels at metamorphosis correlate to post-metamorphic terrestrial survival. Oecologia 2007, 153, 521–532. [Google Scholar] [CrossRef] [PubMed]
  22. Charbonnier, J.F.; Vonesh, J.R. Consequences of life history switch point plasticity for juvenile morphology and locomotion in the Túngara frog. PeerJ 2015, 3, e1268. [Google Scholar] [CrossRef] [PubMed]
  23. Spight, T. The water economy of salamanders: Evaporative water loss. Physiol. Zool. 1968, 41, 195–203. [Google Scholar] [CrossRef]
  24. Cabrera-Guzmán, E.; Crossland, M.R.; Brown, G.P.; Shine, R. Larger body size at metamorphosis enhances survival, growth and performance of young cane toads (Rhinella marina). PLoS ONE 2013, 8, e70121. [Google Scholar] [CrossRef] [PubMed]
  25. Etheridge, K. Water balance in estivating sirenid salamanders (Siren lacertina). Herpetologica 1990, 46, 400–406. [Google Scholar]
  26. Jørgensen, C.B. 200 years of amphibian water economy: From Robert Townson to the present. Biol. Rev. Camb. Philos. Soc. 1997, 72, 153–237. [Google Scholar] [CrossRef] [PubMed]
  27. Spotila, J.R. Role of temperature and water in the ecology of lungless salamanders. Ecol. Monogr. 1972, 42, 95–125. [Google Scholar] [CrossRef]
  28. Semlitsch, R.D.; Todd, B.D.; Blomquist, S.M.; Calhoun, A.J.K.; Gibbons, J.W.; Gibbs, J.P.; Graeter, G.J.; Harper, E.B.; Hocking, D.J.; Hunter, M.L.; et al. Effects of timber harvest on amphibian populations: Understanding mechanisms from forest experiments. Bioscience 2009, 59, 853–862. [Google Scholar] [CrossRef]
  29. Rothermel, B.B.; Semlitsch, R.D. An experimental investigation of landscape resistance of forest versus old-field habitats to emigrating juvenile amphibians. Conserv. Biol. 2002, 16, 1324–1332. [Google Scholar] [CrossRef]
  30. Rollins-Smith, L.A. Neuroendocrine-immune system interactions in amphibians: Implications for understanding global amphibian declines. Immunol. Res. 2001, 23, 273–280. [Google Scholar] [CrossRef]
  31. Sapolsky, R.M.; Romero, L.M.; Munck, A.U. How do glucocorticoids influence stress responses? Integrating permissive, suppressive, stimulatory, and preparative actions. Endocr. Rev. 2000, 21, 55–89. [Google Scholar] [CrossRef] [PubMed]
  32. Romero, L.M. Physiological stress in ecology: Lessons from biomedical research. Trends Ecol. Evol. 2004, 19, 249–255. [Google Scholar] [CrossRef] [PubMed]
  33. Weinstock, M.; Matlina, E.; Maor, G.I.; Rosen, H.; McEwen, B.S. Prenatal stress selectively alters the reactivity of the hypothalamic-pituitary adrenal system in the female rat. Brain Res. 1992, 595, 195–200. [Google Scholar] [CrossRef]
  34. Welberg, L.A.M.; Seckl, J.R.; Holmes, M.C. Prenatal glucocorticoid programming of brain corticosteroid receptors and corticotrophin-releasing hormone: Possible implications for behaviour. Neuroscience 2001, 104, 71–79. [Google Scholar] [CrossRef]
  35. Kirschman, L.J.; McCue, M.D.; Boyles, J.G.; Warne, R.W. Exogenous stress hormones alter energetic and nutrient costs of development and metamorphosis. J. Exp. Biol. 2017, 220, 3391–3397. [Google Scholar] [CrossRef] [PubMed]
  36. Glennemeier, K.A.; Denver, R.J. Role for corticoids in mediating the response of Rana pipiens tadpoles to intraspecific competition. J. Exp. Zool. 2002, 292, 32–40. [Google Scholar] [CrossRef] [PubMed]
  37. Romero, L.M.; Wikelski, M. Diurnal and nocturnal differences in hypothalamic-pituitary-adrenal axis function in Galápagos marine iguanas. Gen. Comp. Endocrinol. 2006, 145, 177–181. [Google Scholar] [CrossRef] [PubMed]
  38. Cree, A.; Tyrrell, C.L.; Preest, M.R.; Thorburn, D.; Guillette, L.J. Protecting embryos from stress: Corticosterone effects and the corticosterone response to capture and confinement during pregnancy in a live-bearing lizard (Hoplodactylus maculatus). Gen. Comp. Endocrinol. 2003, 134, 316–329. [Google Scholar] [CrossRef]
  39. Woodley, S.K.; Painter, D.L.; Moore, M.C.; Wikelski, M.; Michael Romero, L. Effect of tidal cycle and food intake on the baseline plasma corticosterone rhythm in intertidally foraging marine iguanas. Gen. Comp. Endocrinol. 2003, 132, 216–222. [Google Scholar] [CrossRef]
  40. Crespi, E.J.; Denver, R.J. Roles of stress hormones in food intake regulation in anuran amphibians throughout the life cycle. Comp. Biochem. Physiol. A Mol. Integr. Physiol. 2005, 141, 381–390. [Google Scholar] [CrossRef] [PubMed]
  41. Middlemis Maher, J.; Werner, E.E.; Denver, R.J. Stress hormones mediate predator-induced phenotypic plasticity in amphibian tadpoles. Proc. R. Soc. B Biol. Sci. 2013, 280, 20123075. [Google Scholar] [CrossRef] [PubMed]
  42. Narayan, E.J.; Cockrem, J.F.; Hero, J.M. Sight of a predator induces a corticosterone stress response and generates fear in an amphibian. PLoS ONE 2013, 8, e73564. [Google Scholar] [CrossRef] [PubMed]
  43. Creel, S.; Dantzer, B.; Goymann, W.; Rubenstein, D.R. The ecology of stress: Effects of the social environment. Funct. Ecol. 2013, 27, 66–80. [Google Scholar] [CrossRef]
  44. Davis, A.K.; Maerz, J.C. Assessing stress levels of captive-reared amphibians with hematological data: Implications for conservation initiatives. J. Herpetol. 2011, 45, 40–44. [Google Scholar] [CrossRef]
  45. Romero, L.M.; Wikelski, M. Exposure to tourism reduces stress-induced corticosterone levels in Galápagos marine iguanas. Biol. Conserv. 2002, 108, 371–374. [Google Scholar] [CrossRef]
  46. Gabor, C.R.; Davis, D.R.; Kim, D.S.; Zabierek, K.C.; Bendik, N.F. Urbanization is associated with elevated corticosterone in Jollyville Plateau salamanders. Ecol. Indic. 2018, 85, 229–235. [Google Scholar] [CrossRef]
  47. IPCC (Intergovernmental Panel on Climate Change). IPCC Fifth Assessment Synthesis Report-Climate Change 2014 Synthesis Report; IPCC: Geneva, Switzerland, 2014; 167p. [Google Scholar]
  48. Greenberg, C.H.; Goodrick, S.; Austin, J.D.; Parresol, B.R. Hydroregime prediction models for ephemeral groundwater-driven sinkhole wetlands: A planning tool for climate change and amphibian conservation. Wetlands 2015, 35, 899–911. [Google Scholar] [CrossRef]
  49. Dupoué, A.; Angelier, F.; Lourdais, O.; Bonnet, X.; Brischoux, F. Effect of water deprivation on baseline and stress-induced corticosterone levels in the Children’s python (Antaresia childreni). Comp. Biochem. Physiol. A Mol. Integr. Physiol. 2014, 168, 11–16. [Google Scholar] [CrossRef] [PubMed]
  50. Whitford, W.G.; Vinegar, A. Homing, survivorship, and overwintering of larvae in spotted salamanders, Ambystoma maculatum. Copeia 1966, 1966, 515–519. [Google Scholar] [CrossRef]
  51. Petranka, J.W.; Rushlow, A.W.; Hopey, M.E. Predation by tadpoles of Rana sylvatica on embryos of Ambystoma maculatum: Implications of ecological role reversals by Rana (Predator) and Ambystoma (Prey). Herpetologica 1998, 54, 1–13. [Google Scholar]
  52. Brodman, R. Annual variation in the breeding success of two syntopic species of Ambystoma salamanders. J. Herpetol. 1995, 29, 111–113. [Google Scholar] [CrossRef]
  53. Wright, A.H.; Allen, A. The early breeding habits of Amblystoma punctatum. Am. Nat. 1909, 43, 687–692. [Google Scholar] [CrossRef]
  54. Madison, D.M. The emigration of radio-implanted spotted salamanders, Ambystoma maculatum. J. Herpetol. 1997, 31, 542–551. [Google Scholar] [CrossRef]
  55. Faccio, S.D. Postbreeding emigration and habitat use by Jefferson and spotted salamanders in Vermont. J. Herpetol. 2003, 37, 479–489. [Google Scholar] [CrossRef]
  56. Metts, B.S.; Hopkins, W.A.; Nestor, J.P. Interaction of an insecticide with larval density in pond-breeding salamanders (Ambystoma). Freshw. Biol. 2005, 50, 685–696. [Google Scholar] [CrossRef]
  57. Boone, M.; James, S. Interactions of an insecticide, herbicide, and natural stressors in amphibian community mesocosms. Ecol. Appl. 2003, 13, 829–841. [Google Scholar] [CrossRef]
  58. Figiel, C.R.; Semlitsch, R.D. Population variation in survival and metamorphosis of larval salamanders (Ambystoma maculatum) in the presence and absence of fish predation. Copeia 1990, 1990, 818–826. [Google Scholar] [CrossRef]
  59. Schneider, C.A.; Rasband, W.S.; Eliceiri, K.W. NIH Image to ImageJ: 25 years of image analysis. Nat. Methods 2012, 9, 671–675. [Google Scholar] [CrossRef] [PubMed] [Green Version]
  60. Gabor, C.R.; Zabierek, K.C.; Kim, D.S.; da Barbiano, L.A.; Mondelli, M.J.; Bendik, N.F.; Davis, D.R. A non-invasive water-borne assay of stress hormones in aquatic salamanders. Copeia 2016, 104, 172–181. [Google Scholar] [CrossRef]
  61. Dunn, J.; Scheving, L.; Millet, P. Circadian variation in stress-evoked increases in plasma corticosterone. Am. J. Physiol. 1972, 223, 402–406. [Google Scholar] [CrossRef] [PubMed]
  62. Ellis, T.; James, J.D.; Stewart, C.; Scott, A.P. A non-invasive stress assay based upon measurement of free cortisol released into the water by rainbow trout. J. Fish Biol. 2004, 65, 1233–1252. [Google Scholar] [CrossRef]
  63. Winters, A.; Gifford, M.E. Geographic variation in the water economy of a lungless salamander. Herpetol. Conserv. Biol. 2013, 8, 741–747. [Google Scholar]
  64. R Development Core Team. R: A Language and Environment for Statistical Computing; Vienna: RFoundation for Statistical Computing 2016. Available online: https://www.R-project.org/ (accessed on 17 July 2018).
  65. Pinheiro, J.; Bates, D.; DebRoy, S.; Sarkar, D. nlme: Linear and Nonlinear Mixed Effects Models; R Package: 2016. Available online: httpps://CRAN.R-project.org/package=nlme (accessed on 17 July 2018).
  66. Sinervo, B.; Adolph, S.C. Thermal sensitivity of growth rate in hatchling Sceloporus lizards: Environmental, behavioral and genetic aspects. Oecologia 1989, 78, 411–419. [Google Scholar] [CrossRef] [PubMed]
  67. Liu, J.N.; Hou, P.C.L. Cutaneous resistance to evaporative water loss in Taiwanese arboreal Rhacophorid frogs. Zool. Stud. 2012, 51, 988–995. [Google Scholar]
  68. Whitford, W.G.; Hutchison, V.H. Body size and metabolic rate in salamanders. Physiol. Zool. 1967, 40, 127–133. [Google Scholar] [CrossRef]
  69. Hoaglin, D.C.; Welsch, R.E. The hat matrix in regression and ANOVA. Am. Stat. 1978, 32, 17–22. [Google Scholar] [CrossRef]
  70. Fox, J. Applied Regression Analysis, Linear Models, and Related Methods; Sage Publications: Newbury Park, CA, USA, 1997; ISBN 080394540X. [Google Scholar]
  71. Earl, J.E.; Whiteman, H.H. Are commonly used fitness predictors accurate? A meta-analysis of amphibian size and age at metamorphosis. Copeia 2015, 103, 297–309. [Google Scholar] [CrossRef]
  72. Wells, K. The Ecology and Behavior of Amphibians; University of Chicago Press: Chicago, IL, USA, 2007. [Google Scholar]
  73. Skelly, D.K.; Kiesecker, J.M. Venue and outcome in ecological experiments: Manipulations of larval anurans. Oikos 2001, 94, 198–208. [Google Scholar] [CrossRef]
  74. Boone, M.D. Juvenile frogs compensate for small metamorph size with terrestrial growth: Overcoming the effects of larval density and insecticide exposure. J. Herpetol. 2005, 39, 416–423. [Google Scholar] [CrossRef]
  75. Goater, C.P. Growth and survival of postmetamorphic toads: Interactions among larval history, density, and parasitism. Ecology 1994, 75, 2264–2274. [Google Scholar] [CrossRef]
  76. Woodley, S.K. Life in the slow lane: Stress responses in Plethodontid salamanders. Herpetologica 2017, 73, 259–268. [Google Scholar] [CrossRef]
  77. Morey, S.; Reznick, D. Effects of larval density on postmetamorphic spadefoot toads (Spea hammondii). Ecology 2001, 82, 510–522. [Google Scholar] [CrossRef]
  78. Benard, M.F.; Middlemis Maher, J. Consequences of intraspecific niche variation: Phenotypic similarity increases competition among recently metamorphosed frogs. Oecologia 2011, 166, 585–592. [Google Scholar] [CrossRef] [PubMed]
  79. Feder, M.E.; Londos, P.L. Hydric constraints upon foraging in a terrestrial salamander, Desmognathus ochrophaeus (Amphibia: Plethodontidae). Oecologia 1984, 64, 413–418. [Google Scholar] [CrossRef] [PubMed]
  80. Rohr, J.R.; Palmer, B.D. Climate change, multiple stressors, and the decline of ectotherms. Conserv. Biol. 2013, 27, 741–751. [Google Scholar] [CrossRef] [PubMed]
  81. Gomez-Mestre, I.; Tejedo, M. Adaptation or exaptation? An experimental test of hypotheses on the origin of salinity tolerance in Bufo calamita. J. Evol. Biol. 2005, 18, 847–855. [Google Scholar] [CrossRef] [PubMed] [Green Version]
  82. Rudin-Bitterli, T.S.; Evans, J.P.; Mitchell, N.J. Geographic variation in adult and embryonic desiccation tolerance in a terrestrial-breeding frog. bioRxiv 2018. [Google Scholar] [CrossRef]
  83. Riddell, E.A.; Sears, M.W. Geographic variation of resistance to water loss within two species of lungless salamanders: Implications for activity. Ecosphere 2015, 6, 1–16. [Google Scholar] [CrossRef]
Figure 1. Experimental design illustrating the treatments applied in the aquatic and terrestrial portions of the A. maculatum life cycle and the dependent variables measured at two time points in the experiment.
Diversity 10 00068 g001
Figure 2. Mean Ln corticosterone (CORT) release rates at two time points ± SE. Triangles (▲) represent low larval density treatments and circles (•) represent high larval density treatments. Low terrestrial moisture (–– brown, solid line) and high terrestrial moisture (---- dashed, blue line) treatments were applied after the measurement of Initial CORT.
Diversity 10 00068 g002
Figure 3. Mean mass-specific growth rates across low and high terrestrial moisture treatments and low larval density (grey bars) and high larval density treatments (red bars) + SE. Letters over bars represent significant differences between moisture treatments at p = 0.05.
Diversity 10 00068 g003
Figure 4. Mean mass-specific growth rate as a function of ln of mass at metamorphosis in low moisture (–– solid, brown line •) and high moisture (---- dashed, blue line ▲) treatments.
Diversity 10 00068 g004
Figure 5. Mean percent roaches eaten across low and high terrestrial moisture treatments and high larval density (grey bars) and high larval density (red bars) + SE. Letters over bars represent significant differences between moisture treatments at p = 0.05.
Diversity 10 00068 g005
Figure 6. (A) Evaporative water loss (g cm−2 h−1) across low and high terrestrial moisture treatments and low larval density (grey bars) and high larval density (red bars) + SE and (B) Rehydration rate (g cm−2 h−1) across low and high terrestrial moisture treatments and low larval density (grey bars) and high larval density (red bars) + SE. Letters over bars represent significant differences between moisture treatments at p = 0.05.
Diversity 10 00068 g006

