Article

Assemblage and Species Threshold Responses to Environmental and Disturbance Gradients Shape Bat Diversity in Disturbed Cave Landscapes

1
Department of Biological Sciences, Texas Tech University, Lubbock, TX 79409, USA
2
Southeast Asian Bat Conservation Research Unit, Lubbock, TX 79409, USA
3
EcoHealth Alliance, New York, NY 10001, USA
4
Forestry and Environmental Science Department, Bohol Island State University, Bilar 6317, Bohol, Philippines
5
Research & Development, Bohol Island State University, Bilar 6317, Bohol, Philippines
*
Author to whom correspondence should be addressed.
Diversity 2018, 10(3), 55; https://doi.org/10.3390/d10030055
Submission received: 29 April 2018 / Revised: 18 June 2018 / Accepted: 29 June 2018 / Published: 4 July 2018
(This article belongs to the Special Issue Diversity and Conservation of Bats)

Abstract

:
Ecological thresholds represent a critical tipping point along an environmental gradient that, once breached, can have irreversible consequences for species persistence and assemblage structure. Thresholds can also be used to identify species with the greatest sensitivity to environmental changes. Bats are keystone species yet are under pressure from human disturbances, specifically landscape and cave disturbances (i.e., reduced forest cover, urbanization, hunting, tourism). We compared bat assemblages across environmental and disturbance gradients measured at 56 caves in the Philippines to identify species-specific thresholds and assess congruence among species responses. All species exhibited significant responses to one or more gradients, with 84% responding to more than one gradient. Yet mixed responses of sensitivity to some gradients but tolerance to others hindered identification of assemblage thresholds to all gradients except landscape disturbance. However, we identified credible indicator species that exhibit distinct thresholds to specific gradients and tested for differences in ecological and morphological traits between species groups with shared responses (i.e., negative or positive). Few traits were useful for discriminating the direction of a species response, with some exceptions. Species that responded positively to increased landscape disturbance and hunting had greater body mass, whereas species that responded negatively to mining emitted higher peak call frequencies.

1. Introduction

Ecological thresholds are critical points along an environmental or disturbance gradient at which an ecosystem transitions from one state to another, often in response to changes in environmental conditions mediated by human disturbance [1,2,3]. Crossing these thresholds can lead to rapid, irreversible shifts in the integrity and function of an ecosystem and the wildlife diversity it supports [1,4]. Consequently, ecological thresholds have been used to set regulatory limits on human disturbance to maintain a desired ecosystem state [5,6]. However, thresholds are typically site-specific, and can be difficult to detect at the community level in species-rich assemblages characterized by non-linear, multifaceted responses of individual species [1,7]. Within a community, while many species experience population declines (‘losers’) [8], some species may be relatively tolerant of increasing human disturbance, or even benefit from novel environmental conditions or resources (‘winners’). Ecological thresholds at the community level are based on aggregate responses of both ‘winner’ and ‘loser’ species, thereby obscuring underlying species-specific responses [9]. Thus, management policies based on community-level thresholds may fail to protect all species in the community [2].
One solution is to analyze species-specific responses, particularly of species sensitive to human disturbance (‘losers’), as well as aggregate responses of ‘winner’ and ‘loser’ species to signal community-level thresholds [7,9]. Moreover, aggregating species with shared responses to environmental and human disturbance gradients allows for identification of shared ecological and morphological traits [10,11] that can predict vulnerability to specific gradients [12,13]. For instance, the response of bee species to isolation from natural habitat and agricultural intensification varies based on nesting guilds, with above-ground nesters more negatively affected by landscape changes than below-ground nesters [11]. However, species are rarely exposed to human disturbance independent of other co-occurring and potentially synergistic disturbances, both environmental and human-mediated. This confounds efforts to identify ecological thresholds, both at the community- and species-levels, as well as the trait combinations of ‘winners’ and ‘losers’ that might predict threshold responses.
Bats are the second most speciose mammalian order, but populations are declining in 80% of species [14]. Half of all bat species rely on caves as roosts, where they are commonly subject to multiple disturbances, notably resource extraction (e.g., guano, limestone), cave tourism and vandalism, bat hunting, and loss of foraging habitats surrounding caves [15,16,17,18]. Cave-roosting bat species are ecologically and morphologically diverse. Consequently, differential sensitivity to disturbance is anticipated, and may map to differences in ecological and morphological traits. For example, many Old World insectivorous bat species exhibit adaptations of wing morphology and echolocation signal designs [19,20] that equip them to forage in the dense vegetation of unmodified forests [21]. However, these adaptations (e.g., low wing loading and high-frequency echolocation calls) greatly constrain foraging success in the more open habitats that occur when forests are cleared [22]. Consequently, forest-adapted species may be differentially susceptible to land-use change around caves [23]. Similarly, hunters typically target large-bodied species that roost colonially in large aggregations [24], conferring greater risk to species that share those traits and behaviors.
Phelps et al. [16] reported significant shifts in the composition and structure of cave-roosting bat assemblages in the Philippines, driven by diverse human disturbances. Moreover, species-specific responses to the different disturbance types was detected. Here we extend on this prior work to detect discrete thresholds for cave-roosting bat species and assemblages subject to diverse environmental and disturbance gradients, and to identify indicator traits that distinguish ‘winner’ from ‘loser’ species. We compared bat assemblages along six environmental and disturbance gradients common to cave ecosystems to: (1) identify species-specific threshold responses to multiple gradients; (2) assess congruence among species responses to identify thresholds that define significant shifts in assemblage composition; (3) identify indicator species that exhibit a significant positive or negative response to a gradient; and (4) differentiate ecological and morphological traits (e.g., body mass, wing morphology) between response groups: ‘winners’ and ‘losers’. We predicted that the occurrence and abundance of cave-roosting bat species would vary markedly across gradients owing to the ecological divergence among species. Consequently, we expected that incongruence in species responses would hinder identification of ecological thresholds at the assemblage level, with the exception of landscape disturbance as this was shown to influence assemblage composition in our previous work [16]. Moreover, we expected that ecological traits would differ between tolerant (‘winner’) and sensitive (‘loser’) species.

2. Materials and Methods
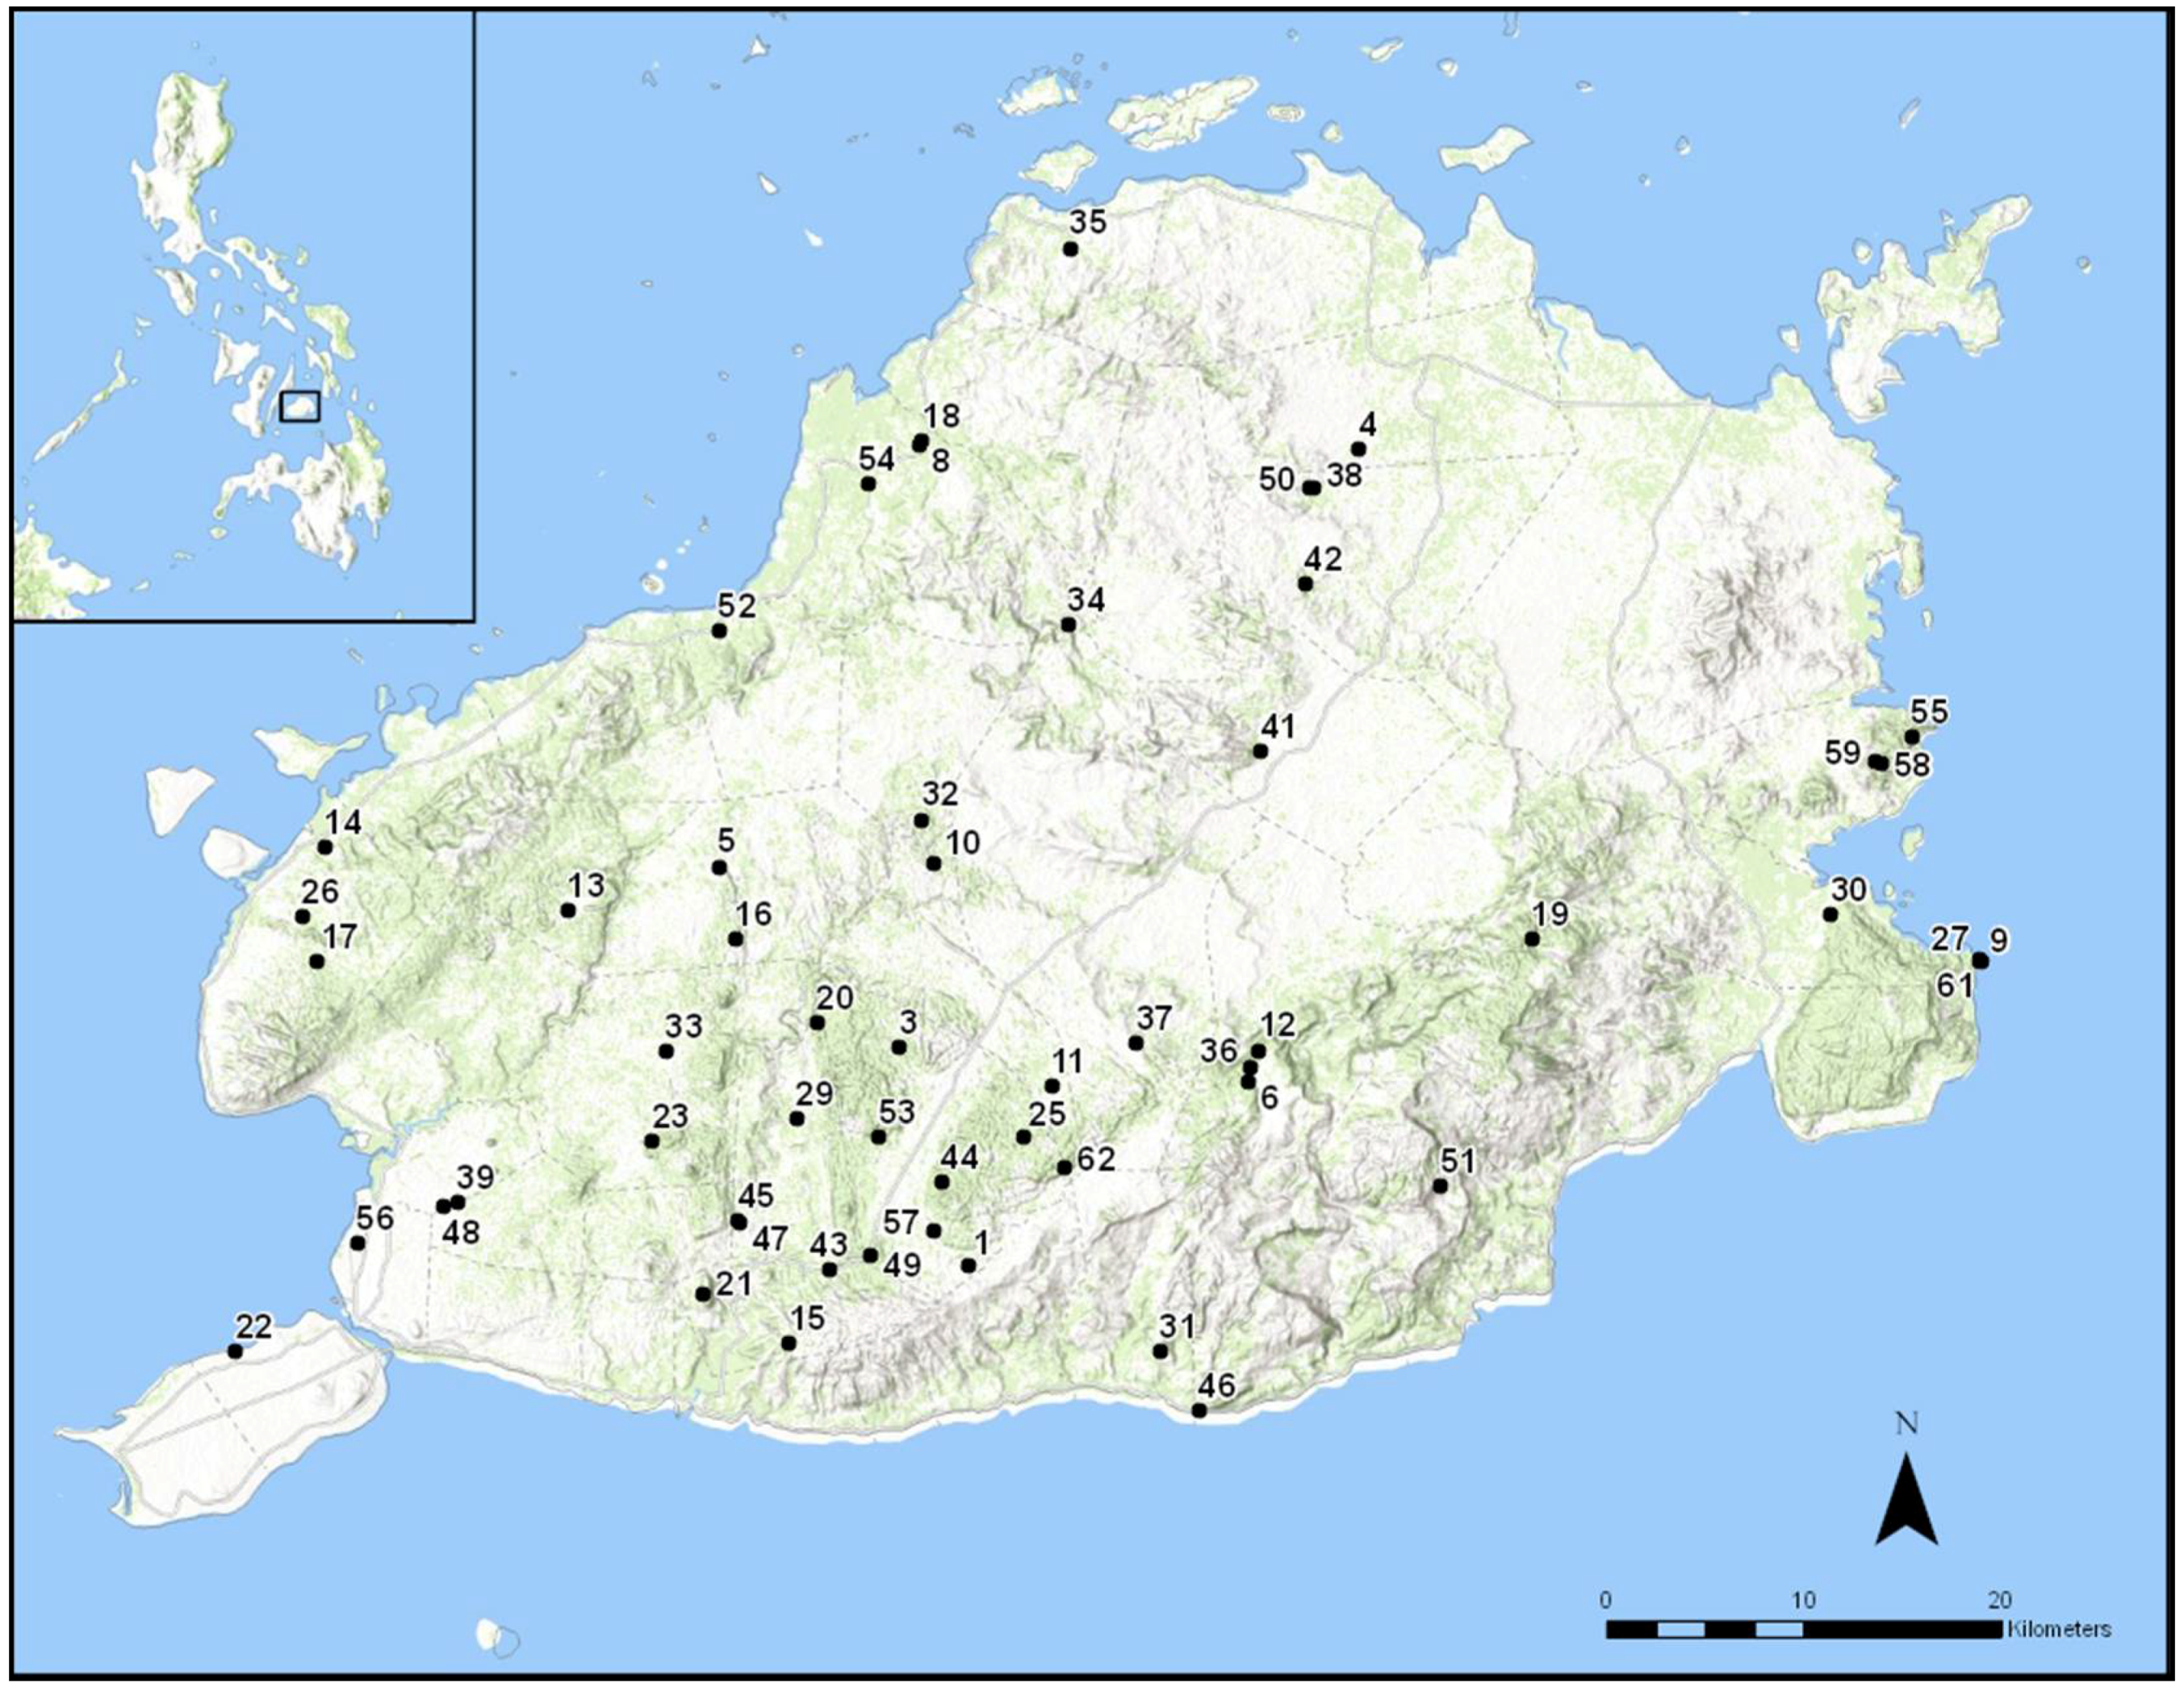
2.1. Study Area

Our study was on Bohol Island, a 4100 km2 karst-rich island located in the central Philippines. Human disturbance in and around Bohol’s caves has steadily increased over the past century, with caves frequently developed for tourism or exploited by extractive industries. Wet-rice cultivation and slash-and-burn agriculture has replaced an estimated 97% of the island’s native forests [25]. We selected 56 caves on Bohol Island (Figure 1) exposed to diverse gradients of human disturbance.

2.2. Environmental and Human Disturbance Gradients

Caves were surveyed between July 2011–December 2011 and June 2012–June 2013. We used standard cave survey techniques [26] and a novel disturbance index to assess environmental and human disturbance factors (Table 1) at each cave (see [16] for detailed methods and raw data). Gradients encompass a gradual change in a suite of correlated environmental and human disturbance factors across space. Thus, we used principal component analysis (PCA) to condense our dataset of 18 environmental and human disturbance factors (Table 1) measured at 56 caves into principal component axes that explain the greatest variation among caves. We identified six environmental and disturbance gradients based on principal component axes that explained 74% of variance among surveyed caves (Table 1; Table S1). Landscape disturbance (explained 30.2% of variance) represents a gradient of increased non-forested habitat, urbanization and road development coupled with decreased distance to access (e.g., trails, roads). Cave complexity (13.2%) characterizes superior environmental conditions, specifically greater available roosting area, structural variability, number of entrances, and range in temperature. Mining (10.7%) represents a gradient comprised of both environmental and human disturbance factors, specifically increased mining (of phosphate and/or limestone) and dumping of household waste along with limited range in temperature and humidity. Cave development (8.2%) embodies a gradient of increased modification of the cave and human visitation with limited resource extraction (e.g., cave tourism). Resource extraction (6.2%) represents a gradient of increased extraction of resources (e.g., water, guano) and human visitation in caves located within protected areas. Hunting (5.6%) is associated with greater bat hunting and dumping of household waste but limited mining in caves within the boundaries of protected areas.

2.3. Bat Sampling

We captured bats using mist nets placed across cave entrances and inside passages for two consecutive nights at each cave. Captured individuals were identified to species-level [30], with age and reproductive status assessed, and weight (g) and forearm length (mm) measured prior to release. All methods were in strict accordance with guidelines set forth by the American Society of Mammalogists [31] and were approved by the Texas Tech University Animal Care and Use Committee (ACUC 10015-04, 13031-04).
Raw count data was corrected for differing trapping effort among caves (i.e., number of hours the net(s) were open), yielding adjusted capture rates (individual/hour) for each species at each cave. As recommended by Baker and King [9], data were log10(x + 1)-transformed to reduce the influence of species with highly variable abundance.

2.4. Ecological and Morphological Traits

We selected nine traits (five categorical, four quantitative) that reflect the ecological and morphological diversity among bats that may influence a species’ response to a gradient (Table S2). We focused on traits that describe foraging ecology (i.e., likely to determine responses to landscape disturbance), dependence on caves (i.e., confer sensitivity to cave development, mining, resource extraction), and vulnerability to hunting. Species were also categorized as Philippine endemics or regionally widespread based on current knowledge of their geographic distribution in Southeast Asia [32,33].

2.4.1. Foraging Ecology

Foraging success in insectivorous bats is largely governed by traits that determine their ability to detect, pursue, and capture insect prey, namely echolocation signal design and wing morphology. Trait values are strongly influenced by the challenge that proximity to vegetation or “clutter” poses for flight and echolocation [34,35], so most paleotropical bats fall into one of three ensembles based on foraging space relative to clutter [22]. Old World fruit bats (family Pteropodidae) do not use high-frequency echolocation and rely on vision and olfaction to find fruit and flower resources but are similarly influenced by vegetative clutter and the spatial scale of fruit distribution and availability. Generally, land-use change results in replacement of vegetatively complex foraging habitats of forest with simpler, more open habitats (e.g., crops, villages) and increases distances among resource patches. Dietary niche was categorized into two broad categories, insectivorous or phytophagous (including nectarivorous and frugivorous species) [33,36,37]. Foraging space was categorized as clutter (i.e., species that exploit prey on or close to vegetation in forest interiors with dense background obstacles), semi-clutter (i.e., species that forage at forest edges, in small tree-fall gaps, or over streams), and open (i.e., species that forage in uncluttered space, such as above the forest canopy) [22] based on published information.
Alcohol-fixed specimens collected during our study were used to quantify morphological traits that influence flight. Aspect ratio and wing loading were calculated following equations provided in Norberg and Rayner [34], respectively: A = B2/S, where A is aspect ratio, B is wing span (m) and S is wing area (m2); and C = Mg/S, where C is wing loading, Mg is weight (body mass times gravitational acceleration, g) and S is wing area (m2).
Three-second recordings of echolocation calls were taken from captured bats while in the hand (i.e., Hipposideros, Rhinolophus) and during release using a time expansion detector (Pettersson D240X), with outputs recorded to a digital audio recorder, and analyzed using BatSound4. We identified the frequency at which most energy was expended during the call sequence based on the power spectrum; we considered this the peak frequency (kHz). We compared and supplemented our data using published echolocation records from Bohol Island (see [38]).

2.4.2. Cave Dependence and Hunting

Large-bodied bat species that roost colonially in dense aggregations may be a target for increased hunting pressure, particularly for species that roost in caves [24,39]. Species were assigned as obligatory cave-roosting species if they have only been documented roosting in caves or facultative cave-roosting if they have been reported to use roosts other than caves (e.g., human-made structures, tree hollows) [33,37]. We categorized colony size as small (<100 individuals), medium (100–1000 individuals), and large (>1000 individuals). Categorical traits were refined based on personal observation during this study, if necessary. For example, colony size for Taphozous melanopogon has been reported to range from 10 to 15,000 individuals across Southeast Asia, but we selected a medium colony size because we never observed more than 500 individuals congregated together during our cave surveys. Mean body mass for each species was averaged across all adult, non-reproductive individuals captured in our study.

2.5. Data Analysis

To identify species threshold responses to each of our identified environmental and human disturbance gradients, we used the Threshold Indicator Taxa ANalysis—TITAN, a program that combines change-point analysis and indicator species analysis [9]. TITAN identifies abrupt, non-linear changes (i.e., change-points) in occurrence frequency and relative abundance along each gradient for each species and assesses congruence among species change-points as an indication of assemblage thresholds [9]. We performed TITAN analysis using published R scripts with default settings [9].

2.5.1. Species-Specific Responses to Gradients

To identify species-specific change-points (thresholds) and responses (negative or positive) across a continuous gradient, TITAN uses indicator value (IndVal) scores derived from indicator species analysis [40]. IndVal scores represent the strength-of-association between a species and a defined response group, with species groupings traditionally set a priori across categories of environmental conditions (e.g., levels of forest fragmentation) [40]. However, group classification in TITAN is initially unknown and is determined instead based on abrupt changes in the relative frequency of occurrence and abundance of a species across a continuous environmental gradient [9]. Specifically, occurrence of a species was ordered along each gradient with candidate change-points selected at midpoints between occurrences. Two IndVal scores are produced at each candidate change-point (i.e., one for each side of the candidate change-point) that signifies the strength-of-association based on changes in species abundance and occurrence. A larger IndVal score on the left side of the candidate change-point indicates a negative response, while larger scores on the right side indicate a positive response [9]. Greater differences in species association with a specific side of a candidate change-point (i.e., left or right) results in a larger IndVal score, with the largest score at a change-point and the direction of the response (i.e., negative or positive) retained for comparison with all other candidate change-points along the gradient. The change-point with the maximum IndVal score among all candidate change-points is considered the ecological threshold for that species, with the direction of response at the identified threshold used to assign species into negative or positive response groups. We considered a species to be significantly associated with a response group when IndVal scores had associated p-value < 0.05. Bootstrapping procedures were used to estimate uncertainty around the threshold location and consistency in the directionality in species response (i.e., negative or positive).

2.5.2. Identification of Indicator Species

We assessed species responses as credible indicators of a gradient using diagnostic indices, specifically purity and reliability, based on 500 bootstrap replicates [9]. Purity is the proportion of bootstrap replicates that assign a species to the same response group as initially observed, and reliability is the proportion of bootstrap change-points with IndVal scores with p < 0.05 [9]. We considered species with purity > 0.90 and reliability > 0.75 to be credible indicator species for a particular gradient.

2.5.3. Assemblage-Level Responses to Gradients

Congruence in change-point location among species in a response group (i.e., negative or positive) was used as evidence of assemblage-level thresholds, with an assemblage threshold for each response group. IndVal scores were used to identify assemblage thresholds, with scores standardized to z-scores to facilitate cross-species comparison [9]. Species were grouped according to the direction of their response: z− group had a negative response and z+ group a positive response. IndVal scores for the z− and z+ scores at each point along the gradient were summed. The negative and positive assemblage thresholds correspond to the value along the gradient where the sum(z−) or sum(z+) scores showed a distinct peak, respectively. Strong responses by multiple species to the same gradient value result in a distinctly sharp peak with large sum(z) scores, whereas weak responses result in lower sum(z) values without a distinct peak [9]. Uncertainty around the estimated assemblage thresholds was assessed by bootstrapping the original data and recalculating the change-points, and is expressed as confidence limits (i.e., quantiles of the change-point distribution).

2.5.4. Comparison of Ecological Traits

Species with similar responses to a gradient were grouped as: (i) species with negative responses based on decreased abundance (z− group); and (ii) species with positive responses based on increased abundance (z+ group). We tested for potential associations between species responses to gradients and ecological traits (i.e., do response groups identified by TITAN differ in their traits?). Differences between response groups for each trait were tested independently by using a series of Chi-square (χ2) and Kruskal–Wallis (H) tests. Because of a lack of peak frequency data for three non-echolocating species in the family Pteropodidae (Table S2), we were unable to use multivariate methods to assess trait differences between groups. Specifically, Chi-square tests were performed to assess differences in categorical traits (i.e., endemism, dietary niche, foraging space, roost dependence, and colony size), while differences in quantitative traits (i.e., aspect ratio, wing loading, body mass, and peak call frequency) were assessed using Kruskal–Wallis tests. If significant differences were detected by the Kruskal–Wallis tests (p < 0.05), post hoc Dunn pairwise comparison tests were implemented using the package dunn.test [41]. All analyses were performed using R 3.1.2 [42], with unadjusted p-values reported.

3. Results

We captured 6823 bats, excluding recaptured individuals, of 21 species in seven of the eight families documented in the Philippines. However, two species, Chaerephon plicatus and Cynopterus brachyotis, were captured in fewer than three caves, making their occurrence too infrequent to estimate interpretable results [9], and were excluded from further analyses.

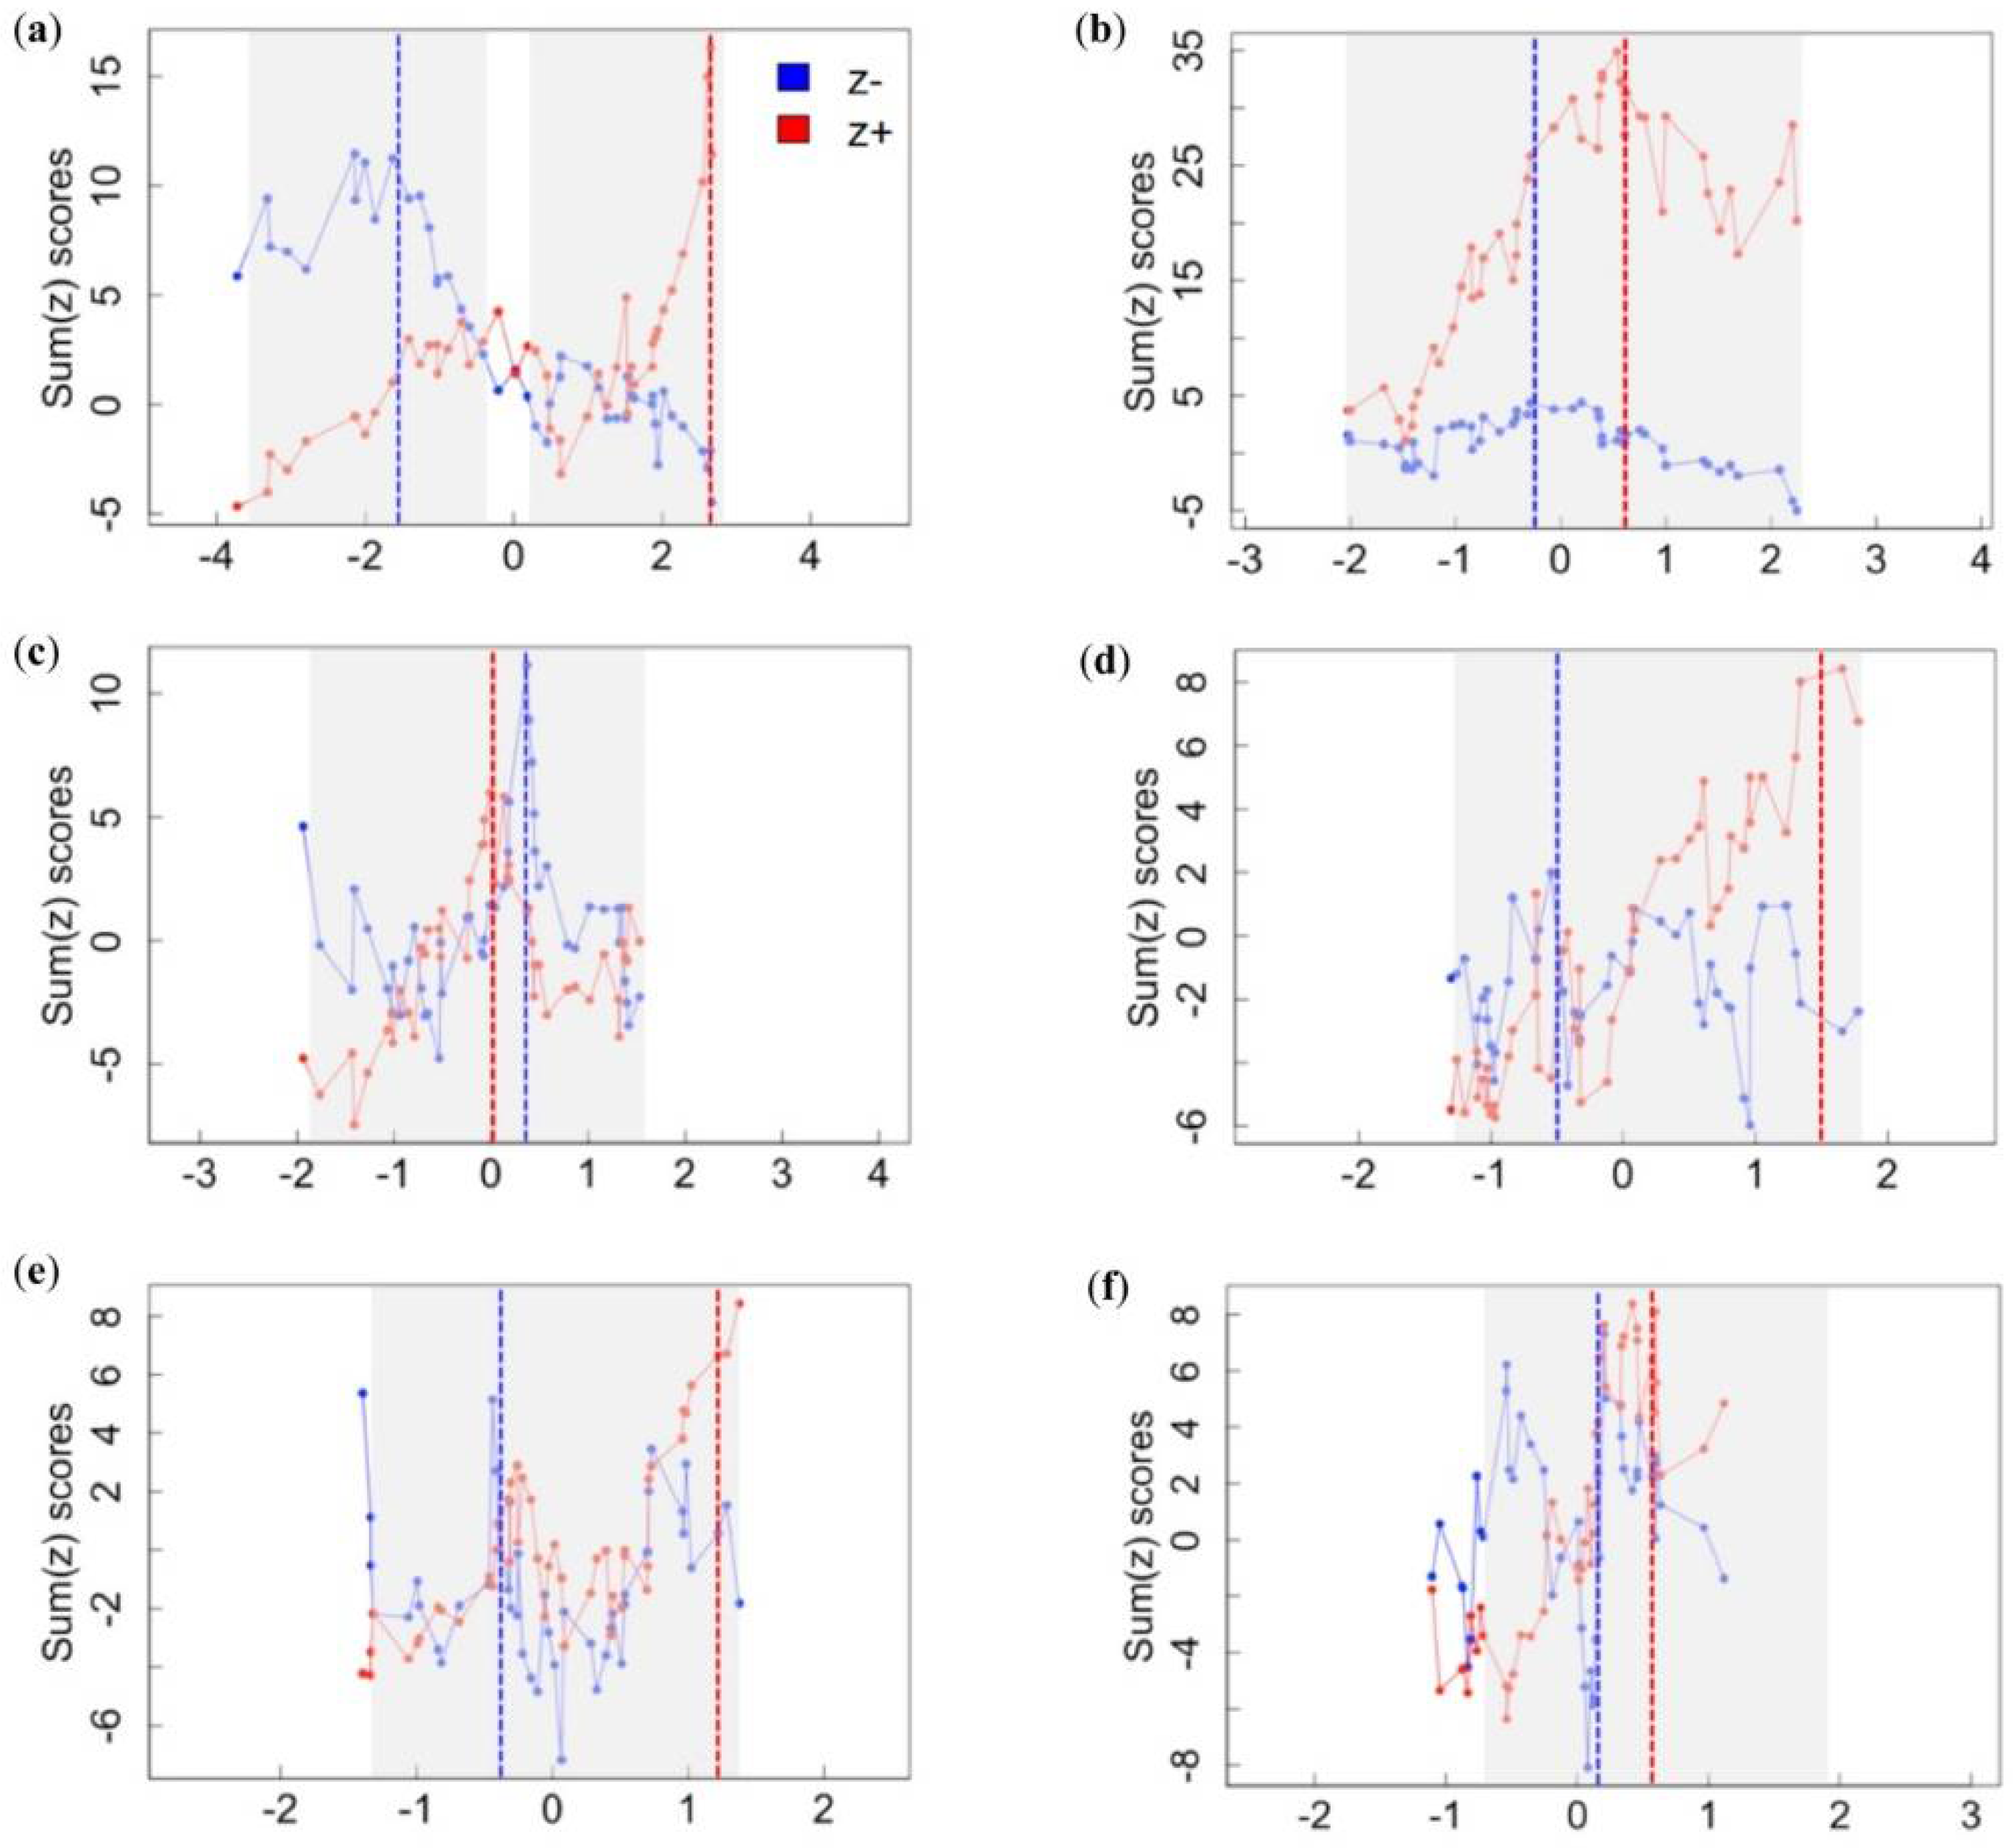
3.1. Assemblage-Level Responses to Gradients

For each gradient, TITAN identified two assemblage-level thresholds that represent the change-point with the strongest congruent response among species (i.e., largest sum(z) score) in a response group (Table 2; Figure 2). However, well-defined peaks in the plotted distribution of sum(z+) and sum(z−) scores were not apparent along any gradient, with the exception of landscape disturbance (Figure 2). Principal component (gradient) values for landscape disturbance ranged from −4.53 to 4.94, indicating that the identified thresholds for the negative response group (sum(z−) = −1.53) and the positive response group (sum(z+) = 2.66) are quite distinct from one another along the gradient. Furthermore, confidence limits of the bootstrap distributions of each response group do not overlap along the gradient of landscape disturbance. Conversely, no clearly defined assemblage-level thresholds were observed for either response groups along any other gradients (Figure 2). Uncertainty in threshold estimates are reflected in the large, overlapping confidence limits associated with each gradient (Table 2; Figure 2). As such, these thresholds should be interpreted with caution.

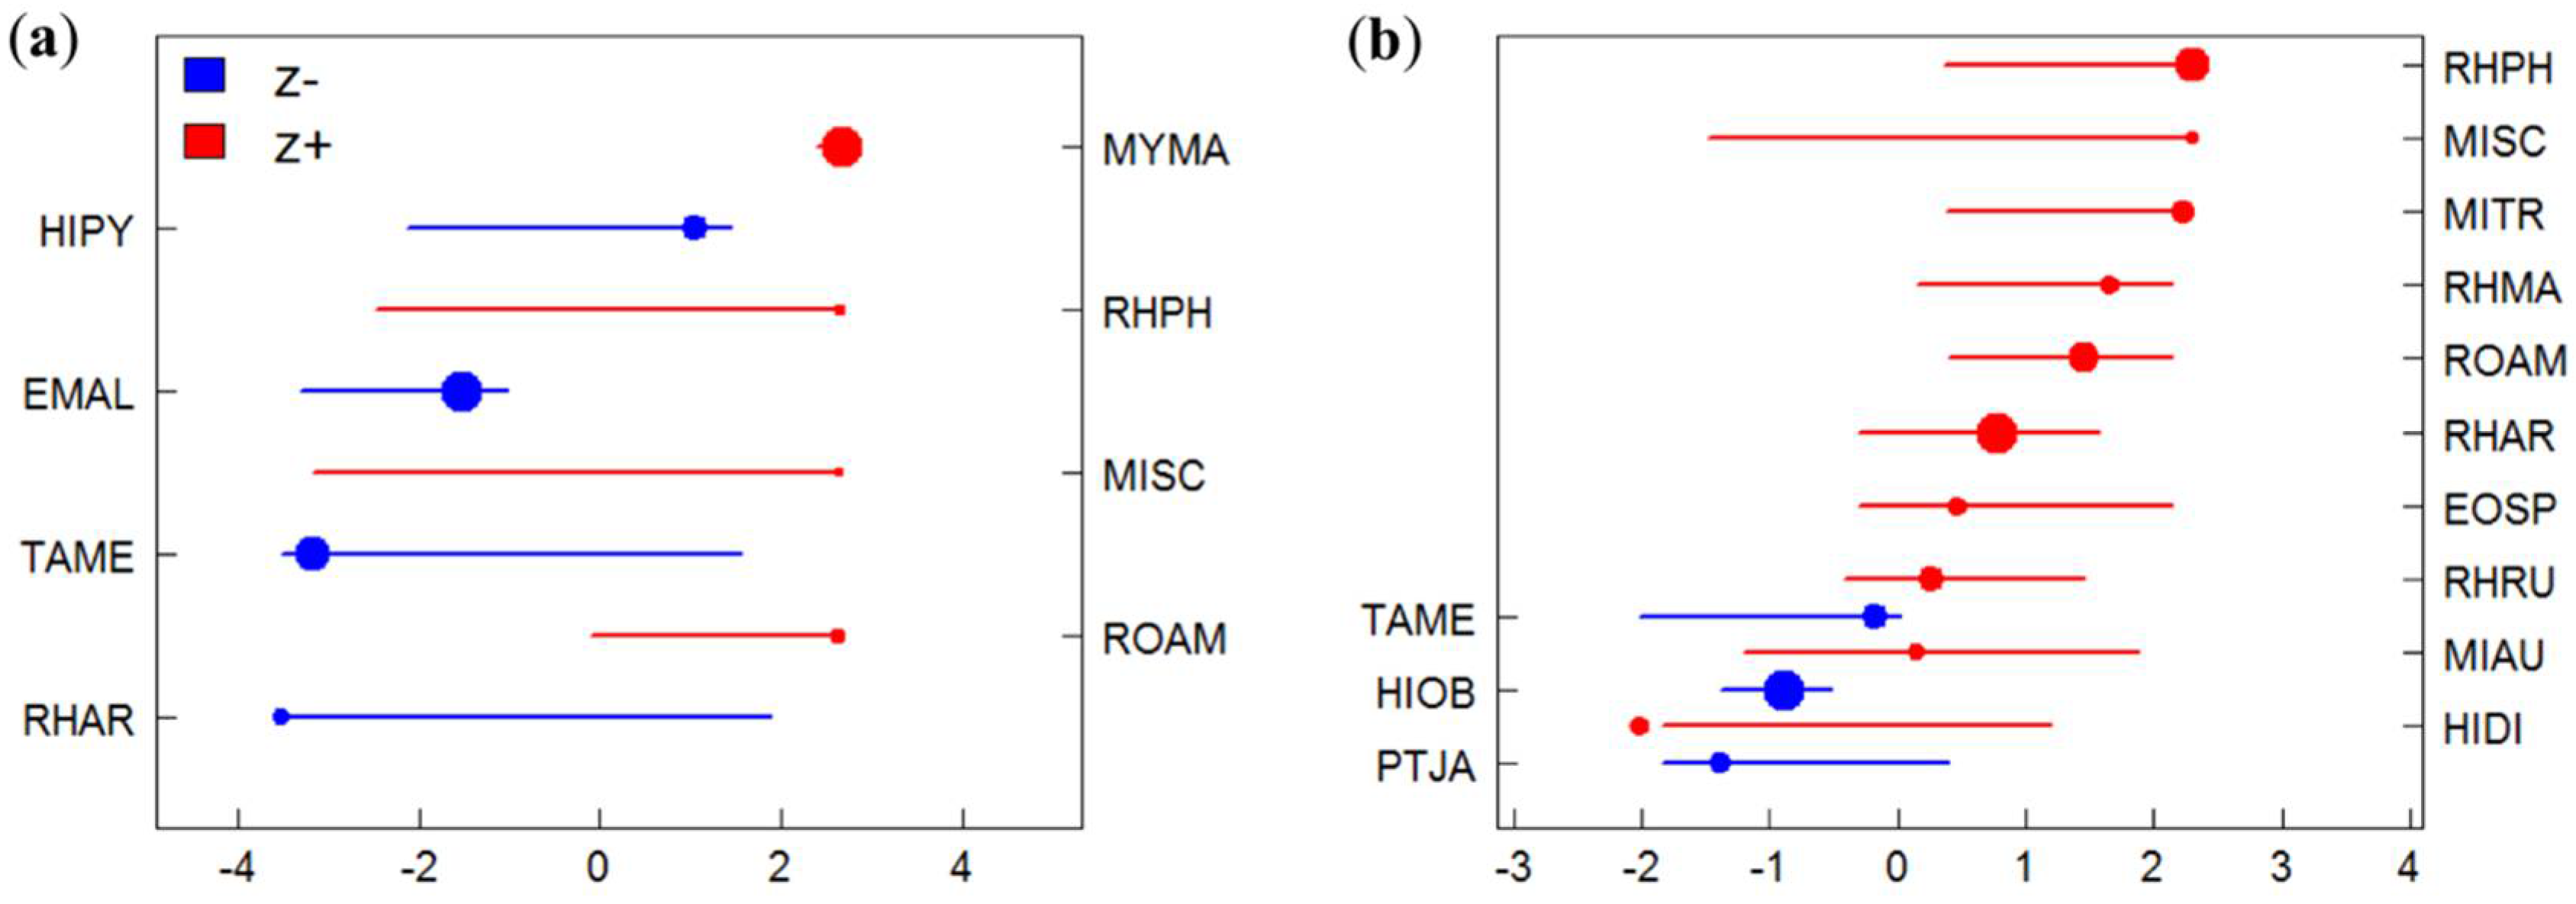
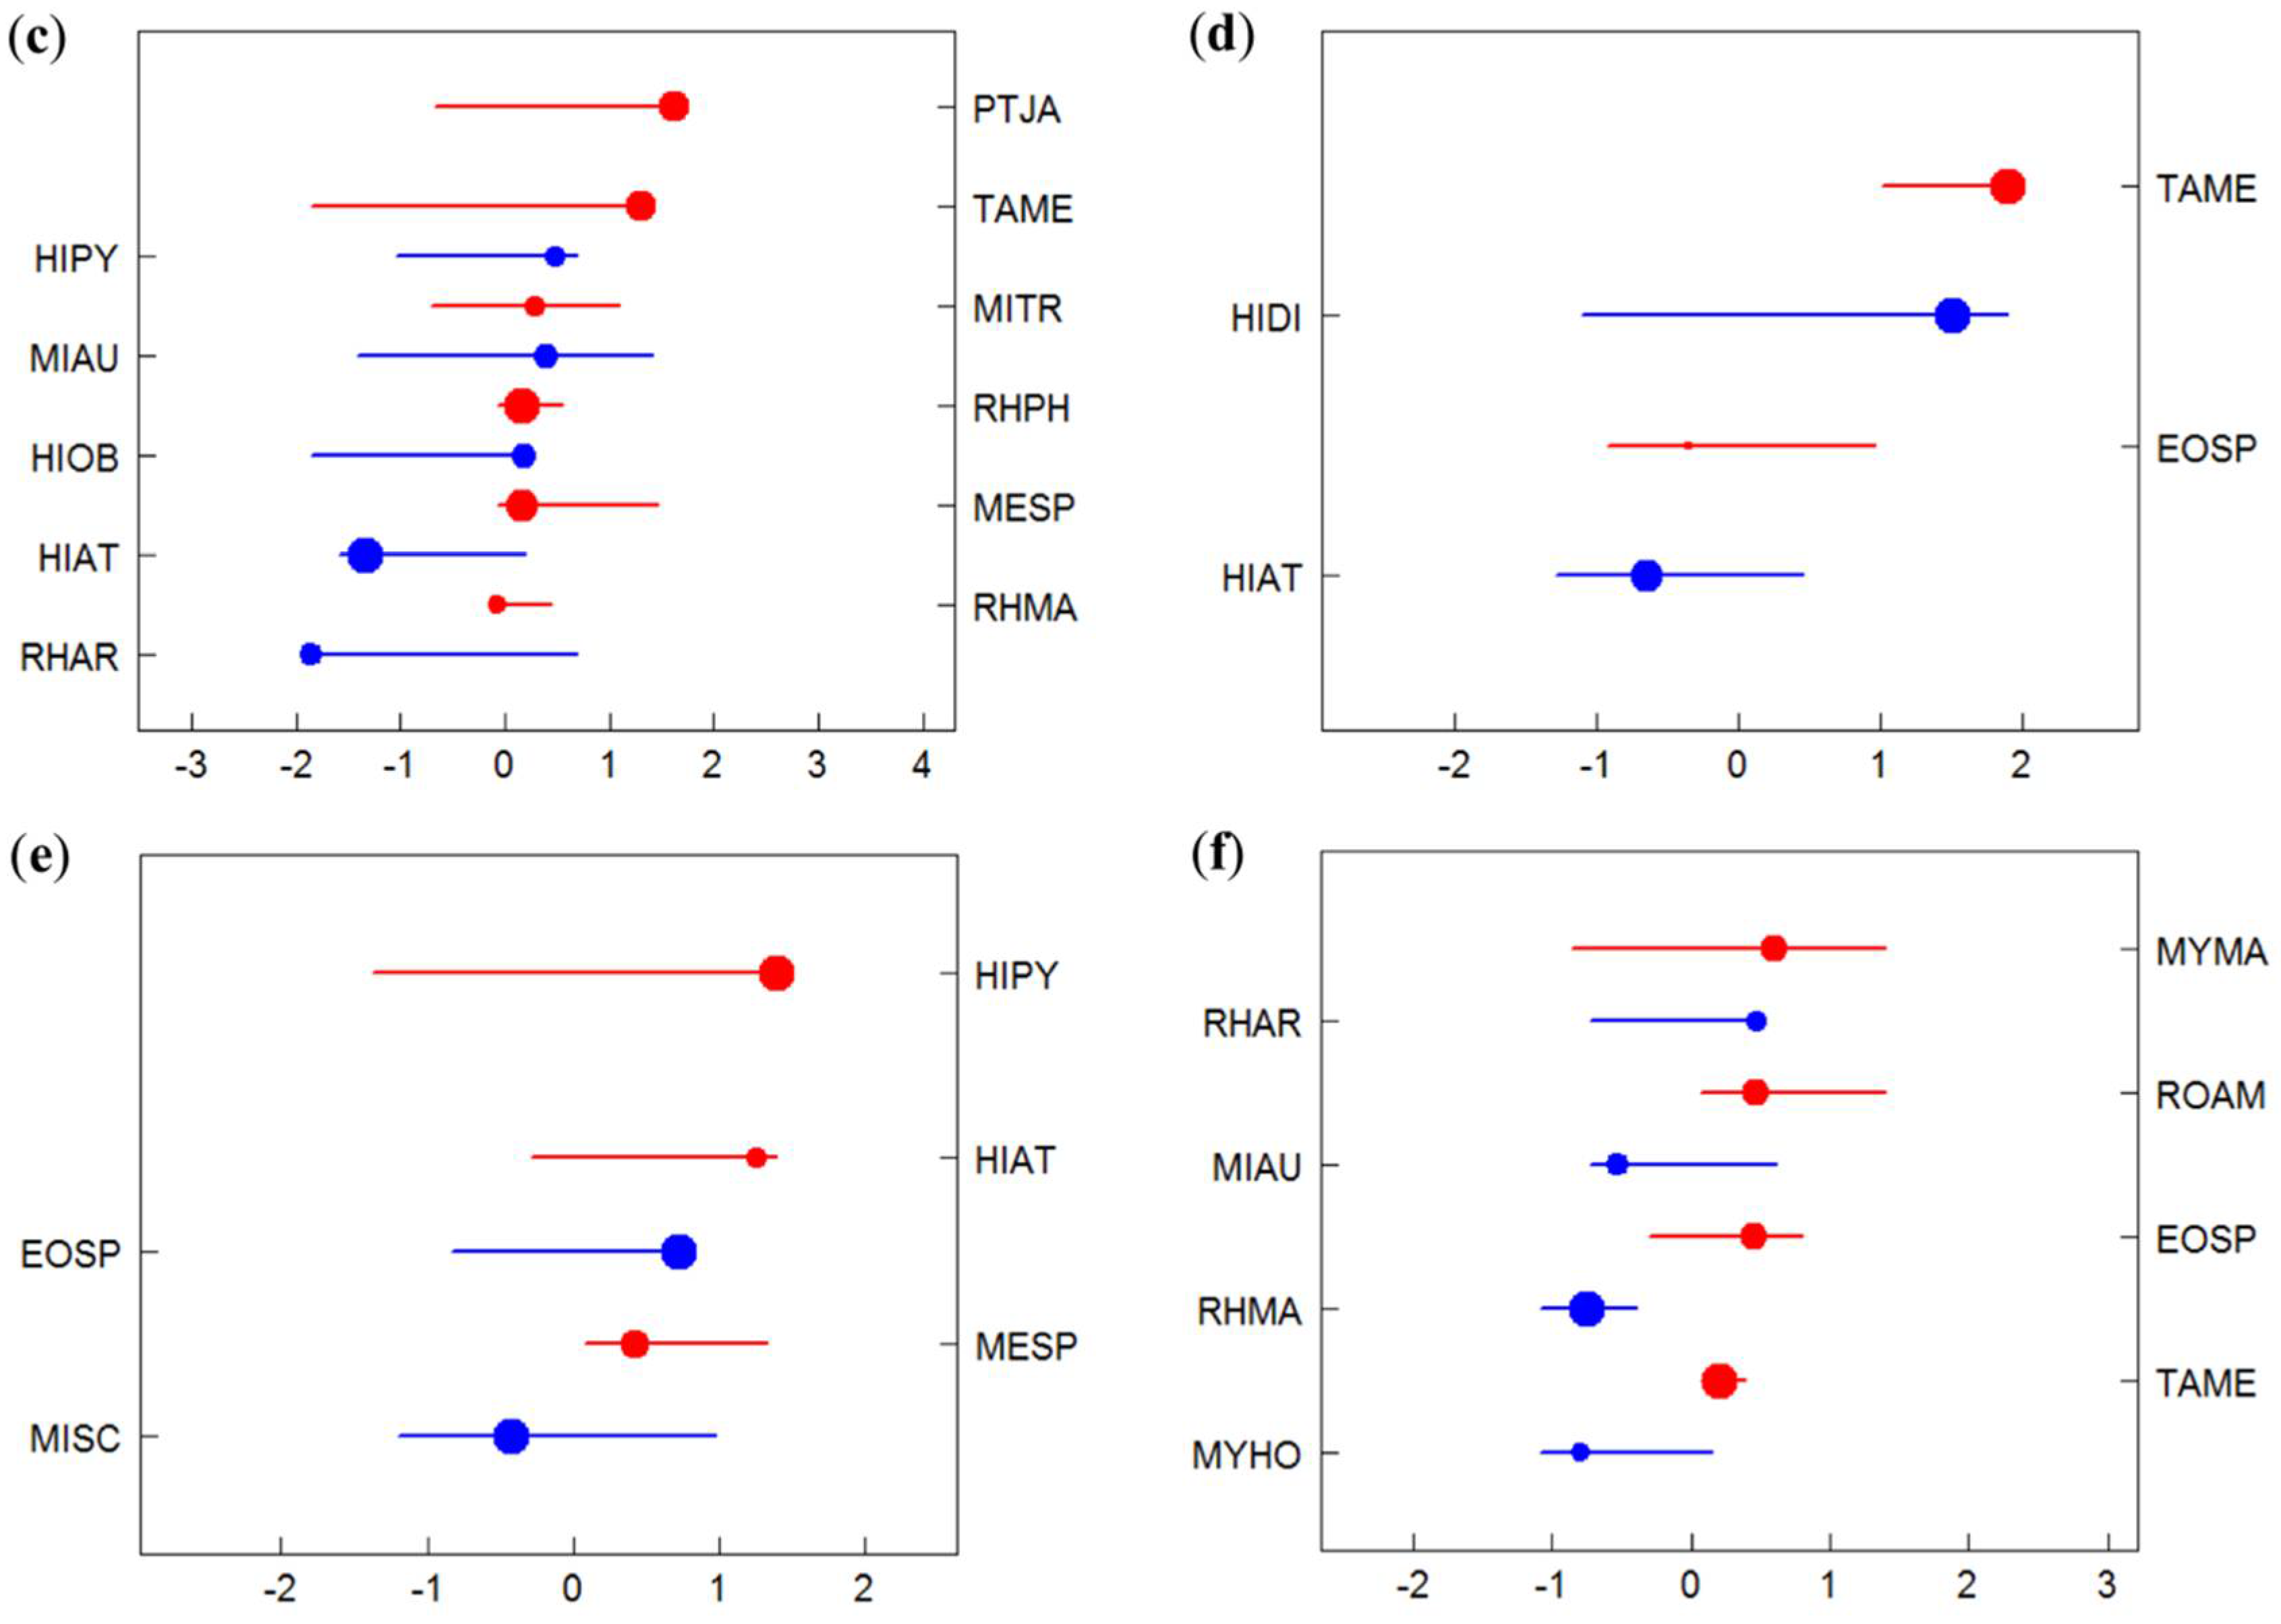
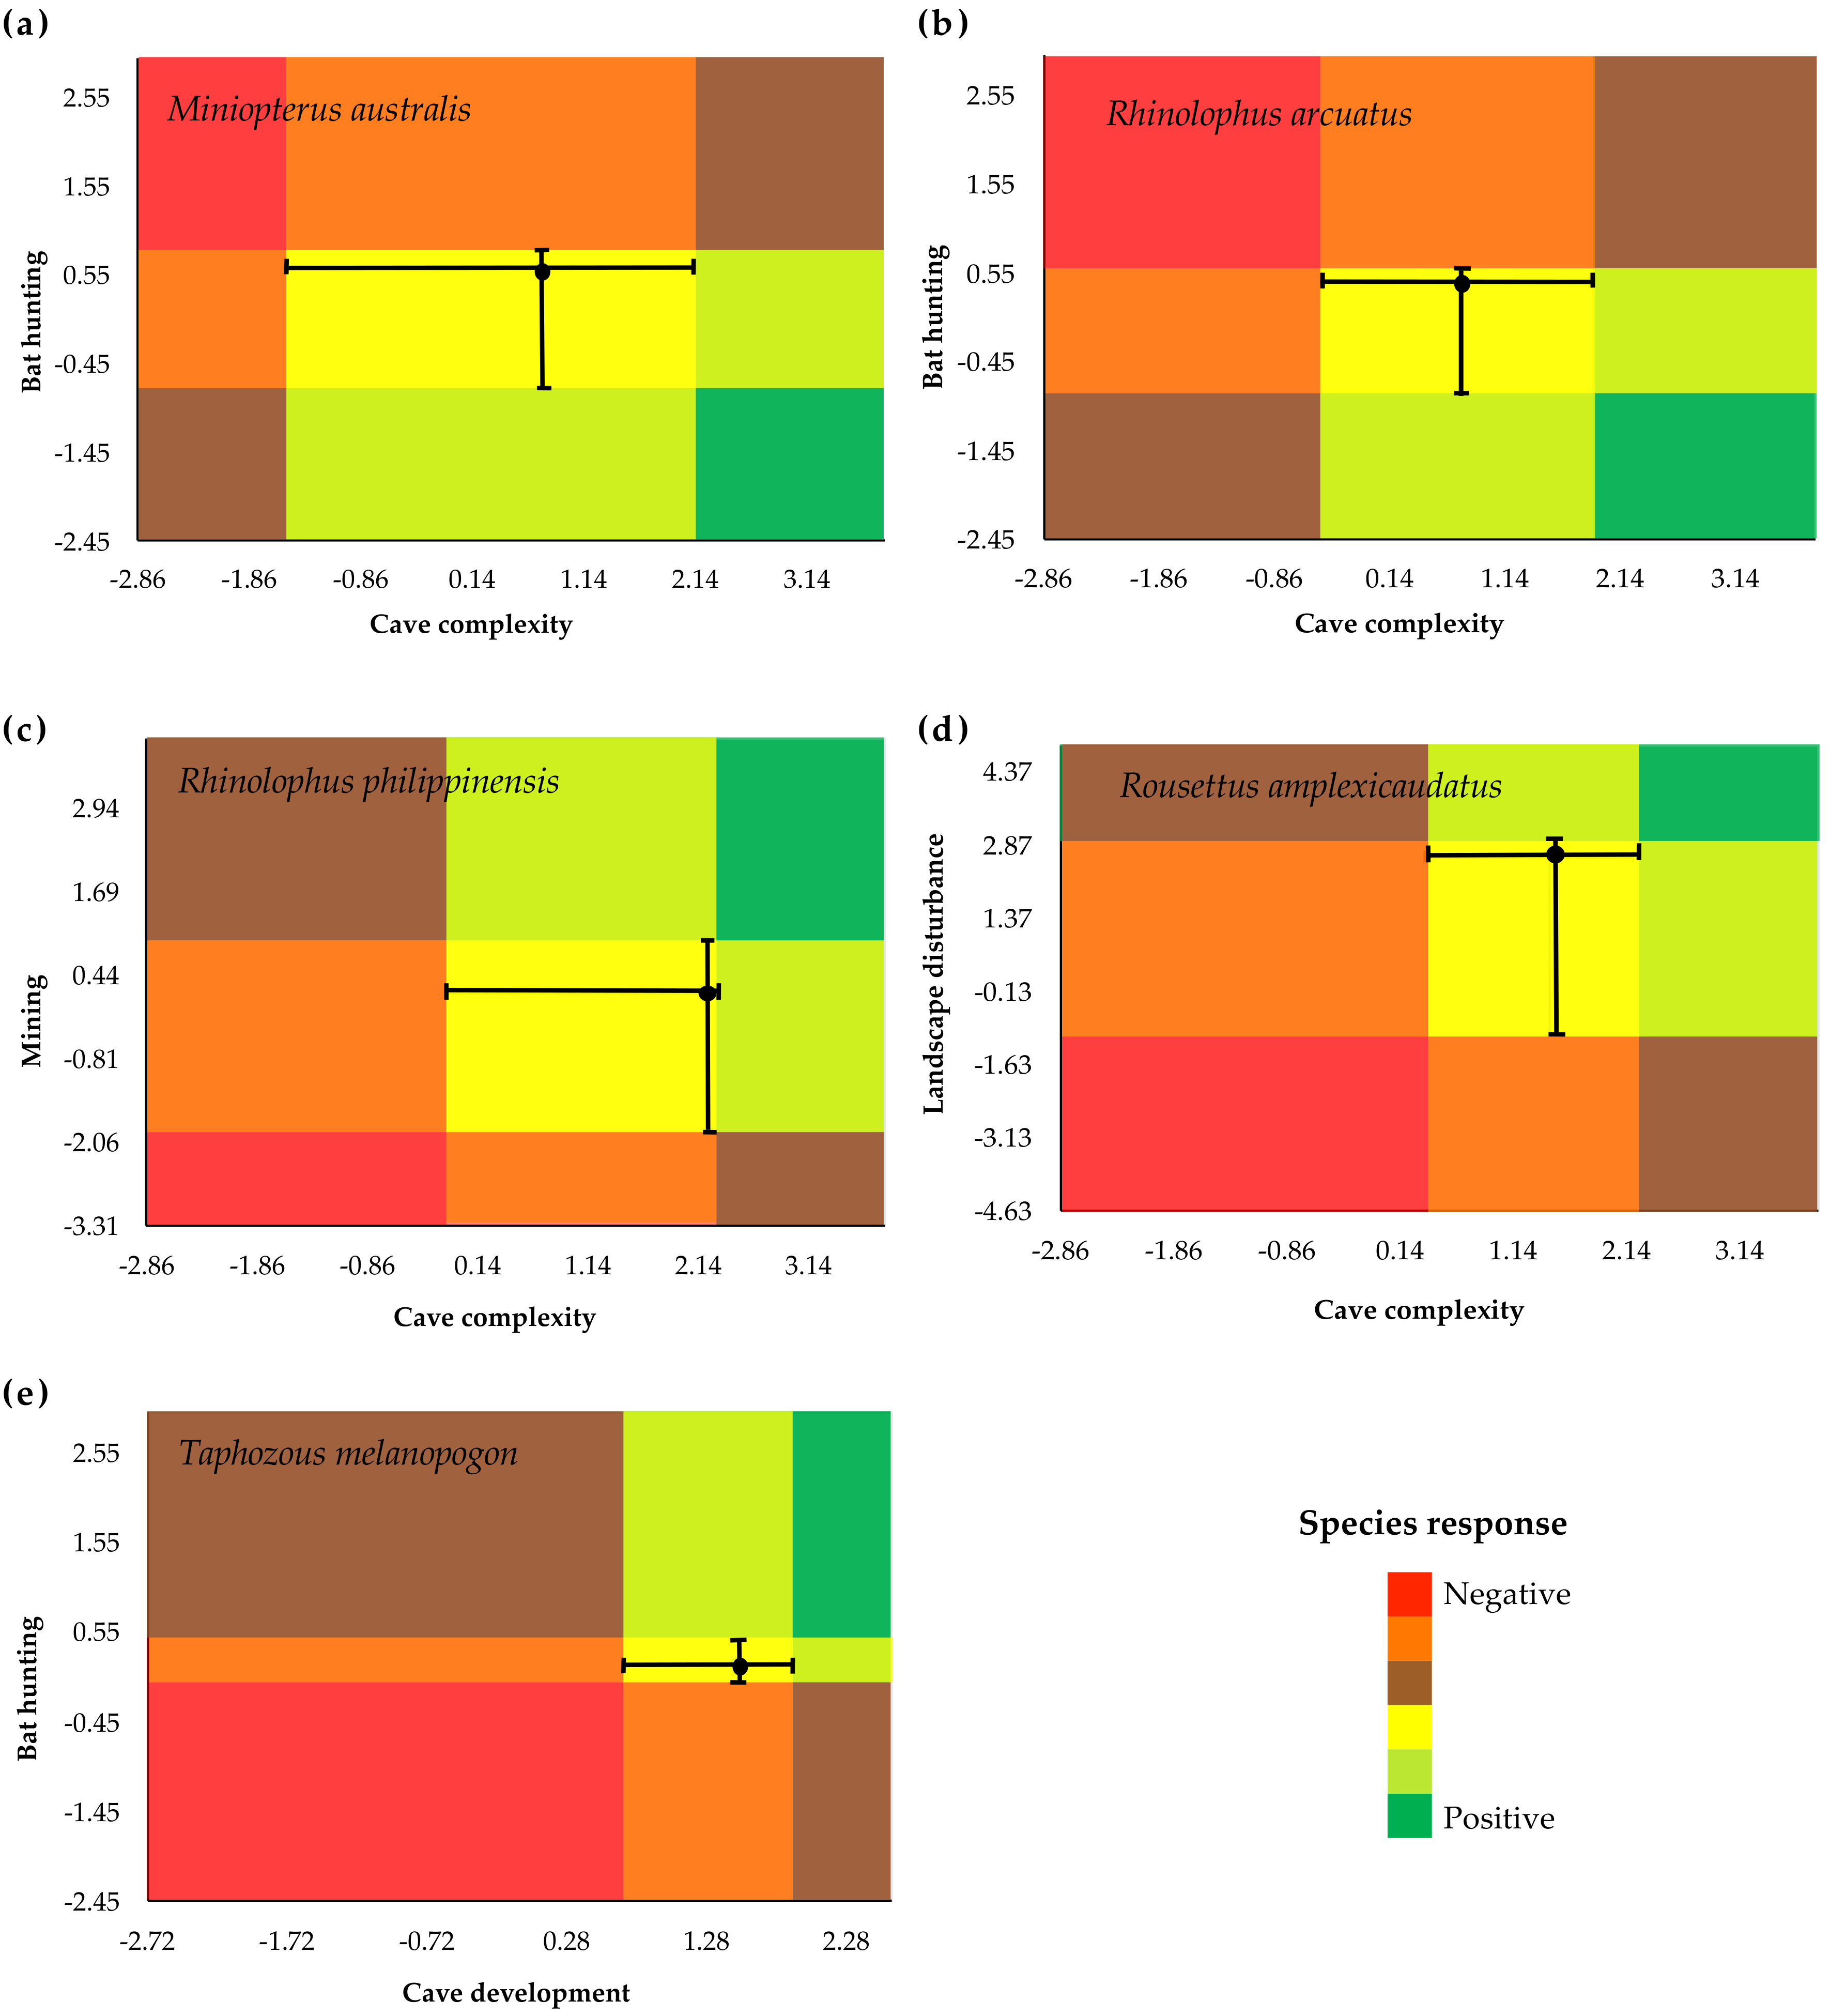
3.2. Species-Specific Responses to Gradients

In general, all cave-roosting bat species exhibited threshold responses to at least one gradient (Figure 3, Table S3). Sixteen species exhibited significant responses to more than one gradient based on species indicator analysis (IndVal scores with p-value < 0.05), with only Emballonura alecto, Myotis horsfieldii, and Rhinolophus rufus exhibiting threshold responses to only one gradient. Conversely, T. melanopogon exhibited significant responses with defined threshold values along five (out of six) gradients. However, T. melanopogon did not consistently identify with a response group (either z+ or z−) across gradients, but instead displayed mixed responses of sensitivity (z− group) to some environmental and human disturbance gradients (i.e., landscape disturbance and cave complexity) but tolerance (z+ group) to others (i.e., mining, cave development, and bat hunting).
Along the gradient of landscape disturbance, TITAN identified eight out of 19 species with significant IndVal scores (p > 0.05) (Figure 3, Table S3). Four species composed the negative response group (z−, ‘losers’), those species that decrease in relative frequency of occurrence and abundance, with threshold values for these species ranging from −3.52 to 1.06. Another four species responded positively to increased landscape disturbances (z+, ‘winners’) and increased in occurrence and abundance, with threshold values ranging from 2.63 to 2.68. Cave complexity represents a gradient in cave dimensions and microclimate; therefore, caves with high values along this gradient would provide more roosting opportunities due to greater surface area, structural variability, temperature range, and entrances. As such, ten out of 19 species responded positively to increasing cave complexity, with threshold values ranging between −2.01 and 2.30. Only three species were significantly associated with low cave complexity, with threshold values between −0.18 and −1.38. Along the mining gradient, six species responded positively to increased mining activity (z+ thresholds −0.07 to 1.63), while another five species responded negatively (z− thresholds −1.85 to 0.47) (Figure 3). Few species exhibited significant responses to gradients of cave development and resource extraction. Four out of 19 species declined in occurrence and abundance in caves with high hunting activity, while another four species increased. Not surprising, Eonycteris spelaea and Rousettus amplexicaudatus, two species commonly targeted during hunting, were abundant in heavily hunted caves. It is apparent that hunting activities are highest when these two species are present; however, two non-target species had a positive response to hunting (Figure 3). Another four species were negative indicators (z−) of hunting, decreasing in occurrence and abundance at thresholds ranging from −0.79 to 0.46.

3.3. Identification of Indicator Species

We considered species that exhibited significant responses to a gradient (IndVal scores with p-value < 0.05) and with values for purity > 0.90 and reliability > 0.75 to be credible indicator species. At least one indicator species was identified for each of our gradients (Table S3), with the most indicator species along the gradient of cave complexity (n = 10). Of the 19 species included in our study, 16 species (84.2%) were identified as indicator species for at least one gradient. Five species (Miniopterus australis, Rhinolophus arcuatus, Rhinolophus philippinensis, R. amplexicaudatus and T. melanopogon) were indicators for two gradients (Figure 4, Table S3). Specifically, M. australis and R. arcuatus exhibited mixed responses (Figure 4a–b) while the other three species responded positively to each gradient (Figure 4c–e).

3.4. Comparison of Ecological Traits

Species response groups (z+ and z−) differed in at least one ecological trait for each gradient (Table 3). Species that responded positively to landscape disturbance (Table S3) were significantly heavier than those that responded negatively (Kruskal–Wallis test, H = 4.86, p = 0.03; Dunn post hoc pairwise comparison test, Z = −2.20, p = 0.01). Roost dependence differed between response groups to cave complexity (Chi-square test, χ2 = 5.43, p = 0.02). Except for one species (Hipposideros obscurus), all obligate cave-roosting species responded positively to increased cave complexity, whereas facultative cave-roosting species exhibited mixed responses. Along the mining gradient, the positive response group differed in peak call frequency from the negative response group (H = 8.07, p < 0.01). Specifically, species sensitive to mining activities emit a significantly higher peak frequency (Z = 2.84, p = 0.002). Species that responded positively to cave development (H = 3.84, p = 0.05) had greater wing loading than species that responded negatively (Z = −1.96, p = 0.03). Along the gradient of resource extraction, response groups differed in foraging space (χ2 = 6.38, p = 0.04), with only clutter-tolerant species responding positively. Wing loading (H = 4.81, p = 0.03) and body mass (H = 4.81, p = 0.03) significantly differed between response groups along the hunting gradient. Species that responded positively to increased bat hunting had greater wing loading (Z = −2.19, p = 0.01) and were heavier (Z = −2.19, p = 0.01) than those that were sensitive to hunting disturbance.

4. Discussion

Our study provides evidence of ecological thresholds for individual species and assemblages of cave-roosting bats along multiple environmental and human disturbance gradients. As predicted, a lack of congruent responses among species prevented detection of assemblage-level thresholds for all gradients, with the exception of landscape disturbance. Most species exhibited significant responses to one or more gradients, yet there was no evidence that cave-roosting bat species respond to gradients at the same change-point or in the same direction (i.e., positive, negative), with responses varying considerably. Despite these mixed responses, we were able to identify species that demonstrated strong, consistent responses to specific conditions along each gradient; these species were considered credible indicator species. Differences in ecological and morphological traits between ‘winner’ and ‘loser’ species were apparent for all gradients, but some trait differences were difficult to interpret.
Our study demonstrates that cave-roosting bat assemblages exhibit a clear threshold to landscape disturbance, but only species-specific responses to all other gradients. This finding has management implications, as it points to human disturbances in the landscape surrounding the cave as being more influential on assemblage composition than cave disturbance. Such findings have been documented for other cave-dwelling wildlife (i.e., cave invertebrates [43,44]), and are supported by our prior work [16]. Alarmingly, species sensitive to landscape disturbance showed a marked decrease in overall occurrence and abundance at relatively low thresholds to landscape disturbance. Thus, efforts to prioritize and manage cave systems should also consider the surrounding landscape and make efforts to restore or preserve the forested habitats near cave entrances. Although assemblage thresholds to landscape disturbance can guide effective management practices, they do not reveal the mechanisms that drive changes in cave-roosting bat assemblages. We suggest that the reduction in forest cover surrounding the cave, coupled with expanding urbanization, reduces local food availability and increases commuting costs to reach suitable foraging areas.
A lack of congruent responses among bat species resulted in detections of weak assemblage thresholds to all other gradients. Identification of thresholds for assemblages can be problematic in species-rich assemblages because they require commonality in ecological traits that influence the response to disturbance. Similarly, Lindenmayer et al. [45] failed to identify thresholds for bird and reptile assemblages to a gradient in landscape cover between native eucalyptus and exotic pines in Australia, and attributed this to trait diversity and divergent responses even among ecologically similar species. Likewise, along all gradients except landscape disturbance, no single threshold value could explain the response of our diverse bat assemblage. Rather, our results suggest that there is overlap in threshold values in which the risk of losing sensitive species is likely greater, but also that species differ in their susceptibility to environmental and human disturbance gradients. Moreover, because species are subject to multiple disturbance gradients, there may be interactions among responses that further prevent threshold detection. Interactions may arise if a species is tolerant of, or favored by, one disturbance or gradient but sensitive to another (Figure 4). For example, it is possible that selection for complex caves buffers species from disturbance by mining or hunting (Figure 4). Diverse, interacting responses to multiple gradients may also drive complexity of cave assemblage systems in multi-cave landscapes, as few caves are likely to offer identical conditions.
Along each gradient, there was a suite of species that responded positively (i.e., increasing in occurrence frequency and relative abundance, ‘winners’) and another suite of species responding negatively (i.e., decreasing in occurrence and abundance, ‘losers’). Distinguishing between species response patterns makes sense from a broad management viewpoint, as there is limited evidence that all species in an assemblage will respond to environmental and disturbance gradients in the same manner (i.e., positive or negative) or at the same threshold. In fact, studies aimed at aggregating species responses to identify community-level thresholds often report mixed species responses and wide-ranging threshold values [46,47,48]. In such instances, the identification of credible indicator species that exhibit strong associations with a specific gradient may be more informative. For example, Suarez-Rubio et al. [46] suggested managing exurban developments to maintain thresholds in forested areas required by the most sensitive bird species in their study in order to also protect other forest-interior species. Interestingly, over half of all bat species in our study were considered positive indicators of complex caves. Our results point to the fact that the protection of more complex caves, that is, caves with greater surface area, structural variability, number of entrances, and range in temperature, would support a greater proportion of the cave-roosting bat assemblage. Moreover, combinations of indicator species with shared responses can increase the certainty of cave assessments across gradients. For example, relatively high abundances of R. arcuatus and M. australis would indicate a complex cave with a low incidence of hunting, since both species respond positively to cave complexity and negatively to hunting (Figure 4). Collections of indicator species with a congruence in response direction and/or ecological threshold provide greater confidence that site conditions are assessed correctly [49], and may be a powerful tool for proactively monitoring or prioritizing sites.
As expected, our results align with previous findings that ecological and morphological traits influenced species’ responses to human disturbance [11,50,51,52,53,54]. Specifically, in our study, five of the nine selected traits differed significantly between response groups. Body mass was a distinguishing trait across two gradients, with ‘winners’ being significantly heavier than ‘losers’ along gradients of landscape disturbance and bat hunting. Our results are not surprising since large-bodied bat species typically have high wing loading values and hence flight is fast but not maneuverable [34]. Large-bodied species may thus be more tolerant of the simplification in vegetative structure and greater commuting distances that accompany landscape disturbance (e.g., greater urbanization and road development, loss of forested habitats). Similarly, Frank et al. [53] and Hanspach et al. [54] reported that larger bats with greater wing loading were more tolerant of structurally simplified habitats, such as agricultural fields and heavily grazed pastures. That said, it is interesting that wing loading and foraging space were not independent discriminating characteristics between ‘winners’ and ‘losers’ along the gradient of landscape disturbance in our study. Our finding that larger-bodied species occurred more frequently and in greater abundance in caves with greater hunting pressure seems counter-intuitive, but we suspect this instead reflects active selection by hunters for caves occupied by two of the heaviest species in our study, R. amplexicaudatus and E. spelaea. Hunter preference for both species has been documented in other regions of the Philippines, including Negros [55] and Mindanao islands [56]. Hunting of bats in the Philippines is widespread, with roughly a third of all bat species hunted despite legal protection under the Philippine Wildlife Act and Philippine Cave Management Act [24]. Not surprising, dependence on caves was positively associated with cave complexity, with obligate cave-roosting species occurring more often and at greater abundance in more complex caves than facultative species. Caves with greater roosting area and structural variability can accommodate a wider range of roosting preferences and offers segregation from other roosting bats and refuge from disturbance [16,27].
Other differences in ecological and morphological traits between ‘winners’ and ‘losers’ were difficult to interpret, hence did not provide a solution for identifying ecological thresholds. For example, species sensitive to mining emitted a significantly higher peak frequency, while those tolerant of resource extraction tended to be clutter-tolerant species. Interestingly, species that emit high frequency calls typically forage in cluttered habitats (i.e., clutter-tolerant) [34], thus, taken together, bat species characterized by these two traits appear to be tolerant of resource extraction in caves but not mining. The traits selected for our study are not exhaustive, and future studies should include additional traits that may be more informative (e.g., home range size, dispersal ability). Likewise, future studies should consider the role of human disturbance in altering interactions among species (e.g., competition, predation), particularly when differences in the sensitivity to human disturbances differ among species. For example, reproductive timing in cave-roosting bat species in Malaysia is strongly linked with increased insect biomass driven by seasonal monsoons, unlike foliage-roosting bat species [57]. Consequently, the reproductive success of cave-roosting bat species would be more severely compromised by increased spatio-temporal variability in rainfall patterns predicted by climate change projections. Unpredictable shifts in insect abundance would likely contribute to rapid population declines in cave-roosting species, providing a competitive advantage for insectivorous bat species that roost in foliage.
Methods that identify ecological thresholds, such as TITAN, are a valuable tool to prioritize sites in greatest need of management [58], and provide practitioners with non-arbitrary targets that have been demonstrated to improve conservation outcomes [59]. However, the application of ecological thresholds to improve bat conservation has lagged behind other taxa, particularly invertebrates and birds, and has focused primarily on bat responses to forest fragmentation in the Neotropics [47,60]. Our study is the first to highlight the importance of considering both assemblage and species-specific thresholds in bats subject to diverse environmental and disturbance gradients. As keystone species in cave ecosystems [61,62], cave-roosting bats are ideal taxa to rapidly gauge the integrity of caves and the surrounding landscape. Cave-roosting bats are legally protected under the Philippine Wildlife Act and Philippine Cave Management Act, yet there has been little enforcement due to a lack of countrywide cave inventories [25] or targeted methods to identify priority caves. Our results can directly inform policies to prioritize caves in the Philippines. Specifically, assemblage-level thresholds to landscape disturbance identified in our study should be used to establish regulatory limits on land-use change around caves occupied by bats. Moreover, a majority of species in our study responded positively to cave complexity, indicating that more complex caves with minimum landscape disturbance should be prioritized to conserve maximum bat diversity. Thresholds in individual species responses to other gradients provide additional insights likely to be most useful for management of species of conservation concern, particularly near-threatened, Philippine-endemic species (i.e., R. rufus and Myotis macrotarsus). Lastly, response plots (Figure 4) can be used to prioritize both caves for protection and threats for intervention, and to provide quantitative targets for mitigation and intervention efforts.

Supplementary Materials

The following are available online at https://www.mdpi.com/1424-2818/10/3/55/s1, Table S1: Principal component (gradient) scores for 56 caves on Bohol Island, the Philippines included in this study, Table S2: Scientific names and ecological traits of 19 cave-roosting bat species captured on Bohol Island, Philippines, Table S3: Species-specific threshold responses to multiple environmental and human disturbance gradients on Bohol Island, Philippines.

Author Contributions

K.P. and T.K. conceived and designed the study; K.P., R.J. and M.L. performed the experiments; K.P. analyzed the data; R.J. and M.L. contributed logistical support; K.P. and T.K. wrote the paper.

Funding

This research was funded by the U.S. Department of State—Fulbright Fellowship, Bat Conservation International, American Philosophical Society, The Explorers Club, American Society of Mammalogists, National Speleological Society, Cave Research Foundation, John Ball Zoo, Sigma Xi, and Texas Tech Association of Biologists. This manuscript benefited from interactions through the Southeast Asian Bat Conservation Research Unit (SEABCRU) network supported by the National Science Foundation [DEB grant no. 1051363].

Acknowledgments

We thank the Department of Environment and Natural Resources of the Philippines for permission to conduct this study (permit no. 2011-04, 2013-02). We are especially grateful to all those who assisted with fieldwork, most of whom were undergraduate students. We thank Bohol Island State University for lodging and transportation during portions of this project and Shirley Chen for generating Figure 1. We thank two anonymous reviewers for comments on an earlier version of this manuscript.

Conflicts of Interest

The authors declare no conflict of interest. The founding sponsors had no role in the design of the study; in the collection, analyses, or interpretation of data; in the writing of the manuscript, or in the decision to publish the results.

References

  1. Groffman, P.M.; Baron, J.S.; Blett, T.; Gold, A.J.; Goodman, I.; Gunderson, L.H.; Levinson, B.M.; Palmer, M.A.; Paerl, H.W.; Peterson, G.D.; et al. Ecological thresholds: The key to successful environmental management or an important concept with no practical application? Ecosystems 2006, 9, 1–13. [Google Scholar] [CrossRef]
  2. Luck, G.W. An introduction to ecological thresholds. Biol. Conserv. 2005, 124, 299–300. [Google Scholar] [CrossRef]
  3. Huggett, A.J. The concept and utility of “ecological thresholds” in biodiversity conservation. Biol. Conserv. 2005, 124, 301–310. [Google Scholar] [CrossRef]
  4. Folke, C.; Carpenter, S.R.; Walker, B.; Scheffer, M.; Elmqvist, T.; Gunderson, L.; Holling, C.S. Regime shifts, resilience, and biodiversity in ecosystem management. Annu. Rev. Ecol. Evol. Syst. 2004, 35, 557–581. [Google Scholar] [CrossRef]
  5. Rompré, G.; Boucher, Y.; Bélanger, L.; Côté, S.; Robinson, W.D. Conserving biodiversity in managed forest landscapes: The use of critical thresholds for habitat. For. Chron. 2010, 86, 589–596. [Google Scholar] [CrossRef] [Green Version]
  6. Johnson, C.J. Identifying ecological thresholds for regulating human activity: Effective conservation or wishful thinking? Biol. Conserv. 2013, 168, 57–65. [Google Scholar] [CrossRef]
  7. King, R.S.; Baker, M.E. Considerations for analyzing ecological community thresholds in response to anthropogenic environmental gradients. J. N. Am. Benthol. Soc. 2010, 29, 998–1008. [Google Scholar] [CrossRef] [Green Version]
  8. Zavaleta, E.; Pasari, J.; Moore, J.; Hernández, D.; Suttle, K.B.; Wilmers, C.C. Ecosystem responses to community disassembly. Ann. N. Y. Acad. Sci. 2009, 1162, 311–333. [Google Scholar] [CrossRef] [PubMed]
  9. Baker, M.E.; King, R.S. A new method for detecting and interpreting biodiversity and ecological community thresholds. Methods Ecol. Evol. 2010, 1, 25–37. [Google Scholar] [CrossRef] [Green Version]
  10. Caro, T.M.; O’Doherty, G. On the use of surrogate species in conservation biology. Conserv. Biol. 1999, 13, 805–814. [Google Scholar] [CrossRef]
  11. Williams, N.N.M.; Crone, E.E.E.; T’ai, H.; Roulston, T.H.; Minckley, R.L.; Packer, L.; Potts, S.G. Ecological and life-history traits predict bee species responses to environmental disturbances. Biol. Conserv. 2010, 143, 2280–2291. [Google Scholar] [CrossRef]
  12. Purvis, A.; Gittleman, J.L.; Cowlishaw, G.; Mace, G.M. Predicting extinction risk in declining species. Proc. R. Soc. B Biol. Sci. 2000, 267, 1947–1952. [Google Scholar] [CrossRef] [PubMed] [Green Version]
  13. Jones, K.E.; Purvis, A.; Gittleman, J.L. Biological correlates of extinction risk in bats. Am. Nat. 2003, 161, 601–614. [Google Scholar] [CrossRef] [PubMed]
  14. Schneeberger, K.; Voigt, C.C. Zoonotic viruses and conservation of bats. In Bats in the Anthropocene: Conservation of Bats in a Changing World; Voigt, C.C., Kingston, T., Eds.; Springer International Publishing: Cham, Switzerland, 2016; pp. 263–292. ISBN 978-3-319-25218-6. [Google Scholar]
  15. Furey, N.M.; Racey, P.A. Conservation ecology of cave bats. In Bats in the Anthropocene: Conservation of Bats in a Changing World; Voigt, C.C., Kingston, T., Eds.; Springer International Publishing: Cham, Switzerland, 2016; pp. 463–500. [Google Scholar]
  16. Phelps, K.; Jose, R.; Labonite, M.; Kingston, T. Correlates of cave-roosting bat diversity as an effective tool to identify priority caves. Biol. Conserv. 2016, 201, 201–209. [Google Scholar] [CrossRef] [Green Version]
  17. Medellin, R.A.; Wiederholt, R.; Lopez-Hoffman, L. Conservation relevance of bat caves for biodiversity and ecosystem services. Biol. Conserv. 2017, 1–6. [Google Scholar] [CrossRef]
  18. Tanalgo, K.C.; Tabora, J.A.G.; Hughes, A.C. Bat cave vulnerability index (BCVI): A holistic rapid assessment tool to identify priorities for effective cave conservation in the tropics. Ecol. Indic. 2018, 89, 852–860. [Google Scholar] [CrossRef]
  19. Schmieder, D.A.; Kingston, T.; Hashim, R.; Siemers, B.M. Sensory constraints on prey detection performance in an ensemble of vespertilionid understorey rain forest bats. Funct. Ecol. 2012, 26, 1043–1053. [Google Scholar] [CrossRef] [Green Version]
  20. Senawi, J.; Schmieder, D.; Siemers, B.; Kingston, T. Beyond size—Morphological predictors of bite force in a diverse insectivorous bat assemblage from Malaysia. Funct. Ecol. 2015, 29, 1411–1420. [Google Scholar] [CrossRef]
  21. Kingston, T.; Francis, C.C.M.; Akbar, Z.; Kunz, T.H. Species richness in an insectivorous bat assemblage from Malaysia. J. Trop. Ecol. 2003, 19, 1–12. [Google Scholar] [CrossRef]
  22. Kingston, T. Response of Bat Diversity to Forest Disturbance in Southeast Asia: Insights from Long-Term Research in Malaysia; Adams, R.A., Pedersen, S.C., Eds.; Springer: New York, NY, USA, 2013; ISBN 978-1-4614-7396-1. [Google Scholar]
  23. Furey, N.M.; Racey, P.A. Can wing morphology inform conservation priorities for Southeast Asian cave bats? Biotropica 2016, 48, 545–556. [Google Scholar] [CrossRef]
  24. Mildenstein, T.; Tanshi, I.; Racey, P.A. Exploitation of bats for bushmeat and medicine. In Bats in the Anthropocene: Conservation of Bats in a Changing World; Springer International Publishing: Cham, Switzerland, 2016; pp. 325–375. [Google Scholar]
  25. Urich, P.; Day, M.; Lynagh, F. Policy and practice in karst landscape protection: Bohol, the Philippines. Geogr. J. 2001, 167, 305–323. [Google Scholar] [CrossRef]
  26. Ellis, B.M. Cave surveys. In The Science of Speleology; Ford, T.D., Cullingford, C.H.D., Eds.; Academic Press: London, UK, 1976; pp. 213–266. [Google Scholar]
  27. Brunet, A.K.; Medellín, R.A. The species-area relationship in bat assemblages of tropical caves. J. Mammal. 2001, 82, 1114–1122. [Google Scholar] [CrossRef]
  28. Arita, H.T. The conservation of cave-roosting bats in Yucatan, Mexico. Biol. Conserv. 1996, 76, 177–185. [Google Scholar] [CrossRef]
  29. Harlow, L.L. The Essence of Multivariate Thinking: Basic Themes and Methods, 2nd ed.; Routledge: New York, NY, USA, 2014; ISBN 041487372X. [Google Scholar]
  30. Ingle, N.R.; Heaney, L.R. A key to the bats of the Philippine Islands. Fieldiana Zool. 1992, 69, 1–44. [Google Scholar] [CrossRef]
  31. Sikes, R.S.; Gannon, W.L. Guidelines of the American Society of Mammalogists for the use of wild mammals in research. J. Mammal. 2011, 92, 235–253. [Google Scholar] [CrossRef] [Green Version]
  32. Heaney, L.R.; Dolar, M.L.; Balete, D.S.; Esselstyn, J.A.; Rickart, E.A.; Sedlock, J.L. Synopsis of Philippine mammals. Available online: http://archive.fieldmuseum.org/philippine_mammals/index.html (accessed on 10 March 2016).
  33. Francis, C.M. A Guide to the Mammals of Southeast Asia; Princeton University Press: Princeton, NJ, USA, 2008; ISBN 978-0691135519. [Google Scholar]
  34. Norberg, U.M.; Rayner, J.M.V. Ecological morphology and flight in bats (Mammalia; Chiroptera): Wing adaptations, flight performance, foraging strategy and echolocation. Philos. Trans. R. Soc. B Biol. Sci. 1987, 316, 335–427. [Google Scholar] [CrossRef]
  35. Denzinger, A.; Schnitzler, H.-U. Bat guilds, a concept to classify the highly diverse foraging and echolocation behaviors of microchiropteran bats. Front. Physiol. 2013, 4, 164. [Google Scholar] [CrossRef] [PubMed]
  36. Reiter, J.; Tomaschewski, I. Chemical composition of leaves consumed by Ptenochirus jagori (Pteropodidae). Mamm. Biol. Z. Säugetierkd. 2003, 68, 112–115. [Google Scholar] [CrossRef]
  37. IUCN. The IUCN Red List of Threatened Species. Available online: http://www.iucnredlist.org (accessed on 10 February 2016).
  38. Sedlock, J.L.; Jose, R.P.; Vogt, J.M.; Paguntalan, L.M.J.; Cariño, A.B. A survey of bats in a karst landscape in the central Philippines. Acta Chiropterol. 2014, 16, 197–211. [Google Scholar] [CrossRef]
  39. Mickleburgh, S.P.; Hutson, A.M.; Racey, P.A. Old World Fruit Bats: An Action Plan for Their Conservation; IUCN: Grand, Switzerland, 1992; ISBN 2831700558. [Google Scholar]
  40. Dufrêne, M.; Legendre, P. Species assemblages and indicator species: The need for a flexible asymmetrical approach. Ecol. Monogr. 1997, 67, 345–366. [Google Scholar] [CrossRef]
  41. Dinno, A. dunn.test: Dunn’s Test of Multiple Comparisons Using Rank Sums 2016, R Package Version 1.3.2. Available online: http://CRAN.R-project.org/package=dunn.test (accessed on May 2016).
  42. R Core Team. R: A Language and Environment for Statistical Computing 2017; R Foundation for Statistical Computing: Vienna, Austria, 2017. [Google Scholar]
  43. Doran, N.E.N.; Kiernan, K.; Swain, R.; Richardson, A.M.M. Hickmania troglodytes, the Tasmanian cave spider, and its potential role in cave management. J. Insect Conserv. 1999, 3, 257–262. [Google Scholar] [CrossRef]
  44. Pellegrini, T.G.; Sales, L.P.; Anguiar, P.; Ferreira, R.L. Linking spatial scale dependence of land-use descriptors and invertebrate cave community composition. Subterr. Biol. 2016, 18, 17–38. [Google Scholar] [CrossRef] [Green Version]
  45. Lindenmayer, D.B.; Fischer, J.; Cunningham, R.B. Native vegetation cover thresholds associated with species responses. Biol. Conserv. 2005, 124, 311–316. [Google Scholar] [CrossRef]
  46. Suarez-Rubio, M.; Wilson, S.; Leimgruber, P.; Lookingbill, T. Threshold responses of forest birds to landscape changes around exurban development. PLoS ONE 2013, 8, 1–11. [Google Scholar] [CrossRef] [PubMed]
  47. Ávila-Gómez, E.S.; Moreno, C.E.; García-Morales, R.; Zuria, I.; Sánchez-Rojas, G.; Briones-Salas, M. Deforestation thresholds for phyllostomid bat populations in tropical landscapes in the Huasteca region, Mexico. Trop. Conserv. Sci. 2015, 8, 646–661. [Google Scholar] [CrossRef]
  48. Berger, E.; Haase, P.; Oetken, M.; Sundermann, A. Field data reveal low critical chemical concentrations for river benthic invertebrates. Sci. Total Environ. 2016, 544, 864–873. [Google Scholar] [CrossRef] [PubMed]
  49. De Cáceres, M.; Legendre, P.; Wiser, S.K.; Brotons, L. Using species combinations in indicator value analyses. Methods Ecol. Evol. 2012, 3, 973–982. [Google Scholar] [CrossRef] [Green Version]
  50. Vandewalle, M.; de Bello, F.; Berg, M.P.; Bolger, T.; Dolédec, S.; Dubs, F.; Feld, C.K.; Harrington, R.; Harrison, P.A.; Lavorel, S.; et al. Functional traits as indicators of biodiversity response to land use changes across ecosystems and organisms. Biodivers. Conserv. 2010, 19, 2921–2947. [Google Scholar] [CrossRef] [Green Version]
  51. Meyer, C.F.J.; Fründ, J.; Lizano, W.P.; Kalko, E.K.V. Ecological correlates of vulnerability to fragmentation in Neotropical bats. J. Appl. Ecol. 2007, 45, 381–391. [Google Scholar] [CrossRef] [Green Version]
  52. Farneda, F.Z.; Rocha, R.; López-Baucells, A.; Groenenberg, M.; Silva, I.; Palmeirim, J.M.; Bobrowiec, P.E.D.; Meyer, C.F.J. Trait-related responses to habitat fragmentation in Amazonian bats. J. Appl. Ecol. 2015, 52, 1381–1391. [Google Scholar] [CrossRef]
  53. Frank, H.K.; Frishkoff, L.O.; Mendenhall, C.D.; Daily, G.C.; Hadly, E.A. Phylogeny, traits, and biodiversity of a Neotropical bat assemblage: Close relatives show similar responses to local deforestation. Am. Nat. 2017, 190, 200–212. [Google Scholar] [CrossRef] [PubMed]
  54. Hanspach, J.; Fischer, J.; Ikin, K.; Stott, J.; Law, B.S. Using trait-based filtering as a predictive framework for conservation: A case study of bats on farms in southeastern Australia. J. Appl. Ecol. 2012, 49, 842–850. [Google Scholar] [CrossRef]
  55. Tababa, R.; Dagunan, M.A.; Dejano, B.; De La Cruz, S.; Gutierrez, B.; Alcala, E.; Averia, L. Preliminary results of the cave bat assessment conducted at Central Negros, Philippines. LCC Dev. Educ. J. Multidiscip. Res. 2012, 1, 85–99. [Google Scholar]
  56. Tanalgo, K.C.; Tabora, J.A.G. Cave-dwelling bats (Mammalia: Chiroptera) and conservation concerns in South central Mindanao, Philippines. J. Threat. Taxa 2015, 7, 8185. [Google Scholar] [CrossRef] [Green Version]
  57. Nurul-Ain, E.; Rosli, H.; Kingston, T. Resource availability and roosting ecology shape reproductive phenology of rain forest insectivorous bats. Biotropica 2017, 49, 382–394. [Google Scholar] [CrossRef]
  58. Foley, M.M.; Martone, R.G.; Fox, M.D.; Kappel, C.V.; Mease, L.A.; Erickson, A.L.; Halpern, B.S.; Selkoe, K.A.; Taylor, P.; Scarborough, C. Using ecological thresholds to inform resource management: Current options and future possibilities. Front. Mar. Sci. 2015, 2, 95. [Google Scholar] [CrossRef]
  59. Kelly, R.P.; Erickson, A.L.; Mease, L.A.; Battista, W.; Kittinger, J.N.; Fujita, R. Embracing thresholds for better environmental management. Philos. Trans. R. Soc. B Biol. Sci. 2014, 370, 20130276. [Google Scholar] [CrossRef]
  60. Muylaert, R.L.; Stevens, R.D.; Ribeiro, M.C. Threshold effect of habitat loss on bat richness in cerrado-forest landscapes. Ecol. Appl. 2016, 26, 1854–1867. [Google Scholar] [CrossRef] [PubMed]
  61. Gnaspini, P.; Trajano, E. Guano communities in tropical caves. In Ecosystems of the World: Subterranean Ecosystems; Wilkens, H., Culver, D.C., Humphrey, W.F., Eds.; Elsevier: New York, NY, USA, 2000; pp. 251–268. ISBN 0444822992. [Google Scholar]
  62. Kunz, T.H.; de Torrez, E.B.; Bauer, D.; Lobova, T.; Fleming, T.H. Ecosystem services provided by bats. Ann. N. Y. Acad. Sci. 2011, 1223, 1–38. [Google Scholar] [CrossRef] [PubMed]
Figure 1. Caves (n = 56) surveyed on Bohol Island, the Philippines (see insert). Map created using the World Topographic basemap in ArcGIS® software by Esri. See Table S1 for additional information about each cave.
Diversity 10 00055 g001
Figure 2. Ecological thresholds identified for cave-roosting bat assemblages along environmental and human disturbance gradients. Connected circles represent the summed z-scores for all species in the negative (blue) and positive (red) response groups at each candidate change-point along gradients: (a) landscape disturbance, (b) cave complexity, (c) mining, (d) cave development, (e) resource extraction, and (f) bat hunting. The largest sum(z) score for each response group result from congruent responses among species at a similar change-point, which defines the assemblage-level threshold along the gradient (vertical dashed lines with 95% confidence intervals in shading).
Diversity 10 00055 g002
Figure 3. Species-specific change-points along environmental and human disturbance gradients. Species that exhibited a significant response (p < 0.05) to a respective gradient are shown: (a) landscape disturbance, (b) cave complexity, (c) mining, (d) cave development, (e) resource extraction, and (f) bat hunting, with each species’ corresponding threshold represented by circles. Blue circles represent ‘losing’ species (z−) with corresponding species labels on the left axes (see Table S2 for details) and red circles correspond to ‘winning’ species (z+) with corresponding species labels on the right axes. Circles are sized in proportion to the magnitude of each species’ response (based on z-scores), with overlapping horizontal lines representing the 95% confidence limits after 500 replicates. Species are ordered by increasing taxon-specific change-points along gradients, and alternate in order between ‘winners’ and ‘losers’.
Diversity 10 00055 g003aDiversity 10 00055 g003b
Figure 4. Threshold responses of indicator species to environmental and human disturbance gradients. Two-dimensional response plots depict ecological thresholds of indicator species along environmental and human disturbance gradients and predict distribution of conditions influencing species occurrence and abundance in caves. Specific thresholds (±95 confidence intervals) along each gradient are identified by cross-hair symbol, with color-coded zones representing above (green), within (yellow), and below (red) the 95% CI for both gradients. Congruence in response direction in these zones are identified by these color-codes, while incongruent responses are represented by overlapping shades of these color-codes. Miniopterus australis (a) and Rhinolophus arcuatus (b) exhibit a negative response to bat hunting but positive response to cave complexity. Rhinolophus philippinensis (c) and Rousettus amplexicaudatus (d) prefer complex caves with mining and landscape disturbance, respectively. Taphozous melanopogon (e) responded positively to bat hunting and cave development.
Diversity 10 00055 g004
Table 1. Description of the 18 environmental and human disturbance factors measured at 56 caves on Bohol Island, the Philippines, with principal component loadings of each factor for the six gradients included in our study.
FactorsMethodDescriptionLandscape DisturbanceCave ComplexityMiningCave DevelopmentResource ExtractionHunting
Available roosting area Cave surveysUpper half of total surface area (m2) of a cave available to roosting bats, calculated following published methods and equations [27].0.10 [0.01–0.22]0.50 [0.16–0.51]−0.04 [−0.46–−0.02]0.11 [0.01–0.38]−0.26 [−0.38–−0.02]−0.12 [−0.35–−0.02]
Structural variabilityTotal cave length divided by the greatest length between two survey stations [28]. Single tunnel caves have a structural variability of 1.0, with an increasing value indicating greater complexity in chamber and passageways.0.21 [0.08–0.28]0.39 [0.08–0.45]−0.19 [−0.41–−0.02]−0.09 [−0.40–−0.01]−0.23 [−0.37–−0.01]0.06 [0.01–0.35]
Number of entrancesTotal number of cave entrances, including vertical entrances.0.13 [0.11–0.21]0.37 [0.09–0.45]−0.16 [−0.42–−0.01]0.08 [0.01–0.36]−0.14 [−0.43–−0.02]0.07 [0.02–0.58]
Temperature range Difference between maximum and minimum temperature values (°C) recorded at survey stations using a hand-held weather station.0.11 [0.01–0.22]0.35 [0.04–0.48]−0.35 [−0.52–−0.03]0.17 [0.02–0.49]0.27 [0.02–0.45]−0.07 [−0.45–−0.01]
Humidity range Difference between maximum and minimum humidity values (%) recorded as above.0.10 [0.02–0.19]0.05 [0.02–0.41]−0.47 [−0.54–−0.06]−0.13 [−0.53–−0.02]0.50 [0.03–0.57]−0.18 [−0.54–−0.02]
Non-forested habitatGoogle Earth images & visual observations in 1-km radius Percentage of non-forested habitat calculated using ImageJ analysis software (https://imagej.nih.gov).0.35 [0.32–0.38]−0.16 [−0.25–−0.02]−0.09 [−0.23–−0.01]−0.05 [−0.20–−0.01]−0.01 [−0.25–−0.01]0.02 [0.01–0.28]
UrbanizationNumber of human residents.0.35 [0.30–0.38]−0.17 [−0.27–−0.02]−0.15 [−0.27–−0.02]−0.06 [−0.24–−0.01]0.17 [0.01–0.28]0.10 [0.01–0.29]
Distance to village Euclidean distance (km) to the center of the nearest village/neighborhood and point of access (e.g., foot trail, road) to the cave.0.33 [0.27–0.37]−0.25 [−0.34–−0.06]−0.14 [−0.30–−0.01]−0.09 [−0.23–−0.02]−0.04 [−0.22–−0.02]−0.06 [−0.26–−0.02]
Distance to access 0.21 [0.12–0.29]0.13 [0.02–0.40]0.41 [0.03–0.46]−0.06 [−0.44–−0.02]0.10 [0.01–0.44]−0.42 [−0.46–−0.12]
Protected areaScored binarily: 1 (cave lies within boundaries of protected area), or 0 (not within boundaries).0.28 [0.21–0.32]−0.01 [−0.27–0.02]0.02 [0.01–0.41]0.48 [0.04–0.49]0.06 [0.01–0.43]0.15 [0.02–0.39]
Road developmentMost developed roadway (e.g., highway, dirt lane) observed in 1-km radius of cave entrance.−0.07 [−0.19–−0.01]0.28 [0.03–0.43]0.25 [0.03–0.50]−0.47 [−0.62–−0.03]0.36 [0.02–0.56]−0.26 [−0.50–−0.02]
Mining Visual observations & resident interviewsPercentage of the cave area affected by a specific disturbance type: mining for limestone and/or phosphate, modification of the cave structure to accommodate humans (e.g., tourists, miners), dumping of household waste (e.g., trash, sewage) and vandalism/graffiti.0.17 [0.05–0.26]0.19 [0.02–0.35]0.25 [0.02–0.42]−0.20 [−0.49–−0.02]0.19 [0.02–0.57]0.58 [−0.59–−0.03]
Cave modification 0.27 [0.20–0.31]0.05 [0.01–0.31]0.30 [0.02–0.43]−0.09 [−0.41–−0.01]0.10 [0.01–0.46]0.37 [−0.46–−0.02]
Household waste0.28 [0.20–0.32]0.15 [0.02–0.32]0.24 [0.02–0.35]0.23 [0.01–0.37]0.00 [0.01–0.31]−0.07 [−0.34–−0.01]
Vandalism/graffiti0.07 [0.01–0.19]−0.05 [−0.35–−0.01]0.29 [0.03–0.49]0.48 [0.04–0.61]0.34 [0.02–0.64]−0.26 [−0.59–−0.08]
Resource extractionProportion of interviewee responses that reported they or other residents visited the cave to extract resources (e.g., guano, swiftlet nests, water) or hunt bats.−0.29 [−0.33–−0.23] 0.11 [0.01–0.23]0.02 [0.01–0.28]0.28 [0.02–0.35]−0.10 [−0.35–−0.01]0.02 [0.01–0.39]
Bat hunting−0.32 [−0.36–−0.25]0.23 [0.03–0.32]0.08 [0.01–0.27]−0.02 [−0.26–−0.01]0.15 [0.01–0.30]0.16 [0.01–0.34]
Visitation frequencyGreatest visitation frequency (i.e., daily, weekly, monthly or yearly/never) indicated by two or more interviewees.−0.26 [−0.31–−0.17]0.03 [0.01–0.25]−0.10 [−0.35–−0.01]0.22 [0.02–0.46]0.41 [0.02–0.50]0.31 [0.02–0.49]
Principal component loadings [95% confidence intervals] of environmental and human disturbance factors for each gradient based on 999 iterations of resampling with replacement. Loadings greater than 0.30 (in bold) explain a moderate percentage of the variation among caves [29].
Table 2. Ecological thresholds for cave-roosting bat assemblages along environmental and human disturbance gradients.
GradientResponse GroupAssemblage ThresholdConfidence Limits
0.050.100.500.900.95
Landscape disturbancesum(z−)−1.53−3.52−3.30−2.13−1.02−0.10
sum(z+)2.660.100.632.662.682.68
Cave complexitysum(z−)−0.18−2.01−1.61−0.81−0.180.16
sum(z+)0.590.020.270.692.142.22
Miningsum(z−)0.38−1.85−1.850.080.470.68
sum(z+)0.01−0.24−0.090.181.471.63
Cave developmentsum(z−)−0.50−1.28−1.23−0.651.011.27
sum(z+)1.50−0.020.180.861.721.89
Resource extractionsum(z−)−0.43−1.37−1.34−0.990.520.70
sum(z+)1.25−0.200.041.121.391.39
Bat huntingsum(z−)0.21−1.08−1.08−0.250.330.38
sum(z+)0.600.070.180.521.401.40
Assemblage-level thresholds are determined by the summation of z-scores for all species in the negative (sum(z−)) and positive (sum(z+)) response groups, with the largest aggregate z-scores for each group used to identify threshold values along each gradient. Confidence limits correspond to the cumulative frequency distribution of assemblage thresholds resulting from 500 replicates.
Table 3. Comparison of ecological traits between ‘winner’ and ‘loser’ bat species across environmental and human disturbance gradients.
Gradients
Landscape DisturbanceCave ComplexityMiningCave DevelopmentResource ExtractionBat Hunting
Categorical traitsχ2p-valueχ2p-valueχ2p-valueχ2p-valueχ2p-valueχ2p-value
Endemism0.010.911.470.220.010.911.020.310.800.370.100.75
Dietary niche3.210.070.090.760.280.600.280.601.640.202.030.15
Roost dependence0.420.515.430.020.090.760.420.510.650.420.050.83
Foraging space4.850.090.180.910.570.750.570.756.380.042.110.35
Colony size2.150.371.120.570.480.790.150.935.110.085.730.06
Continuous traitsHp-valueHp-valueHp-valueHp-valueHp-valueHp-value
Aspect ratio0.810.360.310.580.030.870.060.811.970.160.001.00
Wing loading2.160.141.930.162.410.123.840.053.080.084.810.03
Peak frequency0.220.640.150.708.07<0.010.020.900.360.550.300.59
Body mass4.860.030.550.463.530.061.500.222.490.114.810.03
Chi-square tests (χ2) were used to compare categorical traits between species response groups (z− and z+) distinguished by Threshold Indicator Taxa ANalysis, with Kruskal–Wallis tests (H) used to compare continuous traits between groups. Significant results are in bold.

