Sonar Surveys for Bat Species Richness and Activity in the Southern Kalahari Desert, Kgalagadi Transfrontier Park, South Africa

1
School of Biological Sciences, University of Northern Colorado, Greeley, CO 80639, USA
2
Department of Biology, University of Scranton, Scranton, PA 18510, USA
*
Author to whom correspondence should be addressed.
Diversity 2018, 10(3), 103; https://doi.org/10.3390/d10030103
Submission received: 27 March 2018
/
Revised: 3 July 2018
/
Accepted: 10 September 2018
/
Published: 18 September 2018
(This article belongs to the Special Issue Diversity and Conservation of Bats)
Abstract
:Kgalagadi Transfrontier Park is located in northwestern South Africa and extends northeastward into Botswana. The park lies largely within the southern Kalahari Desert ecosystem where the Auob and Nassob rivers reach their confluence. Although these rivers run only about once every 100 years, or shortly after large thunderstorms, underground flows and seeps provide consistent surface water for the parks sparse vegetation and diverse wildlife. No formal studies on bats have previously occurred at Kgalagadi. We used SM2 + BAT ultrasonic detectors to survey 10 sites along the Auob and Nassob rivers from 5–16 April 2016. The units recorded 3960 call sequences that were analyzed using Kaleidoscope software for South African bats as well as visual determinations based on call structure attributes (low frequency, characteristic frequency, call duration, and bandwidth). We identified 12 species from four families: Rhinolophidae: Rhinolophus fumigatus. Molossidae: Chaerephon pumilus, and Sauromys petrophilus, Tadarida aegyptiaca; Miniopteridae: Miniopteris schreibersi (natalensis), Vespertilionidae: Laephotis botswanae, Myotis tricolor, Neoromicia capensis, N. nana, Pipistrellus hesperidus, Scotophilus dinganii, and S. viridus. The most abundant species during the survey period was N. capensis. We also used paired-site design to test for greater bat activity at water sources compared to dry sites, with dry sites being significantly more active. We conclude that species richness is much higher than previously known from this region and that more species may be present during the warmer months of the year. In addition, activity of bats during the dry season in Kgalagadi would likely be more concentrated around drinking opportunities, thus allowing for better detection of species richness in the area.
1. Introduction
Sub-Saharan Africa is highly vulnerable to climate change, which will have negative effects on biodiversity and regional economies (GNP), many of which rely heavily on tourism such as in South African national parks [1]. Kgalagadi Transfrontier Park is in northwestern South Africa and encompasses the southern end of the Kalahari Desert that stretches nearly 600,000 km2 across Botswana, Namibia, and South Africa, and supports a highly rich and unique fauna and flora [2]. The establishment of transfrontier parks, such as Kgalagadi, that span two or more countries, allowing for unimpeded wildlife movements, are instrumentally important to conservation [3]. Although surveys have identified the composition of large- [4] and some small-bodied [5] terrestrial mammals in this area, little is known of bat species richness [6]. In addition, bats are uniquely sensitive bioindicators of ecosystem health [7]. Because of their unique physiology and morphology making them highly susceptible to evaporative water losses thereby affecting reproductive outcomes, bats may act as ‘canaries in a global coal mine’ for predicting large-scale cascading effects of climate-change induced droughts, particularly in arid, water-stressed environments [8]. Although climate change is a long-term threat, current land use practices such as wood-cutting and commercial cattle grazing are more immediate, and perhaps more devastating [9]. Thus, it is essential that baseline surveys for bat species richness and abundance be conducted to track future population changes of sensitive species [7].
Our intention was to survey for undocumented bat species in the park using sonar call capture and identification of call sequences to species. Our hypothesis was that there were more than the three species informally listed on the Park’s website (the Cape serotine, Neoromicia capensis, Egyptian slit-faced bat, Nycteris thebaica, and Egyptian free-tailed bat, Tadarida aegyptiaca), based upon estimated distributional ranges of South African bats [6]. A second hypothesis was that bat activity levels would be higher at water sources than at dry sites if conditions were hot and dry.
2. Materials and Methods
2.1. Study Area
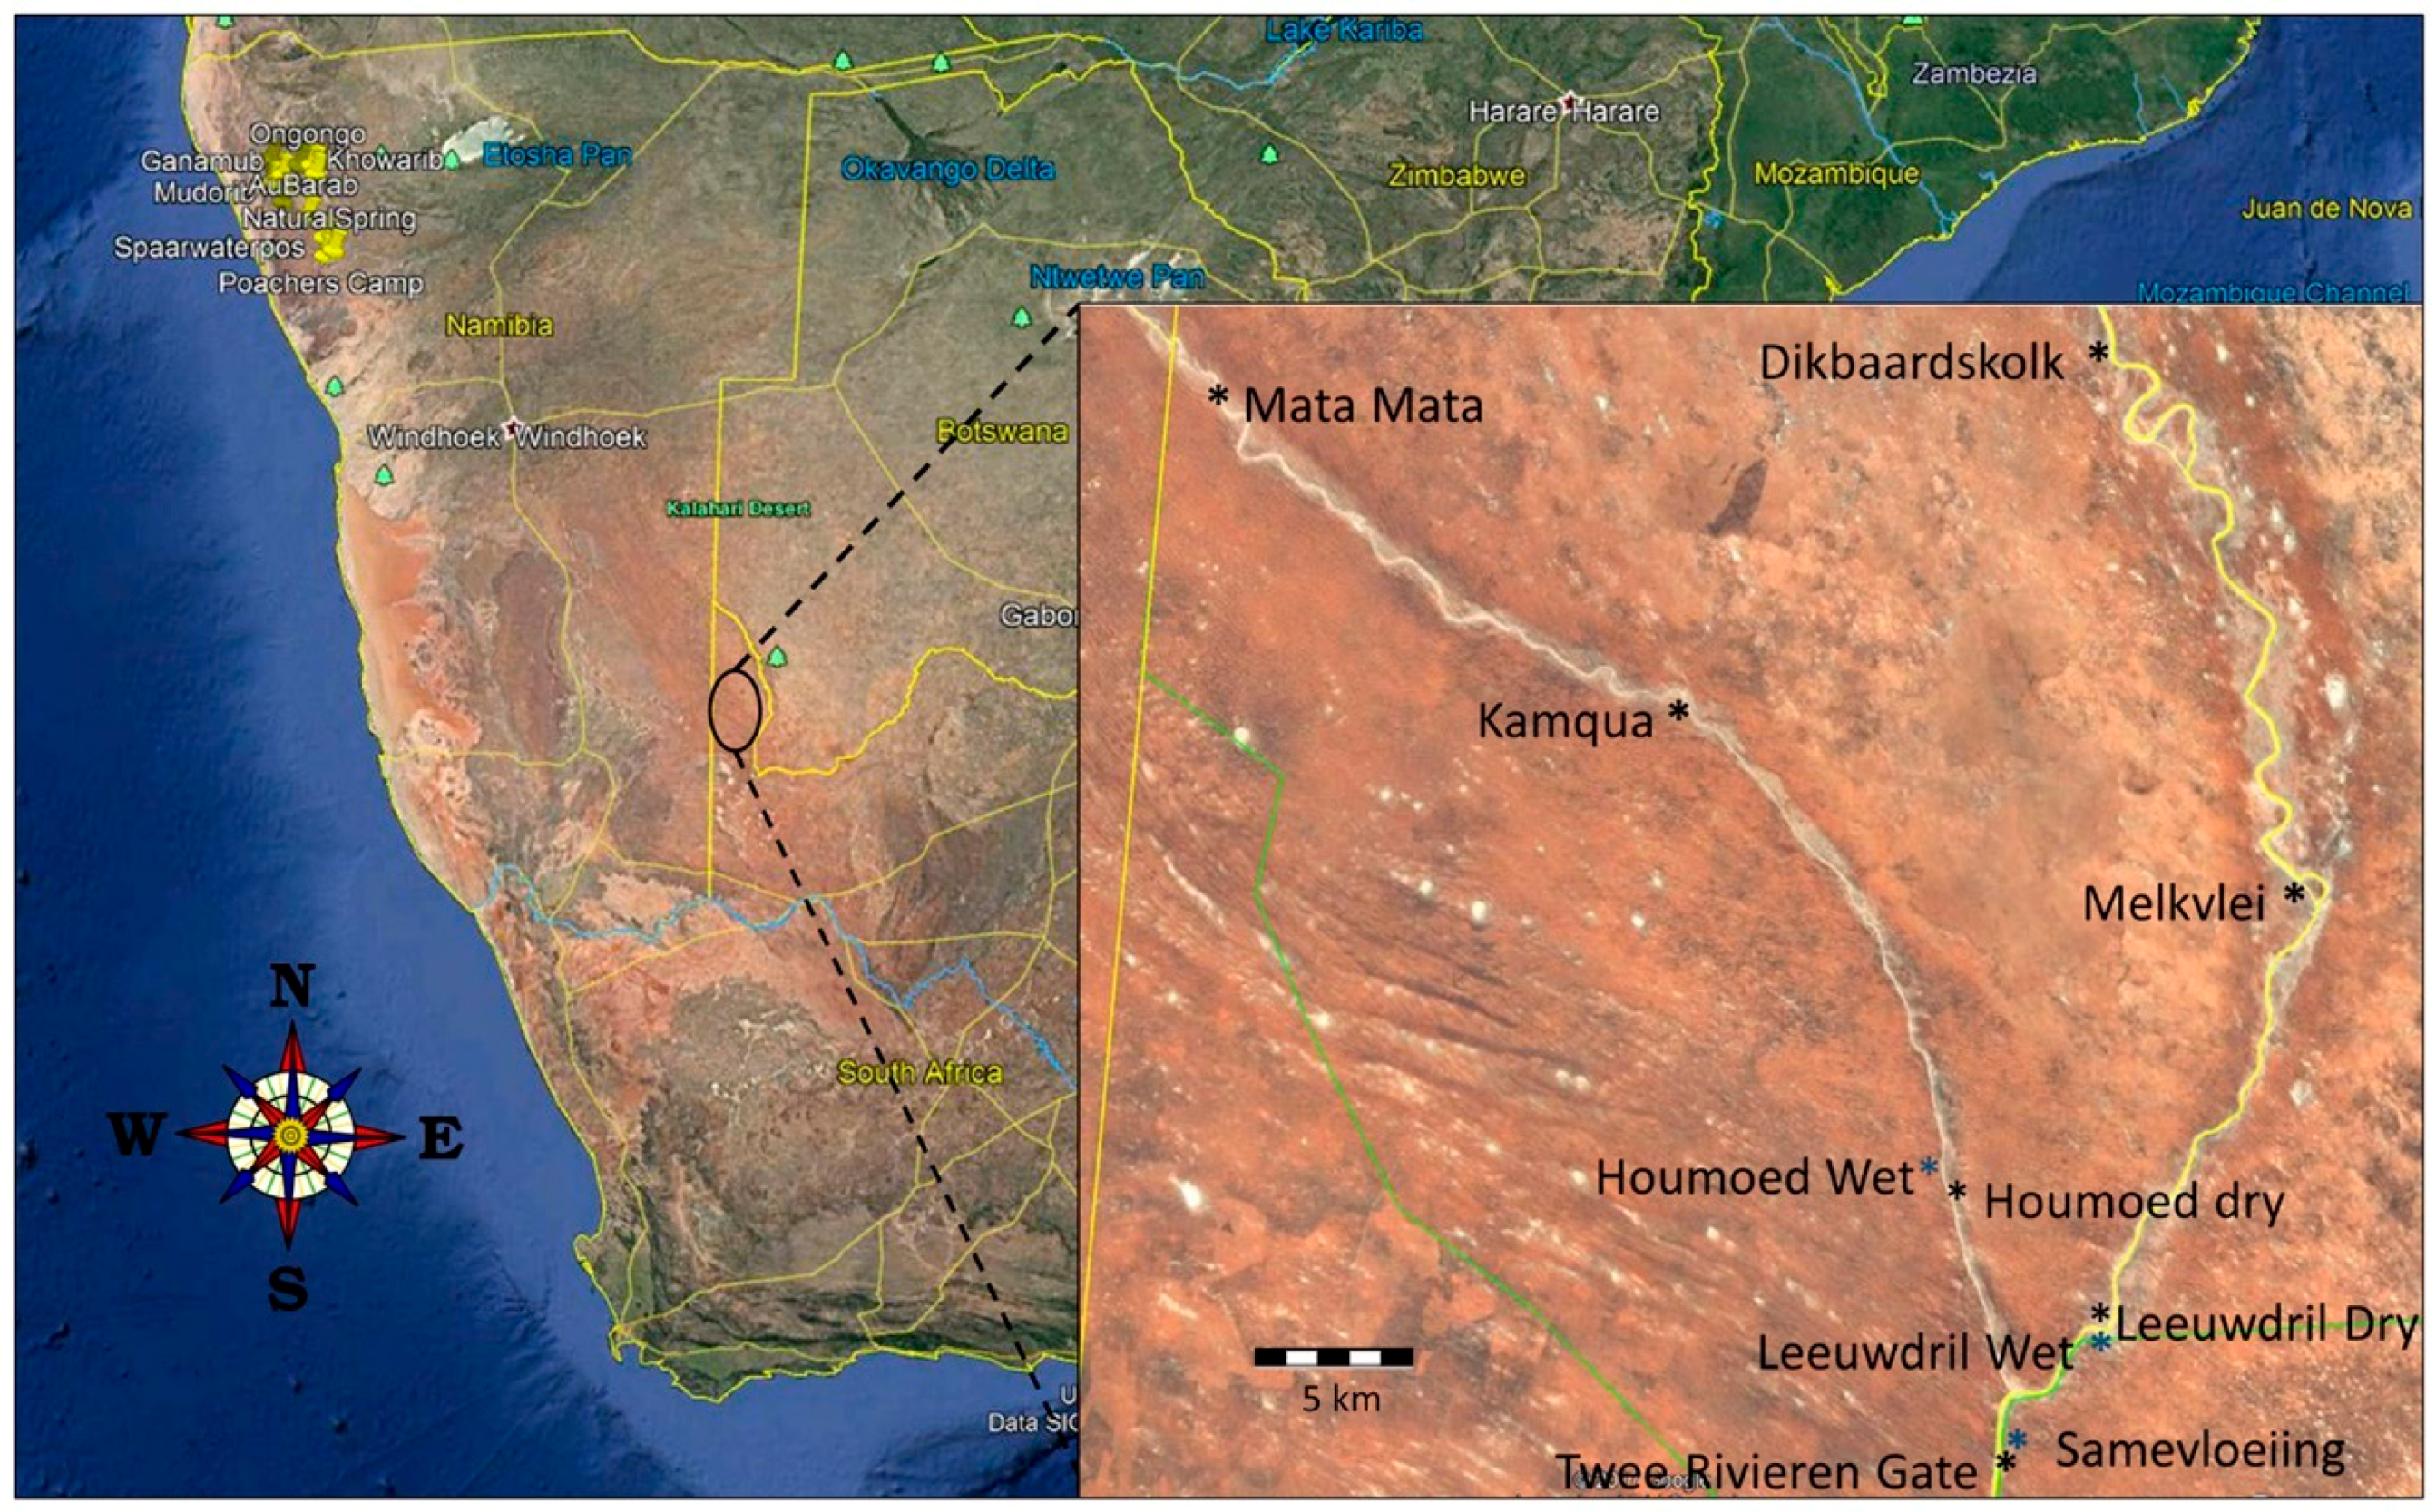
We worked in the South Africa region of Kgalagadi Transfrontier Park (Figure 1). Rainfall is <2.22 cm/year [10], thus supporting a landscape of sand dunes, sparse ground vegetation, and occasional acacia trees [9,11] (Figure 1). Water availability is scarce within the park. Two major rivers, the Nossob and Auob, flow only after significant rains during the wet season that normally stretches from January through April. However, there are several areas where underground water seeps to the surface, thus providing consistent drinking opportunities for wildlife, even during the dry season.
2.2. Data Collection
Each night we deployed two SM2 + BAT sonar recorders with SMX-US microphones (Wildlife Acoustics Inc., Concord, MA, USA) set to run from sunset to sunrise. A total of 10 locations was surveyed (two survey locations per night over five nights) along either the Nassob and Auob rivers or near their confluence (Figure 1, Table 1). Each SM2 unit was set to record full spectrum sonar calls at a sampling rate of 192 KS/s and also recorded temperatures at 1-min intervals. In addition, we used a pair-wise design to sample six sites (3 pairs) wherein one SM2 was placed directly at a water source, with the other placed approximately one kilometer away at a dry location. Methods used in this study were approved by the University of Northern Colorado IACUC #1510C-RA-B-18.
2.3. Data Analysis
Sonar recordings were analyzed for structural data and species identification using Kaleidoscope software (Wildlife Acoustics Inc.). In addition, all call sequences were reviewed using call structure data, which included the following properties: Fc (average characteristic frequency defined as the “body” of the call, i.e., the portion of the call consisting of the flattest slope), Fmax (average maximum frequency detected in the call), Fmin (average minimum frequency detected in the call), and average call duration (duration of the call). We also considered the number of pulses matching the auto classification results, using only call sequences that were ≥0.70 matching. Visual sonograms were generated by Sonobat 4.1 bat analysis software (Arcata, CA, USA) and were compared with published literature [12,13]. Activity of bats at a particular site was defined as the raw number of call sequences recorded from individual passes at that site. For temperature data comparisons among paired sites, we used recorded data separated by 5-min intervals to reduce redundancy but maintain a level of resolution that would allow observations of any sudden temperature changes common in a desert environment. We used Χ2 analysis to compare bat activity levels between wet and dry sites and Tukey-Kramer to compare temperatures among paired sites.
3. Results
3.1. Sonar Capture Results
A total of 3960 call sequences was recorded across the 10 sites. Of these, 1425 sequences were identifiable to species using call matching rates ≥70% and represented 12 species from the families Rhinolophidae, Molossidae, Miniopteridae, and Vespertilionidae (Table 2). We did not find evidence of the Egyptian slit-faced bat, Nycteris thebaica (family Nycteridae), as indicated informally in the park brochure, during our survey, and thus, this species’ presence remains questionable. Parameters for select species’ sonar call sequences are presented in Table 3 with representative sonograms. Visual depiction of call sequences of selected individuals of each species are represented in color-coded sonograms using Sonobat 4.1 bat analysis software (Arcata, CA, USA) (Figure 2, Figure 3, Figure 4 and Figure 5). Sonograms are grouped by family and sequence durations have been standardized from 0–100 milliseconds (x-axis) to allow for comparisons among species.
3.2. Species Richness and Activity
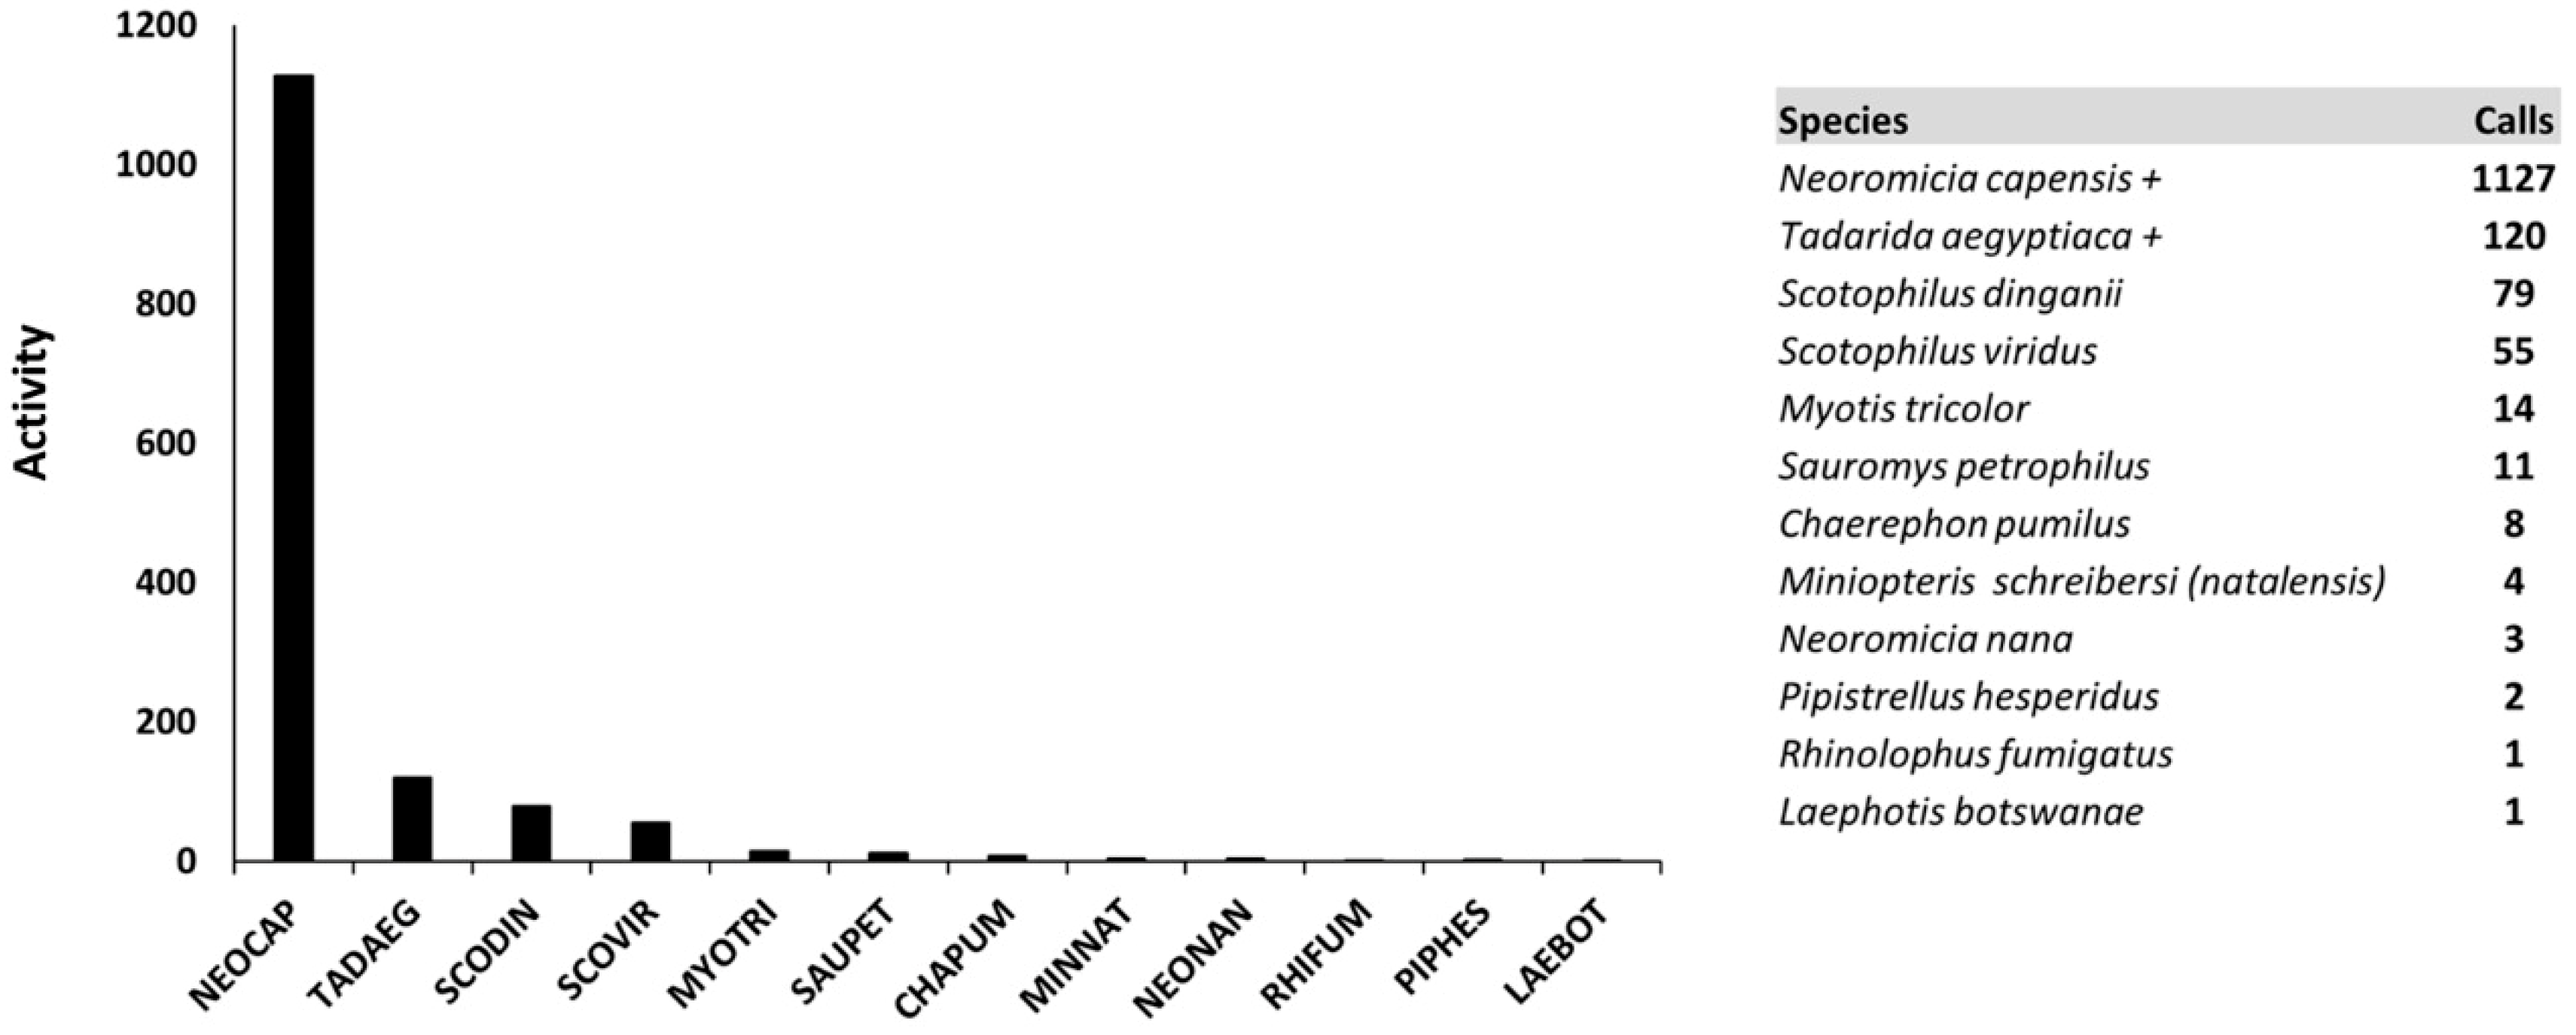
The most prominent species recorded and distributed among all sites was the Cape serotine (Neoromicia capensis). Two other species were also recorded at all 10 sites: the yellow-bellied house bat (Scotophilus dinganii) and the green house bat (S. viridus). Although distributed among only eight of the ten sites, the Egyptian free-tailed bat (Tadarida aegyptiaca) was the second most common bat we recorded in the park (Figure 6).
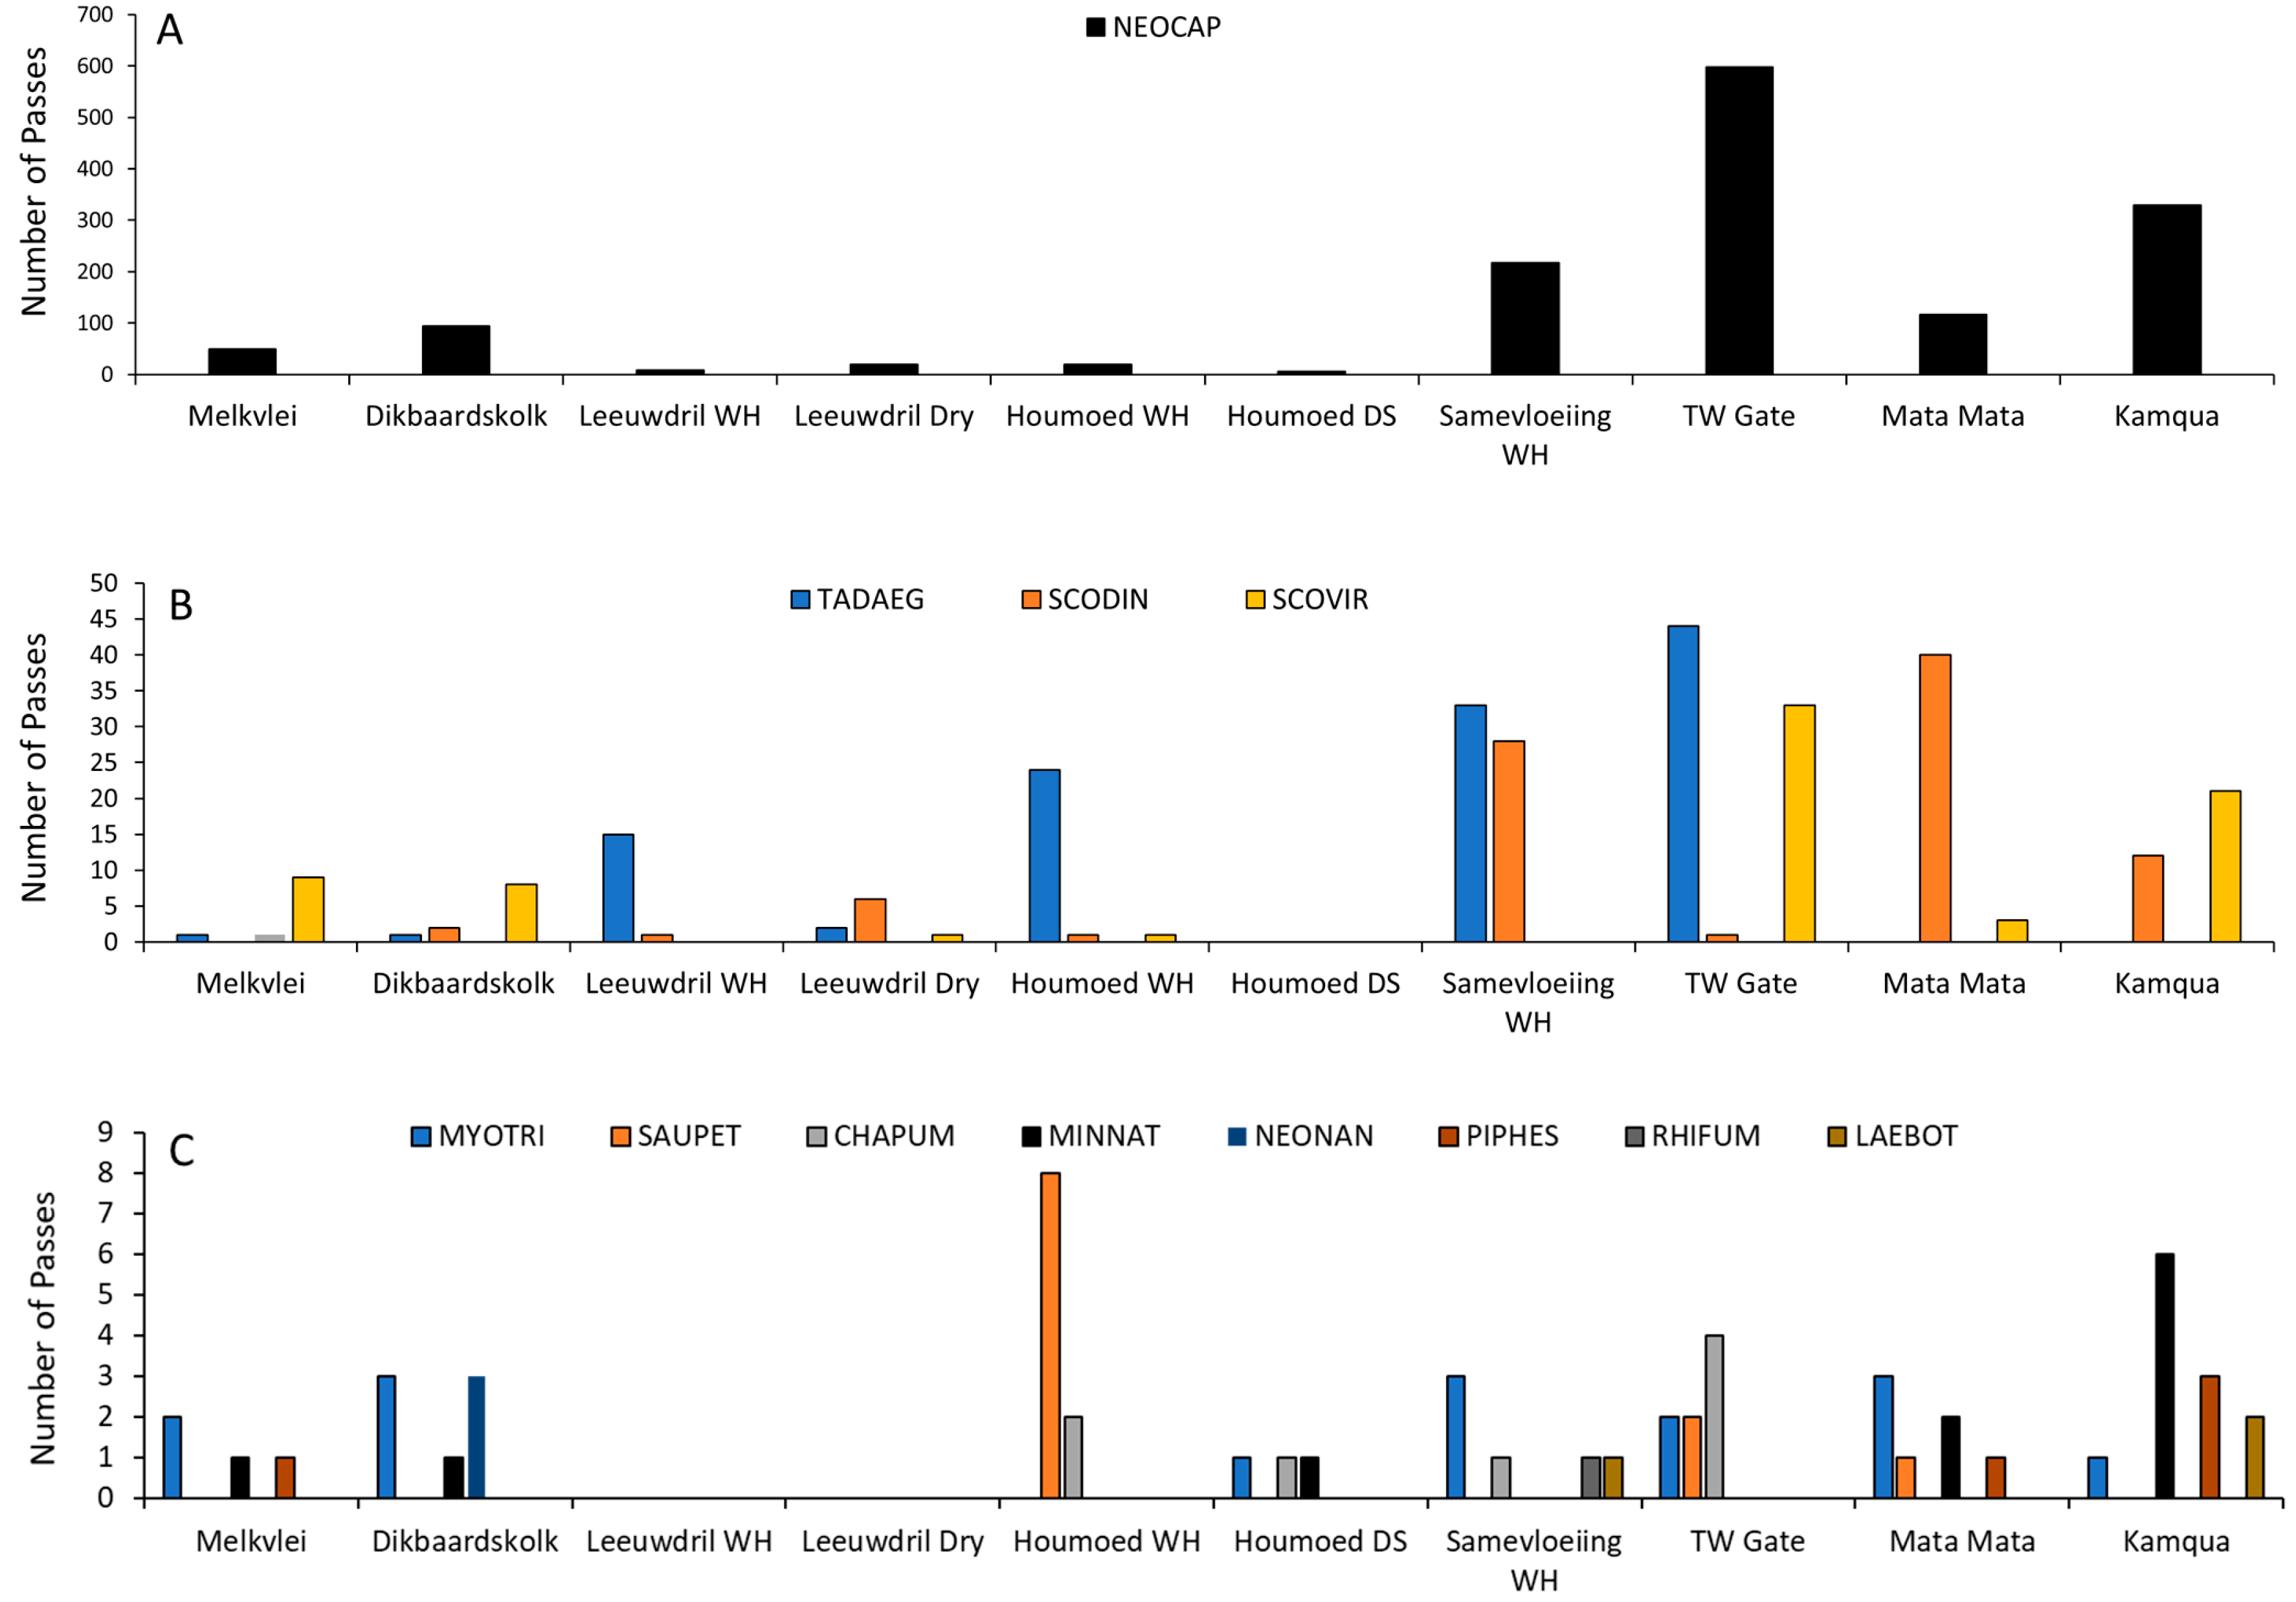
The species richness varied by site, with Dikbaardskolk having the highest richness with seven species and Leeuwdril Water Hole having the lowest with three species. Most sites were dominated by one or two species, usually Neoromicia capensis. However, sites varied considerably in species richness (Figure 7A–C).
3.3. Wet versus Dry Site Comparisons
For our wet versus dry sites, pooled nightly bat activity was significantly higher at dry sites (Χ2 = 182.5, P < 0.001). Only at Houmoed was activity higher at the water source than its paired dry site. Because data were recorded among paired-sites on different nights and temperature can affect activity levels at water sources in arid environments, we used the Tukey-Kramer analysis to test for significant differences and found that Houmoed was significantly higher in mean nightly temperature than those recorded at the other sites sampled on different nights (Figure 8).
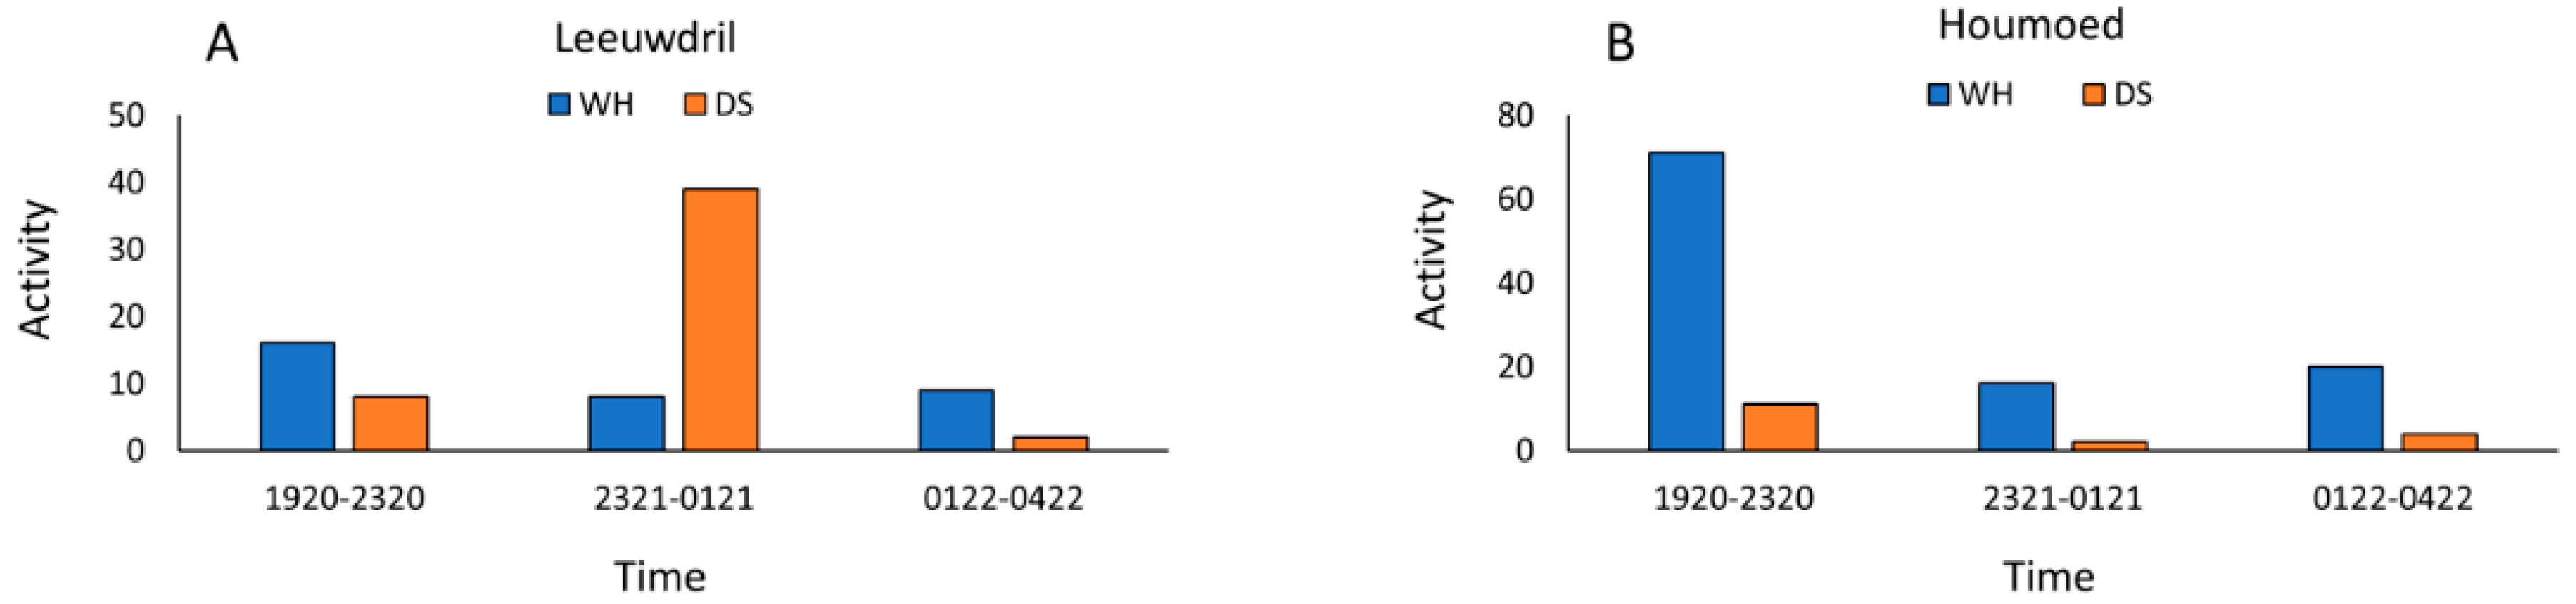
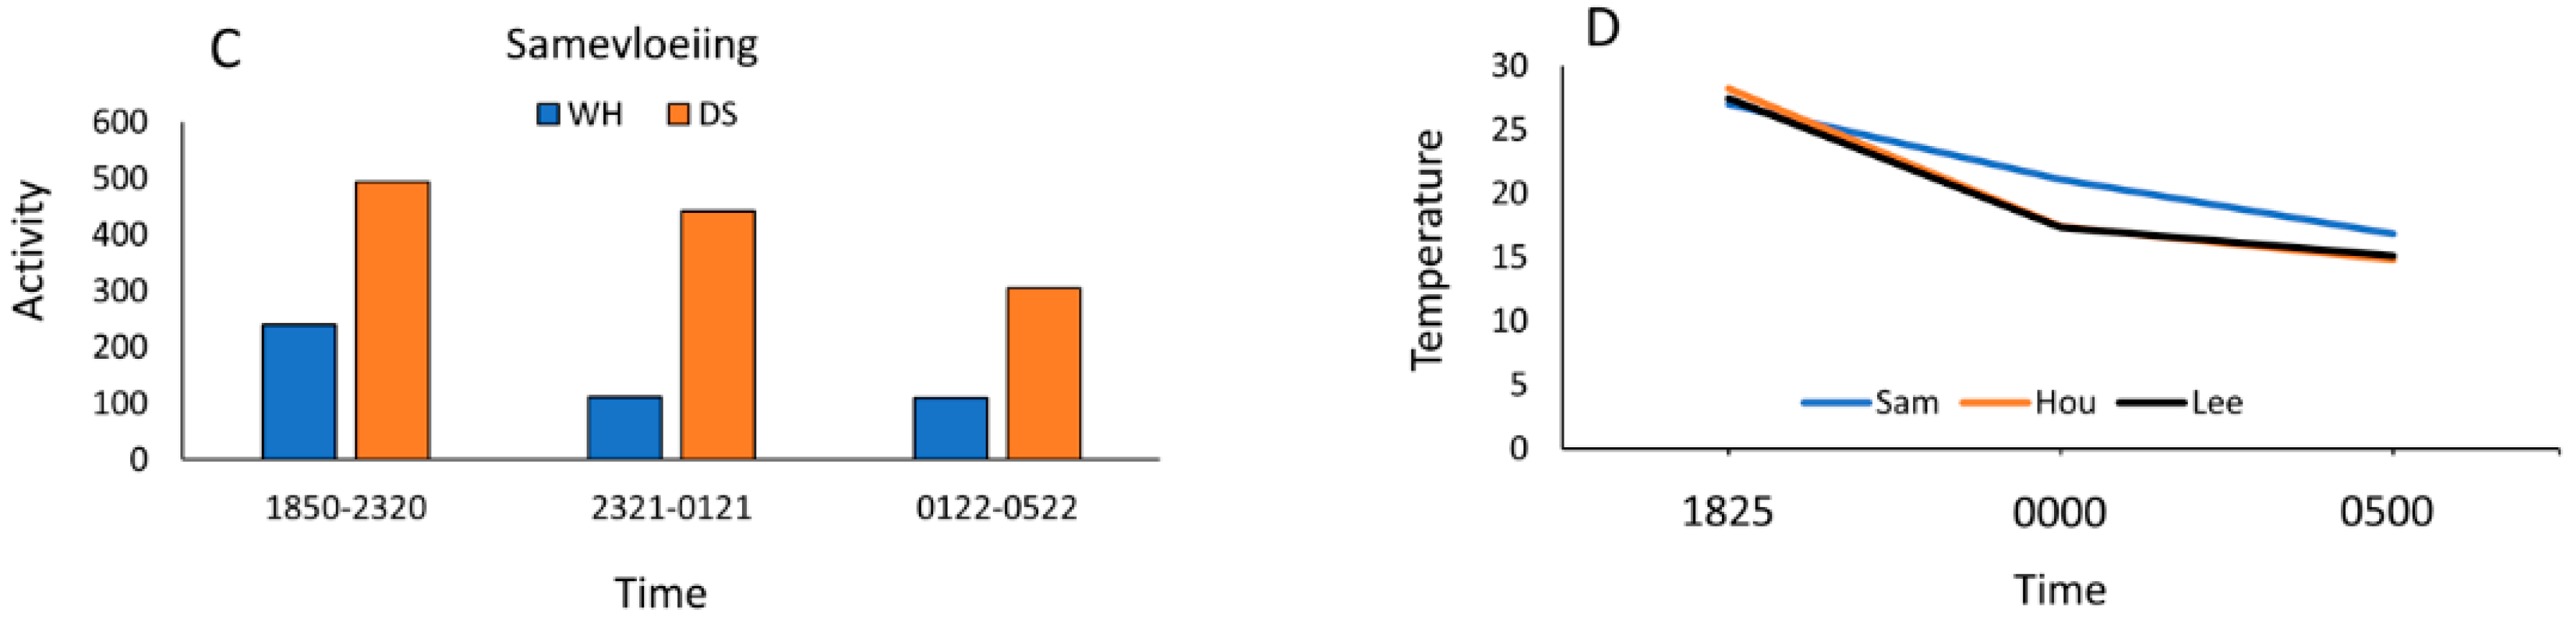
Activity at water sources was highest at sunset, after which activity declined with slight increases at dawn for all three sites (Figure 9A–D). Temperatures were highest at sunset and tapered off throughout the night. Houmoed had the highest sunset temperature of 28.2 °C, recorded at 1624 h with Samevloeiing and Leeuwdril having slightly lower sunset temperatures at 27 °C and 27.4 °C, respectively. Drops in temperatures throughout the nocturnal period were steepest between sunset and midnight for Leeuwdril and Houmoed, whereas at Samevloeiing, temperature declined less dramatically and held more steadily throughout the night (Figure 6D).
4. Discussion
Our hypothesis that we would discover higher species richness in the park than was previously documented was supported. Of the 12 species we identified for Kgalagadi Transfrontier Park, only three were expected based upon current estimated ranges for South African Bats and these were Nycteris thebaica, N. capensis and T. aegyptiaca [6]. Our survey found evidence of two of these species, but we did not record sonar calls from N. thebaica. Because our survey was done during the end of the wet season, it is possible that individuals of some species had migrated to other localities for the dry season. Our hypothesis that wet sites would support greater bat activity than dry sites was not supported statistically. Rather, we found overall greater activity at dry sites than at water sources. However, Houmoed did have higher activity at the wet site on the warmest survey night and thus temperature may influence activity patterns in these desert bats [14,15].
In addition, much of South Africa is being affected by climate change with anticipated increases in mean annual temperatures accompanied by reductions in rainfall and increasing desertification [1,16,17]. Therefore, understanding regional bat ecology is important, as bats have been shown to be reliable bioindicators of environmental health and effects of climate disruption, especially in arid regions [7]. For example, insectivorous bats showed significant declines in reproductive output in arid regions of the Rocky Mountains in North America, and this correlated with a lack of water availability in drought years [8,18,19]. In addition, these same populations showed long-term shifts towards male-biased sex ratios [20] and possible disruptions of altitudinal migratory patterns [21] in relation to increasing regional temperatures and reduced precipitation.
Kgalagadi Transfrontier Park provides protected areas for a high biodiversity of bats. The vast biome known as Flynbos/Chapparel composed of the Kalahari xeric savanna ecoregion extends through western South Africa as well as throughout much of Botswana and Namibia [10,11]. We feel that more research will yield further records of undocumented bat species as well as the reliance of bats on available water sources, especially during the dry season, in the park. Indeed, the distribution and ecology of insectivorous bats throughout Africa continues to be largely unknown. Because bats provide important contributions to food webs and ecological services [22,23], better understanding of their natural histories will lend new insights into the region’s overall ecology and improvements in conservation efforts.
Author Contributions
R.A.A. developed the study design, collected and analyzed data, wrote original draft and edited subsequent drafts of the manuscript. G.W. assisted in the collection of field data and provided comments on drafts of the manuscript.
Funding
Funding was provided by the University of Northern Colorado Faculty Research and Development Program, RDF_RAA S2015.
Acknowledgments
We thank SANParks, South Africa for allowing us to conduct research and their support in providing game guards and accommodations. We especially thank the staff at Kgalagadi Transfrontier Park for their assistance and hospitality. We also acknowledge the University of Northern Colorado and the University of Scranton for funding this project.
Conflicts of Interest
The authors declare no conflict of interest.
References
- Kiker, G.A. South African study on climate change: Vulnerability and adaptation assessment section. In A National Climate Change Response Strategy for South Africa; Department of Environmental Affairs and Tourism: Pretoria, South Africa, 2004. [Google Scholar]
- Cowlings, R.M.; Rundel, P.W.; Desmet, P.G.; Esler, K.J. Extraordinary high regional-scale plant diversity in southern African arid lands: Subcontinental and global comparison. Divers. Distrib. 1998, 4, 27–36. [Google Scholar]
- Hanks, J. Transfrontier conservation areas (TFCAs) in South Africa. J. Sustain. For. 2003, 17, 127–148. [Google Scholar] [CrossRef]
- Bergström, R.; Skarpe, C. The abundance of large wild herbivores in a semi-arid savanna in relation to seasons, pans and livestock. Afr. J. Ecol. 1999, 37, 12–26. [Google Scholar] [CrossRef]
- Blaum, N.; Rossmanith, E.; Jeltsch, F. Land use affects rodent communities in Kalahari savannah rangelands. Afr. J. Ecol. 2007, 45, 189–195. [Google Scholar] [CrossRef]
- Monadjem, A.; Taylor, P.J.; Cotterill, F.P.D.; Schoeman, M.C. Bats of Southern and Central Africa; Wits University Press: Johannesburg, South Africa, 2001. [Google Scholar]
- Jones, G.; Jacobs, D.S.; Kunz, T.H.; Willig, M.R.; Racey, P.A. Carpe noctem: The importance of bats as bioindicators. Endanger. Spec. Res. 2009, 8, 93–115. [Google Scholar] [CrossRef]
- Adams, R.A. Bat reproduction declines when conditions mimic climate change projections for western North America. Ecology 2010, 91, 2437–2445. [Google Scholar] [CrossRef] [PubMed]
- Tews, J.; Blaum, N.; Jetsch, F. Structural and animal species diversity in arid and semi-arid savannas of the southern Kalahari. Ann. Arid Zone 2006, 43, 413–425. [Google Scholar]
- Olson, D.M.; Dinerstein, E.; Wikramanayake, E.D.; Burgess, N.D.; Powell, G.V.; Underwood, E.C.; D’amico, J.A.; Itoua, I.; Strand, H.E.; Morrison, J.C.; et al. Terrestrial ecoregions of the world: A new map of life on Earth. Bioscience 2001, 15, 933–938. [Google Scholar] [CrossRef]
- White, F. The Vegetation of Africa; UNESCO Press: Paris, France, 1983. [Google Scholar]
- Taylor, P.J.; Monadjem, A.; Steyn, J.N. Seasonal patterns in habit use by insectivorous bats in a subtropical African agro-ecosystem dominated by macadamia orchards. Zoo. J. Linnaean Soc. 2013, 167, 191–207. [Google Scholar]
- Monadjem, A.; Shapiro, J.T.; Mtsetfwa, F.; Reside, A.E.; McCleery, R.A. Acoustic call library and detection distances for bats of Swaziland. Acta Chiropterol. 2017, 19, 175–187. [Google Scholar] [CrossRef]
- Geluso, K.N.; Geluso, K. Effects of environmental factors on capture rates of insectivorous bats, 1971–2005. J. Mammal. 2012, 93, 161–169. [Google Scholar] [CrossRef] [Green Version]
- Korine, C.; Adams, R.A.; Russo, D.; Jacobs, D. Bats and water: Anthropogenic alterations threaten global bat populations. In Bats in the Anthropocene: Conservation of Bats in a Changing World; Voigt, C., Kingston, T., Eds.; Springer Press: New York, NY, USA, 2016; pp. 188–215. [Google Scholar]
- Erasmus, B.F.N.; van Jaarveld, A.S.; Chown, S.L.; Kshatriya, M.; Wessels, K.J. Vulnerability of South African animal taxa to climate change. Glob. Chang. Biol. 2002, 8, 679–693. [Google Scholar] [CrossRef]
- Biggs, R.; Bohensky, E.; Desanker, P.V.; Fabricius, C.; Lynam, T.; Misselhorn, A.A.; Musvoto, C.; Mutale, M.; Reyers, B.; Scholes, R.J.; et al. The Southern Africa Millennium Ecosystem Assessment; Council for Scientific and Industrial Research: Pretoria, South Africa, 2004. [Google Scholar]
- Adams, R.A.; Hayes, M.A. Water availability and successful lactation by bats as related to climate change in western regions of North America. J. Anim. Ecol. 2008, 77, 1115–1121. [Google Scholar] [CrossRef] [PubMed]
- Hayes, M.A.; Adams, R.A. Simulated bat populations erode when exposed to climate change projections for western North America. PLoS ONE 2017, 12, e0180693. [Google Scholar] [CrossRef] [PubMed]
- Adams, R.A.; Hayes, M.A. Assemblage-level analysis of sex-ratios in Coloradan bats in relation to climate variables: A model for future expectations. Glob. Ecol. Conserv. 2018, 14, e00379. [Google Scholar] [CrossRef]
- Adams, R.A. Climate change associated with disruption in altitudinal migration and population declines in some Rocky Mountain bat species. J. Zool. Lond. 2017, in press. [Google Scholar]
- Kunz, T.H.; Braun de Torrez, E.; Bauer, D.; Lobova, T.; Fleming, T.H. Ecosystem services provided by bats. Ann. N. Y. Acad. Sci. 2011, 1223, 1–38. [Google Scholar] [CrossRef] [PubMed]
- Maine, J.J.; Boyles, J.G. Bats initiate vital agroecological interactions in corn. Proc. Natl. Acad. Sci. USA 2015, 112, 12438–12443. [Google Scholar] [CrossRef] [PubMed] [Green Version]
Figure 1.
Map of southern Africa showing location of Kgalagadi Transfrontier Park, South Africa. Inset shows approximate sonar survey locations where SM2 + BAT sonar detectors were deployed along the Auob (left) and Nassob (right) river basins, as well as near the confluence of these two rivers (see Table 1 for GPS placement data). Blue and black asterisks indicate paired sites wherein one detector was positioned at a water source, and the other positioned about 1 km away at a dry site.

Figure 2.
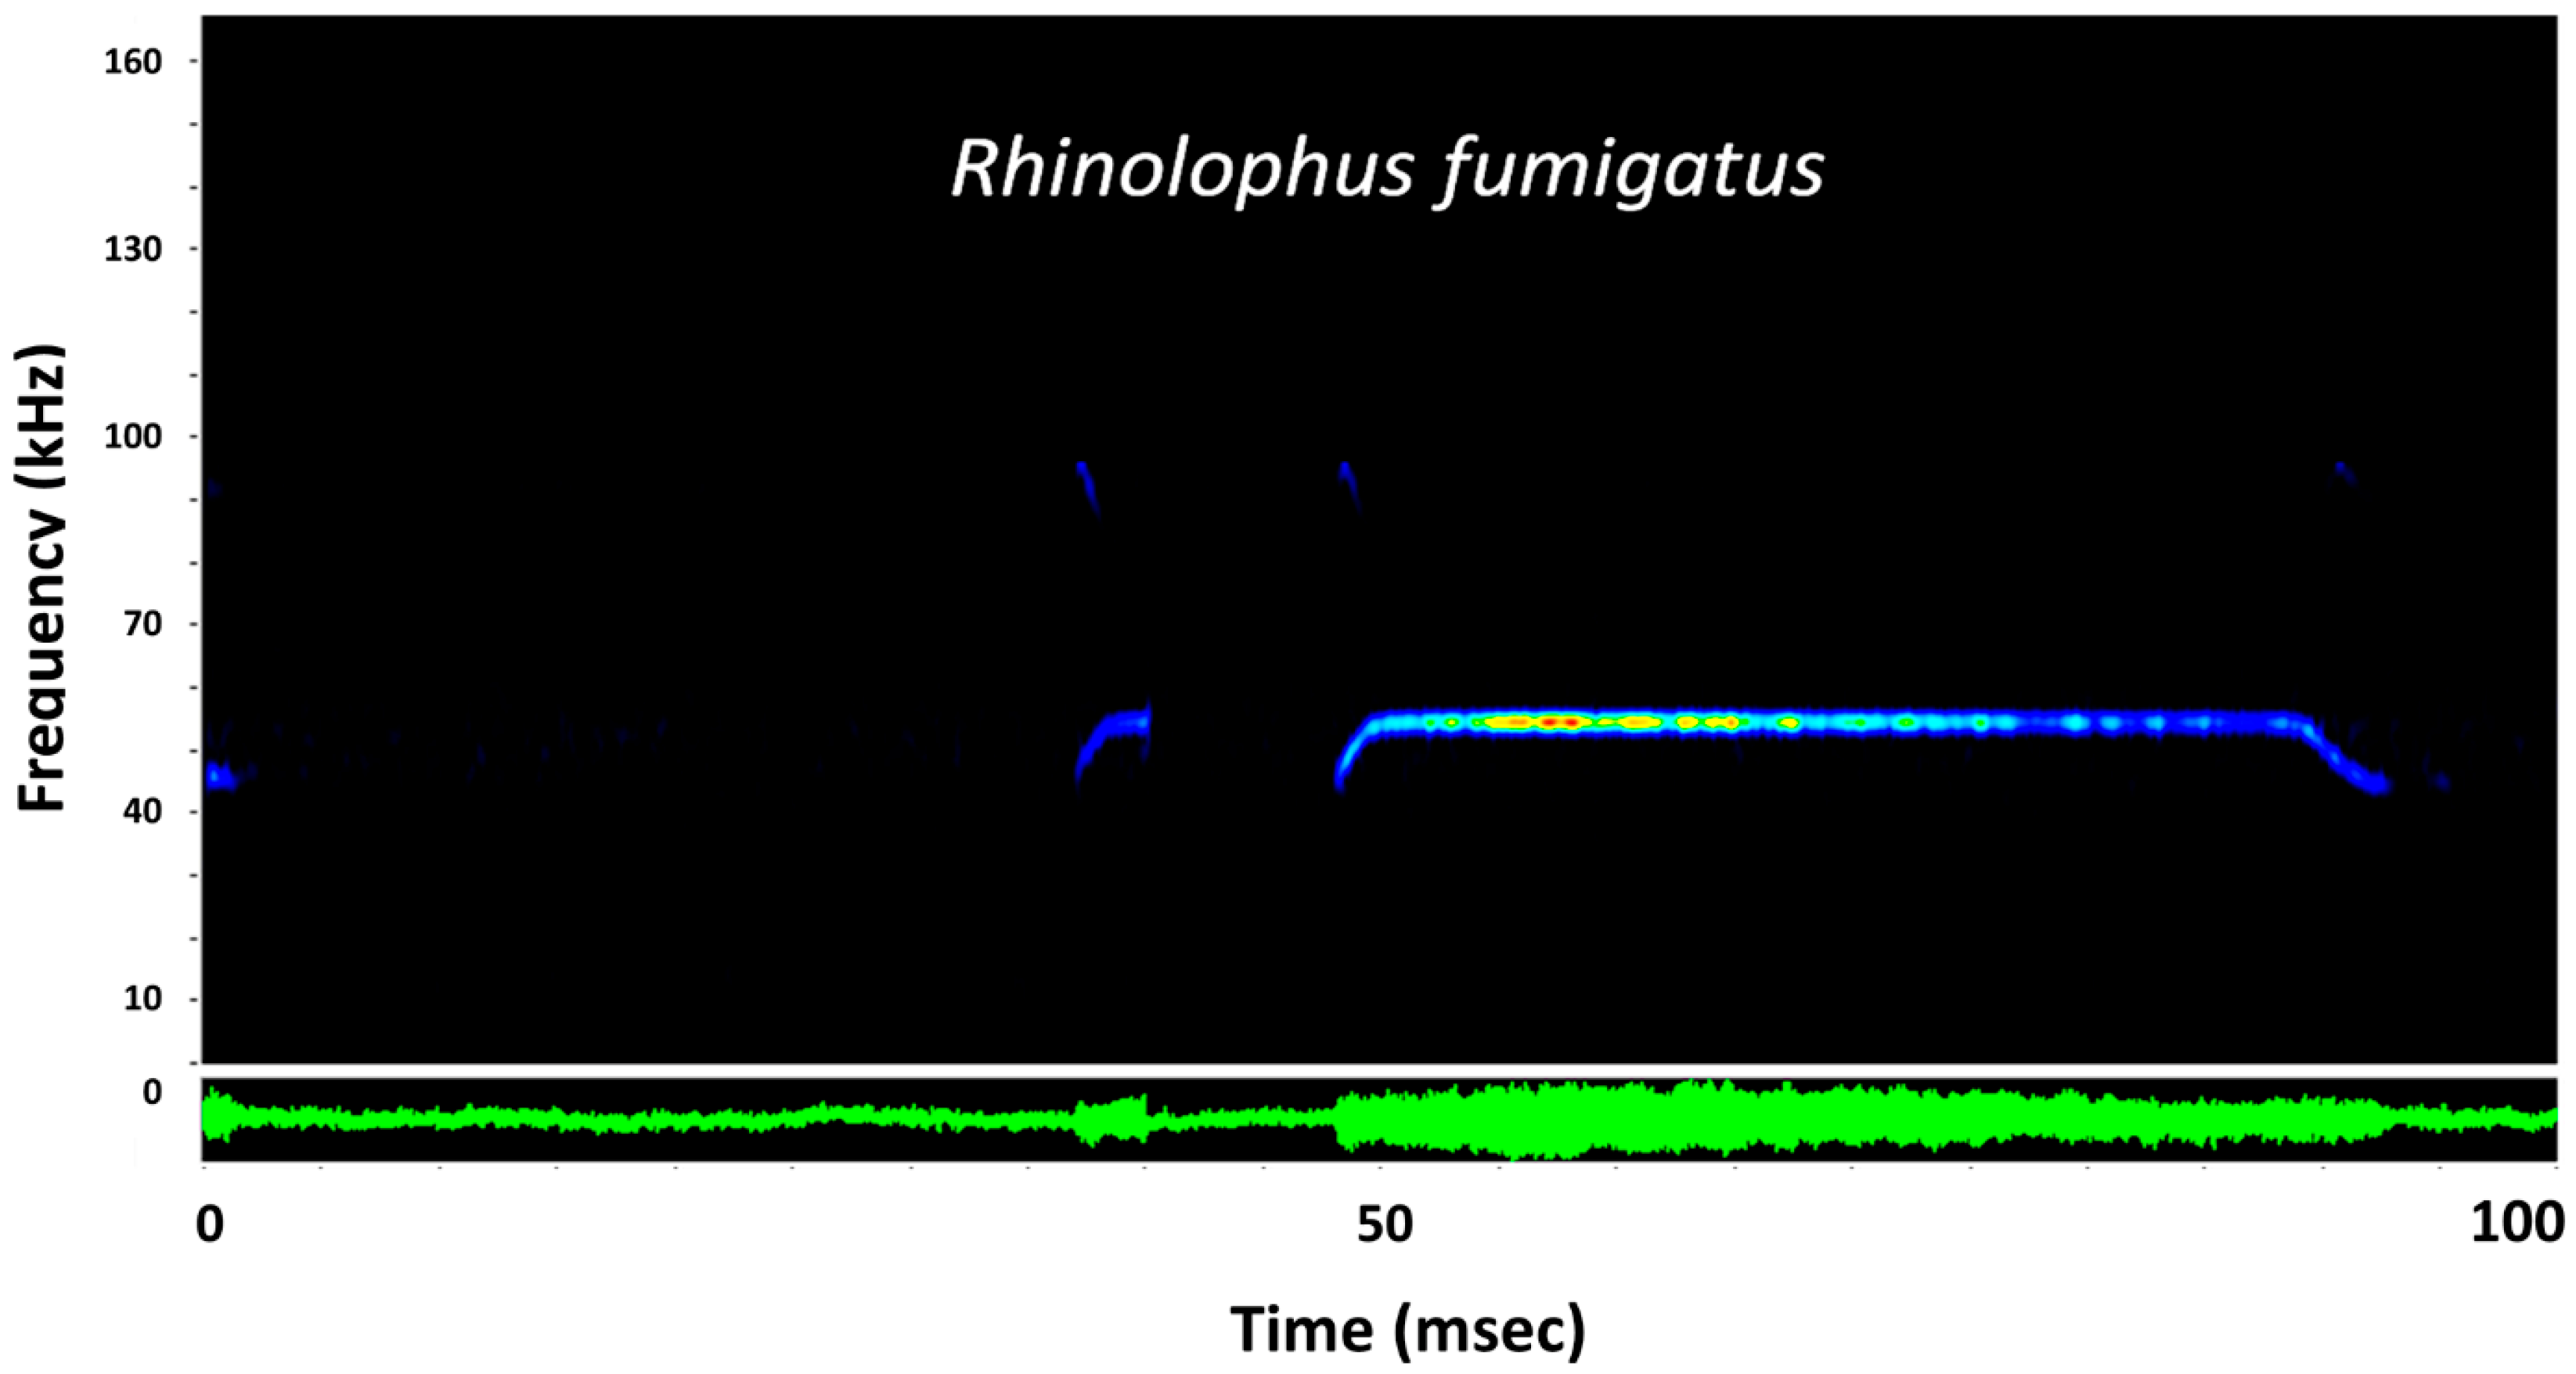
Representative sonogram for Rhinolophidae presented using Sonobat 4.1. y-axis is frequency in kilohertz (kHz) and x-axis is time standardized over 100 milliseconds (msec). Blue coloration indicates lowest sound intensity of the call, yellow indicates medium intensity, and red indicates highest intensity or loudest portion of the call. Green display represents an oscillogram of the call sequence.
Figure 2.
Representative sonogram for Rhinolophidae presented using Sonobat 4.1. y-axis is frequency in kilohertz (kHz) and x-axis is time standardized over 100 milliseconds (msec). Blue coloration indicates lowest sound intensity of the call, yellow indicates medium intensity, and red indicates highest intensity or loudest portion of the call. Green display represents an oscillogram of the call sequence.

Figure 3.
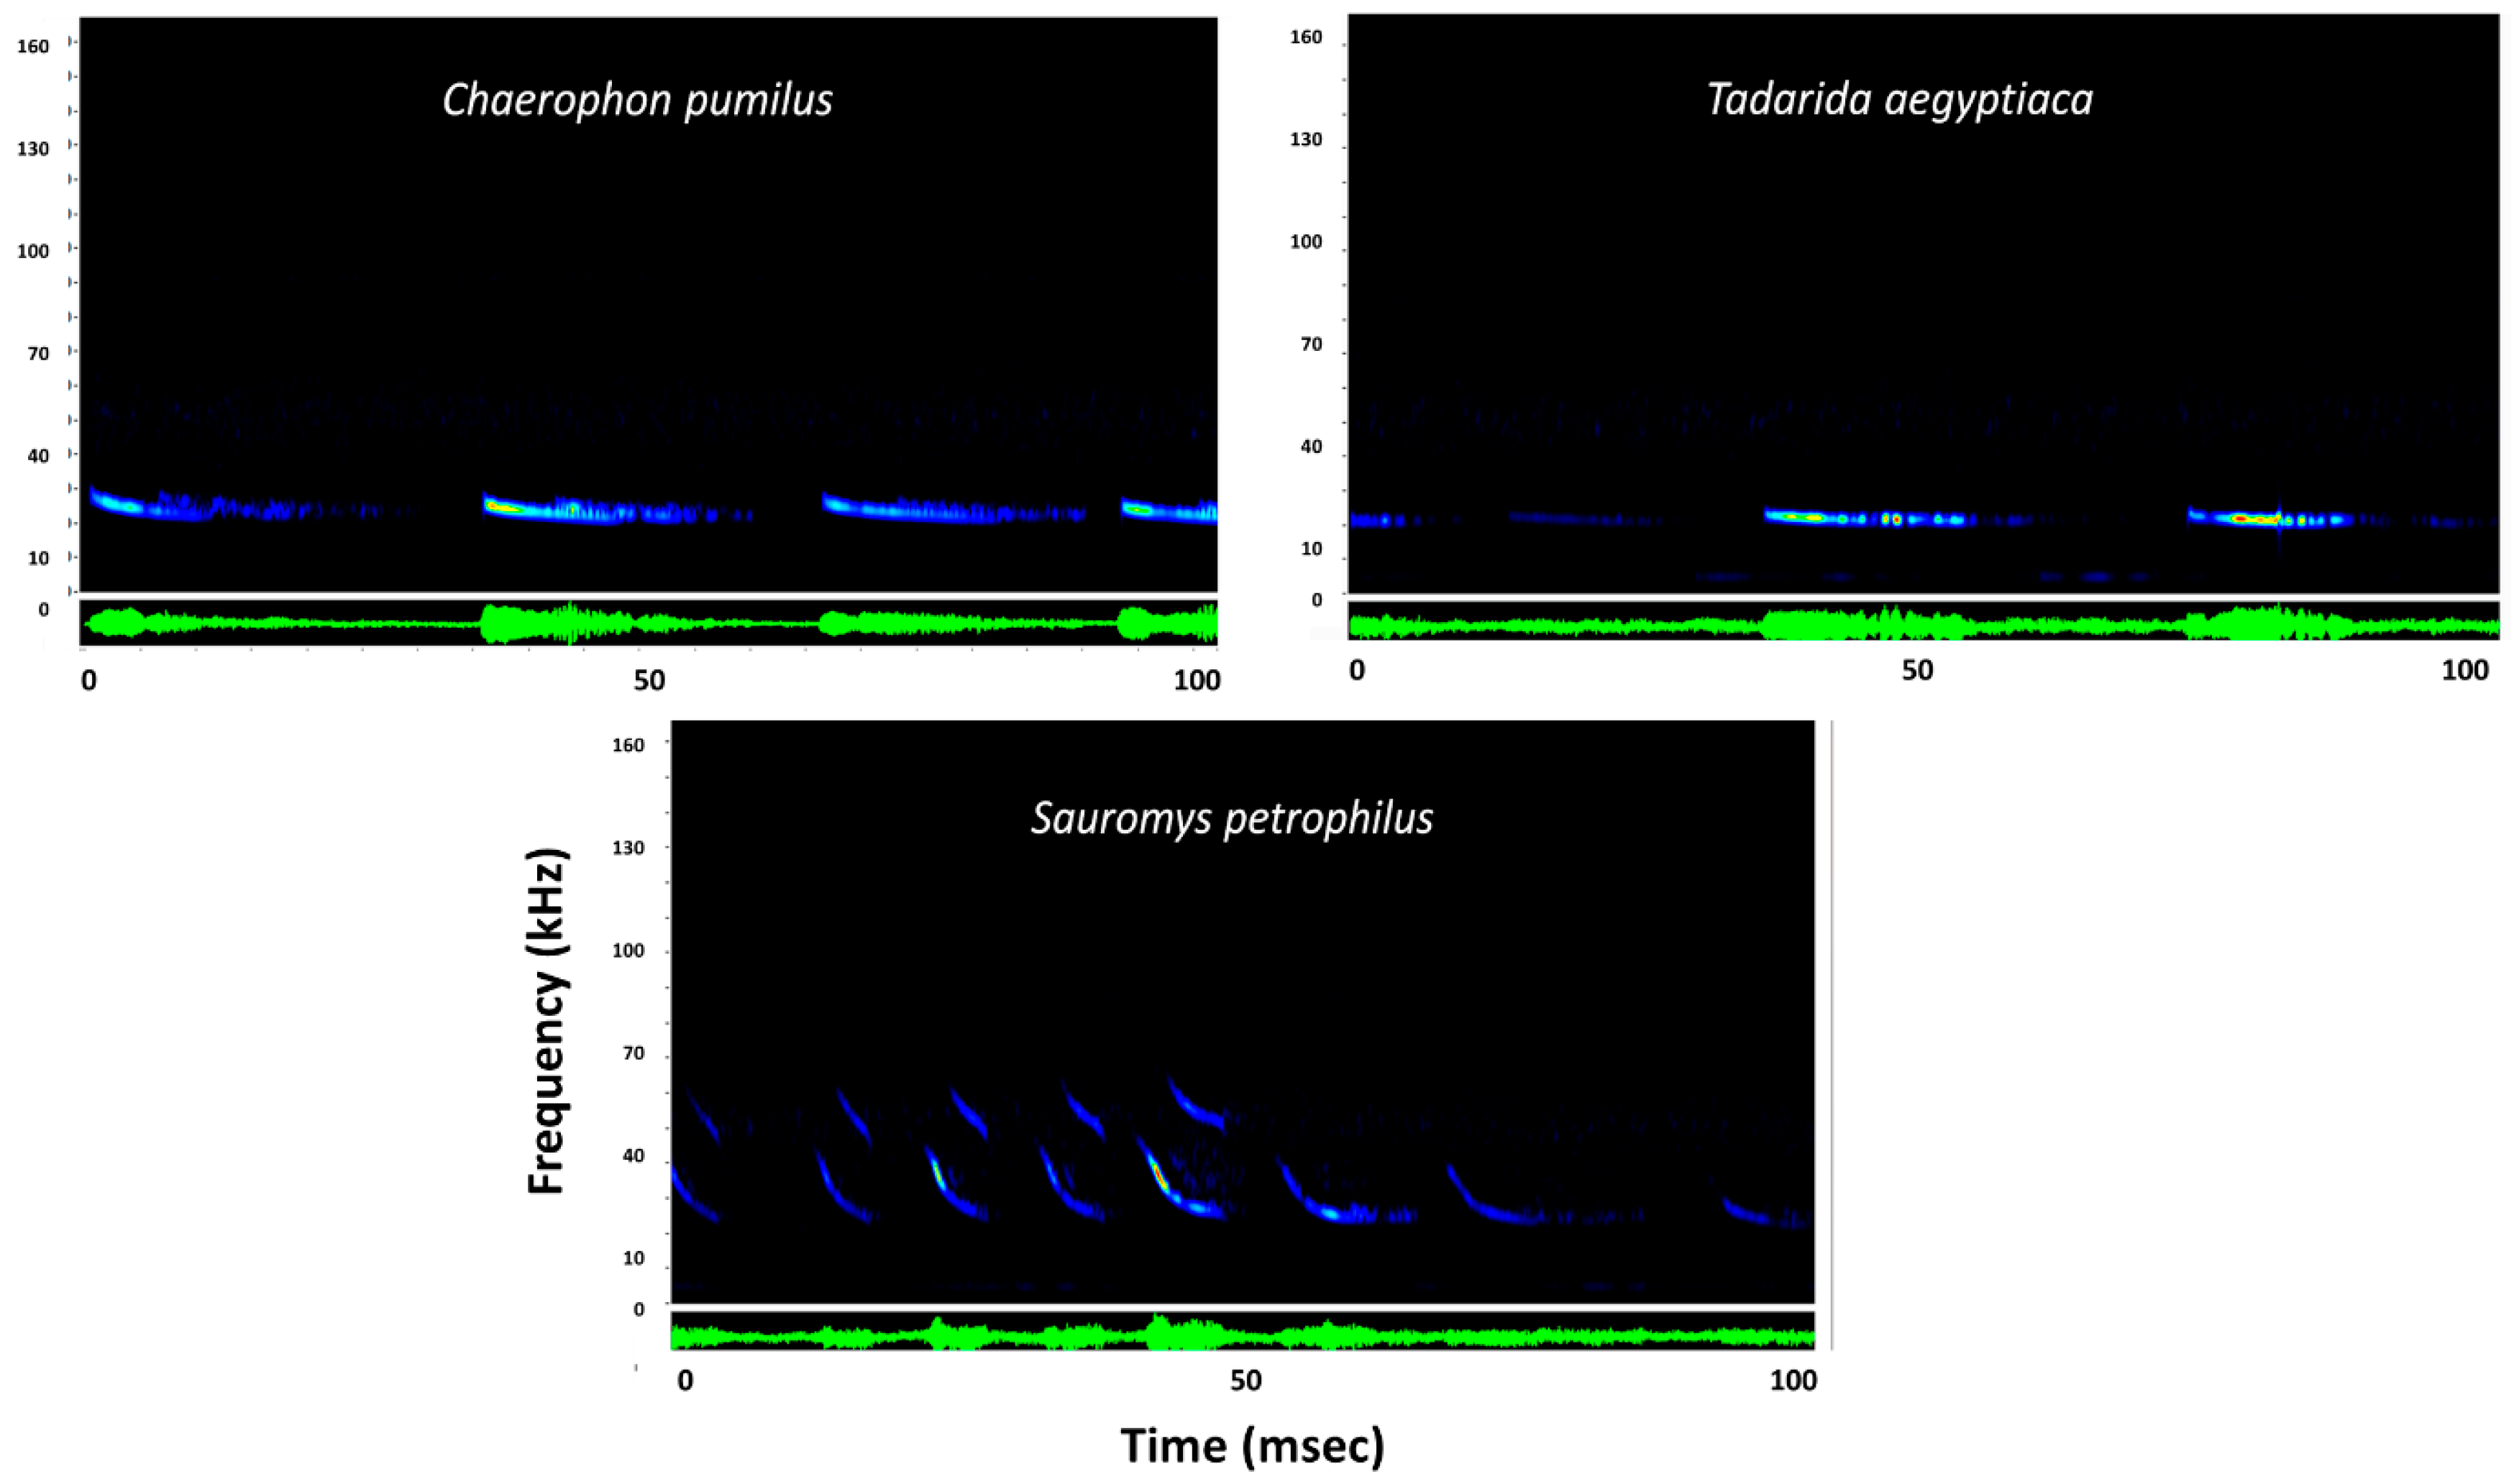
Representative sonograms for three bat species from the family Molossidae presented using Sonobat 4.1. y-axis is frequency in kilohertz (kHz) and x-axis is time standardized over 100 milliseconds (msec). Blue coloration indicates lowest sound intensity of the call, yellow indicates medium intensity, and red indicates highest intensity or loudest portion of the call. Green display represents an oscillogram of the call sequence.
Figure 3.
Representative sonograms for three bat species from the family Molossidae presented using Sonobat 4.1. y-axis is frequency in kilohertz (kHz) and x-axis is time standardized over 100 milliseconds (msec). Blue coloration indicates lowest sound intensity of the call, yellow indicates medium intensity, and red indicates highest intensity or loudest portion of the call. Green display represents an oscillogram of the call sequence.

Figure 4.
Representative sonogram for Miniopteris schreibersii (family Miniopteridae) presented using Sonobat 4.1. y-axis is frequency in kilohertz (kHz) and x-axis is time standardized over 100 milliseconds (msec). Blue coloration indicates lowest sound intensity of the call, yellow indicates medium intensity, and red indicates highest intensity or loudest portion of the call. Green display represents an oscillogram of the call sequence.

Figure 5.
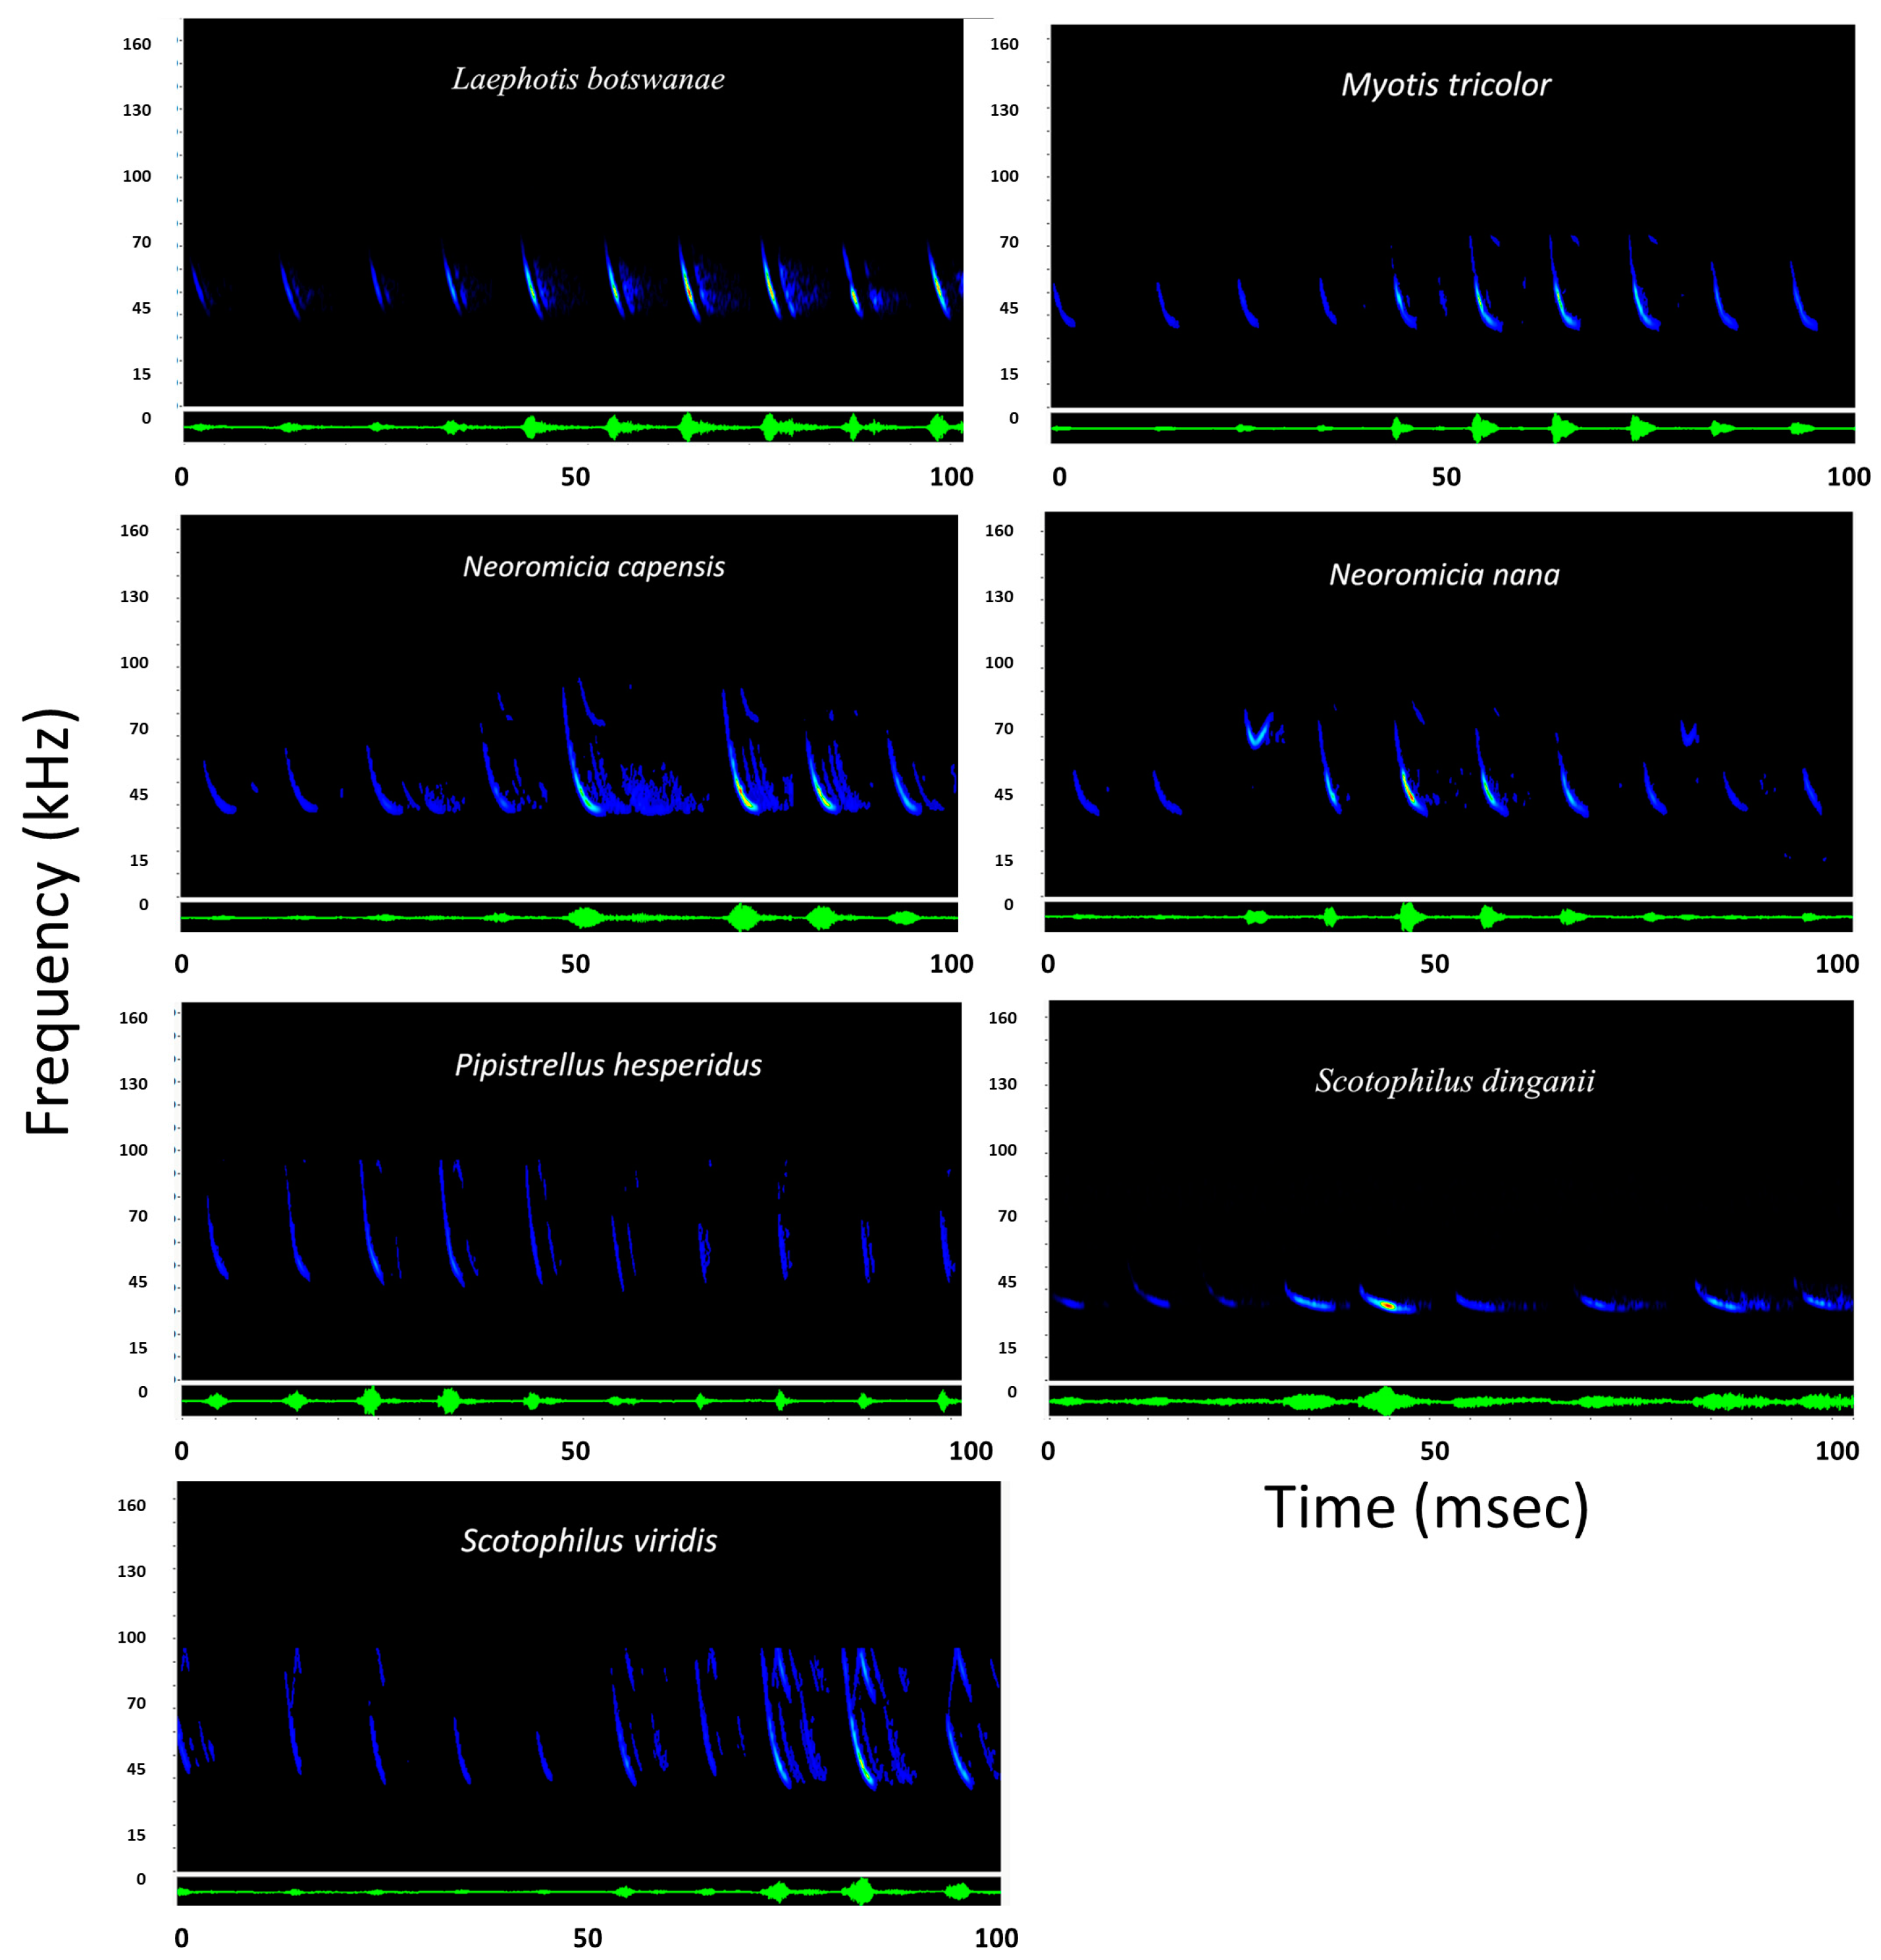
Representative sonogram for bats in the family Vespertilionidae presented using Sonobat 4.1. y-axis is frequency in kilohertz (kHz) and x-axis is time standardized over 100 milliseconds (msec). Blue coloration indicates lowest sound intensity of the call, yellow indicates medium intensity, and red indicates highest intensity or loudest portion of the call. Green display represents an oscillogram of the call sequence.
Figure 5.
Representative sonogram for bats in the family Vespertilionidae presented using Sonobat 4.1. y-axis is frequency in kilohertz (kHz) and x-axis is time standardized over 100 milliseconds (msec). Blue coloration indicates lowest sound intensity of the call, yellow indicates medium intensity, and red indicates highest intensity or loudest portion of the call. Green display represents an oscillogram of the call sequence.

Figure 6.
Distribution of activity levels for the 12 bat species identified in Kgalagadi Transfrontier Park in 2016. Species abbreviations in figure represent the first three letters of the generic and specific names and correlate with the list provided + indicates highest detection rates.
Figure 6.
Distribution of activity levels for the 12 bat species identified in Kgalagadi Transfrontier Park in 2016. Species abbreviations in figure represent the first three letters of the generic and specific names and correlate with the list provided + indicates highest detection rates.

Figure 7.
Distribution of activity at each site. (A) Neoromicia capensis (NEOCAP) was the most abundant species in the park and was found to occur at all sites; (B) Second most common species was Scotophilus dinganii (SCODIN), recorded at eight sites, followed by Tadarida aegyptiaca (TADAEG), Scotophilus viridus (SCOVIR), and Scotophilus viridus (SCOVIR), which were found at seven of 10 sites; (C) Least number of passes were recorded for Myotis tricolor (MYOTRI), Sauromys petrophilus (SAUPET), Chaerephon pumilus (CHAPUM), Miniopteris schriebersii (MINSCH), Neoromicia nana (NEONAN), Pipistrellus hesperidus (PIPHES), Rhinolophus fumigatus (RHIFUM), and Laephotis botswanae (LAEBOT). WH = Water Hole, DS = Dry Site, TW = Twee Rivieren gate, a dry site paired with Samevloeiing WH.

Figure 8.
Distribution of activity between paired dry and wet sites sampled simultaneously. Wet sites indicate drinkable water source for bats. Dry = reference sites approximately 1 km from wet sites. Overall, Χ2 analysis indicated significantly higher activity at dry sites. Open dots indicate mean temperature with standard deviations over the recording periods. Only Houmoed showed more activity at the water source than the reference dry site. Tukey-Kramer analysis on mean temperatures (gray dots with bars indicating standard deviations) indicated that the night Houmoed was sampled (mean = 23.1 °C, SD = 3.6) was significantly higher (DF = 430, CV = 3.15, P = 0.0001) than on the other sampling nights (Leeuwdril 19.8 °C, SD 3.9 and Samevloeiing 23.3 °C, SD = 3.1).

Figure 9.
Activity (defined as number of passes) at the three paired sites in relation to three time-blocks representing activity periods (1850–2320 h, 2321–0121 h, and 0122–0522 h) (A) Leeuwdril (13 April 2016); (B) Houmoed (4 April 2016); and (C) Samevloeiing (11 April 2016). Blue = water sources and Orange = dry sites. Most activity at water sources was consistently higher in the earliest time blocks, whereas activity was more variable at dry sites but generally increased between sunset and 2200 h; (D) Mean changes in temperature from sunset to sunrise during the sampling periods showed declines over the sampling periods, with Leeuwdril and Houmoed showing steepest and nearly identical declines. Samevloeiing showed a more gradual temperature decline throughout the night.


Table 1.
Site specific data for sonar surveys, including survey date, latitude, longitude, and elevation. Colors indicate sites paired as dry and wet.
Table 1.
Site specific data for sonar surveys, including survey date, latitude, longitude, and elevation. Colors indicate sites paired as dry and wet.
| Site | Survey Date | Latitude | Longitude | Elevation |
|---|---|---|---|---|
| Kamqua | 10 April 2016 | S 26°01′20.7″ | E 20°24′17.3″ | 904 m |
| Mata Camp | 10 April 2016 | S 25°49′26.98″ | E 20°00′25.13″ | 952 m |
| Samevloeiing Water Hole | 11 April 2016 | S 26°28′10.3″ | E 20°36′55.9″ | 869 m |
| Twee Rivieren Gate | 11 April 2016 | S 26°28′22.3″ | E 20°36′48.0″ | 870 m |
| Houmoed Water Hole | 12 April 2016 | S 26°20′22.5″ | E 20°35′27.6″ | 878 m |
| Houmoed Dry Site | 12 April 2016 | S 26°20′53.6″ | E 20°35′40.4″ | 873 m |
| Leeuwdril Water Hole | 13 April 2016 | S 26°23′07.5″ | E 20°41′51.6″ | 875 m |
| Leeuwdril Dry Site | 13 April 2016 | S 26°22′35.7″ | E 20°41′50.6″ | 878 m |
| Melkvlei | 14 April 2016 | S 26°08′19.4″ | E 20°51′25.8″ | 892 m |
| Dikbaardskolk | 14 April 2016 | S 26°46′13.7″ | E 20°43′46.9″ | 926 m |
Table 2.
Families and affiliated species of bats identified by their sonar calls from Kgalagadi Transfrontier Park in 2016.
Table 2.
Families and affiliated species of bats identified by their sonar calls from Kgalagadi Transfrontier Park in 2016.
| Rhinolophidae | Molossidae | Miniopteridae | Vespertilionidae |
|---|---|---|---|
| Rhinolophus fumigatus | Chaerephon pumilus Sauromys petrophilus Tadarida aegyptiaca | Miniopteris schreibersi (natalensis) | Laephotis botswanae Myotis tricolor Neoromicia capensis Neoromicia nana Pipistrellus hesperidus Scotophilus dinganii Scotophilus viridus |
Table 3.
Call parameters by species provided by Kaleidoscope bat analysis software. Fc = mean characteristic frequency, Fmax = mean maximum frequency, Fmin = mean minimum frequency, Dur = mean duration, N = sample size, MR = Matching Rate (i.e., number of calls in sequence that matched species identification with 1 = 100% match).
| Species | Family | Fc | Dur | Fmax | Fmin | N | MR |
|---|---|---|---|---|---|---|---|
| Rhinolophus fumigatus | Rhinolophidae | 53.9 | 40.1 | 54.4 | 53.6 | 1 | 0.9 |
| Chaerophon pumilus | Molossidae | 22.9 ± 0.3 | 5.6 ± 1.5 | 25 ± 0.1 | 22.4 ± 0.4 | 2 | 0.9 |
| Sauromys petrophilus | Molossidae | 24.0 ± 0.2 | 4.3 ± 0.7 | 30.3 ± 3.2 | 23.7 ± 0.1 | 2 | 1 |
| Tadarida aegyptiacus | Molossidae | 21.6 ± 1.2 | 4.9 ± 0.6 | 25.2 ± 1.1 | 21.2 ± 1.1 | 5 | 1 |
| Miniopteris schreibersi | Miniopteridae | 47.6 ± 6.5 | 2.6 ± 0.4 | 76.7 ± 7.7 | 53.2 ± 4.9 | 3 | 1 |
| Laephotis botswanae | Vespertilionidae | 38.8 ± 0.7 | 2.2 ± 0.3 | 68.5 ± 0.5 | 37.9 ± 0.9 | 3 | 1 |
| Neoromicia capensis | Vespertilionidae | 36.9 ± 0.6 | 3.5 ± 0.5 | 39.6 ± 4.3 | 36.7 ± 0.6 | 10 | 1 |
| Neoromicia nana | Vespertilionidae | 61.5 ± 8.9 | 3.7 ± 0.3 | 74.3 ± 6.2 | 61.1 ± 3.5 | 2 | 0.8 |
| Scotophilus dinganii | Vespertilionidae | 33.9 ± 2.4 | 3.3 ± 0.9 | 40.9 ± 2.1 | 33.4 ± 2.0 | 4 | 1 |
| Scotophilis viridus | Vespertilionidae | 37.5 ± 1.6 | 4.3 ± 0.3 | 70.6 ± 6.6 | 36.7 ± 1.8 | 3 | 0.9 |
| Pipistrellus hesperidus | Vespertilionidae | 43.3 ± 3.1 | 2.3 ± 0.03 | 53.6 ± 1.6 | 42.9 ± 3.4 | 2 | 0.85 |
| Myotis tricolor | Vespertilionidae | 41.8 ± 4.3 | 2.9 ± 0.9 | 81.5 ± 6.2 | 38.8 ± 2.2 | 6 | 1 |
© 2018 by the authors. Licensee MDPI, Basel, Switzerland. This article is an open access article distributed under the terms and conditions of the Creative Commons Attribution (CC BY) license (http://creativecommons.org/licenses/by/4.0/).
Share and Cite
MDPI and ACS Style
Adams, R.A.; Kwiecinski, G. Sonar Surveys for Bat Species Richness and Activity in the Southern Kalahari Desert, Kgalagadi Transfrontier Park, South Africa. Diversity 2018, 10, 103. https://doi.org/10.3390/d10030103
AMA Style
Adams RA, Kwiecinski G. Sonar Surveys for Bat Species Richness and Activity in the Southern Kalahari Desert, Kgalagadi Transfrontier Park, South Africa. Diversity. 2018; 10(3):103. https://doi.org/10.3390/d10030103
Chicago/Turabian StyleAdams, Rick A., and Gary Kwiecinski. 2018. "Sonar Surveys for Bat Species Richness and Activity in the Southern Kalahari Desert, Kgalagadi Transfrontier Park, South Africa" Diversity 10, no. 3: 103. https://doi.org/10.3390/d10030103
Note that from the first issue of 2016, this journal uses article numbers instead of page numbers. See further details here.