Resource Availability May Not Be a Useful Predictor of Migratory Bat Fatalities or Activity at Wind Turbines


1
School of Geology, Energy, and the Environment, Texas Christian University, Fort Worth, TX 76129, USA
2
Department of Biology, Texas Christian University, Fort Worth, TX 76129, USA
*
Author to whom correspondence should be addressed.
Diversity 2018, 10(2), 44; https://doi.org/10.3390/d10020044
Submission received: 4 April 2018
/
Revised: 23 May 2018
/
Accepted: 30 May 2018
/
Published: 4 June 2018
(This article belongs to the Special Issue Diversity and Conservation of Bats)
Abstract
:A better understanding of the ultimate mechanisms driving bat fatalities at wind turbines (i.e., the reason why bats are coming in close proximity to wind turbines) could inform more effective impact reduction strategies. One hypothesis is that bats come into close proximity to turbines due to existing resources (e.g., roosting sites) in the immediate area. Thus, if resource hotspots for bats could be identified in areas proposed for wind energy development, then fatalities could be reduced by siting turbines away from such hotspots. To explore this, we conducted a resource mapping exercise at a 48 km2 wind energy facility in north-central Texas. We mapped known resources (such as water sources, roosting sites, foraging sites, and commuting routes) for the 6 bat species present and compared resource availability with observed fatalities and acoustic activity. Although resource mapping identified concentrations of known resources for all species, it did not predict bat activity or fatalities. For example, Lasiurus cinereus and Lasiurus borealis comprised >90% of the fatalities, yet we found no positive relationship between resource availability and fatalities or acoustic activity for either species. Furthermore, up to 33% of these fatalities occurred at turbines without known resources within 200 m of the turbines, demonstrating that the fine-scale distribution of resources may not effectively inform turbine siting for these two migratory species. The challenge, therefore, remains to determine why bats during the migratory season are coming in close proximity with wind turbines.
1. Introduction
It is widely recognized that large numbers of bats are killed at wind energy facilities globally [1,2]; and while this phenomenon is still not fully understood, efforts are being made to reduce such fatalities, reviewed in [3]. Yet, without knowing the ultimate mechanisms bringing bats in close proximity to wind turbines, we are currently constrained to implementing broad impact minimization strategies, such as curtailing operations during times when bats are thought to be at greatest risk of collision, e.g., [4,5]. Although there are obvious benefits to applying such strategies, mitigation aimed to offset the ultimate mechanisms leading to bat fatalities would likely be more effective [6]. One of the proposed hypotheses for bat fatalities at wind turbines is that wind energy facilities, or perhaps even individual turbines, are sited in areas that provide resources for bats [7,8,9]. Thus, if bats are in proximity to turbines because of existing resources in the wind energy facility, then pre-construction surveys that aim to identify areas suitable for bats could be used to effectively reduce bat fatalities simply by informing wind turbine siting to avoid such resource-rich areas [9,10].
Bats have five fundamental resource requirements that are commonly recognized and used to characterize suitable bat habitat: (1) water [11]; (2) food (i.e., foraging habitat) [12]; (3) shelter (i.e., roost sites) [13,14]; (4) mating opportunities, a seasonally-dependent resource [14,15]; and (5) a way to access the other four resources via commuting [16,17] and migratory routes [18]. Thus, if resource distribution is contributing to wind-turbine-associated bat mortality, then turbines sited near areas with higher concentrations of these resources (i.e., resource hotspots) should have higher numbers of bat fatalities in comparison to wind turbines situated in areas with few or no available resources.
One technique that can be used to determine whether resource hotspots are correlated with patterns of bat fatality at wind energy facilities is GIS-based resource mapping. It allows users to assess whether the distribution and abundance of a species in an area is associated with the fine-scale spatial distribution and abundance of resources and has successfully been used to inform wildlife harvesting, risk management, and conservation planning [19,20,21]. Thus, one objective of our study was to use this method to map the available resources for each bat species known to be present at an existing wind energy facility and then compare resource availability with bat fatality data gathered from long-term monitoring at the site. A second objective of the study was to compare available resources with acoustic bat activity across the site, as some studies have shown that activity levels are useful for predicting wildlife fatalities and vice versa [22,23,24]. However, emerging studies at wind energy facilities indicate that bat activity monitoring using acoustic detectors in particular is not as effective at predicting bat fatalities as originally anticipated [9,25,26]. Thus, there is a real need to further investigate this uncertainty and determine whether there is a positive correlation between resource availability, bat acoustic activity, and bat fatalities at operational wind farms.
If bats are in close proximity to turbines because of existing resources in the wind energy facility, we predict that areas with higher concentrations of resources should be able to support a greater abundance of bats, and therefore experience higher levels of bat fatality and activity at nearby turbines. Furthermore, as different species are known to vary their resource selection [27], we predicted that the locations of resource hotspots would be species-specific, as would the patterns of activity and fatality observed across the wind energy facility. We discuss whether our findings support the hypothesis that bats, or perhaps only some species of bat, are at risk from wind turbine collisions when the turbines are sited in areas that provide abundant resources. We also assessed whether fine-scale resource mapping, as a currently recommended pre-construction survey technique to reduce bat mortality, can effectively be used to guide wind turbine siting.
2. Methods and Materials
2.1. Study Site
We conducted our resource mapping exercise at an existing wind energy facility in north-central Texas where bat mortality and behavior have been previously studied, e.g., [28,29]. Wolf Ridge Wind, LLC (hereafter Wolf Ridge) is a utility-scale wind energy facility owned and operated by NextEra Energy Resources in north-central Texas, USA (33°43′53.538″ N 97°24′18.186″ W, Figure 1). The 48 km2 facility consists of 75 1.5-megawatt (MW) General Electric wind turbines spaced at a minimum of 1 ha and arrayed in a general east-west direction across two main habitat classifications: (1) open agricultural land, including cattle pastures, hay pastures, and cultivated winter wheat in the southern half of the site; and (2) encroaching shrub-woodland in the northern half of the site. The latter comprises a succession of aged trees with more mature trees (up to 6 m diameter at breast height) found predominately in a series of riverine valleys stretching from the Red River escarpment paralleling the northern boundary of the wind resource facility. The tree species in the area comprised predominately Texas oak (Quercus buckleyi), post oak (Quercus stellate), white shin oak (Quercus sinuate var. breviloba), sugar hackberry (Celtis laevigata), persimmon (Diospyros virginiana), ashe juniper (Juniperus ashei), and eastern red cedar (Juniperus virginiana). The turbines also vary in elevation from 324 to 365 m above sea level (mean = 345 m), with turbines at higher elevations located to the west of the site along the shrub-woodland and those at lower elevations on the eastern side of the site in open agricultural land.
2.2. Resource Hotspot Mapping
We built a species-specific resource map for each of the six bat species known to be present at Wolf Ridge: Lasiurus borealis, Lasiurus cinereus, Lasionycteris noctivagans, Perimyotis subflavus, Nycticeius humeralis, and Tadarida brasiliensis. To do this, we first mapped in ArcGIS version 10 (ESRI, Redlands, CA, USA) four of the known resources required by each species (i.e., water, foraging sites, roosting sites, and commuting routes). These represent resources that have been and are commonly used to identify important features and/or suitable habitat for bats in pre-construction surveys to inform proposed developments such as roads, housing, wind energy facilities, and other types of land-use change [1]. We did not, however, consider mating opportunities in this mapping exercise as little is currently known about this life history stage in the bats at our study site [27,30]. In the following sub-sections, we describe the construction of each resource map layer and finally the development of a resource hotspot map for each species.
2.3. Water Sources
As all six focal species appeared to drink from still- and slow-flowing water sources [27], we created a single map layer for this resource. In this polygon-based layer, we mapped all potential water sources available to bats in a ~106 km2 area, which included a 1 km buffer area from all the wind turbines. We selected this distance to ensure we had adequately encompassed the entire wind resource area. Water bodies across the site comprised 178 artificial stock ponds ranging from 410 to 13,436 m2 in surface area (mean ± SD = 2057 ± 1598 m2) and a concentration of streams within the riverines to the north of the site [11,31,32]. From behavioral surveys at stock ponds at the site and drinking surveys in a controlled bat flight facility (unpublished data), we know that all six species can drink from ponds with uncluttered surfaces >15 m2 in area), so we did not include ponds smaller than this in the layer (see also [11]). We used aerial photographs to determine the location of individual stock ponds and available GIS maps delineating water drainages (available on nationalatlas.gov) to identify potential streams. As all water sources tended to be ephemeral in nature at our site, particularly during the summer months, we ground-truthed each water source to confirm its presence and location between July and September in 2011 and 2012. For this exercise, we used a handheld Trimble GeoExplorer 5 Series (Trimble Navigation Limited, Sunnyvale, CA, USA) with ArcPad v.10.
2.4. Roosting Sites
From the available literature, each of the focal species appeared to have different roost site preferences (see Table 1, includes citations). We therefore created a point-based map layer for this resource for each species separately. To build the six roost map layers, we conducted a survey on-foot across the aforementioned ~106 km2 area in which we recorded the locations of all features in the landscape that provided a potential roost site for bats. Features included trees, dead standing wood, buildings, log piles, brush piles, other human-made structures, rock piles, and rock crevices. No caves or mines were known to be at the site. We used a handheld Trimble GPS to record the location of each feature and listed the characteristics that made that feature suitable for roosting bats. For example, for trees and dead standing wood, we recorded the presence of broken branches, cavities in branches, cracks in branches, loose bark, cracks in the trunk, cavities in the trunk, woodpecker holes, and thick-stemmed creeping vegetation. For buildings and other human-made structures, we recorded characteristics such as gaps in wood panels, stone work, and architrave, as well as an accessible roof cavity, chimney, loose roof tiles, and basement. Furthermore, we recorded any evidence of roost-use by bats such as urine staining, feces, and the presence of roosting bats. We conducted these field surveys from July to September in 2011 and 2012.
Once all potential roost sites were collated in a single GIS point-based shape file, we created species-specific roost map layers by selecting only features and characteristics that were suitable for each species as listed in Table 1. As we used known roosting preferences, it is possible that not all potential roosting sites were identified. However, as these preferences represent the majority of potential roosts for each species, we anticipated that any unknown sites would not substantially alter the resource availability maps, including the position of resource hotspots. We assumed that the more characteristics a feature had, the more roosting opportunities would be available for a particular species. Each feature was therefore given a species-specific score based on the number of characteristics available for a specific species (i.e., one point was given for each characteristic present on a feature). For example, a tree with woodpecker holes and a cavity in the trunk was given a score of 2 for Lasionycteris noctivagans, and for species known to only roost among the foliage of trees, such as Lasiurus borealis and Lasiurus cinereus, a generic score of 1 was given for each tree present.
2.5. Foraging Sites
From the available literature, each of the focal species appeared to have different foraging preferences [27]. Using ground-truthed high-resolution aerial photographs of the site, we created one polygon-based map layer for this resource for each species. As Lasiurus borealis are generally found foraging along forest edges and in woodland clearings beneath the tree canopy [27,35,36], we created a representative foraging buffer around all available edge woodland habitat, inside woodland clearings, along trails, stream corridors and roads through the interior of the woodland habitat, and along intact tree lines branching from woodland habitat [37]. For Lasiurus cinereus, which tend to forage above the forest canopy and along the woodland edge, we included all woodland habitat and a buffer around the edge of this habitat type [27,38]. Similarly, as Lasionycteris noctivagans typically forage in and near wooded habitat and around water sources, we created a foraging map layer that included all woodland habitat and water sources and a buffer around the edge of the woodland habitat and accessible water sources (see commuting routes below) [27,36,38]. For Perimyotis subflavus, which are known to forage along woodland edges and near solitary mature trees, we included small patches of trees and tree lines in addition to the buffer around woodland habitat as Perimyotis subflavus are thought to venture into more open habitat if large mature trees are nearby [27,33,39]. As Nycticeius humeralis are known to forage above the tree canopy and from edges of woodland habitat, as well as into remnant agricultural fields near woodland edges, we created a foraging map layer that included all woodland habitat and a buffer around the edge of that habitat type [27,40,41]. Finally, as Tadarida brasiliensis forage on swarms of high-flying invertebrates that are not associated with a particular habitat type, we created a foraging map layer for this species that encompassed the entire study site [27]. With the exception of Tadarida brasiliensis, none of the other focal species were known to readily forage in open habitats. Although the exact distance is not yet known and will vary by species and with local environmental conditions, studies indicate that edge species, such as those found at our site, tend to venture no further than 40 m into open habitat [38,42]. The buffers included in our foraging map layers were, therefore, set to extend 40 m from suitable habitat edges to encompass the majority of potential foraging areas.
2.6. Commuting Routes
In order for bats to get to and from foraging sites, roosts, and water sources, they commonly use commuting routes [43]. These routes tend to follow linear features in the landscape, which not only allow the bats to reach known resources quickly and efficiently, but also offer some level of protection from predators [44]. Using a handheld Trimble GPS and available aerial photographs, we conducted a survey on-foot across the entire wind resource area to record the locations of all potential commuting routes available to bats. These included intact tree lines, woodland edges, canopy-covered dirt and gravel trails, stream corridors, and roads through the interior of the woodland habitat [17,37,44]. As the use of such features has been observed among a wide range of bat species, including many of our focal species [17], we created a single polygon map layer for all species at our study site, with the exception of Tadarida brasiliensis. For this species, a commuting resource map was not created because it is unlikely that commuting corridors would be used to reach the heights at which this species forages.
2.7. Species-Specific All-Encompassing Resource Map
All polygon-based map layers (the water sources, foraging sites, and commuting route layers) were converted to point-based map layers using the ‘fishnet’ tool in ArcGIS (i.e., a single point was created in each 1 m by 1 m cell making up each polygon). For each species, we combined the applicable resource point-based map layers (4 resource layers for all species with the exception of Tadarida brasiliensis which had 3 layers only) to produce a single composite shape file (i.e., if there were two potential roost sites, a water source, and a foraging site in a 1 m2 cell, there would be 4 points in that cell). Note that a 1 m2 cell is likely to only include a section or portion of a commuting route, foraging site or water source, and not, for example, encompass a water source in its entirety. We then used an ArcGIS tool known as ‘point statistics analysis’ to sum the number of point locations within all the 1 m2 cells across the entire wind resource area. We used these summed values to build raster maps for each focal species, delineating where available resources were concentrated. These species-specific resource hotspot maps ranged in color from white, representing the highest density of points recorded in a 1 m2 cell as a result of our mapping exercise, to black, in which no resources were present. Lastly, to compare resource availability for each species with fatality and acoustic activity (see below), we used the highest density of points recorded in a cell within successive 25 m radius annuli extending from each wind turbine out to 200 m. Thus for each species, we had 8 distance-related resource variables. For this, we ranked the point densities within each species-specific resource hotspot map from 0 (black) to 150 (white). Hotspots were also defined as areas ranked in 100 to 150 range.
2.8. Fatality Searches
In this analysis, we included data collected during standardized fatality searches from July-September 2009 to 2013 at a subset of the wind turbines at Wolf Ridge that were operated using the manufacturer’s cut-in speed of 3.0 m/s. We selected this period as it coincides with the fall migration of bats through the area [45] and 95% of bat carcasses have been recovered during this 3-month period [28]. Using a team of 2 to 3 field technicians, we searched for bat carcasses using a 1–2 day search interval at 10 to 16 of the 75 wind turbines in each of the five years (n = 28 turbines in total). These 28 turbines were selected because they were broadly distributed across the wind farm and had a high proportion of searched area that consisted of gravel, bare ground, and low vegetation (<15 cm) within 60 m of the turbine tower and were free of trees, shrubs, or other large obstructions within 60 m of the turbine. In 2009 and 2010, search plot was 1.13 ha (ca. 60 m radius). Based on the observed carcass fall distribution from wind turbines in 2009 and 2010 (data not shown), we reduced the search plot to 0.38 ha (ca. 35 m radius) in 2011 to allow us to search for bats at a larger number of turbines as part of an operational curtailment study conducted from 2011 to 2013 (unpublished data). The fatality data from 2011 to 2013 are from the control turbines only (i.e., those that were operated at the manufacturer’s cut-in speed of 3.0 m/s) and, therefore, comparable to the turbines searched in 2009 and 2010. In all years, the search order of turbines was rotated between searches.
During each plot search, we attached and then fully extended either a 60 m (2009 and 2010), 35 m (2011 and 2012), or 45 m (2013) rope from the base of the wind turbine tower. In all searches, the technicians would position themselves at the distal end of the rope, and holding the rope taut, they would then walk slowly while scanning the ground for carcasses. During the search, the rope would wind around the tower and the search ended when the most distal technician reached the turbine tower base. The search direction (clockwise vs. counter-clockwise) and attachment point of the rope to the wind turbine tower (0–89°, 90–179°, 180–269°, and 270–359°) were rotated between searches.
Upon discovery, the location of each bat carcass was marked with a 12 inch pin flag. After the search was completed, we then processed the bat carcasses that were found and recorded the date, turbine number, time of day, carcass location (distance and azimuth from the tower), estimated time since death, species (confirmed by DNA barcoding) [46], and sex (confirmed by PCR) [47]. We also conducted searcher efficiency and carcass persistence trials throughout the fatality monitoring periods, as the data collected from these trials are commonly used to estimate fatality rates at the level of the entire wind farm by adjusting carcass counts for the proportion of carcasses that remain undetected, e.g., [48,49]. As these correction factors are not estimated on an individual turbine basis, we do not include these data in this study because we used unadjusted carcass counts per turbine as the response variable in our analyses (see below).
For each species at each turbine, we calculated a fatality index (FI) by dividing the total number of carcasses found during standardized fatality searches by the total number of searches conducted over this five-year period. We excluded turbines with fewer than 12 standardized searches per year from the analysis. In total, 3562 turbine searches were included in this analysis. The mean ± SD number of searches per turbine per year was 54.6 ± 15.3 (Range: 23 to 81 searches). Most turbines (n = 16 of 28) were searched in 2 of the 5 years (Range: 1 to 5 years). Note that the FI values we calculated do not attempt to provide an estimate of the total bat fatality at this site; rather, the FI values allow us to compare relative levels of observed fatality among the surveyed turbines. Therefore, we do not provide estimates of fatality that are adjusted for biases such as searcher efficiency and scavenger removal rates.
2.9. Acoustic Activity Monitoring
From July to September 2011, 2012, and 2013, we undertook acoustic transect walks (i.e., mobile transects) along the gravel roads adjacent to wind turbines at Wolf Ridge Wind. In 2011 and 2012, we surveyed 10 1-km transects that encompassed approximately 60% of gravel roads within the wind energy facility (Figure 1). In 2013, we modified three of the 10 transect routes to allow us to survey an additional 20% of the gravel roads adjacent to more wind turbines (Figure 1). Thus, 50 of the 75 wind turbines present at the site were included in these surveys. During the survey season, we walked each transect once every two weeks and surveyed two separate transects simultaneously in a night. Transects started at dusk and continued for three hours in order to capture the primary foraging period of the bat species known to be at the site [50]. The full length of each transect was walked six times in this 3 h period with two field surveyors keeping to a relaxed steady pace. One surveyor was equipped with a D240x Pettersson acoustic bat detector (Pettersson, Sundsvall, Sweden), headphones, and a TASCAM DR-40 handheld recorder, while the other surveyor carried a handheld eXplorist Pro 10 Magellan GPS. We set the bat detector at a frequency of 40 kHz for bat echolocation calls to be audible from 10 kHz to 80 kHz (i.e., within the frequency range of species known to be at the site). We also set the detector to store a loop buffer of 3.4 s, equating to a 34 s recording in time expansion (.wav format). When an echolocating bat was heard on the detector, the first surveyor would record the call. During the 34 s recording time, the surveyor would continue to walk at a slow steady pace. We adopted this strategy to ensure that bat activity was surveyed evenly across the entire transect. The second surveyor would record the location of the bat detected, time, surveyors present, and date using a custom-built automated form created in ArcPad 10 on the GPS unit. The recorded calls were then manually identified to species where possible using Sonobat version 3.03. A GPS map layer was then created in ArcGIS with the locations of recorded calls (hereafter referred to as bat passes) along each transect. Note that the bat detectors only effectively recorded bat echolocation calls within a ~20 m radius of the surveyor, essentially at or near ground level. While this detection range does not encompass all bat activity in the wind farm, and it certainly does not capture activity at heights within the rotor-swept zone, it did allow us to determine whether the distribution of known resources influenced bat activity in proximity to wind turbines (i.e., with the exception of foraging in the Tadarida brasiliensis, all of the water sources, foraging areas, roosting sites, and commuting routes identified in the mapping exercise were within 20 m of the ground).
For each species at each turbine included in the mobile transects (n = 50 turbines), we calculated an activity index (AI) by dividing the total number of bat passes by a measure of “surveyed turbine area” and the number of times the turbine was surveyed over the three-year period. To calculate the “surveyed turbine area” for each turbine, we first used ArcGIS to create a circle 5542 m2 centered on the turbine that reflected the size of the rotor-swept zone (blade length = 42 m). Second, we calculated the area of the mobile transect that was effectively surveyed during the acoustic survey at each turbine by multiplying the length of the gravel road within the above described turbine area by 2 times the detection range of the acoustic equipment (i.e., 20 m on either side of the surveyor as they walked the transect). Third, we divided the mobile transect area by the turbine area (i.e., 5542 m2) to estimate the proportion of area around each turbine that was surveyed for acoustic bat activity, i.e., the “surveyed turbine area”. For the 50 turbines included in these surveys, the mean ± SD proportion of surveyed turbine area was 20 ± 5 (Range: 10 to 25).
To calculate the total number of bat passes for each species for each turbine, we first used ArcGIS to create a 20 m buffer around each bat pass to represent the effective detection range of the bat detectors. We then summed the total number of bat pass buffers that intersected the mobile transect area for each turbine. In this manner, we were therefore able to assign individual bat passes representing relative abundance of activity to individual turbines. Finally, to calculate the AI values, we then divided the total number of bat passes by the proportion of area surveyed and the total number of transect walks. For example, if 5 bat passes from species A were recorded at turbine Y (with a proportion of area surveyed equal to 0.10) in 12 transect walks, then AI would equal 4.2. In contrast, if 5 bat passes from species A were recorded at turbine X (with a proportion of area surveyed equal to 0.60) in 12 transect walks, then AI would equal 0.7. Larger AI values indicate more species-specific acoustic activity compared to smaller AI values. Thus, the resulting AI provided a measure of bat activity for each species at each turbine weighted by search effort over the 3 survey years.
2.10. Analysis
In our analysis, we explored three potential relationships for each of the six bat species separately: resources versus fatalities, fatalities versus activity, and activity versus resources. As the activity and fatality indices calculated for each species separately were not normally distributed, we use Spearman’s rank correlation coefficients to estimate the strength and direction of each relationship using Minitab Statistical Software (v. 18.1 Minitab, Inc., State College, PA, USA) with α = 0.05.
3. Results
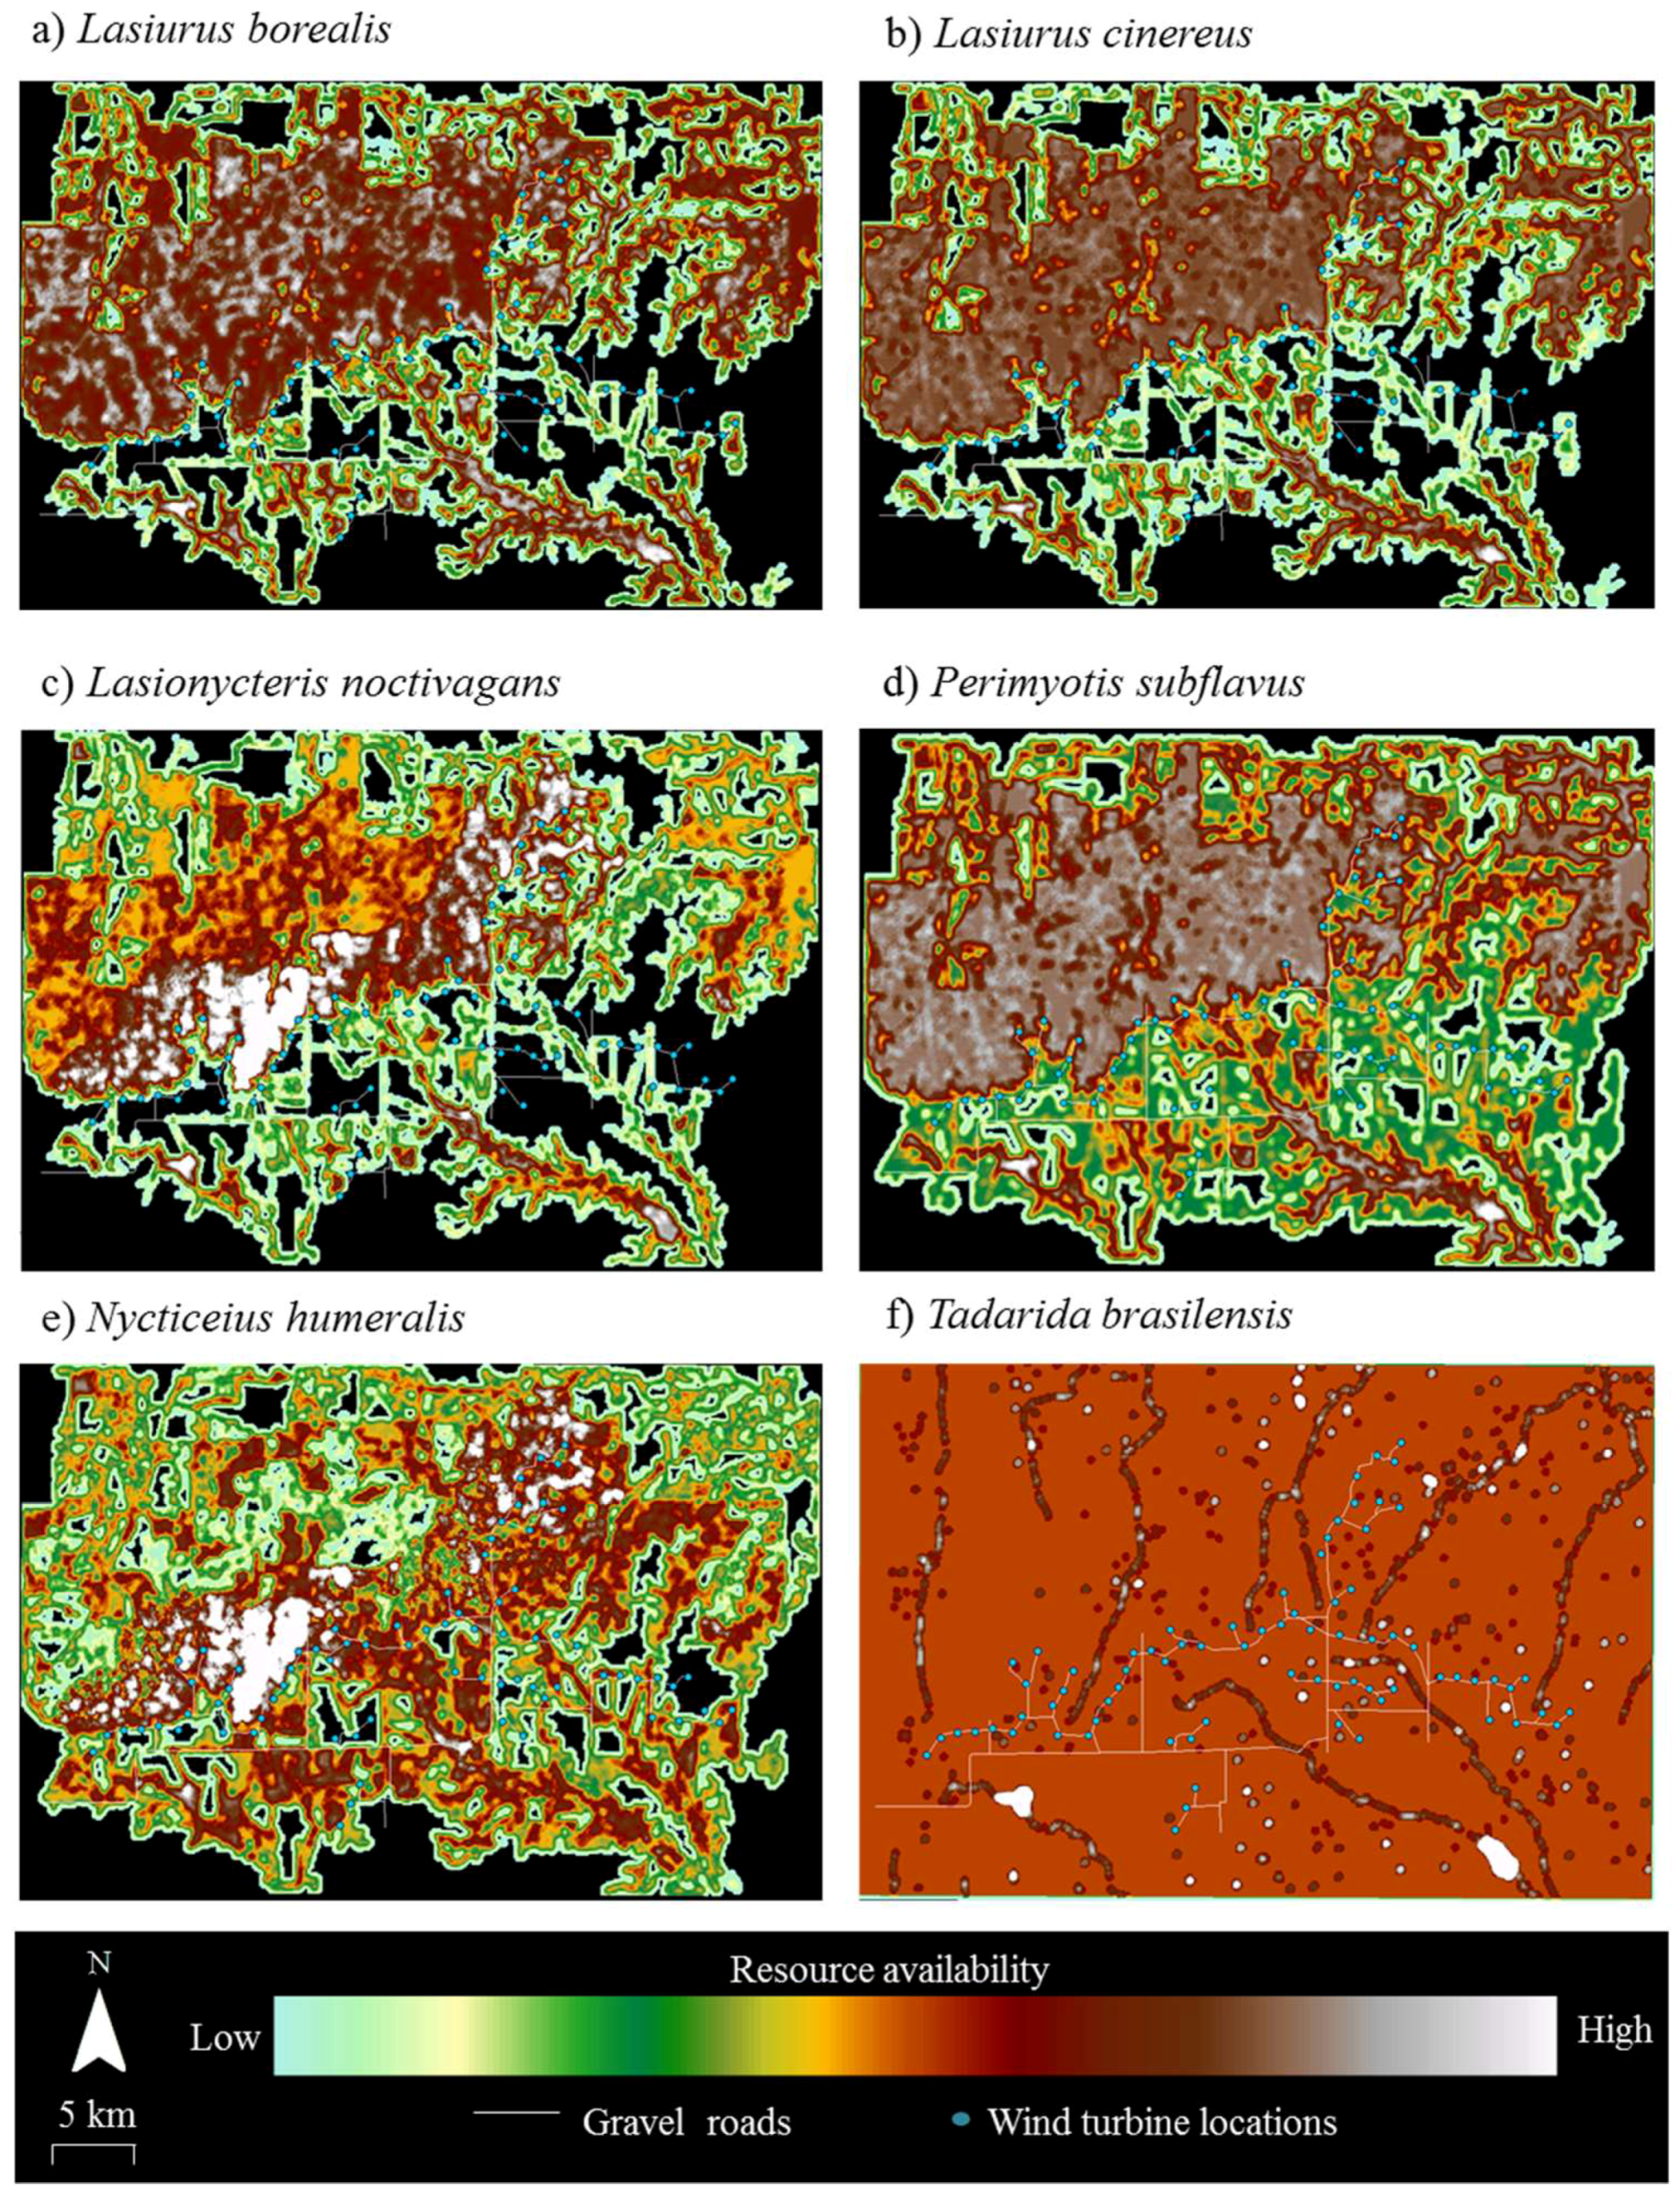
Resource mapping revealed that Wolf Ridge has concentrations of suitable resources for each of the six species known to be in the area, as well as areas with little or no available resources for each species (Figure 2). For example, resource hotspots (i.e., cells depicted in white) for Lasionycteris noctivagans (Figure 2c) were located to the north of the turbines extending from the western boundary of the wind resource area toward the north-central boundary, with few to no resources in the southernmost and southeastern part of the study area. In contrast, resources were more evenly distributed across the wind farm for Tadarida brasiliensis, with the exception of a few resource hotspots located at some of the larger stock ponds (Figure 2f). At the 58 turbines that were included within the acoustic transects walks and/or searched for bat carcasses in this analysis, resource availability within 200 m of the turbines ranged from 0 to 150 (where 150 was the maximum possible value) for Lasiurus borealis (mean ± SD = 102 ± 48), Lasiurus cinereus (mean ± SD = 87 ± 45), Lasionycteris noctivagans (mean ± SD = 88 ± 53), and Nycticeius humeralis (mean ± SD = 118 ± 32). For Perimyotis subflavus resource availability ranged from 40 to 140 (mean ± SD = 103 ± 32), and for Tadarida brasiliensis resource availability ranged from 80 to 140 (mean ± SD = 92 ± 16).
We recovered 712 bat carcasses during the standardized carcass searches at these turbines from July to September in 2009 to 2013. Carcasses from all six species known to be in the area were found, including Lasiurus borealis (n = 406 bats), Lasiurus cinereus (n = 230 bats), Lasionycteris noctivagans (n = 3 bats), Nycticeius humeralis (n = 29 bats), Perimyotis subflavus (n = 22 bats), and Tadarida brasiliensis (n = 20 bats). Due to DNA degradation, an additional 2 bat carcasses were unidentifiable to species. At the 28 turbines, bat fatality rates varied with observed FI ranging from 0 to 0.39 (mean ± SD = 0.18 ± 0.11 bats per turbine per search) over the five-year period (Figure 3). Two migratory tree bats, Lasiurus borealis and Lasiurus cinereus, had the highest observed FI values at this site (Figure 3a,b).
We conducted 282 mobile acoustic transects from 2011 to 2013 with an average of 4.5 bat passes (SD = 2.25) recorded per transect (range: 0 to 29 bat passes). A total of 1195 bat passes were recorded, and 201 of these occurred within an area equivalent to the extent of the rotor-swept zone extent of the wind turbines (hereafter referred to as the turbine area). We were able to identify 1098 bat passes to species: 580 bat passes from Lasiurus borealis (18.3% within the turbine area), 4 bat passes from Lasiurus cinereus (0% within the turbine area), 133 bat passes from Lasionycteris noctivagans (13.5% within the turbine area), 252 bat passes from Nycticeius humeralis (17.8% within the turbine area), 88 bat passes from Perimyotis subflavus (8.0% within the turbine area), and 40 bat passes from Tadarida brasiliensis (10% within the turbine area). At the 49 turbines encompassed by the acoustic transect walks, bat activity rates varied with observed AI ranging from 0 to 2.12 (mean ± SD = 0.60 ± 0.46 bat passes per turbine per search) over the three year period (Figure 4). Acoustic activity levels were highest for Lasiurus borealis (Figure 4a) and Nycticeius humeralis (Figure 4e).
3.1. Resources versus Fatalities
The results of the correlation analyses showed that fatalities were not positively associated with resources for any of the six species at Wolf Ridge (Table 2). In fact, Perimyotis subflavus showed a significant negative relationship between fatalities and resource availability <25 m from the turbines. When we examined the composite resource availability raster maps, fatalities of Lasionycteris noctivagans, Perimyotis subflavus, Nycticeius humeralis, and Tadarida brasiliensis predominantly occurred in areas with species-specific resources (Figure 3). Even for Tadarida brasiliensis, which appeared to have available resources distributed consistently across the wind resource facility, all 12 fatalities occurred within 100 m of a building or structure identified as a suitable roost site for the species. In contrast, the two species of migratory tree bats comprising the highest numbers of fatalities at our site had numerous fatalities at wind turbines in which the surrounding area had no resources (see black areas in Figure 2 and Figure 3). Among Lasiurus borealis and Lasiurus cinereus, 33% and 27% of the fatalities, respectively, occurred at turbines with few or no resources (i.e., with resource values between 0 and 50) within 200 m.
3.2. Fatalities versus Activity
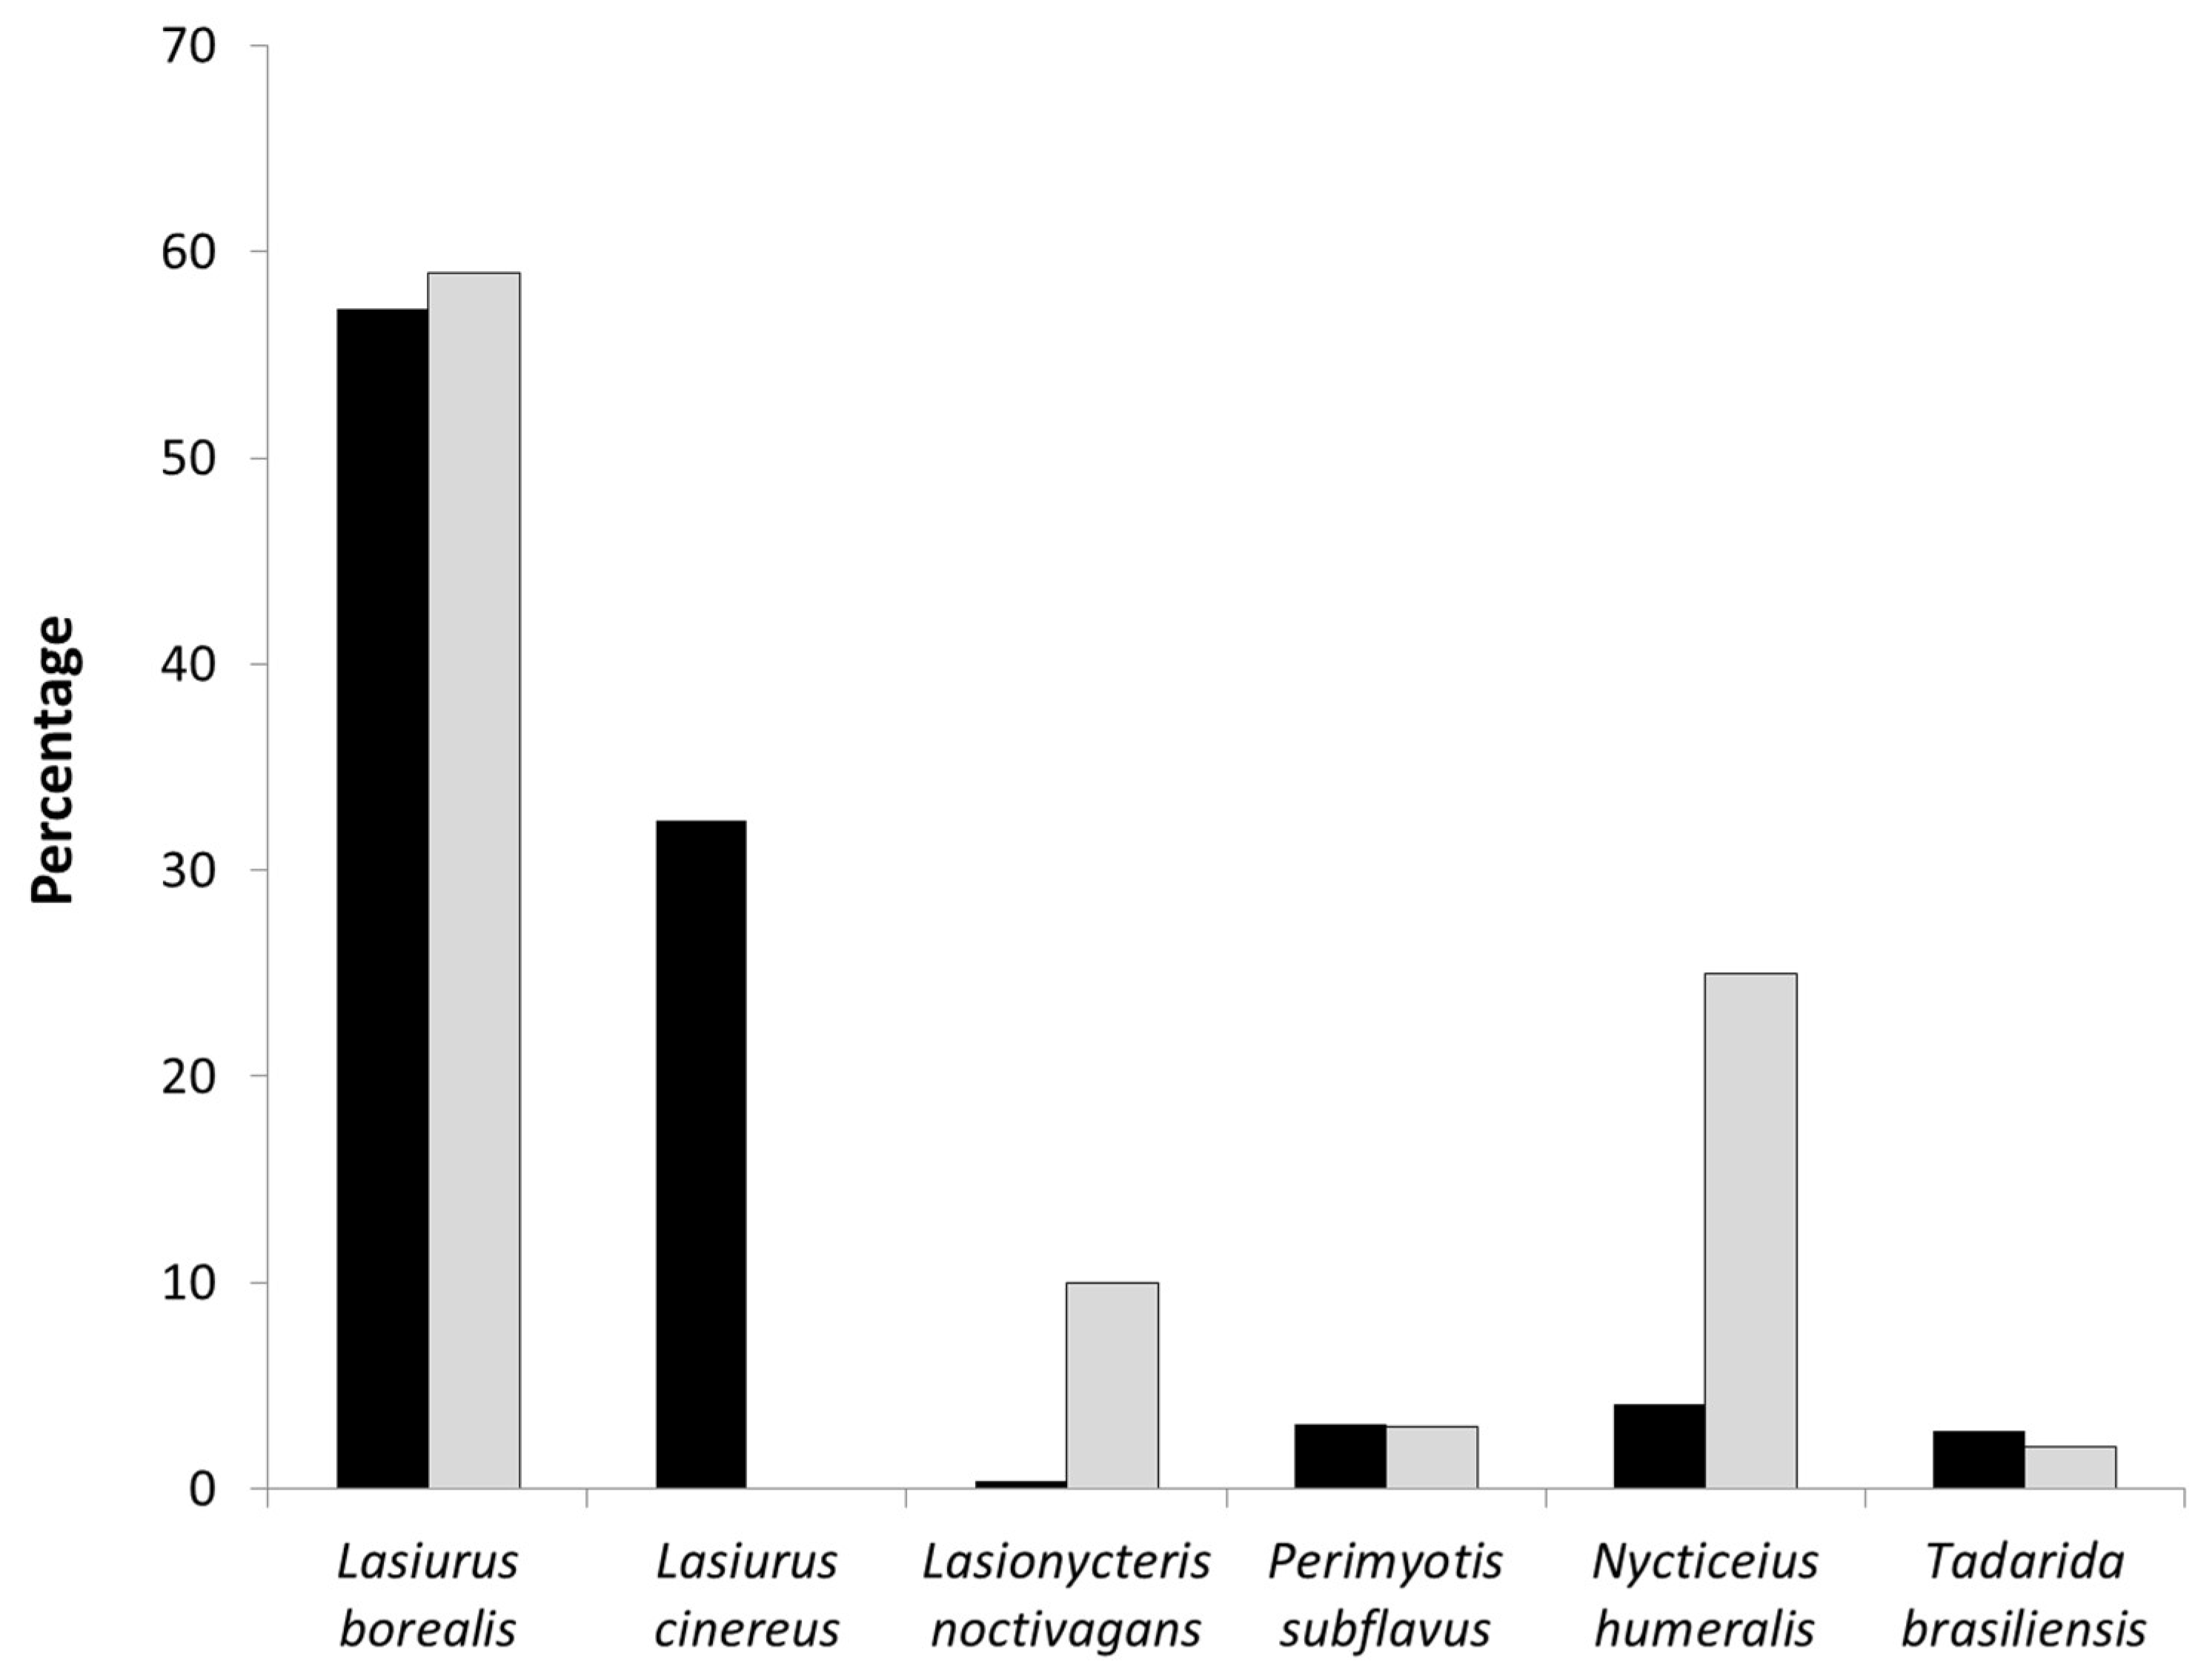
Comparing fatalities with acoustic activity recorded in the turbine areas, we found no significant relationship for all 6 species (Table 3). Note that as no Lasiurus cinereus acoustic calls were recorded in the turbine area, we were not able to include this high-fatality species in the correlation analysis. When we looked at these data for the wind energy facility as a whole, Lasiurus borealis, Perimyotis subflavus, and Tadarida brasiliensis had proportionally similar levels of activity and fatalities (Figure 5). The opposite pattern was observed for Lasionycteris noctivagans and Nycticeius humeralis with proportionally more bat passes recorded in the turbine areas than fatalities.
3.3. Activity versus Resources
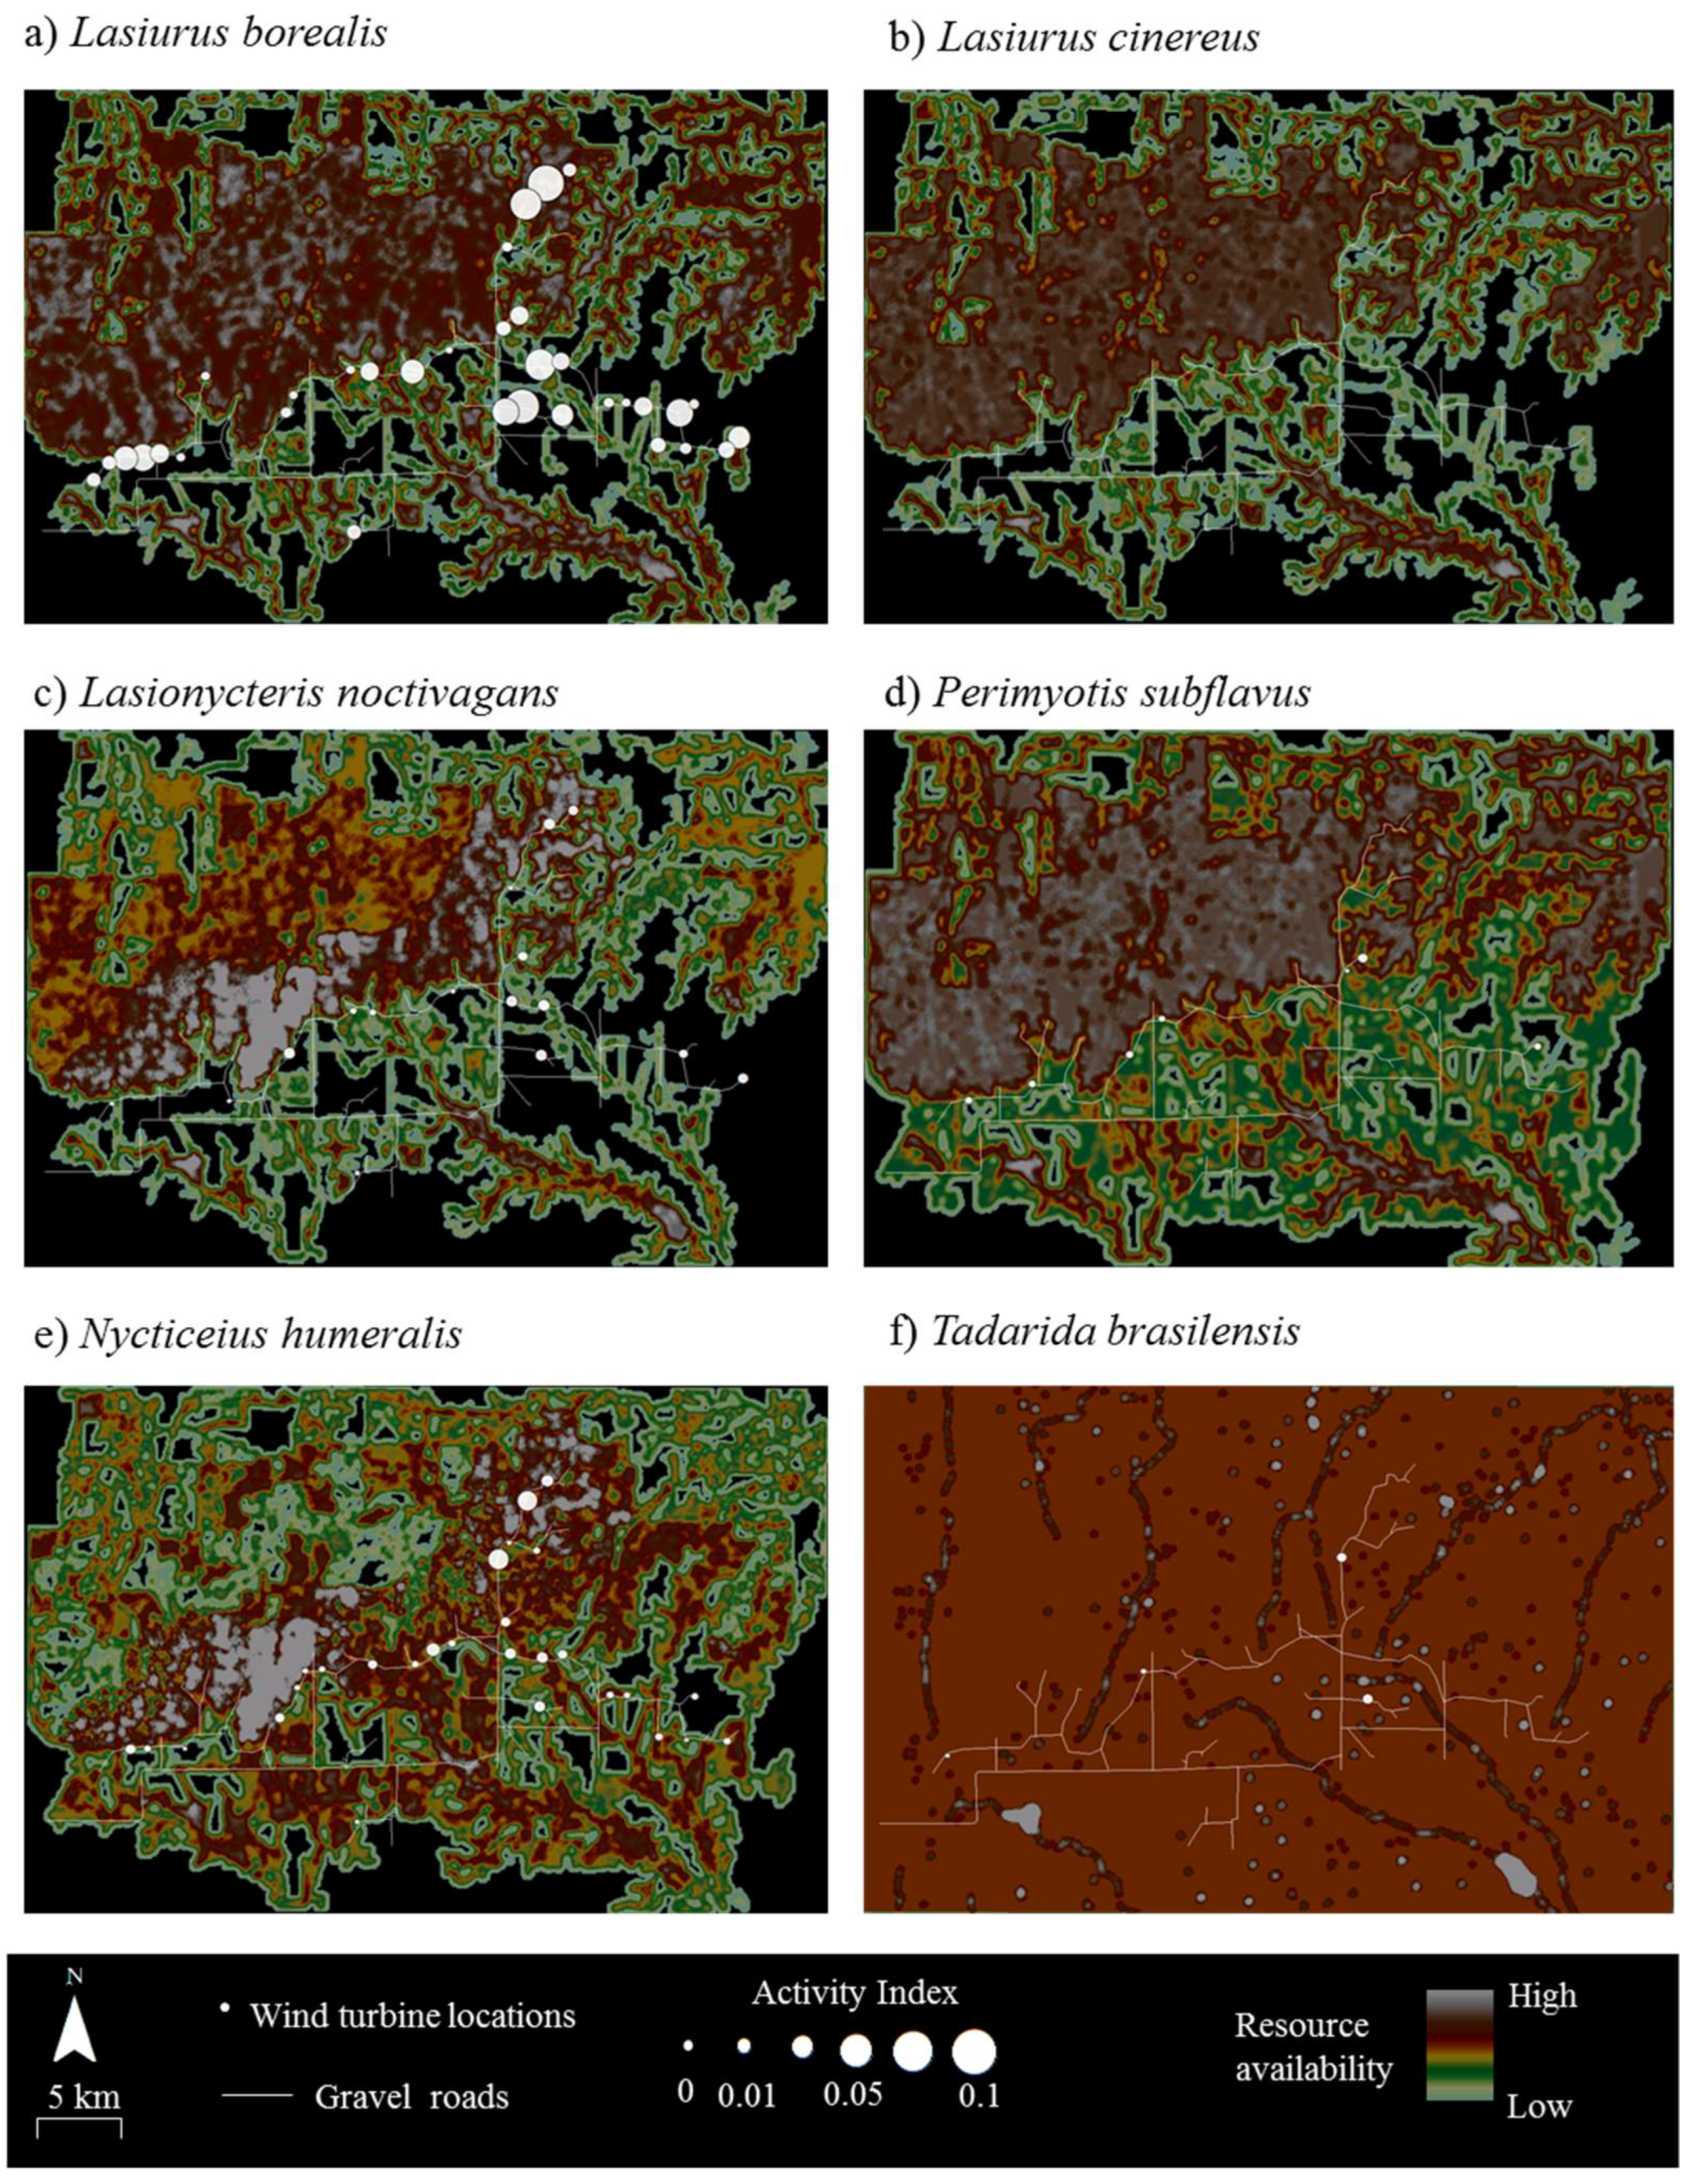
Both the correlation analyses (Table 4) and an examination of the raster maps (Figure 4) showed no relationship between acoustic activity and resource availability for any of the six bat species at Wolf Ridge. Moreover, 20% of Lasiurus borealis acoustic activity was recorded at wind turbines with no known available resources within 200 m of those turbines. Finally, as no Lasiurus cinereus calls were recorded during our mobile transect surveys, we were not able to include the species in the correlation analysis.
4. Discussion
From this study, we determined that among the two species (Lasiurus cinereus and Lasiurus borealis) that make up >90% of the fatalities recorded at Wolf Ridge, there was no significant positive relationship between known resource availability (including resource hotspots) and bat fatalities. Furthermore, ~30% of these fatalities were observed at wind turbines that appeared to have little to no known resources for bats in the immediate vicinity; these turbines were located in open, short-grass, cattle-grazed fields with no trees or shrubs within 200 m. These findings strongly suggest that mapping known resources, as a pre-construction survey technique, is unlikely to be effectively used to inform wind turbine siting intended to minimize fatalities of these two migratory species.
We also determined that among the 6 species at our site, there was no significant relationship between fatalities and acoustic activity. Lasiurus borealis had both the highest numbers of fatalities and acoustic bat passes recorded at the wind turbines; the high amount of acoustic activity recorded at the wind turbines suggests that Lasiurus borealis was active at or near turbines, including those situated away from resources. In comparison, low levels of Perimyotis subflavus acoustic activity within the turbine area suggest that this species could be avoiding wind turbines or is not common at our site. Similarly, the low levels of observed fatality and acoustic activity in Tadarida brasiliensis with no correlation between the two variables, indicates that either this species was not common at our site and/or they may be avoiding areas within ~50 m of wind turbines. The mobile transect data suggests that the latter interpretation may be more likely for Tadarida brasiliensis as 90% of the acoustic activity was recorded outside the RSZ buffers.
In comparison, we observed an opposite trend among Lasionycteris noctivagans and Nycticeius humeralis, with proportionally more acoustic activity being recorded in the turbine areas compared to fatalities. Thus, it would be interesting to determine whether both these species are coming into close proximity with wind turbines, but they are not at risk of encountering wind turbine blades. Studies have shown that within their home range, bats navigate relatively direct routes from their roosts to quality foraging habitat patches, avoiding areas deemed risky [17,51]. Through such habitat recognition, some species may avoid areas with risky features completely, while others, potentially Lasionycteris noctivagans and Nycticeius humeralis, may be able to assess risk on a smaller scale and simply avoid the immediate threat [52].
Finally, Lasiurus cinereus, which comprised the second highest number of observed fatalities, were rarely detected acoustically during our mobile transects and not one bat pass was recorded within ~50 m of the turbines. However, in another survey at Wolf Ridge, acoustic data collected from bat detectors placed on the nacelles of the wind turbine at our site not only confirmed that Lasiurus cinereus were acoustically active at heights between 45 and 115 m, but that they were also the most commonly recorded species from nacelle-height [53]. These contradictory results suggest that Lasiurus cinereus are in proximity to wind turbines, essentially in the rotor swept zone, for reasons other than to utilize the resources we measured in this resource mapping exercise. This idea is not a new one, as it is supported by a number of studies that propose that migratory bats, such as Lasiurus cinereus, are potentially attracted to the wind turbines themselves because they are perceived as providing one or more resources for the bats [14,29].
Finally, our study revealed no relationship between known resource availability and acoustic activity in the turbine area, suggesting that resources cannot be used to predict activity, or vice versa, and, therefore, risk of fatality, particularly for our migratory species (Lasiurus cinereus and Lasiurus borealis). This result may further indicate that certain species or even individuals avoid wind turbines, while others are active near them despite the lack of resources in the immediate area. It may also be a consequence of acoustic survey design and effectiveness. As previously mentioned, acoustic bat detectors can be limited in their detection range and the timing of surveys, placement of detectors, and species-specific detectability also influence data collection, thereby leading to highly variable survey results [53,54]. Nevertheless, as these limitations were considered in our acoustic survey design to investigate whether bat activity in proximity to wind turbines was influenced by the presence known resources, we believe that such factors did not influence the overall findings of the study.
Emerging guidelines for pre-construction surveys currently recommend that resource mapping surveys focus on identifying significant wildlife habitat for bats, such as the area encompassing hibernacula, maternity colonies, and migratory stopover areas [55]. The former two are effective recommendations for those species that hibernate in known winter roosts, have colonial maternity roosts, or both. Certainly, our study supports these recommendations, as suitable roost sites for Tadarida brasiliensis were identified in close proximity to all the wind turbines where fatalities were recorded. Furthermore, even though no statistical significance was found between resource availability and fatality for Lasionycteris noctivagans, Perimyotis subflavus, or Nycticeius humeralis, all fatalities of the species occurred in areas with resources. In fact, >60% of Perimyotis subflavus and >70% of Nycticeius humeralis fatalities occurred at wind turbines near resource hotspots, and despite the small sample size, all 3 Lasionycteris noctivagans fatalities were found in areas with a high concentration of resources for this species. These results suggest that resource mapping, as a currently practiced pre-construction survey technique, could be used effectively to guide wind energy facility siting for the aforementioned species as it is for bird and other wildlife species of conservation concern [10].
It is important to note, however, that Lasionycteris noctivagans, is one of three migratory tree-dwelling species consistently reported in the majority of bat fatalities at wind energy facilities in North America along with Lasiurus cinereus and Lasiurus borealis, reviewed in [56,57]. Although there is currently a need to gain a better understanding of migration routes, their summer and winter destinations, and the environmental cues that trigger migration, we do know these species make relatively long distance seasonal movements across North America during the spring (March to April) and fall (July to September) [4,58,59]. Yet at our site, while the latter two species make up the majority of fatalities during these periods, Lasionycteris noctivagans represents the least recorded species in the fatality-monitoring surveys we have conducted to date. These results suggest that either Lasionycteris noctivagans does not migrate through our site in north-central Texas, or it was not migrating through our site when we were conducting fatality monitoring surveys (beginning of July to the end of September). In contrast, as Lasionycteris noctivagans was consistently recorded in weekly acoustic surveys throughout our site, these results suggest that there is a population of individuals that remain in the area during the entire summer activity period (i.e., residents, not migrants passing through). Moreover, we consistently recorded all 6 of the species known to be at the site in acoustic monitoring during this summer activity period (March to October) and observed additional peaks in acoustic activity during this time among Lasiurus cinereus and Lasiurus borealis corresponding to spring and fall migration periods (unpublished data).
Nevertheless, our study demonstrated that bats during migratory season are not necessarily coming into close proximity to wind turbines as a result of nearby resources, such as trees and water sources. These results alone indicate that migrating bats are either flying at heights within the RSZ as they migrate through the area or these bats are specifically coming into close proximity to the wind turbines. Increasing evidence suggests that bats, migrating bats in particular, may be active at wind turbines because they perceive the turbines to provide a resource, such as a roost or mating site [14]. If this is the case, then current pre-construction surveys would not be able to predict potential activity or inform wind turbine siting effectively.
5. Conclusions
The challenge is to identify resources that are necessary for migrating individuals, particularly as we are currently unable to predict with certainty where migratory routes or stopover areas may be [4,22,53]. For our study, we focused primarily on mapping resources, such as foraging, commuting, and roosting sites that were all commonly associated with resident individuals. It is, therefore, perhaps not surprising that bats during the migratory season did not require these types of resources. Based on these results, resource mapping could potentially be effective for resident individuals, which may explain why about half of the Lasiurus cinereus and Lasiurus borealis fatalities were found in areas with resources, and the remainder were found in areas with little to no known resources; these may represent resident and migrating individuals, respectively. To explore this idea further, it may be possible to use stable isotope techniques to identify fatalities as either resident or migratory individuals [60]. Thus, future studies could focus on determining the resources that migratory bats need, whether they are in close proximity to wind turbines, provided or perceived to be provided by the wind turbines themselves, or some combination of these factors [29]. Also, we potentially need to consider that other factors or events at a scale larger than the wind resource area are channeling or guiding migratory bats to wind turbines, such as landscape topography and the presence or absence of large trees on the landscape [14,58]. Then once identified, minimization strategies aiming to reduce bat fatalities could be designed more effectively to target these factors (i.e., the ultimate causes of bat fatalities).
Author Contributions
Both authors conceived the study, participated in its design and coordination, conducted and supervised fatality surveys, analyzed and interpreted the data, and developed the final manuscript. V.J.B. conducted the resource mapping and acoustic surveys, and drafted the manuscript.
Funding
NextEra Energy Resources for provided financial assistance for this project and the TCU Open Access Fund for aiding the publication of this manuscript.
Acknowledgments
We thank NextEra Energy Resources personnel at Wolf Ridge Wind, LLC for their helpfulness in facilitating our surveys at the wind farm. Thanks to numerous field technicians, who have tirelessly collected fatality and acoustic data over many years. We also thank Jordan Watts for his assistant with the manuscript. The manuscript is dedicated to the memory of Richard Piper (7th June 1958 to 28th July 2013).
Conflicts of Interest
The authors declare no conflict of interest. The founding sponsors had no role in the design of the study; in the collection, analyses or interpretation of data, in the writing of the manuscript, or in the decision to publish the results.
References
- Arnett, E.B.; Baerwald, E.F.; Mattews, F.; Rodrigues, L.; Rodríguez-Durán, A.; Rydell, J.; Villegas-Patraca, R.; Voigt, C.C. Impacts of wind energy development on bats: A global perspective. In Bats in the Anthropocene: Conservation of Bats in a Changing World; Voigt, C.C., Kingston, T., Eds.; Springer: New York, NY, USA, 2016; pp. 295–323. ISBN 978-3-319-25220-9. [Google Scholar]
- O’Shea, T.J.; Cryan, P.M.; Hayman, D.T.S.; Plowright, R.K.; Streicker, D.G. Multiple mortality events in bats: A global review. Mamm. Rev. 2016, 46, 175–190. [Google Scholar] [CrossRef] [PubMed]
- Arnett, E.B.; May, R.F. Mitigating wind energy impacts on wildlife: Approaches for multiple taxa. Hum. Wildl. Interact. 2016, 10, 28–41. [Google Scholar]
- Baerwald, E.F.; Edworthy, J.; Holder, M.; Barclay, R.M.R. A Large-Scale Mitigation Experiment to Reduce Bat Fatalities at Wind Energy Facilities. J. Wildl. Manag. 2009, 73, 1077–1081. [Google Scholar] [CrossRef]
- Arnett, E.B.; Huso, M.M.P.; Schirmacher, M.R.; Hayes, J.P. Altering turbine speed reduces bat mortality at wind-energy facilities. Front. Ecol. Environ. 2011, 9, 209–214. [Google Scholar] [CrossRef]
- Martin, C.M.; Arnett, E.B.; Stevens, R.D.; Wallace, M.C. Reducing bat fatalities at wind facilities while improving the economic efficiency of operational mitigation. J. Mammal. 2017, 98, 378–385. [Google Scholar] [CrossRef]
- Cryan, P.M.; Barclay, R.M.R. Causes of bat fatalities at wind turbines: Hypotheses and predictions. J. Mammal. 2009, 90, 1330–1340. [Google Scholar] [CrossRef]
- Thompson, M.; Beston, J.A.; Etterson, M.; Diffendorfer, J.E.; Loss, S.R. Factors associated with bat mortality at wind energy facilities in the United States. Biol. Conserv. 2017, 215, 241–245. [Google Scholar] [CrossRef]
- Hein, C.D.; Gruver, J.C.; Arnett, E.B. Relating Pre-Construction Bat Activity and Post-Construction Bat Fataility to Predict Risk at Wind Energy Facilities: A Synthesis; A Report Submitted to the National Renewable Energy Laboratory; Bat Conservation International: Austin, TX, USA, 2013. [Google Scholar]
- Katzner, T.; Bennett, V.; Miller, T.; Duerr, A.; Braham, M.; Hale, A. Wind energy development: Methods for assessing risks to birds and bats pre-construction. Hum. Wildl. Interact. 2016, 10, 42–52. [Google Scholar]
- Seibold, S.; Buchner, J.; Bassler, C.; Muller, J. Ponds in acidic mountains are more important for bats in providing drinking water than insect prey. J. Zool. 2013, 290, 302–308. [Google Scholar] [CrossRef]
- Fuentes-Montemayor, E.; Goulson, D.; Cavin, L.; Wallace, J.M.; Park, K.J. Fragmented woodlands in agricultural landscapes: The influence of woodland character and landscape context on bats and their insect prey. Agric. Ecosyst. Environ. 2013, 172, 6–15. [Google Scholar] [CrossRef]
- Chaverri, G.; Kunz, T.H. Response of a Specialist Bat to the Loss of a Critical Resource. PLoS ONE 2011, 6. [Google Scholar] [CrossRef] [PubMed]
- Cryan, P.M.; Gorresen, P.M.; Hein, C.D.; Schirmacher, M.R.; Diehl, R.H.; Huso, M.M.; Hayman, D.T.S.; Fricker, P.D.; Bonaccorso, F.J.; Johnson, D.H.; et al. Behavior of bats at wind turbines. Proc. Natl. Acad. Sci. USA 2014, 111, 15126–15131. [Google Scholar] [CrossRef] [PubMed] [Green Version]
- Randall, J.; Broders, H.G. Identification and characterization of swarming sites used by bats in Nova Scotia, Canada. Acta Chiropterol. 2014, 16, 109–116. [Google Scholar] [CrossRef]
- Rainho, A.; Palmeirim, J.M. The Importance of Distance to Resources in the Spatial Modelling of Bat Foraging Habitat. PLoS ONE 2011, 6. [Google Scholar] [CrossRef] [PubMed]
- Bennett, V.J.; Zurcher, A.A. When corridors collide: Road-related disturbance in commuting bats. J. Wildl. Manag. 2013, 77, 93–101. [Google Scholar] [CrossRef]
- Furmankiewicz, J.; Kucharska, M. Migration of bats along a large river valley in southwestern Poland. J. Mammal. 2009, 90, 1310–1317. [Google Scholar] [CrossRef]
- Sawyer, S.C.; Brashares, J.S. Applying resource selection functions at multiple scales to prioritize habitat use by the endangered Cross River gorilla. Divers. Distrib. 2013, 19, 943–954. [Google Scholar] [CrossRef]
- Jalali, M.A.; Ierodiaconou, D.; Gorfine, H.; Monk, J.; Rattray, A. Exploring spatiotemporal trends in commercial fishing effort of an abalone fishing zone: A GIS-based hotspot model. PLoS ONE 2015, 10. [Google Scholar] [CrossRef] [PubMed]
- Rashidi, P.; Wang, T.; Skidmore, A.; Vrieling, A.; Darvishzadeh, R.; Toxopeus, B.; Ngene, S.; Omondi, P. Spatial and spatiotemporal clustering methods for detecting elephant poaching hotspots. Ecol. Model. 2015, 297, 180–186. [Google Scholar] [CrossRef]
- Baerwald, E.F.; Barclay, R.M.R. Patterns of Activity and Fatality of Migratory Bats at a Wind Energy Facility in Alberta, Canada. J. Wildl. Manag. 2011, 75, 1103–1114. [Google Scholar] [CrossRef]
- Iosif, R.; Rozylowicz, L.; Popescu, V.D. Modeling road mortality hotspots of Eastern Hermann’s tortoise in Romania. Amphibia-Reptilia 2013, 34, 163–172. [Google Scholar] [CrossRef]
- Bay, K.; Nasman, K.; Erickson, W.; Taylor, K.; Kosciuch, K. Predicting eagle fatalities at wind facilities. J. Wildl. Manag. 2016, 80, 1000–1010. [Google Scholar] [CrossRef] [Green Version]
- Bolivar-Cime, B.; Bolivar-Cime, A.; Cabrera-Cruz, S.A.; Munoz-Jimenez, O.; Villegas-Patraca, R. Bats in a tropical wind farm: Species composition and importance of the spatial attributes of vegetation cover on bat fatalities. J. Mammal. 2016, 97, 1197–1208. [Google Scholar] [CrossRef]
- Lintott, P.R.; Richardson, S.M.; Hosken, D.J.; Fensome, S.A.; Mathews, F. Ecological impact assessments fail to reduce risk of bat casualties at wind farms. Curr. Biol. 2016, 26, R1135–R1136. [Google Scholar] [CrossRef] [PubMed]
- Ammerman, L.K.; Hice, C.L.; Schmidly, D.J. Bats of Texas; Texas A&M University Press: College Station, TX, USA, 2012; ISBN 978-1-60344-476-7. [Google Scholar]
- Bennett, V.J.; Hale, A.M. Red aviation lights on wind turbines do not increase bat-turbine collisions. Anim. Conserv. 2014, 17, 354–358. [Google Scholar] [CrossRef]
- Foo, C.F.; Bennett, V.J.; Hale, A.M.; Korstain, J.M.; Schildt, A.J.; Williams, D.A. Increasing evidence that bats actively forage at wind turbines. Peerj 2017, 5. [Google Scholar] [CrossRef] [PubMed]
- Toth, C.A.; Parsons, S. Is lek breeding rare in bats? J. Zool. 2013, 291, 3–11. [Google Scholar] [CrossRef]
- Tuttle, S.R.; Chambers, C.L.; Theimer, T.C. Potential effects of livestock water-trough modifications on bats in northern Arizona. Wildl. Soc. Bull. 2006, 34, 602–608. [Google Scholar] [CrossRef]
- Vindigni, M.A.; Morris, A.D.; Miller, D.A.; Kalcounis-Rueppell, M.C. Use of modified water sources by bats in a managed pine landscape. For. Ecol. Manag. 2009, 258, 2056–2061. [Google Scholar] [CrossRef]
- Farrow, L.J.; Broders, H.G. Loss of forest cover impacts the distribution of the forest-dwelling tri-colored bat (Perimyotis subflavus). Mamm. Biol. 2011, 76, 172–179. [Google Scholar] [CrossRef]
- Klug, B.J.; Goldsmith, D.A.; Barclay, R.M.R. Roost selection by the solitary, foliage-roosting hoary bat (Lasiurus cinereus) during lactation. Can. J. Zool. 2012, 90, 329–336. [Google Scholar] [CrossRef]
- Walters, B.L.; Ritzi, C.M.; Sparks, D.W.; Whitaker, J.O. Foraging behavior of eastern red bats (Lasiurus borealis) at an urban-rural interface. Am. Midl. Nat. 2007, 157, 365–373. [Google Scholar] [CrossRef]
- Titchenell, M.A.; Williams, R.A.; Gehrt, S.D. Bat response to shelterwood harvests and forest structure in oak-hickory forests. For. Ecol. Manag. 2011, 262, 980–988. [Google Scholar] [CrossRef]
- Lesinski, G.; Olszewski, A.; Popczyk, B. Forest roads used by commuting and foraging bats in edge and interiior zones. Pol. J. Ecol. 2011, 59, 611–616. [Google Scholar]
- Jantzen, M.K.; Fenton, M.B. The depth of edge influence among insectivorous bats at forest-field interfaces. Can. J. Zool. 2013, 91, 287–292. [Google Scholar] [CrossRef]
- McGowan, A.T.; Hogue, A.S. Bat Occurrence and Habitat Preference on the Delmarva Peninsula. Northeast. Nat. 2016, 23, 259–276. [Google Scholar] [CrossRef] [Green Version]
- Morris, A.D.; Miller, D.A.; Conner, L.M. Home-Range Size of Evening Bats (Nycticeius humeralis) in Southwestern Georgia. Southeast. Nat. 2011, 10, 85–94. [Google Scholar] [CrossRef]
- Kelm, D.H.; Lenski, J.; Kelm, V.; Toelch, U.; Dziock, F. Seasonal bat activity in relation to distance to hedgerows in an agricultural landscape in central Europe and implications for wind energy development. Acta Chiropterol. 2014, 16, 65–73. [Google Scholar] [CrossRef]
- Frey-Ehrenbold, A.; Bontadina, F.; Arlettaz, R.; Obrist, M.K. Landscape connectivity, habitat structure and activity of bat guilds in farmland-dominated matrices. J. Appl. Ecol. 2013, 50, 252–261. [Google Scholar] [CrossRef]
- Schaub, A.; Schnitzler, H.U. Flight and echolocation behaviour of three vespertilionid bat species while commuting on flyways. J. Comp. Physiol. A 2007, 193, 1185–1194. [Google Scholar] [CrossRef] [PubMed]
- Cryan, P.M. Seasonal distribution of migratory tree bats (Lasiurus and Lasionycteris) in North America. J. Mammal. 2003, 84, 579–593. [Google Scholar] [CrossRef]
- Korstian, J.M.; Hale, A.M.; Bennett, V.J.; Williams, D.A. Using DNA barcoding to improve bat carcass identification at wind farms in the United States. Conserv. Genet. Resour. 2016, 8, 27–34. [Google Scholar] [CrossRef]
- Korstian, J.M.; Hale, A.M.; Bennett, V.J.; Williams, D.A. Advances in sex determination in bats and its utility in wind-wildlife studies. Mol. Ecol. Resour. 2013, 13, 776–780. [Google Scholar] [CrossRef] [PubMed]
- Smallwood, K.S. Estimating wind turbine-caused bird mortality. J. Wildl. Manag. 2007, 71, 2781–2791. [Google Scholar] [CrossRef]
- Baerwald, E.F.; Barclay, R.M.R. Geographic variation un activity and fatality of migratory bats at wind energy facilities. J. Mammal. 2009, 90, 1341–1349. [Google Scholar] [CrossRef]
- Hayes, J.P. Temporal variation in activity of bats and the design of echolocation-monitoring studies. J. Mammal. 1997, 78, 514–524. [Google Scholar] [CrossRef]
- Downs, N.C.; Cresswell, W.J.; Reason, P.; Sutton, G.; Wells, D.; Wray, S. Sex-specific habitat preferences of foraging and commuting lesser horseshoe bats Rhinolophus hipposideros (Borkhausen, 1797) in lowland England. Acta Chiropterol. 2016, 18, 451–465. [Google Scholar] [CrossRef]
- Zurcher, A.A.; Sparks, D.W.; Bennett, V.J. Why the bat did not cross the road? Acta Chiropterol. 2010, 12, 337–340. [Google Scholar] [CrossRef]
- Bennett, V.J.; Hale, A.M. Acoustic monitoring does not predict bat mortality at a wind energy facility. Acta Chiropterol. 2018. under review. [Google Scholar]
- Froidevaux, J.S.P.; Zellweger, F.; Bollmann, K.; Obrist, M.K. Optimizing passive acoustic sampling of bats in forests. Ecol. Evol. 2014, 4, 4690–4700. [Google Scholar] [CrossRef] [PubMed] [Green Version]
- Ontario Ministry of Natural Resources. Bats and Bat Habitats: Guidelines for Wind Power Projects; MNR Number 52696; Queen’s Printer for Ontario: Peterborough, ON, Canada, 2011. [Google Scholar]
- Arnett, E.B.; Baerwald, E.F. Impacts of wind energy development on bats: Implications for conservation. In Bat Evolution, Ecology, and Conservation; Adams, R.A., Pedersen, S.C., Eds.; Springer: New York, NY, USA, 2013; pp. 435–456. ISBN 978-1-4614-7397-8. [Google Scholar]
- Zimmerling, J.R.; Francis, C.M. Bat Mortality Due to Wind Turbines in Canada. J. Wildl. Manag. 2016, 80, 1360–1369. [Google Scholar] [CrossRef]
- Piorkowski, M.D.; Farnsworth, A.J.; Fry, M.; Rohrbaugh, R.W.; Fitzpatrick, J.W.; Rosenberg, K.V. Research priorities for wind energy and migratory wildlife. J. Wildl. Manag. 2012, 76, 451–456. [Google Scholar] [CrossRef]
- Dechmann, D.K.N.; Wikelski, M.; Ellis-Soto, D.; Safi, K.; O’Mara, M.T. Determinants of spring migration departure decision in a bat. Biol. Lett. 2017, 13. [Google Scholar] [CrossRef] [PubMed]
- Petit, J.L.; O’Keefe, J.M. Day of year, temperature, wind, and precipitation predict timing of bat migration. J. Mammal. 2017, 98, 1236–1248. [Google Scholar] [CrossRef]
- Fraser, E.E.; Brooks, D.; Longstaffe, F.J. Stable isotope investigation of the migratory behavior of silver-haired bats (Lasionycteris noctivagans) in eastern North America. J. Mammal. 2017, 98, 1225–1235. [Google Scholar] [CrossRef]
Figure 1.
Map of study site at Wolf Ridge Wind, LLC in north-central Texas. White dots indicate the locations of turbines and white lines show existing gravel roads. The location of mobile acoustic transects conducted from 2011 to 2013 are shown in red, transects in orange were conducted in 2011 and 2012 only, and transects conducted in 2013 only are shown in light blue.
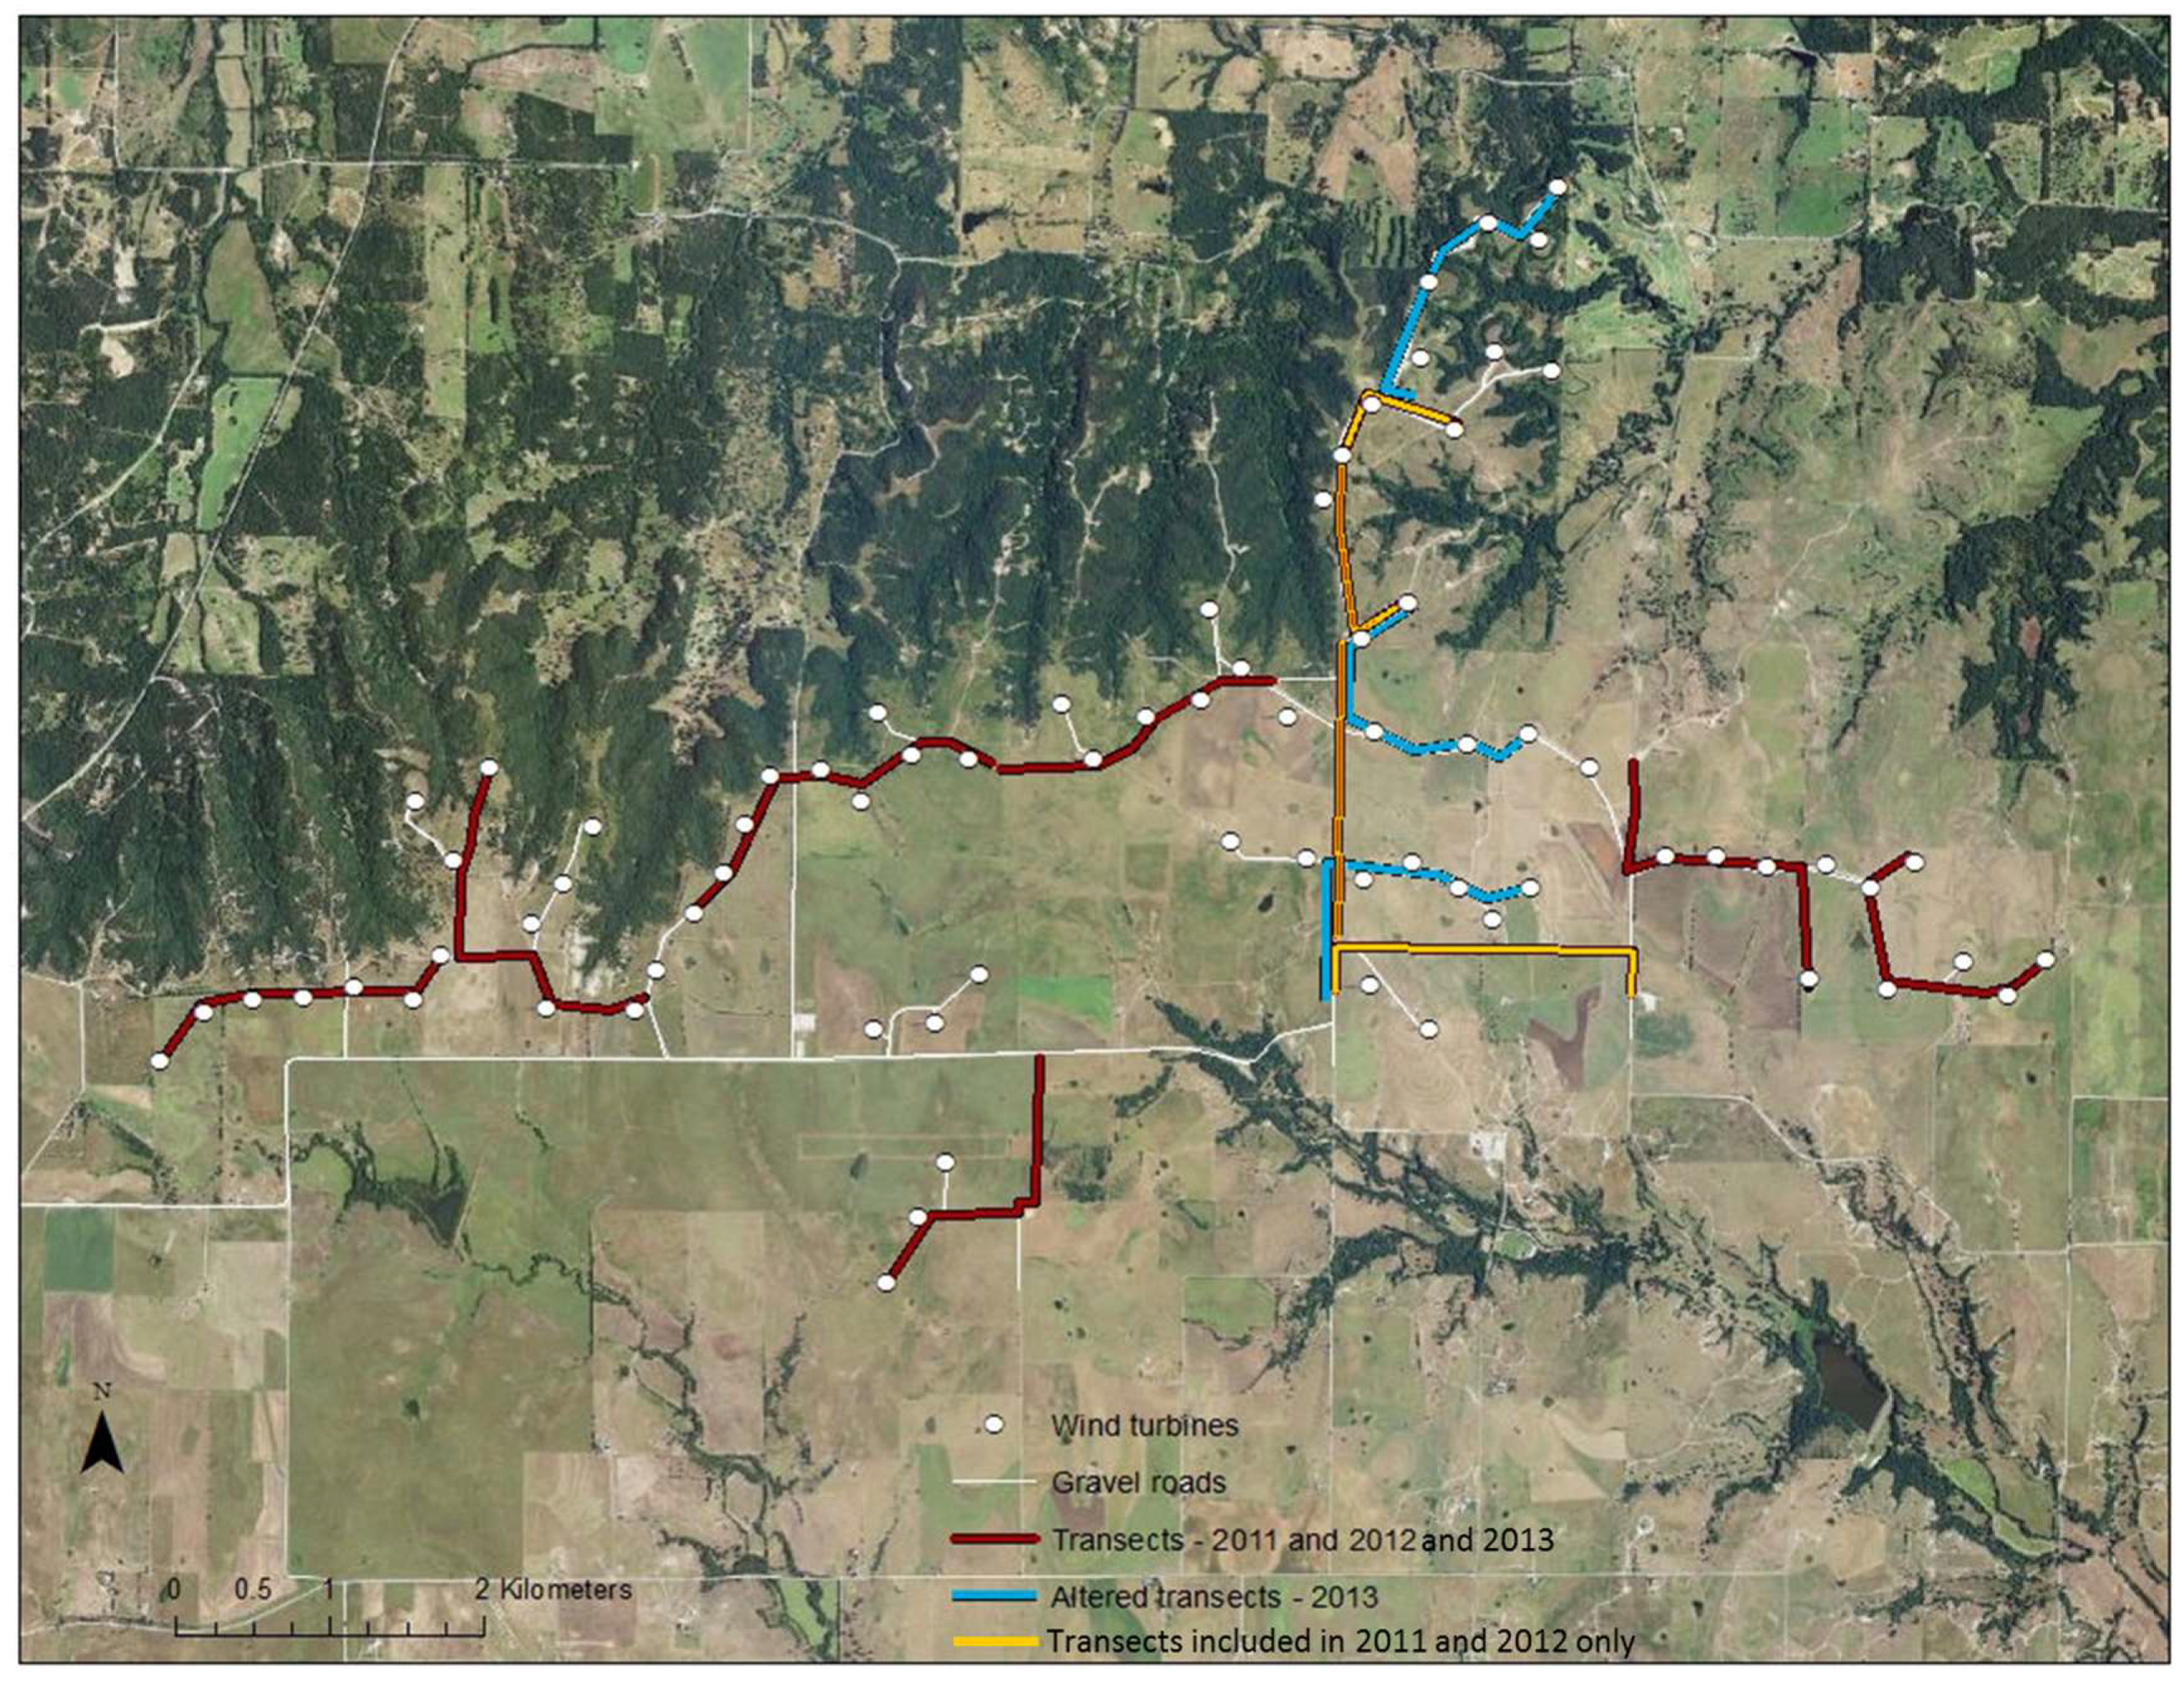
Figure 2.
Composite raster maps delineating the availability and distribution of 4 resources (water sources, roosting sites, foraging sites, and commuting routes) for 5 bat species (panels (a–e)) at Wolf Ridge Wind, LLC in north-central Texas. For the bat species in panel (f), commuting routes were not included in the composite raster map (see methods for additional details). Any black within the wind resource facility depicts areas with no known available resources and areas in white show resource hotspots. Wind turbine locations are shown in blue and gravel roads are shown as white lines.
Figure 3.
Fatality index (FI) rates for 6 bat species at a select number of wind turbines at Wolf Ridge Wind, LLC in north-central Texas that were searched from July–September 2009–2013. The FI for each species at each turbine is the number of carcasses found during standardized fatality searches divided by the total number of searches conducted over this three-year period (see methods text for additional details). The larger the white circle at each turbine location, the higher the FI was for that species. Base maps comprise the resource maps created for each species.
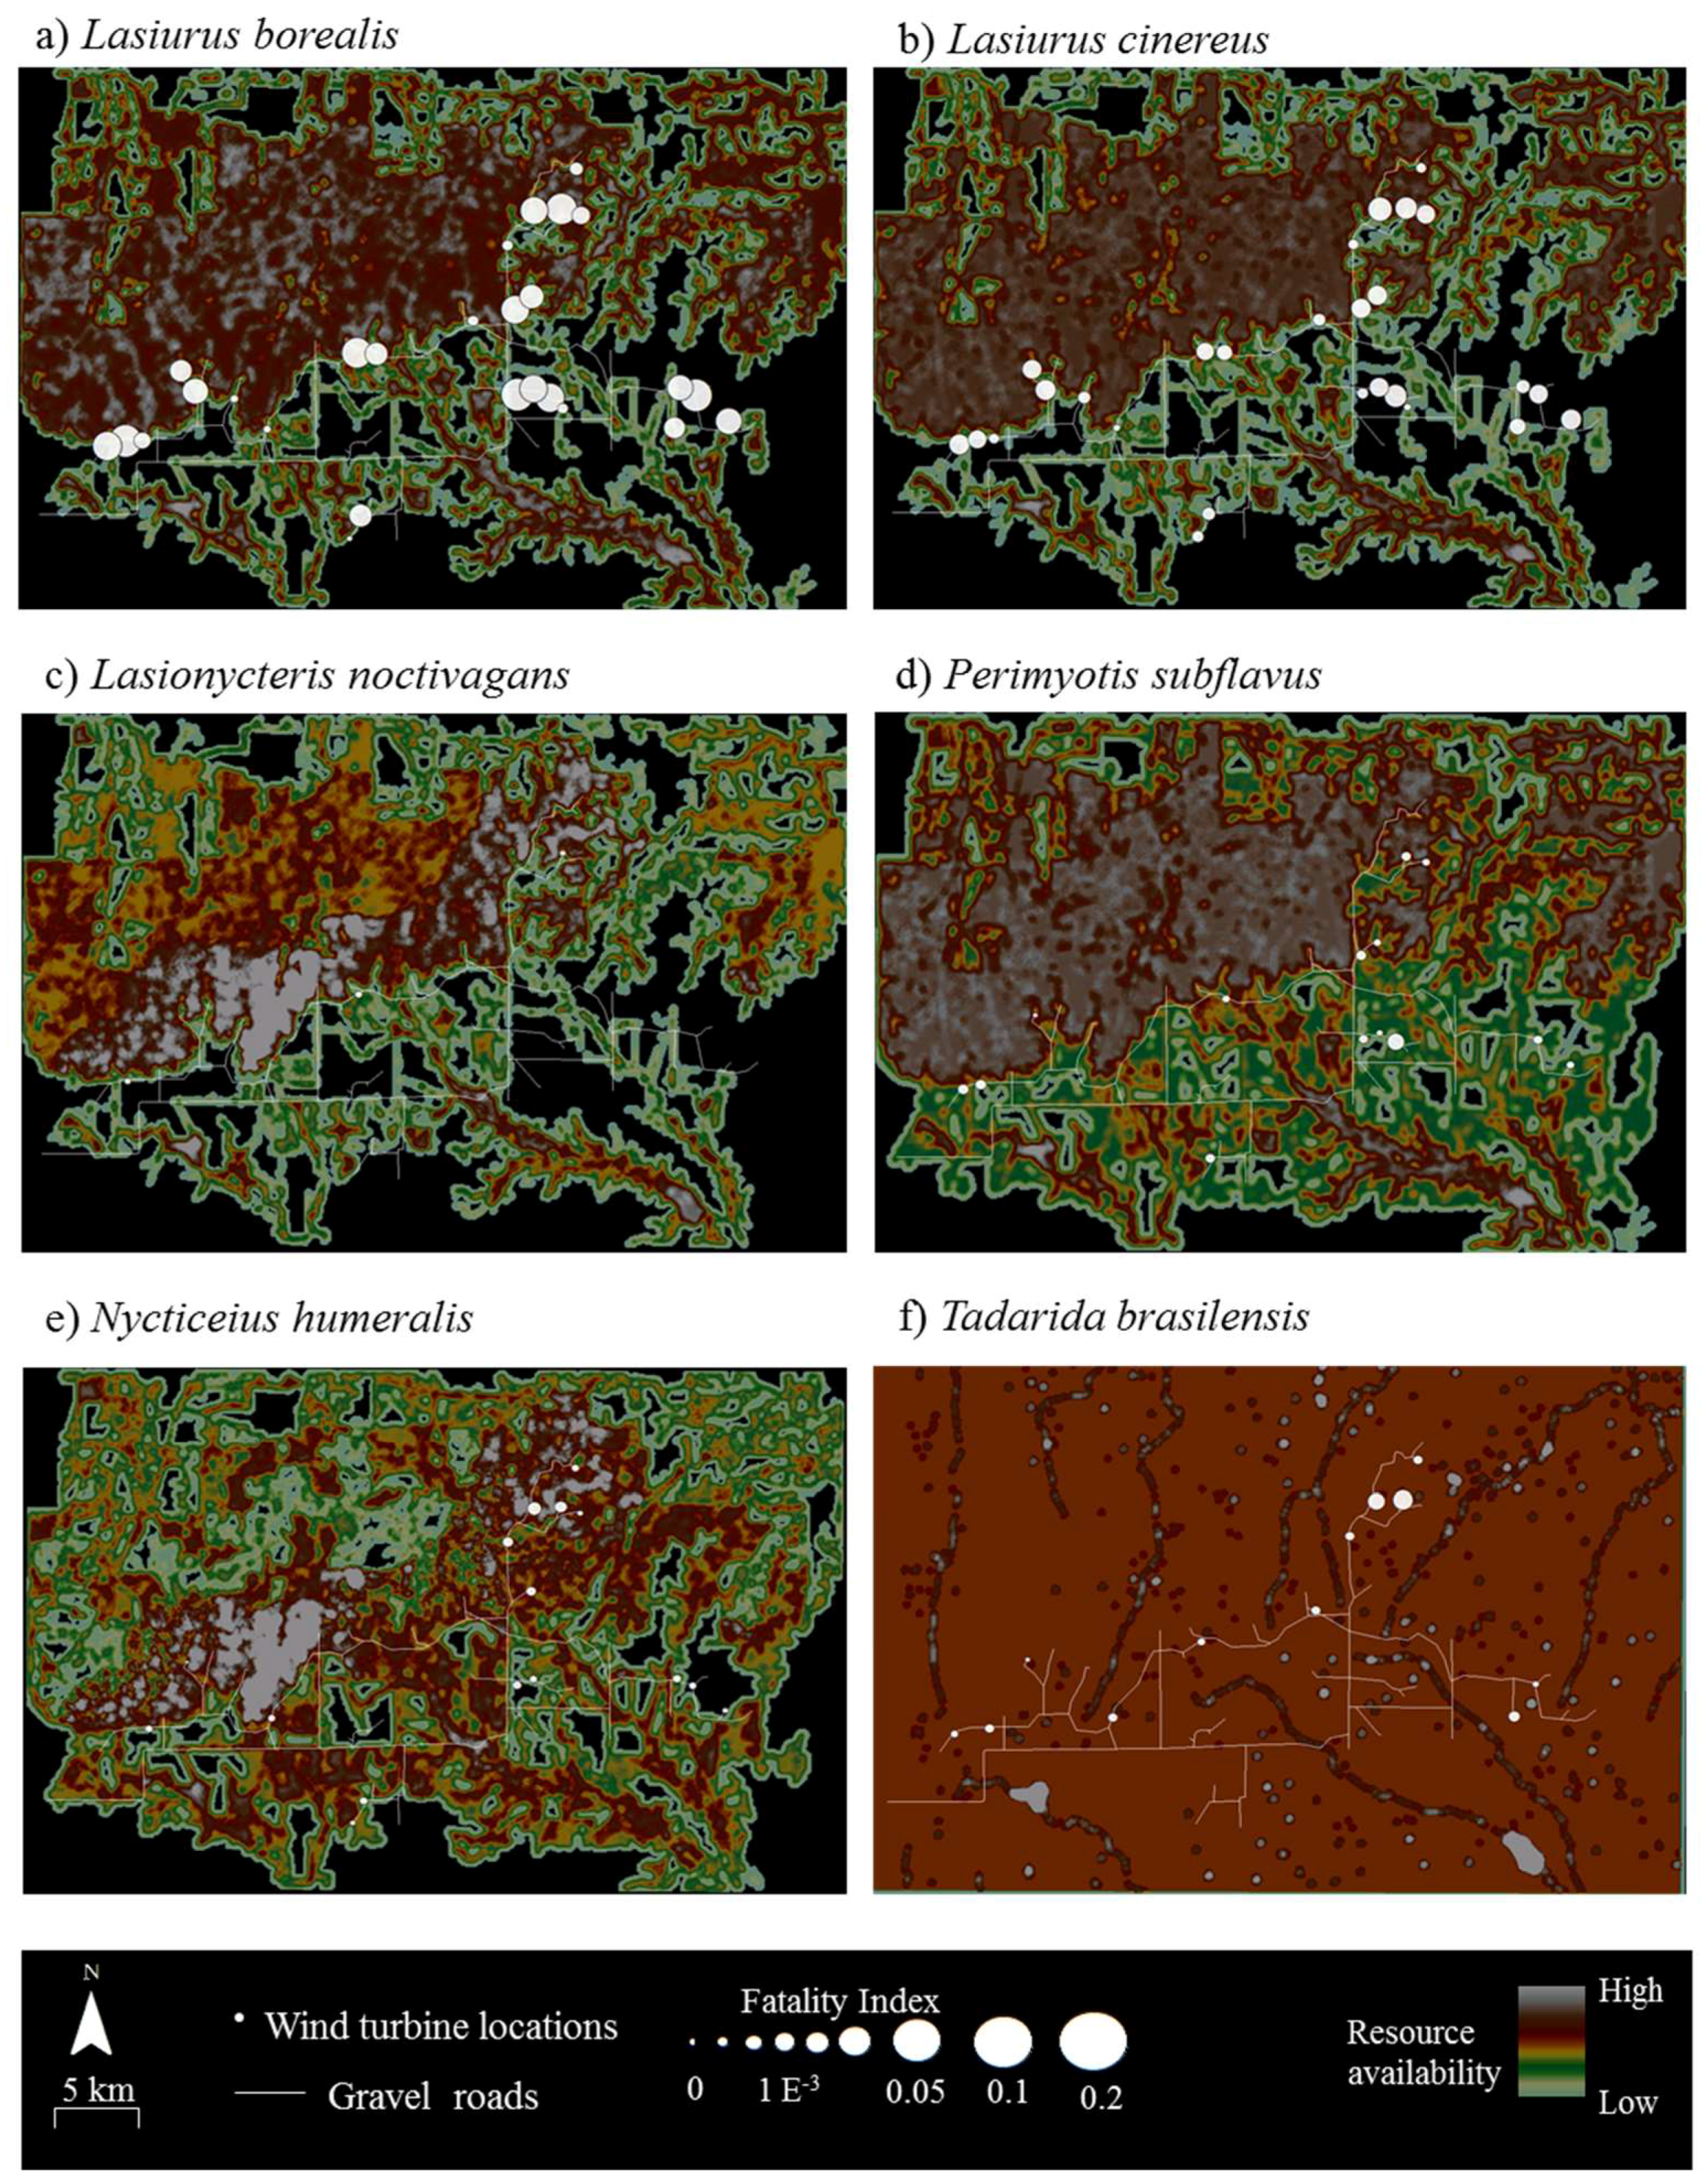
Figure 4.
Activity index (AI) rates for 6 bat species detected during mobile transect walks near wind turbines at Wolf Ridge Wind, LLC in north-central Texas from July–September 2011–2013. The AI for each species at each turbine is the number of bat passes recorded in mobile transects surveys within 20 m of the turbine divided by the total number of transects over this three-year period (see methods text for additional details). The larger the white circle at each turbine location, the higher the AI was for that species. Base maps comprise the resource maps created for each species.

Figure 5.
Proportion of bat fatalities (black bars) and proportion of species-specific acoustic activity recorded within the RSZ buffers (white bars) at wind turbines at Wolf Ridge Wind, LLC in north-central Texas.
Figure 5.
Proportion of bat fatalities (black bars) and proportion of species-specific acoustic activity recorded within the RSZ buffers (white bars) at wind turbines at Wolf Ridge Wind, LLC in north-central Texas.

Table 1.
Potential roost sites commonly selected by each of the six bat species known to be present at Wolf Ridge Wind, LLC, in north central Texas, USA. Data sources for roost sites [27,33,34].
| Potential Roost Sites | Lasiurus borealis | Lasiurus cinereus | Lasionycteris noctivagans | Perimyotis subflavus | Nycticeius humeralis | Tadarida brasiliensis |
|---|---|---|---|---|---|---|
| On branches | X | |||||
| In foliage | X | X | X | X | ||
| Cavities in trunk | X | X | X | |||
| Cracks in trunk | X | |||||
| Cavities in branches | X | X | X | |||
| Cracks in branches | X | |||||
| Broken branches | X | |||||
| Woodpecker holes | X | X | ||||
| Loose bark | X | X | ||||
| Thick stemmed creepers | X | |||||
| Rock crevices | X | X | ||||
| Buildings | X | X | X | X |
Table 2.
Statistical analysis of the relationship between species-specific bat fatalities at wind turbines and resource availability within 4 of the 8 25 m radius annuli extending from wind turbines at Wolf Ridge Wind, LLC in north-central Texas.
Table 2.
Statistical analysis of the relationship between species-specific bat fatalities at wind turbines and resource availability within 4 of the 8 25 m radius annuli extending from wind turbines at Wolf Ridge Wind, LLC in north-central Texas.
| Distance Annuli from Wind Turbine (m) | |||||
|---|---|---|---|---|---|
| 25 | 75 | 125 | 175 | ||
| Lasiurus borealis | rS | −0.250 | −0.271 | −0.336 | −0.301 |
| P | 0.199 | 0.163 | 0.080 | 0.119 | |
| Lasiurus cinereus | rS | −0.061 | −0.038 | −0.062 | 0.028 |
| P | 0.758 | 0.850 | 0.754 | 0.887 | |
| Lasionycteris noctivagans | rS | 0.259 | 0.276 | 0.180 | 0.237 |
| P | 0.183 | 0.155 | 0.360 | 0.224 | |
| Perimyotis subflavus | rS | −0.375 | −0.308 | −0.344 | −0.323 |
| P | 0.049 * | 0.110 | 0.073 | 0.094 | |
| Nycticeius humeralis | rS | −0.076 | −0.037 | 0.044 | 0.103 |
| P | 0.702 | 0.853 | 0.822 | 0.604 | |
| Tadarida brasiliensis | rS | −0.067 | 0.107 | −0.117 | |
| P | 0.736 | 0.587 | 0.555 | ||
* Indicates significance at α = 0.05, n = 28, and rS = Spearman’s rank correlation coefficient.
Table 3.
Statistical analysis of the relationship between species-specific bat fatalities and acoustic activity recorded near wind turbine towers at Wolf Ridge Wind, LLC in north-central Texas. Note rS = Spearman’s rank correlation coefficient and n = 28.
Table 3.
Statistical analysis of the relationship between species-specific bat fatalities and acoustic activity recorded near wind turbine towers at Wolf Ridge Wind, LLC in north-central Texas. Note rS = Spearman’s rank correlation coefficient and n = 28.
| rS | P | |
|---|---|---|
| All species | 0.269 | 0.266 |
| Lasiurus borealis | 0.357 | 0.133 |
| Lasiurus cinereus | No acoustic bat passes recorded | |
| Lasionycteris noctivagans | 0.051 | 0.835 |
| Perimyotis subflavus | 0.386 | 0.103 |
| Nycticeius humeralis | −0.099 | 0.686 |
| Tadarida brasiliensis | 0.163 | 0.505 |
n = 49, and rS = Spearman’s rank correlation coefficient.
Table 4.
Statistical analysis of the relationship between species-specific bat acoustic activity at wind turbines and resource availability within 4 of the 8 25 m radius annuli extending from each wind turbine at Wolf Ridge Wind, LLC in north-central Texas.
Table 4.
Statistical analysis of the relationship between species-specific bat acoustic activity at wind turbines and resource availability within 4 of the 8 25 m radius annuli extending from each wind turbine at Wolf Ridge Wind, LLC in north-central Texas.
| Distance Annuli from Wind Turbine (m) | |||||
|---|---|---|---|---|---|
| 25 | 75 | 125 | 175 | ||
| Lasiurus borealis | rS | −0.192 | −0.111 | −0.036 | 0.048 |
| P | 0.187 | 0.447 | 0.809 | 0.743 | |
| Lasiurus cinereus | rS | No acoustic bat passes recorded | |||
| P | |||||
| Lasionycteris noctivagans | rS | 0.073 | 0.021 | 0.007 | −0.043 |
| P | 0.616 | 0.886 | 0.962 | 0.767 | |
| Perimyotis subflavus | rS | −0.123 | 0.000 | 0.118 | 0.169 |
| P | 0.401 | 0.998 | 0.421 | 0.292 | |
| Nycticeius humeralis | rS | 0.003 | 0.010 | −0.028 | 0.017 |
| P | 0.981 | 0.948 | 0.848 | 0.907 | |
| Tadarida brasiliensis | rS | −0.041 | −0.095 | −0.104 | −0.114 |
| P | 0.781 | 0.516 | 0.476 | 0.437 | |
n = 49, and rS = Spearman’s rank correlation coefficient.
© 2018 by the authors. Licensee MDPI, Basel, Switzerland. This article is an open access article distributed under the terms and conditions of the Creative Commons Attribution (CC BY) license (http://creativecommons.org/licenses/by/4.0/).
Share and Cite
MDPI and ACS Style
Bennett, V.J.; Hale, A.M. Resource Availability May Not Be a Useful Predictor of Migratory Bat Fatalities or Activity at Wind Turbines. Diversity 2018, 10, 44. https://doi.org/10.3390/d10020044
AMA Style
Bennett VJ, Hale AM. Resource Availability May Not Be a Useful Predictor of Migratory Bat Fatalities or Activity at Wind Turbines. Diversity. 2018; 10(2):44. https://doi.org/10.3390/d10020044
Chicago/Turabian StyleBennett, Victoria J., and Amanda M. Hale. 2018. "Resource Availability May Not Be a Useful Predictor of Migratory Bat Fatalities or Activity at Wind Turbines" Diversity 10, no. 2: 44. https://doi.org/10.3390/d10020044
Note that from the first issue of 2016, this journal uses article numbers instead of page numbers. See further details here.