Genotyping by Sequencing Reasserts the Close Relationship between Tef and Its Putative Wild Eragrostis Progenitors


1
Institute of Plant Sciences, University of Bern, Altenbergrain 21, 3013 Bern, Switzerland
2
Ethiopian Institute of Agricultural Research, National Agricultural Biotechnology Research Center, Holetta P.O. Box 249, Ethiopia
3
Institute of Biotechnology, Addis Ababa University, Addis Ababa P.O. Box 32853, Ethiopia
4
Center for Development and Environment (CDE), University of Bern, 3012 Bern, Switzerland
*
Author to whom correspondence should be addressed.
Diversity 2018, 10(2), 17; https://doi.org/10.3390/d10020017
Submission received: 5 February 2018
/
Revised: 8 March 2018
/
Accepted: 15 March 2018
/
Published: 21 March 2018
Abstract
:The genus Eragrostis consists of 350 species, including tef (Eragrostis tef (Zucc.) Trotter), the only cultivated species in this genus. Very little is known about the genetic potential of these species for tef improvement and genomics research. Here, we investigated a germplasm panel consisting of 40 Eragrostis species and 42 tef lines with single nucleotide polymorphism (SNP) data generated using the genotyping by sequencing (GBS) protocol. Thousands of SNPs were identified genome-wide from the germplasm panel. High-quality SNPs were used to assess sequence similarity and/or divergence, genetic diversity, population structure, and phylogenetic relationships. Mapping individual reads to the tef reference genome revealed that of the 40 wild Eragrostis species included in this study, E. pilosa, E. aethiopica, E. obtusa, E. ferruginea, E. lugens, and E. lehmanniana had 92% of their sequences represented in the tef reference genome. In the maximum likelihood phylogenetic analysis, these wild species clearly showed grouping in the clade consisting of the entire tef germplasm. Population structure analysis showed two major clusters consistent with the germplasm class information and the inferred phylogenetic relationships. The wild Eragrostis species were more diverse than the tef cultivars and could therefore potentially be used to enrich the tef gene pool. The SNP dataset and the results documented here are taxonomically the most inclusive to date and could be a useful informational tool for the design of genomics-informed tef breeding and research.
1. Introduction
Tef is the socially and agriculturally dominant crop in Ethiopia. Its dominance over other major cereal crops such as wheat and barley comes from its resilience to poor growth conditions [1], highest market prices among cereals [2], and use as human food and animal feed. These qualities and uses make tef the iconic national cereal of Ethiopia. It is estimated that injera, the pancake-like fermented flatbread produced from tef flour, is consumed daily by over 70 million people in Ethiopia. Annually, tef is cultivated on over 3 million hectares of land, with an estimated annual production of over 4.5 million tons [3]. In Ethiopia, tef is cultivated mainly during the main growing season, from July/August to October/December. In some areas, tef is also cultivated in the short rainy season, from February to May/June.
Arguably, tef is becoming a globally important cereal. Tef contains 3% fat, 11% protein, and 80% complex carbohydrate [4]. Lysine is an indispensable amino acid in humans and animals. In general, lysine is low in all cereal proteins and hence a limiting amino acid in cereal-based diets [5]. The importance and benefits of lysine in the diet include maintenance and growth. Nutritionally, tef contains higher amounts of the essential amino acids, its lysine content is higher than that of all other cereals except rice and oats, and its mineral content is substantial [1]. Tef has been shown to be gluten-free [6], and for this reason the demand for tef products is increasing globally.
The sequencing of the tef genome, the first indigenous Ethiopian crop to be sequenced, was a milestone in the history of genomic studies on Eragrostis species. Understanding the genome of this allotetraploid species will shed light on its evolutionary history. The genome sequence was obtained from libraries constructed from the genomic DNA of the improved variety of tef, Tsedey (DZ-Cr-37), using the Illumina HiSeq 2000 and 454-FLX pyro-sequencing platforms. The tef genome is one of the few genomes sequenced from crops regarded as “orphan”, which have tremendous social and economic importance for millions of people living in developing countries. The assembly level of the genome is scaffold, and it contains 11,509 scaffolds and 2548 contigs obtained from a total of 40 Gbp single- and paired-end sequencing reads. The size of the assembly is 672 Mbp, with 54-genome coverage and a scaffold N50 of 85 kbp. This size is 58 Mb smaller than the genome of sorghum (Sorghum bicolor L.), 242 Mb larger than that of rice (Oryza sativa L.), 125 Mb greater than that of foxtail millet (Setaria italica), and about 25 times smaller than that of bread wheat (Triticum aestivum L.).
The tef genome is an allotetraploid (2C = 2n = 4× = 40) consisting of two diploid subgenomes, designated as the A and B genomes. Transposable elements constitute 6% of the size of the tef genome, with 3.9% retroelements (class I transposable elements), 2% DNA transposons (class II transposable elements), and 1.6% miniature inverted-repeat transposable elements [7].
Species in the genus Eragrostis are primarily tropical and subtropical in distribution and are most commonly found in weedy areas and dry habitats [8]. Except for tef (Eragrostis tef), which originated and has been domesticated in Ethiopia [9], none of the 349 species in this genus are cultivated for human consumption and hence are considered to have little economic importance. Thus these species have received little research attention. However, this situation seems to have changed in recent years as tef researchers started to harness the potential of the wild Eragrostis species as a source of novel variability and for evolutionary studies targeting the close relatives of tef.
In recent years, analyses of SNPs using next-generation sequencing protocols have commonly been used in genetic and genomic studies such as genome-wide association studies, population genomic analysis, construction of genetic linkage maps, reconstruction of phylogenetic relationships, and identification of quantitative trait loci. Genotyping by sequencing (GBS) is one such NGS-based genotyping protocol, which works by cutting genomic DNA with a methylation-sensitive enzyme and sequencing the genomic regions flanked by the restriction enzyme in hundreds of individual samples simultaneously [10]. Compared to other NGS-based protocols such as the restriction site-associated DNA (RAD-seq) protocol [11], the GBS protocol is a simplified and cheaper alternative technology. This protocol has been adopted for several crop plants and for a range of applications including rice [12,13,14], wheat [15], barley [15,16], sorghum [17], maize [18,19,20], pearl millet [21], chickpea [22], cultivated oat [23], barnyard millet [24], cotton [25], grape [26], common bean [27], and switch grass [28].
To address a range of diversity, breeding, conservation, and evolutionary questions regarding tef, data covering the wild species, preferably including those suggested as close relatives, is needed. Here, we report the application of the GBS protocol to a panel comprising 82 accessions (40 wild Eragrostis species, 31 tef cultivars, 1 mutant line, and 10 improved varieties) (Table S1). The objectives of this study were (1) to identify single nucleotide polymorphisms (SNPs) genome-wide, (2) to use the SNP dataset to perform genomic diversity analyses in order to determine phylogenetic relationships and the population structure of the panel, and (3) to assess the potential of GBS as a cost-effective alternative platform for tef genomics research. In this work, we report the results of the first application of the GBS protocol on selected species of the genus Eragrostis.
2. Materials and Methods
2.1. Germplasm Panel
The germplasm panel used for this study (Table S1) consisted of 31 tef cultivars that were systematically characterized based on morphology [29]. Also, 10 improved tef varieties developed by the National Tef Improvement Program in Ethiopia were included: DZ-Cr-44 (Menagesha), DZ-01-1285 (Koye), DZ-01-99 (Asgori), DZ-01-196 (Magna), DZ-01-354 (Enatite), DZ-01-899 (Gimbichu), DZ-01-787 (Wellonkomi), DZ-01-2675 (Dega Tef), DZ-Cr-387 RIL355 (Quncho), and DZ-Cr-438 RIL133B (Kora) [30]. The panel also included a mutant line (GA10) identified through chemical mutagenesis at the University of Bern, Switzerland [31], and 40 wild Eragrostis species obtained from the US Department of Agriculture.
2.2. DNA Extraction, Library Preparation, and Genotyping by Sequencing
Seedlings of each germplasm were grown under 12 h light at 24 °C and 12 h dark at 18 °C with 65% relative humidity in the growth room at the Institute of Plant Sciences, University of Bern, Switzerland. After 4 weeks, 100 mg of leaf tissue was harvested and genomic DNA was isolated using the CTAB (Cetyl trimethylammonium bromide) method [32]. DNA concentrations were normalized to 30 ng/μL on a 96-plex PCR plate and shipped to the Institute for Genomic Diversity, Cornell University (Ithaca, NY, USA) for library preparation and sequencing [10]. Genomic DNA from each germplasm was digested using ApeKI restriction enzyme, and unique barcodes were attached to each sequence of the individual germplasm. The ApeKI Eragrostis library on the 96-plex plate (95 samples and a blank) was then sequenced on an Illumina HiSeq 2500 platform.
2.3. GBS Raw Data Processing
The sequence reads of the 95 samples along with the key file listing barcodes for the samples and the plate layout were downloaded from the sequencing platform and processed using the TASSEL-GBS pipeline for species with a reference genome [33]. First, the pipeline identified and removed bad-quality reads and reads that did not contain adaptors or Ns in the useful part of the sequence, and retained high-quality reads. The trimmed reads were then used to generate unique tags.
2.4. Mapping Reads to the Tef Reference Genome and SNP Calling
The unique tags generated in the previous step were exported in fastq format for mapping to the tef reference genome using the Burrows-Wheeler Aligner (BWA) [34]. The Sequence Alignment Maps (SAMs) generated after read-mapping were further processed to call SNPs using the DiscoverySNPCaller plugin embedded within the pipeline. This plugin called SNPs across the individual samples and produced the SNP dataset in HDF5 format, which was then converted into Variant Call Format (VCF) for quality filtering and extraction of useful statistics using VCFtools [35] and SAMtools [34]. The SNP dataset was filtered by the number of alleles to include only biallelic sites (min-alleles = 2 and max-alleles = 2); max-missing (coverage) 50%, 60%, 70%, 80%, 90%, and 100%; and sites with minor allele frequency (MAF) 0.05. According to SAMtools, when the max-missing flag is specified with a value of 1, for example, it means that no missing data is allowed for all the individuals, corresponding to 100% coverage of all sites.
2.5. Mapping Reads to the Tef Pseudo-Chromosomes
To visualize the distribution of SNPs in the tef genome, reads were mapped to each of the 10 individual tef pseudo-chromosome assemblies [7] using the BWA. After mapping, 10 separate VCF files per pseudo-chromosome were generated. These VCF files were processed with custom scripts and R (https://www.R-project.org/). The pseudo-chromosomes were divided into equal-size chunks using the R software packages plyr and dplyr. Using the ggplot2 function [36], the SNPs were plotted against their respective physical positions on each of the 10 pseudo-chromosomes.
2.6. Population Structure Analysis
The population structure of the panel was determined using 3 clustering approaches. First, principal component analysis (PCA) was performed. The SNP dataset in VCF format was converted into the genomic data structure (GDS) data storage format using two high-performance computing R/Bioconductor packages, gdsfmt and SNPRelate [37]. Next, the dataset was LD-pruned as recommended in the SNPRelate package so that only SNPs that were in approximate linkage equilibrium with each other were used, to avoid the strong influence of SNP clusters in principal component and relatedness analysis. The LD-pruned SNP data was then used to calculate the genetic covariance matrix from the genotypes, compute the correlation coefficients, and calculate SNP eigenvectors. The names of individual germplasms and the population codes (cultivars, improved variety, mutant, and wild species) were used as input together with the GDS file. Then, the first 2 and 4 principal components were plotted.
Second, multidirectional scaling analysis was performed. For this analysis, an n × n matrix of genome-wide average identity-by-state pairwise distances were generated from the SNP scores in GDS format using the snpgdsIBS function of the SNPRelate R package. The population structure information contained in the n × n distance matrix was plotted to visualize the structure.
Third, for admixture analysis, 2 programs were used. The ADMIXTURE [38] program is a tool for maximum likelihood estimation of individual ancestries from multi-locus SNP genotype datasets. For each K, the number of ancestral populations, the program generates 2 output files, the ancestry fractions and the allele frequencies of the inferred ancestral populations. If the number of ancestral populations is unknown, the program includes a cross-validation procedure that allows the user to identify the value of K for which the model has best predictive accuracy. The value of K that exhibits a low cross-validation error is chosen compared with other K values.
To display the population structure, individual Q-matrices (for the respective Ks) were plotted in R using the bar plot function. We also determined population structure using the fastStructure [39] program, which was developed for inferring population structure from large SNP genotype data. For fastStructure, the plink files were used as input and the expected admixture proportions inferred were plotted with the distruct.py tool provided by the software. Population fixation statistics (FST) and nucleotide diversity (π) were calculated using the PopGenome package in R.
2.7. Molecular Phylogenetic Analysis
For phylogenetic analysis, a pair of primers were designed from the waxy gene: forward (5′TGCGAGCTSGACAACATCATGC3′) and reverse (5′CGGCCACGTTCTCCYTGGCGAG3′). PCR was performed using the DNA isolated from E. aethiopica, E. ferruginea, E. lehmanniana, E. lugens, E. obtusa, E. pilosa #223260, and E. tef cv Tsedey. The PCR condition was 40 cycles at 95 °C for 30 s, 61 °C for 30 s, and 72 °C for 80 s. PCR products were cloned into plasmids and sequenced using a Sanger sequencer.
Phylogenetic analysis was performed using 2 programs, the Randomized Axelerated Maximum Likelihood (RAXML) program [40] with the general time-reversible model of nucleotide evolution and the gamma model of rate variation, and molecular evolutionary genetics analysis using maximum likelihood, evolutionary distance, and maximum parsimony methods (MEGA) [41]. Trees were visualized using Dendroscope [42] and the MEGA software. The tree presented in the results is from MEGA, for better visualization.
3. Results
3.1. Genotyping by Sequencing of the ApeKI Eragrostis Species Library
We generated sequencing targets within the germplasm panel by digesting the DNA samples from each individual with the ApeKI restriction enzyme. Sequencing of these targets on an Illumina HiSeq 2000/2005 generated about 237 million single-end reads (Table S2). The number of reads per germplasm ranged from 1.6 to 4.0 million (Table S3, Figure S1), with a mean sequencing depth of about 2.5 million reads. Three of the 95 samples (Eragrostis trichodes, Hamrawi-murri, and Jano) were excluded from further analysis due to very low read counts.
High-quality reads from each individual sample were collapsed into tags. Of these, 75% were mapped to physical positions on the indexed tef reference genome. Because of the mosaic of species included in our panel, we were interested to know the proportion of reads mapping to the reference. The reads from the tef germplasm were represented in the tef reference genome with mapping rates of >93% (Table S3). In contrast, reads from most of the wild Eragrostis species showed a mapping rate in the range of 56% (E. acutiglumis) to 94.5% (E. pilosa). Interestingly, six wild species, E. pilosa, E. aethiopica, E. lehmannania, E. ferruginea, E. lugens, and E. obtusa, demonstrated 91–95% mapping rates, close to the mapping rates of the tef germplasm. Next, we probed the mapping files with the TASSE-GBS “SNPDiscovery” pipeline and identified a total of 419,999 SNPs. For subsequent analysis, this SNP dataset was filtered to contain biallelic sites, with minor allele frequency (MAF) 0.05 and ranges of coverage (50%, 60%, 70%, 80%, 90%, and 100%) across the germplasm (Figure S2).
3.2. Number of SNPs Correlates with Chromosome Length
To see how chromosome length affects the number of SNPs discovered, we carried out a correlation test. We examined the SNP data generated by mapping the reads to the tef pseudo-chromosome assembly and computed the Pearson’s product-moment correlation analysis using the R software corrplot package (https://github.com/taiyun/corrplot). We found a trend of increasing number of SNPs as the length of the pseudo-chromosome (from here on called pseudomolecule) increased, with the number of SNPs positively and strongly correlated (R2 = 0.98) with pseudomolecule length (Figure S3).
3.3. SNP Distribution along the 10 Tef Pseudomolecules
In order to study the genomic distribution of SNPs in the tef genome, we mapped the reads to the pseudo-chromosome assembly. Table S4 shows that the longest tef pseudomolecule had almost twice the average number of SNPs identified on the entire pseudomolecule assembly, while the shortest pseudomolecule had roughly one-third of the total average.
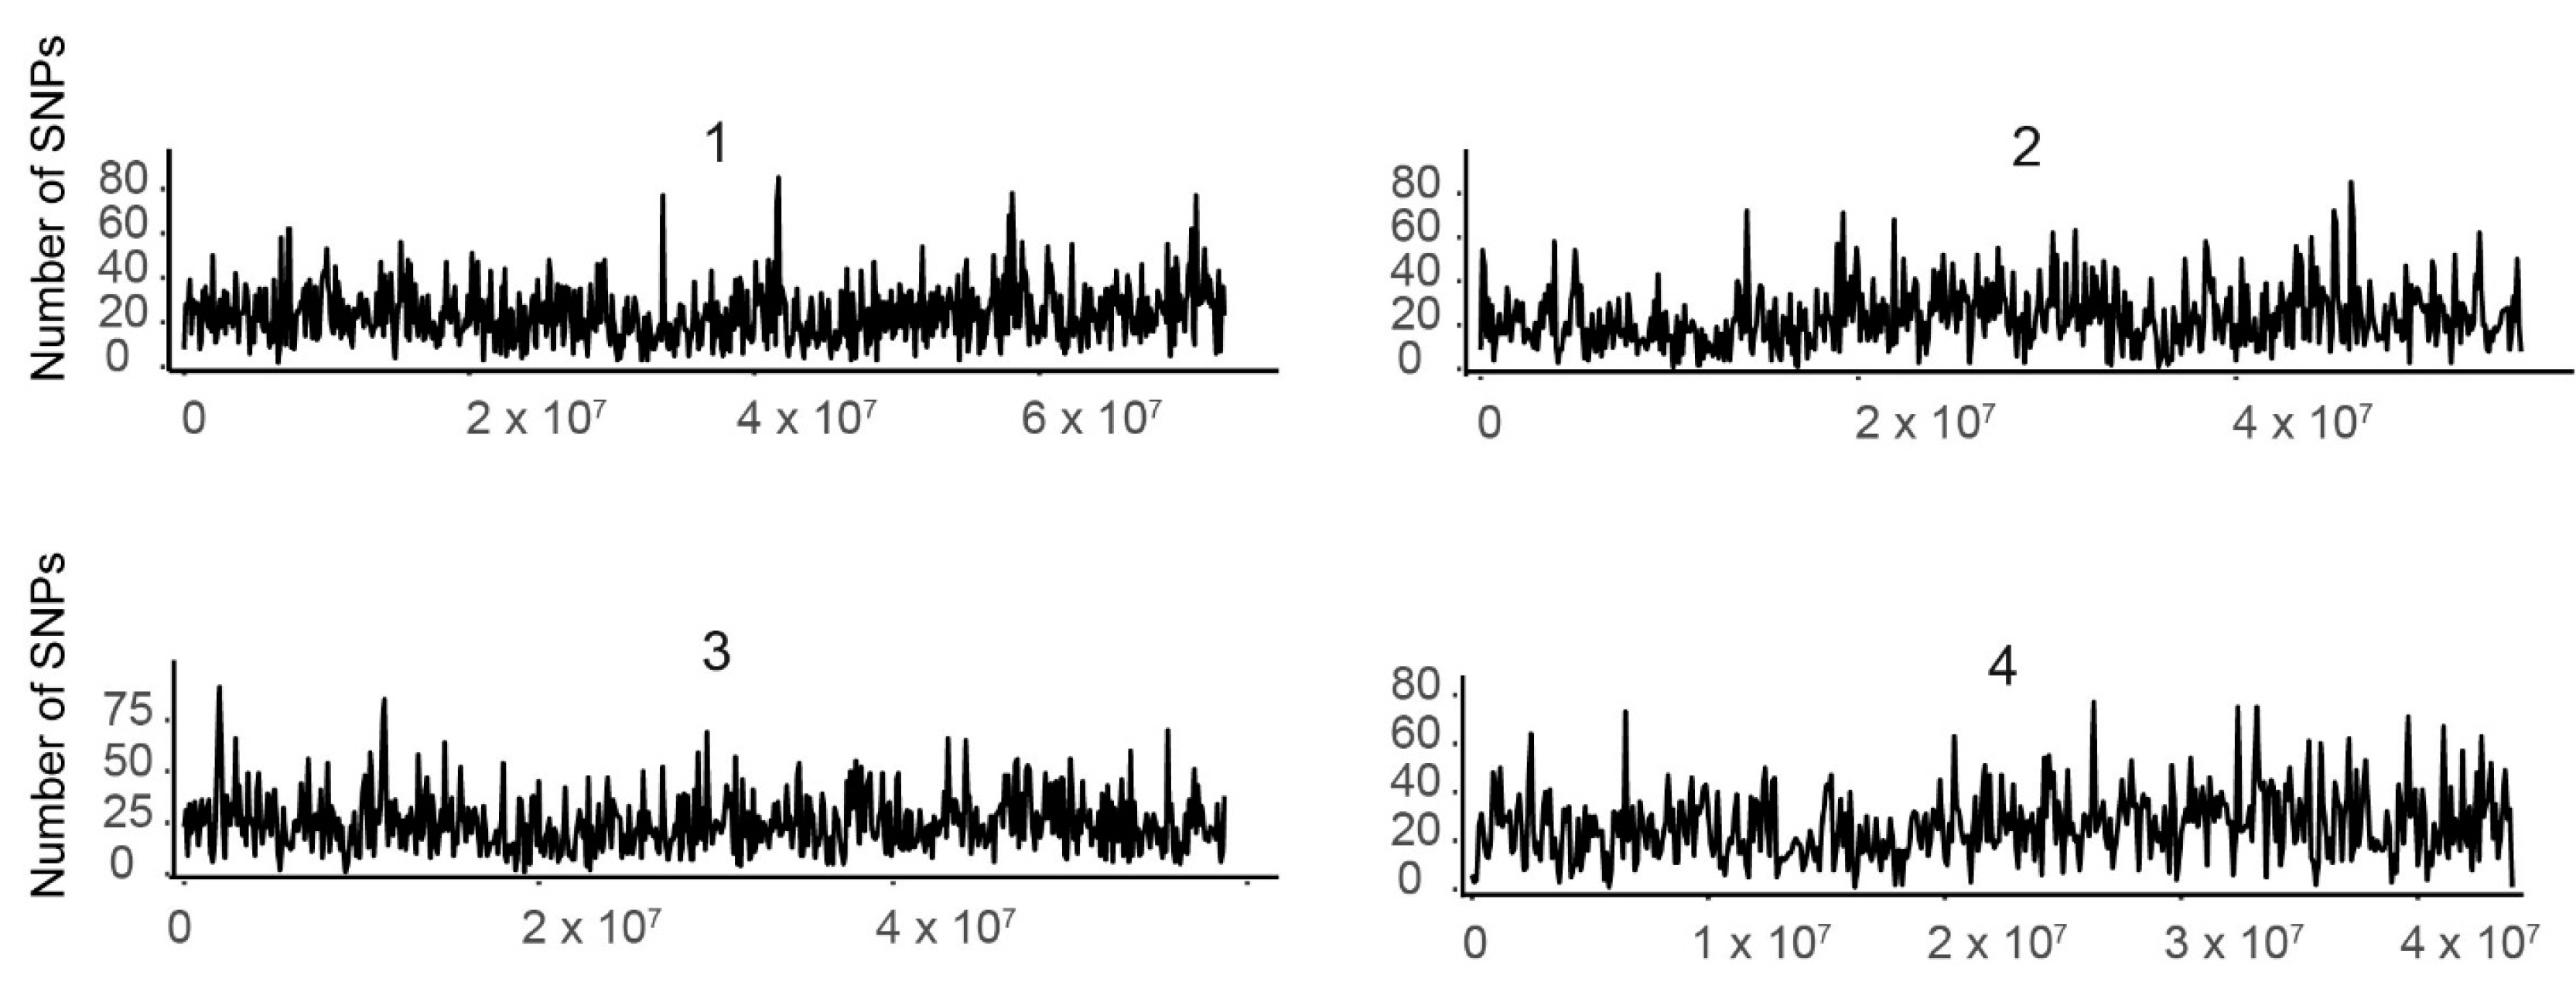
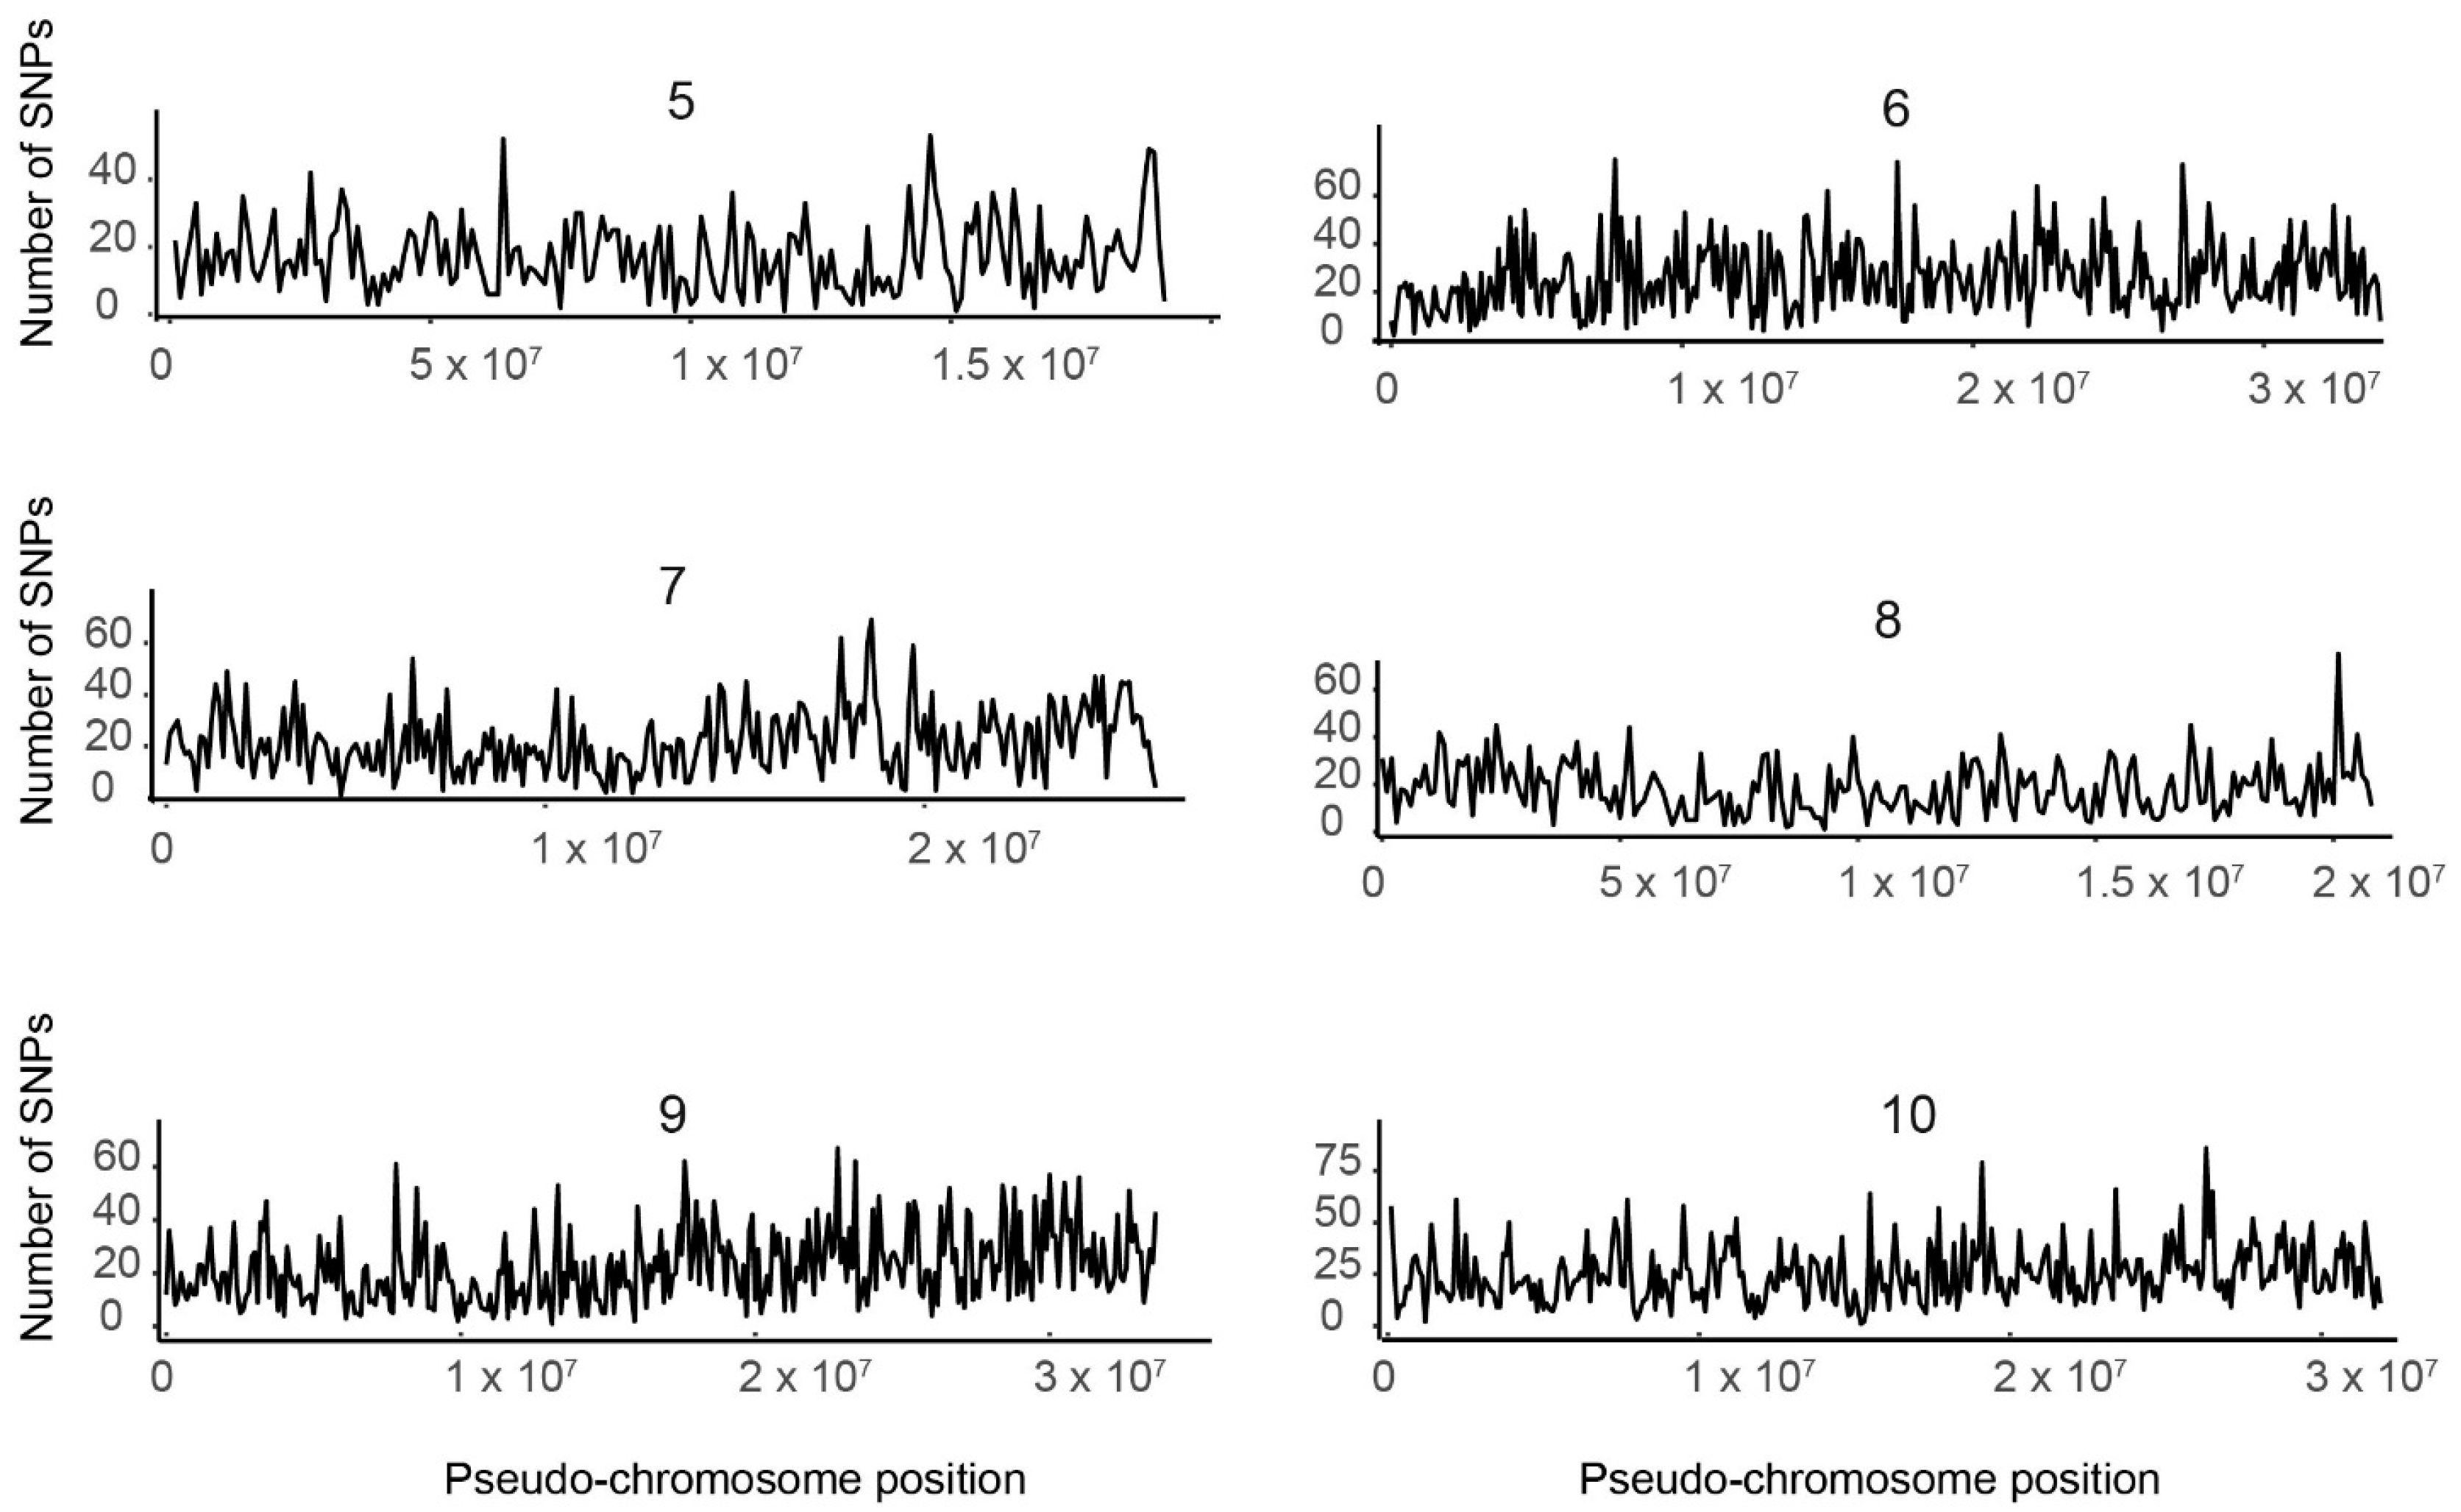
We plotted the SNPs from individual pseudomolecules against their respective physical positions, as shown in Figure 1, where the number of SNPs is shown for each position of the 10 tef pseudo-chromosomes. We found that the distribution of SNPs over a sliding window of 106 Mb represented by the spectrum of the vertical bar graph was nonuniform. The number of SNPs per Mb ranged from 169 in pseudomolecule 5 to 262 in pseudomolecule 4 (Table S4). However, SNP density variation between pseudomolecules appeared to be constant. In all pseudomolecules, we found regions with either elevated or very low SNP density. This pattern likely corresponds to the properties of the genomic region. Hence characterizing these regions as coding, noncoding, intron, or exon regions will increase our understanding of the patterns of SNP variation.
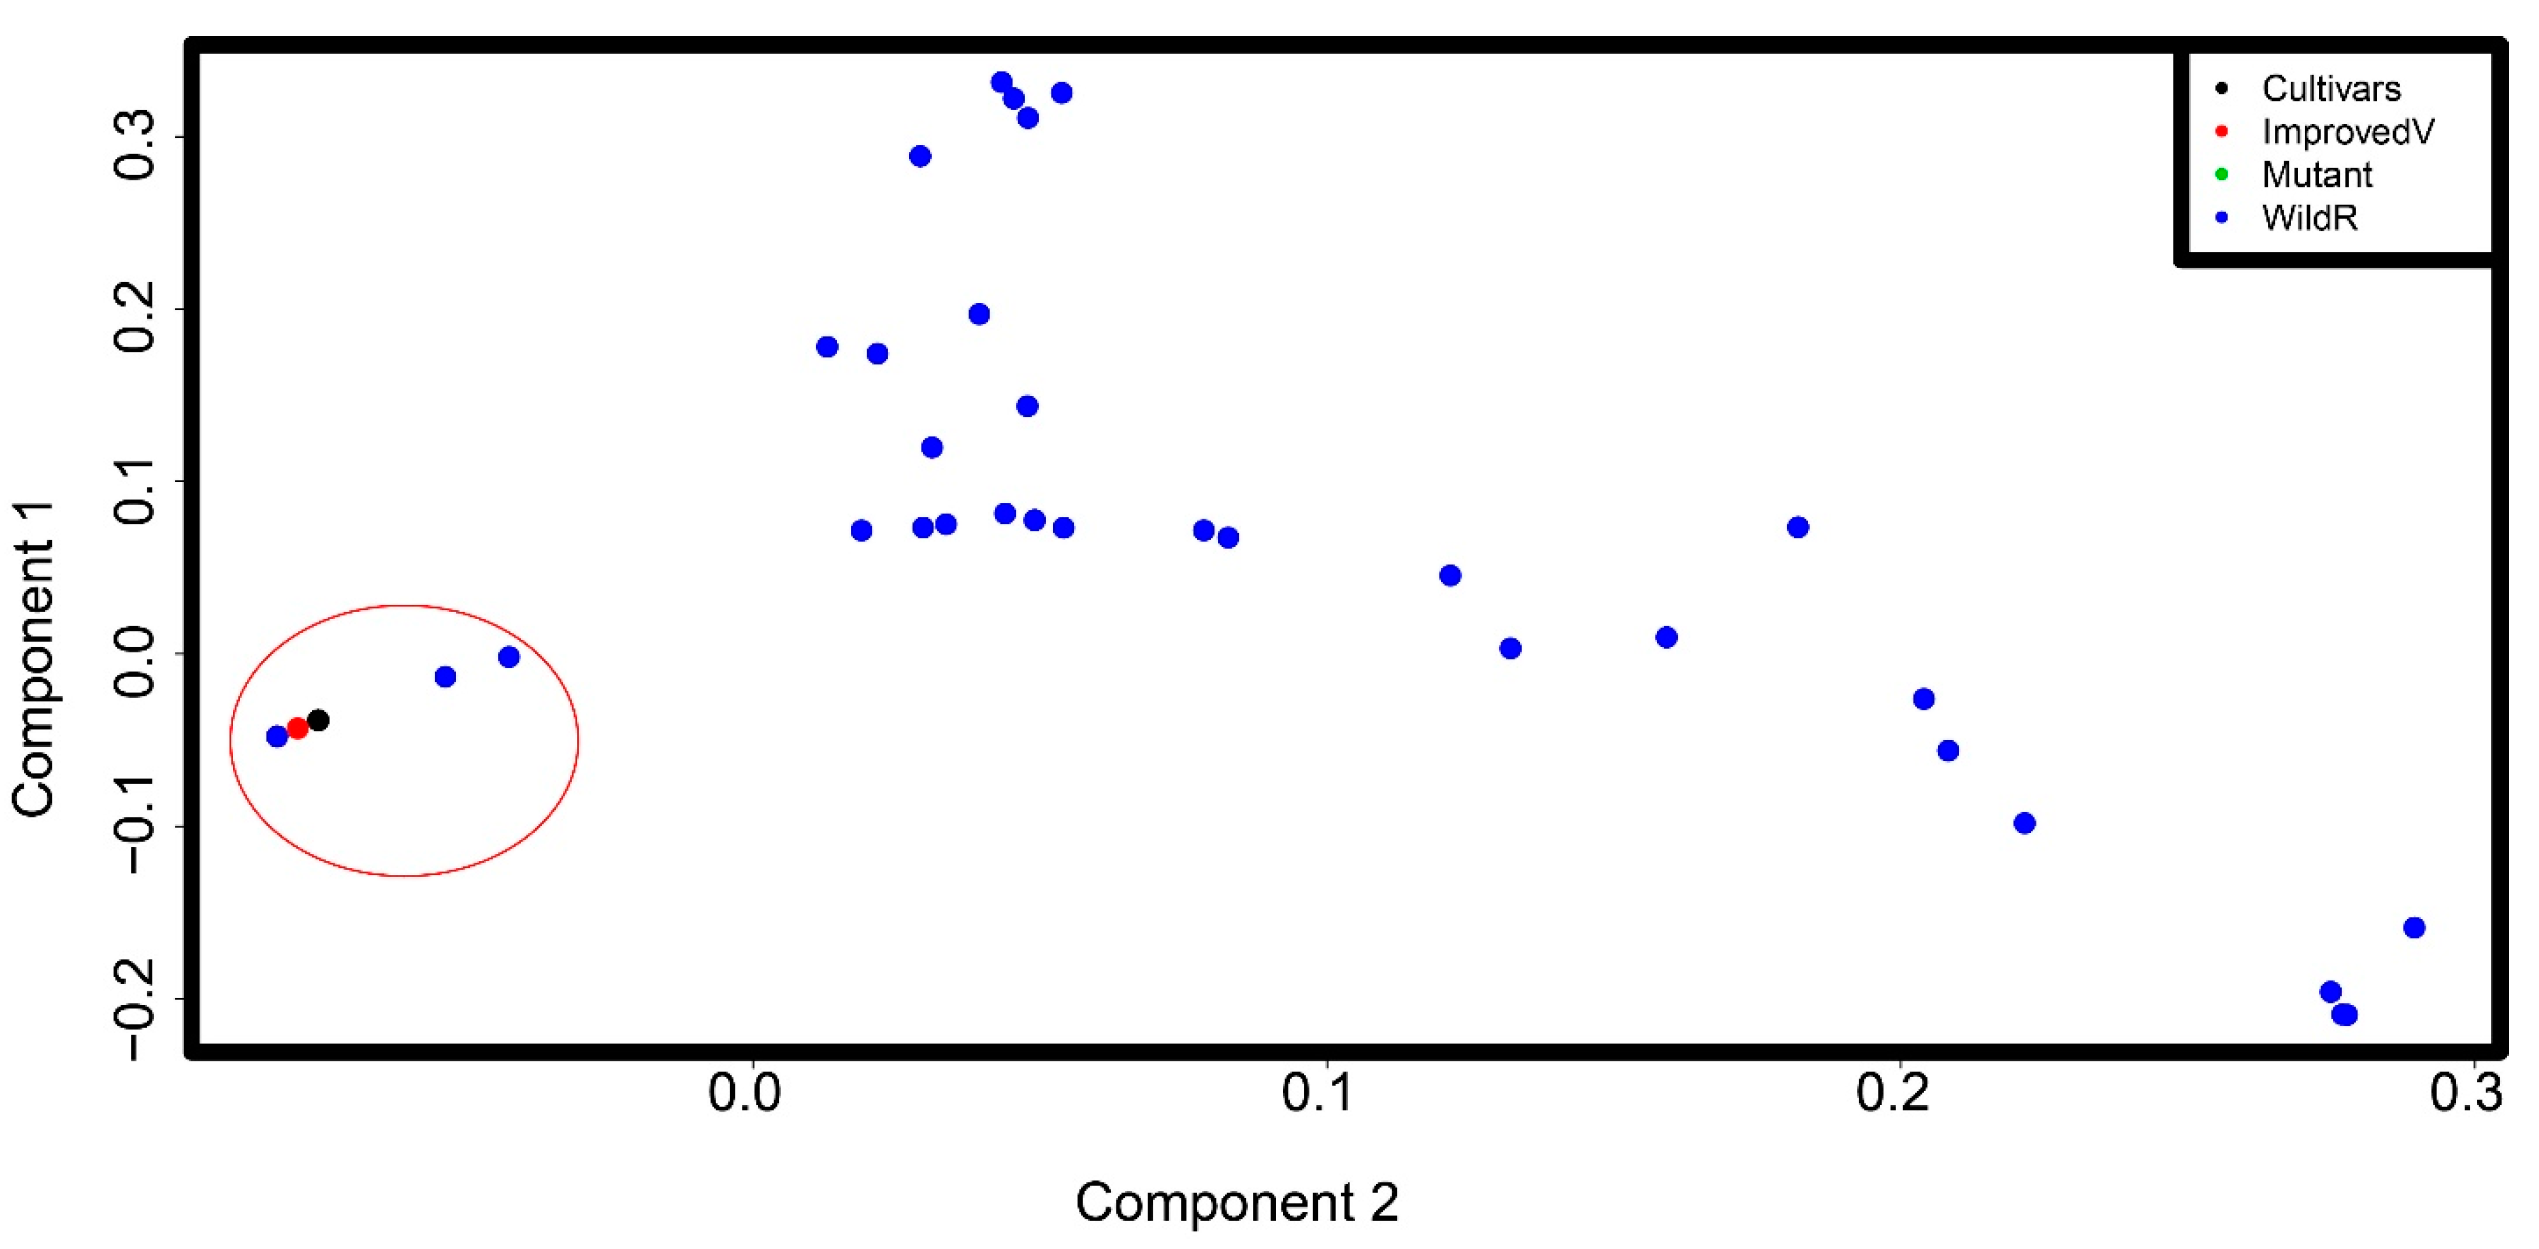
3.4. Principal Component Analysis Captures the Genetic Differentiation between Tef and Wild Eragrostis Species
To get an idea of the number of ancestral populations (K) to use in our population structure analysis, we first used principal component analysis (PCA). PCA reduced the dimension in our data, with the first two principal components together explaining about 60% of the variation in the dataset (Figure 2). We found one major cluster containing the tef cultivars, improved tef varieties, and the mutant line GA10 (circled in red). This is consistent with the germplasm class information (Table S1). This cluster also contains some wild Eragrostis species that were previously suggested to be close to tef. PCA failed to find a clear structure in the wild species subpopulation, with the germplasm showing a large dispersion. However, two subclusters are apparent in the top and bottom corners of the PCA plot.
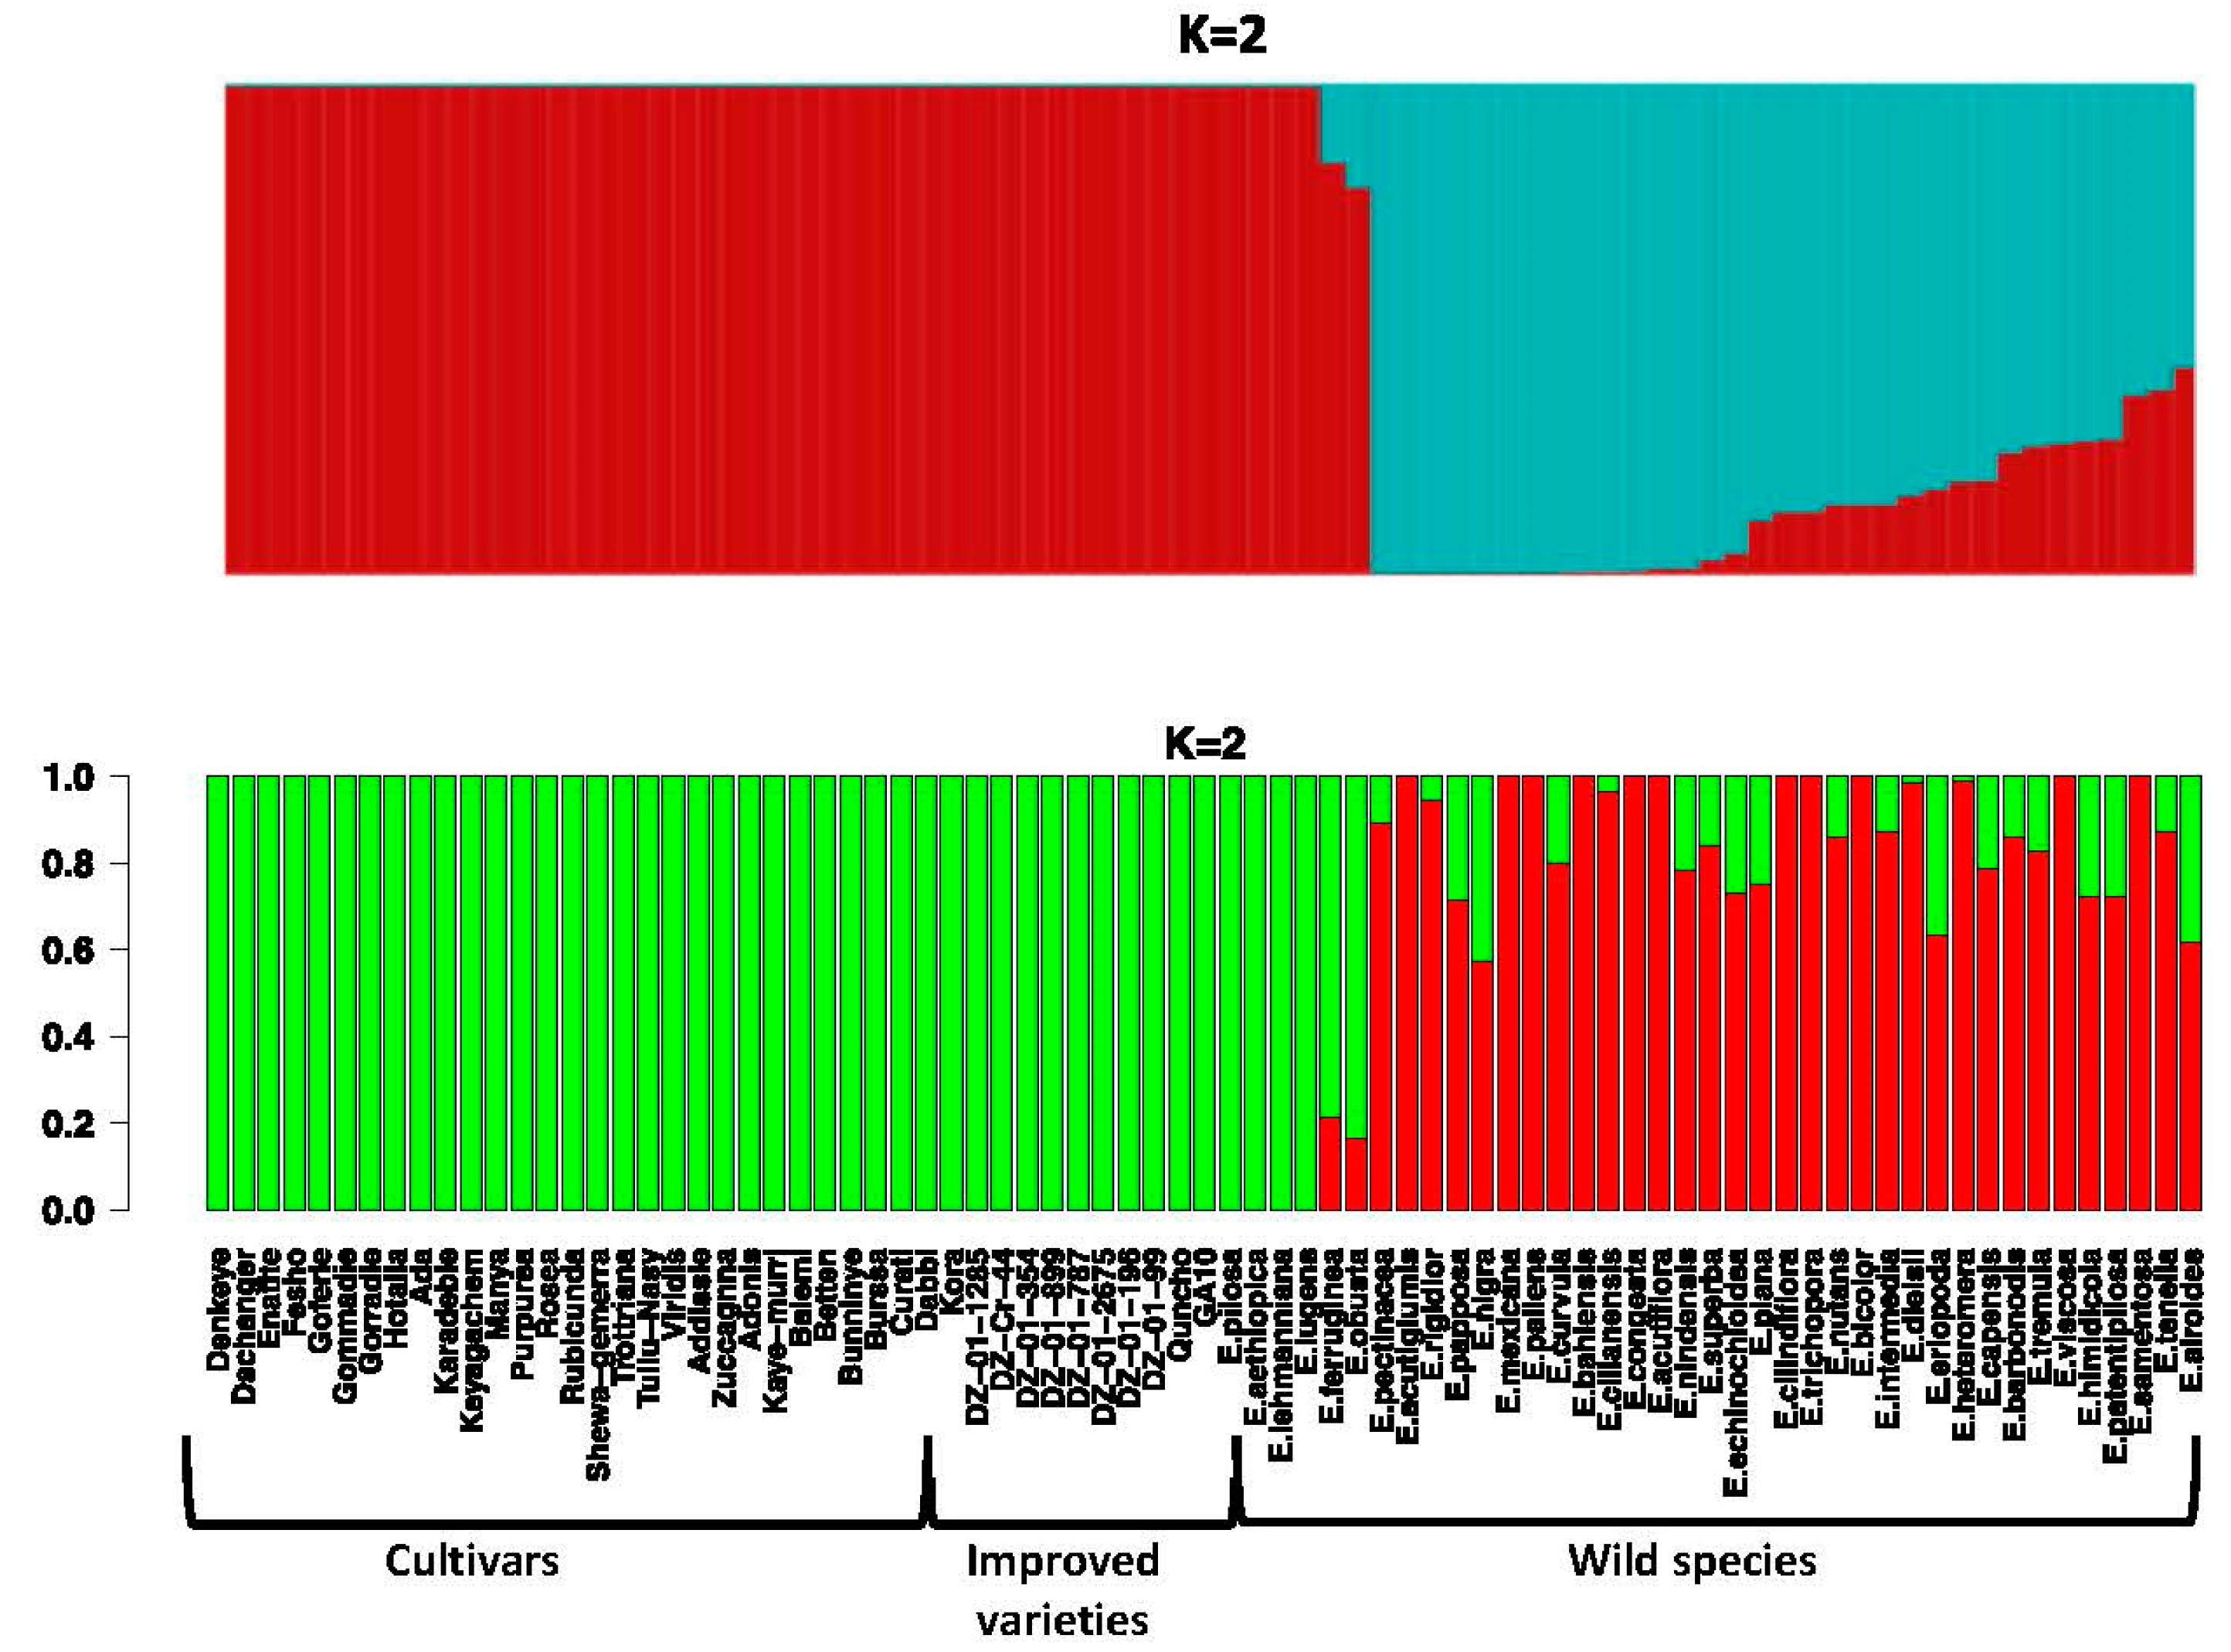
3.5. Population Structure in the Genus Eragrostis
To perform population structure analysis, we used the ADMIXTURE program, which estimates the structure of ancestral populations, and the fastStructure program. Both programs identified a similar structure in the panel that matched the results of the PCA, with the most likely assignment occurring at K = 2, meaning two ancestral populations. Each ancestral population is shown in a different color within each plot (Figure 3 for K = 2 and Figure S4 for other values of K). Our analysis did not detect population structure among the tef subpopulations. The first distinct subgroup in the first half of the structure plot is composed of all the tef cultivars, improved tef varieties, and the mutant line; the other half of the plot consists of the wild Eragrostis species. Our analysis indicated both long and short stretches of mixed ancestry for some of the wild Eragrostis species, while the genomic composition of the tef cultivars appears to be homogeneous. This suggests that at K = 2, the germplasm panel shows structure that summarizes the germplasm class information (Table S1).
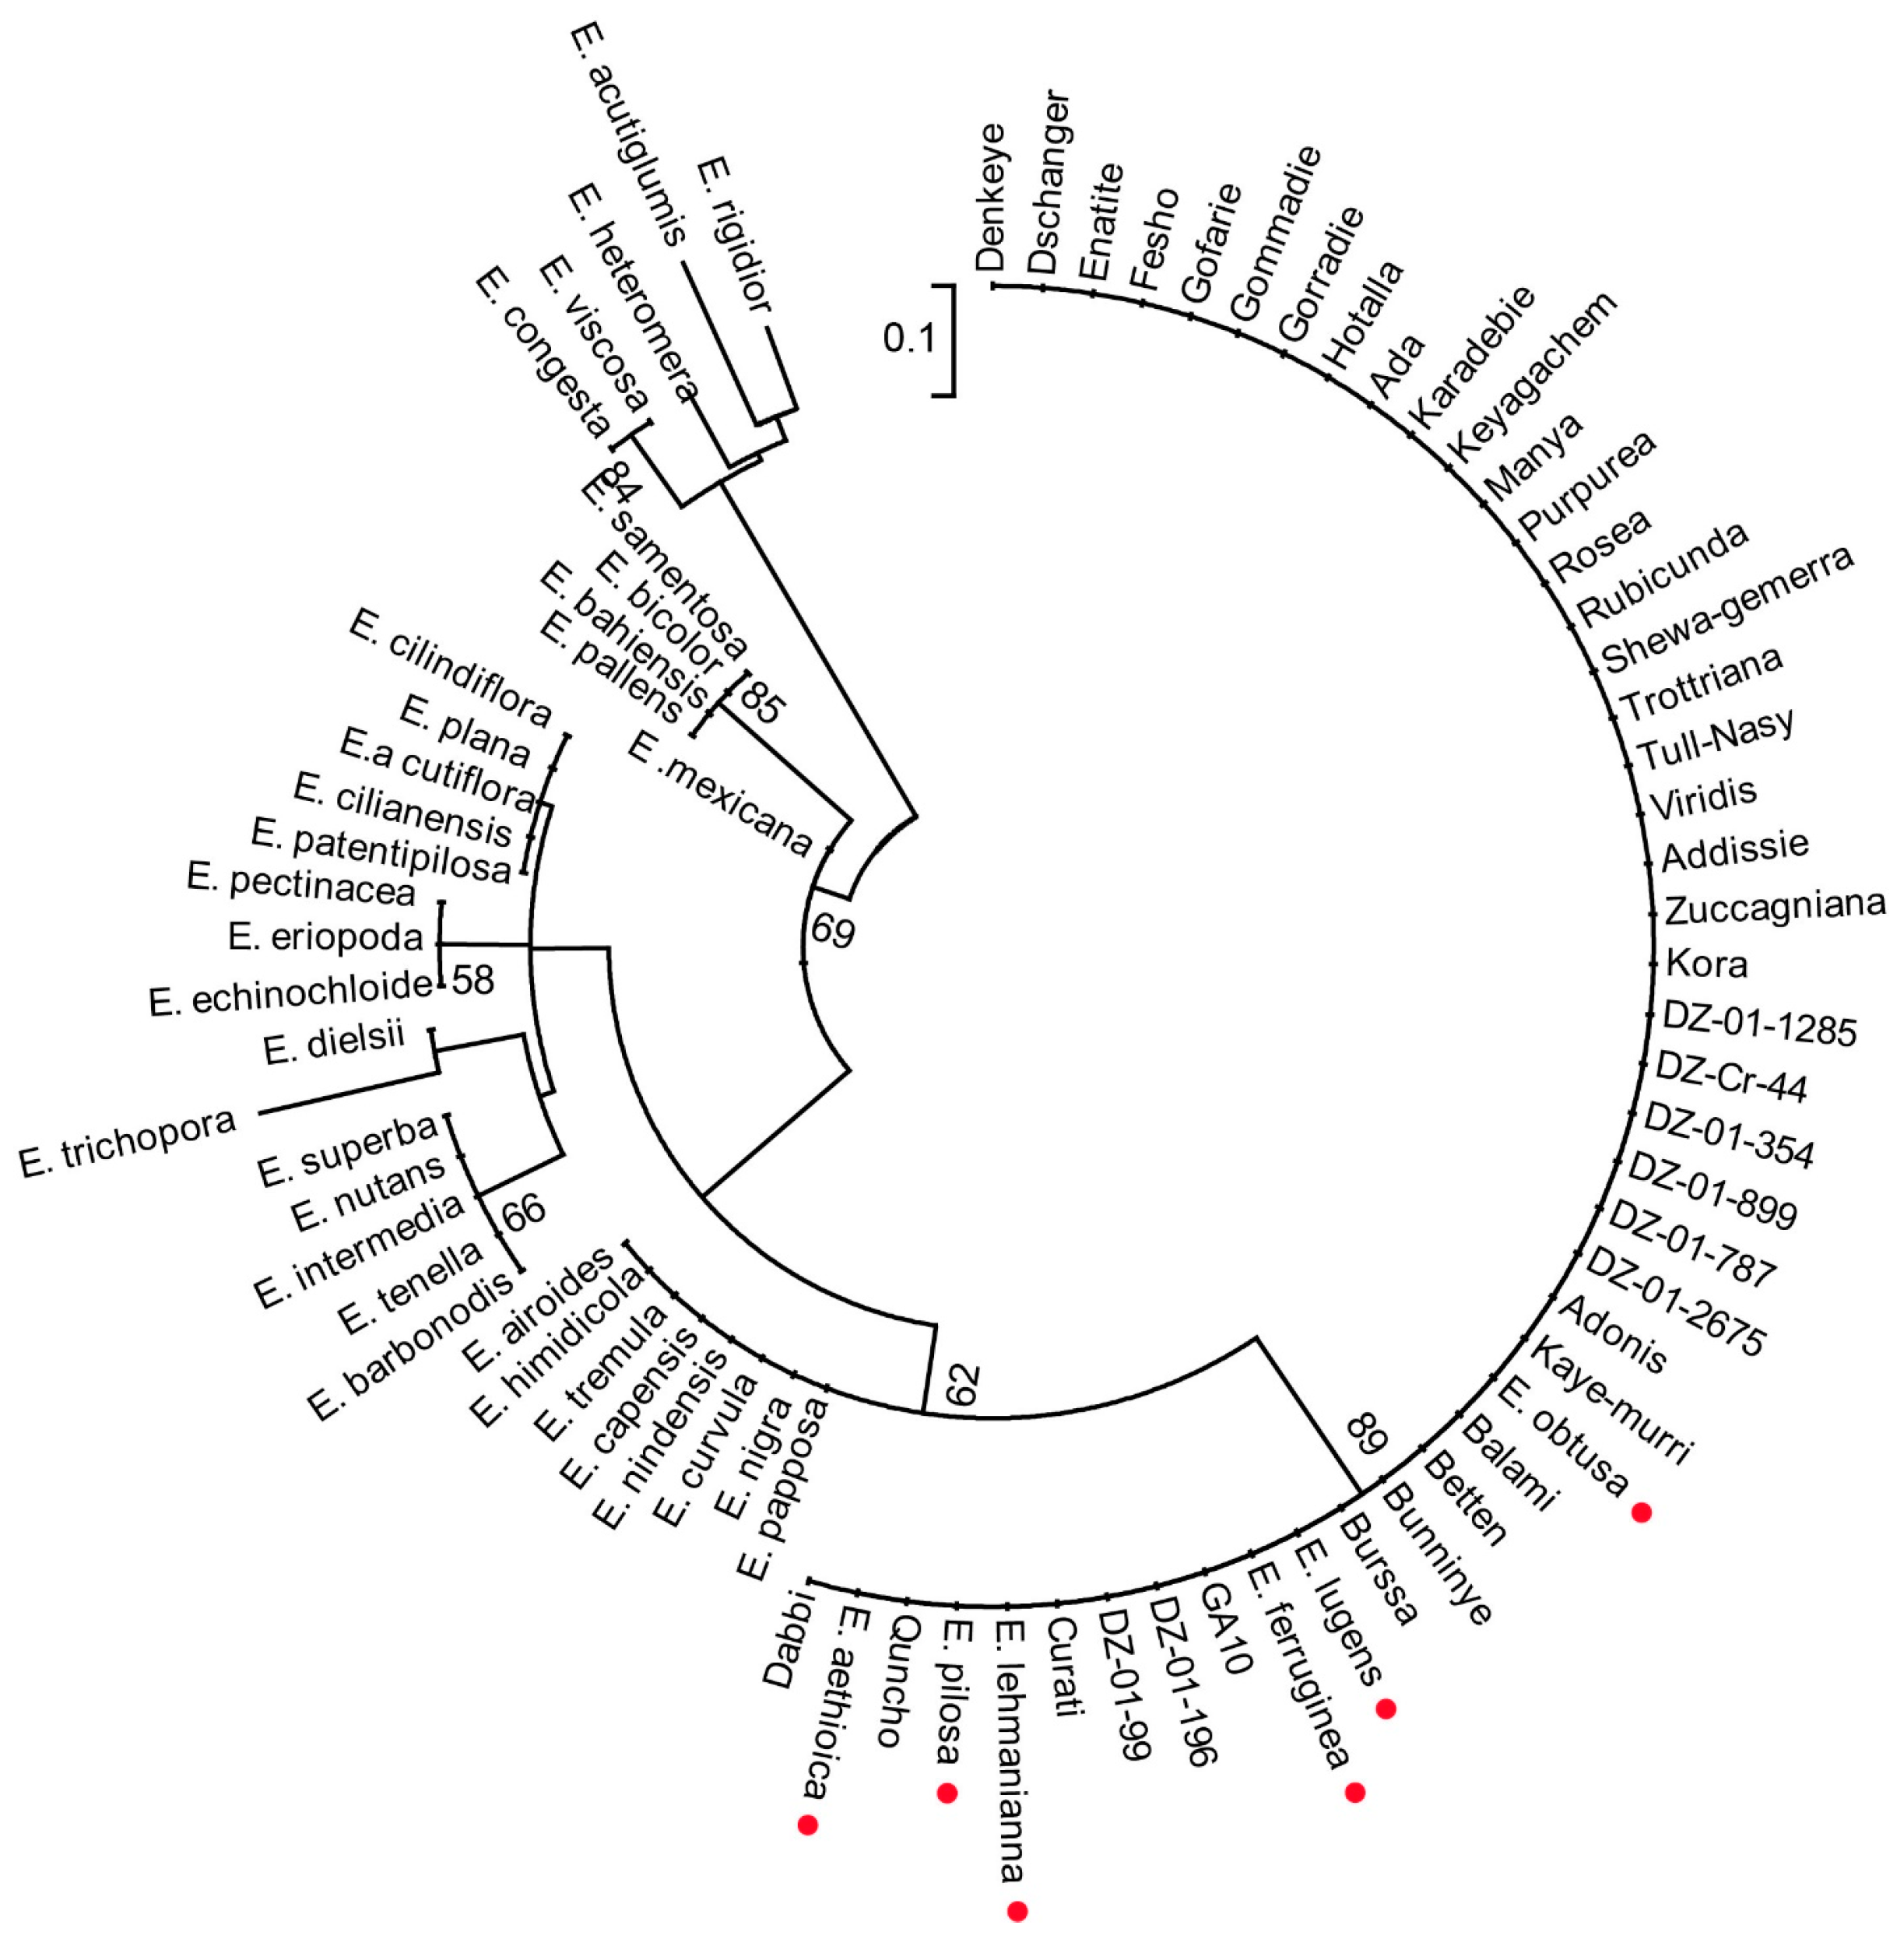
3.6. Molecular Phylogenetic Analysis Grouped Six Wild Species within the Tef Cultivars Clade
To infer the phylogenetic relationships among the Eragrostis species in the panel, molecular phylogenetic analysis was performed. Maximum likelihood estimation of the phylogenetic tree resulted in a clear separation between the tef cultivars and the wild Eragrostis species (Figure 4). However, out of the 40 wild Eragrostis species included in the study, six species (E. pilosa, E. aethiopica, E. lehmanniana, E. lugens, E. obtusa, and E. ferruginea) fell within the tef clade (red points) with strong bootstrap support. The resolution of our tree did not show the presence of intraspecific differences among the tef cultivars or even between the wild species that were grouped in this clade. The improved tef varieties that were direct selections from the tef collections and introgressions and the mutant line that was developed from an improved tef variety also fell within the tef cultivars clade. This clustering pattern partly reflects the high genetic similarity of the tef cultivars, and hence the narrow genetic base of the tef improvement process. We subsampled the data for the wild Eragrostis species and inferred a separate tree to visualize their relationships (Figure S5).
3.7. Wild Species Show High Level of Genetic Differentiation Compared to the Tef Cultivars Subpopulation
To examine the genetic diversity and differentiation within and among the subpopulations in our germplasm panel, we estimated fixation index (FST) [43] and nucleotide diversity (π) [44]. The average nucleotide diversity was π = 0.0047 for the tef cultivars, nearly equal to that for the improved tef varieties, π = 0.0040. On the other hand, the nucleotide diversity was higher for the wild Eragrostis species, π = 0.3457, than for the tef cultivars. The low nucleotide diversity estimates of the tef cultivars closely matched those estimated using the RAD-seq data (not shown). When all the species were considered together for the nucleotide diversity estimation, the average estimate was larger (π = 0.2183) than the estimate for the tef cultivars alone. Pairwise genotypic differentiation measured as FST for tef cultivars and wild species as well as improved tef varieties and wild species pairs were FST = 0.468 and FST = 0.381, respectively. In contrast, the genotypic differentiation among the tef cultivars subpopulations was FST = 0.002.
3.8. Phylogeny Tree from the Waxy Gene
To investigate the relationships among the different subgenomes, waxy gene was cloned from E. aethiopica, E. ferruginea, E. lehmanniana, E. lugens, E. obtusa, E. pilosa, and improved tef variety Tsedey. A maximum-likelihood tree was constructed using PhyML (Figure 5), and the clades labeled A–E were consistent with those of the neighbor-joining waxy tree reported previously [45], although the branching deep within the tree was not highly supported. New waxy sequences from E. lehmanniana, E. obtusa, E. pilosa, and Tsedey had copies in different subgenomes. The E. pilosa seeds were obtained from the US Department of Agriculture and appeared heterogeneous, which may explain why our new E. pilosa appeared in the D clade and not in A or B, as reported previously [45]. Most interesting is the placement of E. aethiopica in the A subgenome of tef along with the A subgenome of E. pilosa. This is strong evidence for E. aethiopica being a diploid progenitor of either tef or E. pilosa.
4. Discussion
4.1. Genotyping by Sequencing Enabled Comprehensive Genomic Analysis of Eragrostis Species
GBS-generated SNPs provided useful genome-scale data to perform genomic variation, high-density linkage mapping, and phylogenetic and population genomic analysis for various crops [12,15,16,17,22,24,46]. However, no such study exists on Eragrostis species.
In the present study, we surveyed the genomes of selected Eragrostis species panel using the GBS protocol in combination with the tef reference genome and pseudomolecule assembly. Thousands of SNPs were discovered from the panel, which is composed of the tef cultivars, improved tef varieties, a mutant line, and the wild Eragrostis species.
4.2. Genomic Distribution of GBS-SNPs in the Tef Genome
The genomic distribution of SNPs across tef’s pseudomolecules was uneven, with moderate SNP density per Mb (Figure 1), and was largely in agreement with results reported for various crop species, including rice [47,48], wheat [15,49], common bean [27], soybean [50,51], barley [15], cabbage [52], chickpea [53], and cotton [46]. As part of an ongoing investigation, examining the relationship between the patterns of SNP distribution and/or density and the presumed functional consequences on genes in the different parts of the tef genome is suggested.
4.3. Sequence Divergence between Tef Cultivars and Putative Wild Progenitors
Using genome-scale GBS data, we argue that the high sequence similarity (>92%) between E. pilosa, E. aethiopica, E. lugens, E. ferrugenia, E. lehmanniana, and E. obtusa and tef show that these species could be close relatives of tef. We confirmed this similarity in our phylogenetic analysis by showing the grouping of these six species with the tef cultivars. As diploid species, it seems likely that E. aethiopica, E. lugens, and E. lehmanniana [54] can potentially be the diploid progenitors of tef. We propose that one could perform comparative genomic analysis to determine if these species are indeed the diploid progenitors. Such analysis could shed light on the obscured identity of the diploid subgenomes inside tef.
4.4. Low Nucleotide Diversity in the Tef Species
One of the measures of genetic variability is nucleotide diversity (π), which is defined as the number of differences per nucleotide site between any two randomly chosen sequences from a population. Nucleotide diversity in major cereal crops such as wheat, maize, and barley has been reduced by domestication [55] and can fall to around 40% of the diversity of wild relatives. Tef is a strictly self-pollinating chasmogamous crop with 0.1% to 1% outcrossing [56] and shows a low-molecular but wide range of phenotypic diversity, reflecting adaptations to different agro-ecologies [1,57]. In earlier studies, nucleotide diversity was shown to be low in cultivated tef. For instance, haplotype analysis in 31 tef accessions showed low nucleotide diversity in all loci of the rht1 (π = 0.003) and sd1 (π = 0.0008) dwarfing genes [58]. Our result is in agreement with this result in that the tef species in our panel show low average nucleotide diversity (π = 004) genome wide, with relatively small population differentiation between subpopulations, despite the germplasm in each subpopulation coming from contrasting agro-ecologies. In contrast, the wild species show higher nucleotide diversity (π = 0.021). Our result is also in agreement with the low nucleotide diversity estimates that have consistently been shown for cultivated species compared to their wild counterparts [59,60], thus supporting the idea that domestication reduces nucleotide diversity at the genomic level [61,62,63]. To expand our knowledge and quantify the nucleotide diversity of the tef cultivars in more detail, one could examine nucleotide diversity among agronomically useful candidate genes.
Population genetic studies provide insight into the evolutionary processes that influence the nature and distribution of sequence variants within and among wild populations [64], and fixation index (FST), first defined by [65], is among the most widely used measures of genetic differentiation within and among populations. In theory, FST ranges from 0 (no differentiation between the overall population and its subpopulations) to 1 (complete population differentiation). The self-pollinating nature of tef plants coupled with the redundant use of same cultivars over a broad range of agro-ecologies suggests that population differentiation in tef could be poorly defined. Consistent with this hypothesis, estimates of Wright’s FST in this study show that tef landraces are poorly (FST = 0.002) and slightly (FST = 0.01) differentiated from the landrace subpopulations and improved tef varieties, respectively. Naturally, this result suggests that the genetic background of the improved tef varieties is mainly composed of the landraces, and that tef improvement through selection from the landraces might have affected only certain loci. The potential contribution of wild species to broaden genetic variability in the tef species was demonstrated [66], hence could be of further interest to tef breeders.
4.5. Phylogenetic Analyses of Eragrostis Species Using Genome-Scale Data Reasserts Previously Reported Single-Gene–Based Analyses
Phylogenetic studies based on single-gene sequence analysis have shown the close relationship of E. pilosa and tef [45]. However, the consistency of species phylogenies derived from comparisons of single genes is debated, due to the impact of horizontal gene transfer [67] and highly variable rates of evolution [68]. The availability of genome-scale data allows the construction of a phylogeny that is less sensitive to such inconsistencies and more representative of whole genomes than are single-gene trees [69]. Moreover, genome-scale data is more advantageous than single-gene–based phylogenetic analysis, as the latter does not capture enough variation among species, since conserved genes have few polymorphic loci [45,70].
Sequence-based evidence for a phylogenetic relationship between the wild Eragrostis species and tef comes from [45]. There are key differences between that study and ours. The authors used 10 wild Eragrostis species, which were suggested to be the progenitors of tef in previous studies [45,71,72]. However, our species sampling was not constrained a priori to using only the species included in the Ingram and Doyle (2003) study, but included more wild species, including E. aethiopica, which consistently showed close relationships with tef cultivars in five previous studies (Table 1). They used the nuclear gene waxy and the plastid gene rps16 for phylogenetic analysis. In contrast, we used SNPs discovered genome-wide. In their analysis, Ingram and Doyle showed that alleles from E. pilosa 4.2PI213255 and E. pilosa 4.7, PI221926 were grouped together with tef cultivars in a clade designated as A (reflecting the A subgenome). However, only one of the alleles (that of E. pilosa 4.2PI213255) grouped with tef cultivars in clade B. The allele from E. pilosa 4.7, PI221926 did not show up in clade B on the tree.
Our tree was not constructed with this level of resolution, because we were not able to distinguish between reads coming from the A and the B subgenomes. However, it not only corroborates the grouping inferred by Ingram and Doyle, but also identifies a mosaic of additional wild species that show grouping with tef. We were unable to achieve tree resolution as reported in the previous study. We made intraspecific comparisons using SNP data generated from orthologous sequences from individual germplasms. The dataset was informative enough to resolve the phylogenetic tree at least into a tef-specific clade that included most of the wild species suggested as close relatives with strong bootstrap support. Nonetheless, it was not variable enough to give us a better resolution to depict intraspecific differences.
We suggest that the next step for tef genomics research should be experimental validation of a subset of the SNPs and examination of the functional consequences of gene-specific variation on useful agronomic traits. It is important to note that our analysis is based on the SNP data generated from reads that were mapped to a single position in the tef reference genome. We also used only biallelic sites, despite the mosaic of ploidy levels within our germplasm panel. Another limitation is that, due to the limited knowledge we had of most of the wild Eragrostis species, it was difficult to make sense of their grouping patterns. However, the data generated here will serve as a starting point for further sequence-based analysis, possibly assisted by detailed phenotyping of the wild species.
4.6. Coupling the Potential of the Wild Eragrostis Species with Tef Breeding
Many investigators have elaborated on the importance and use of wild species for crop improvement in the face of increasing human population and climate change [74,75,76]. However, determining the likely value of wild species for crop improvement requires the collection and subsequent characterization of the phenotypic, phonologic, and genomic diversity within the species and understanding their genetics. The role of the wild Eragrostis species in tef research has been insignificant. Even after the timing of the floral openings in tef was discovered 40 years ago [77], the cross-compatibility of tef is still restricted to only one wild species out of the 350 Eragrostis species. The interspecific hybrids or recombinant inbred lines between E. tef and E. pilosa have demonstrated their worth and, indirectly, that of the wild Eragrostis species in general, by improving the resolution of the genetic linkage map of tef [78]. With the cross-compatibility rate maximum of 1%, the genetic diversity of tef will remain restricted to itself. In addition, almost all of the previous genetic diversity studies solely used the tef cultivars [57]. We argue that our work changed this scenario by generating genomic data from 40 wild Eragrostis species. We revealed greater genomic diversity in these species than in the tef species. To further exploit the potential of these wild Eragrostis species, including them in the tef crossing program could be of further interest, albeit without hybridization issues. In addition, the tef breeding resource base is being expanded with the addition of mutant lines developed through TILLING and may prove essential for the future of tef breeding.
4.7. Deciphering the Diploid Pieces of the Allotetraploid Tef Genome
Allotetraploid plant species originate when the genomes of diploid species are brought together in hybrids and then duplicated, and in such species the genomes of the diploid parents become homologous subgenomes [79]. As the tef genome is an allotetraploid species, knowledge of its composition and evolution is crucial for tef genomics research and has important practical applications for tef breeding. Both sequence-based genomic analysis and genetic methods are expected to improve this understanding. Tef has two diploid subgenomes, designated as A and B, which are estimated to have diverged 4.0 MYA [7] and 6.4 MYA [58]. No direct wild progenitor or diploid ancestors of tef have yet been identified. In addition, our knowledge about the evolutionary history of the tef species has not been well organized. About nine distinct studies have attempted to find out the wild progenitors and/or close relatives of tef (Table 1). Despite differences in the data and species used in these studies, two species, E. aethiopica (diploid) and E. pilosa (tetraploid), stand out as the most consistent candidates. Although we did not confirm the ploidy level of E. aethiopica and E. pilosa, these species have high sequence similarity to the tef genome. Assessing the genetic legacy of these species for the evolution of the cultivated tef genome may first require comparative genomics of the two subgenomes within tef and parallel comparative genomics of these putative diploid species and tef. For this purpose, we believe that separating the A and B subgenomes is crucial.
The separation of homologous subgenomes has been approached in different ways in polyploid plant species. A recently developed program for durum wheat separates original contigs obtained by RNAseq into two homologous sequences based on maximum likelihood optimization [80]. To separate the subgenomes of the octoploid progenitors of cultivated strawberry Fragaria virginiana and Fragaria chiloensis, dense linkage maps generated by targeted sequence capture were implemented [81]. With this approach, the subgenomes of the wild octoploid progenitors of cultivated strawberry could be disentangled. Alternatively, as linkage map–based methods are showing promise, their application to the case of tef is worthwhile. Once this is resolved, comparative genomic analysis of the subgenomes and the putative diploid progenitors identified in our study and elsewhere will likely shed light on the tef identity crisis.
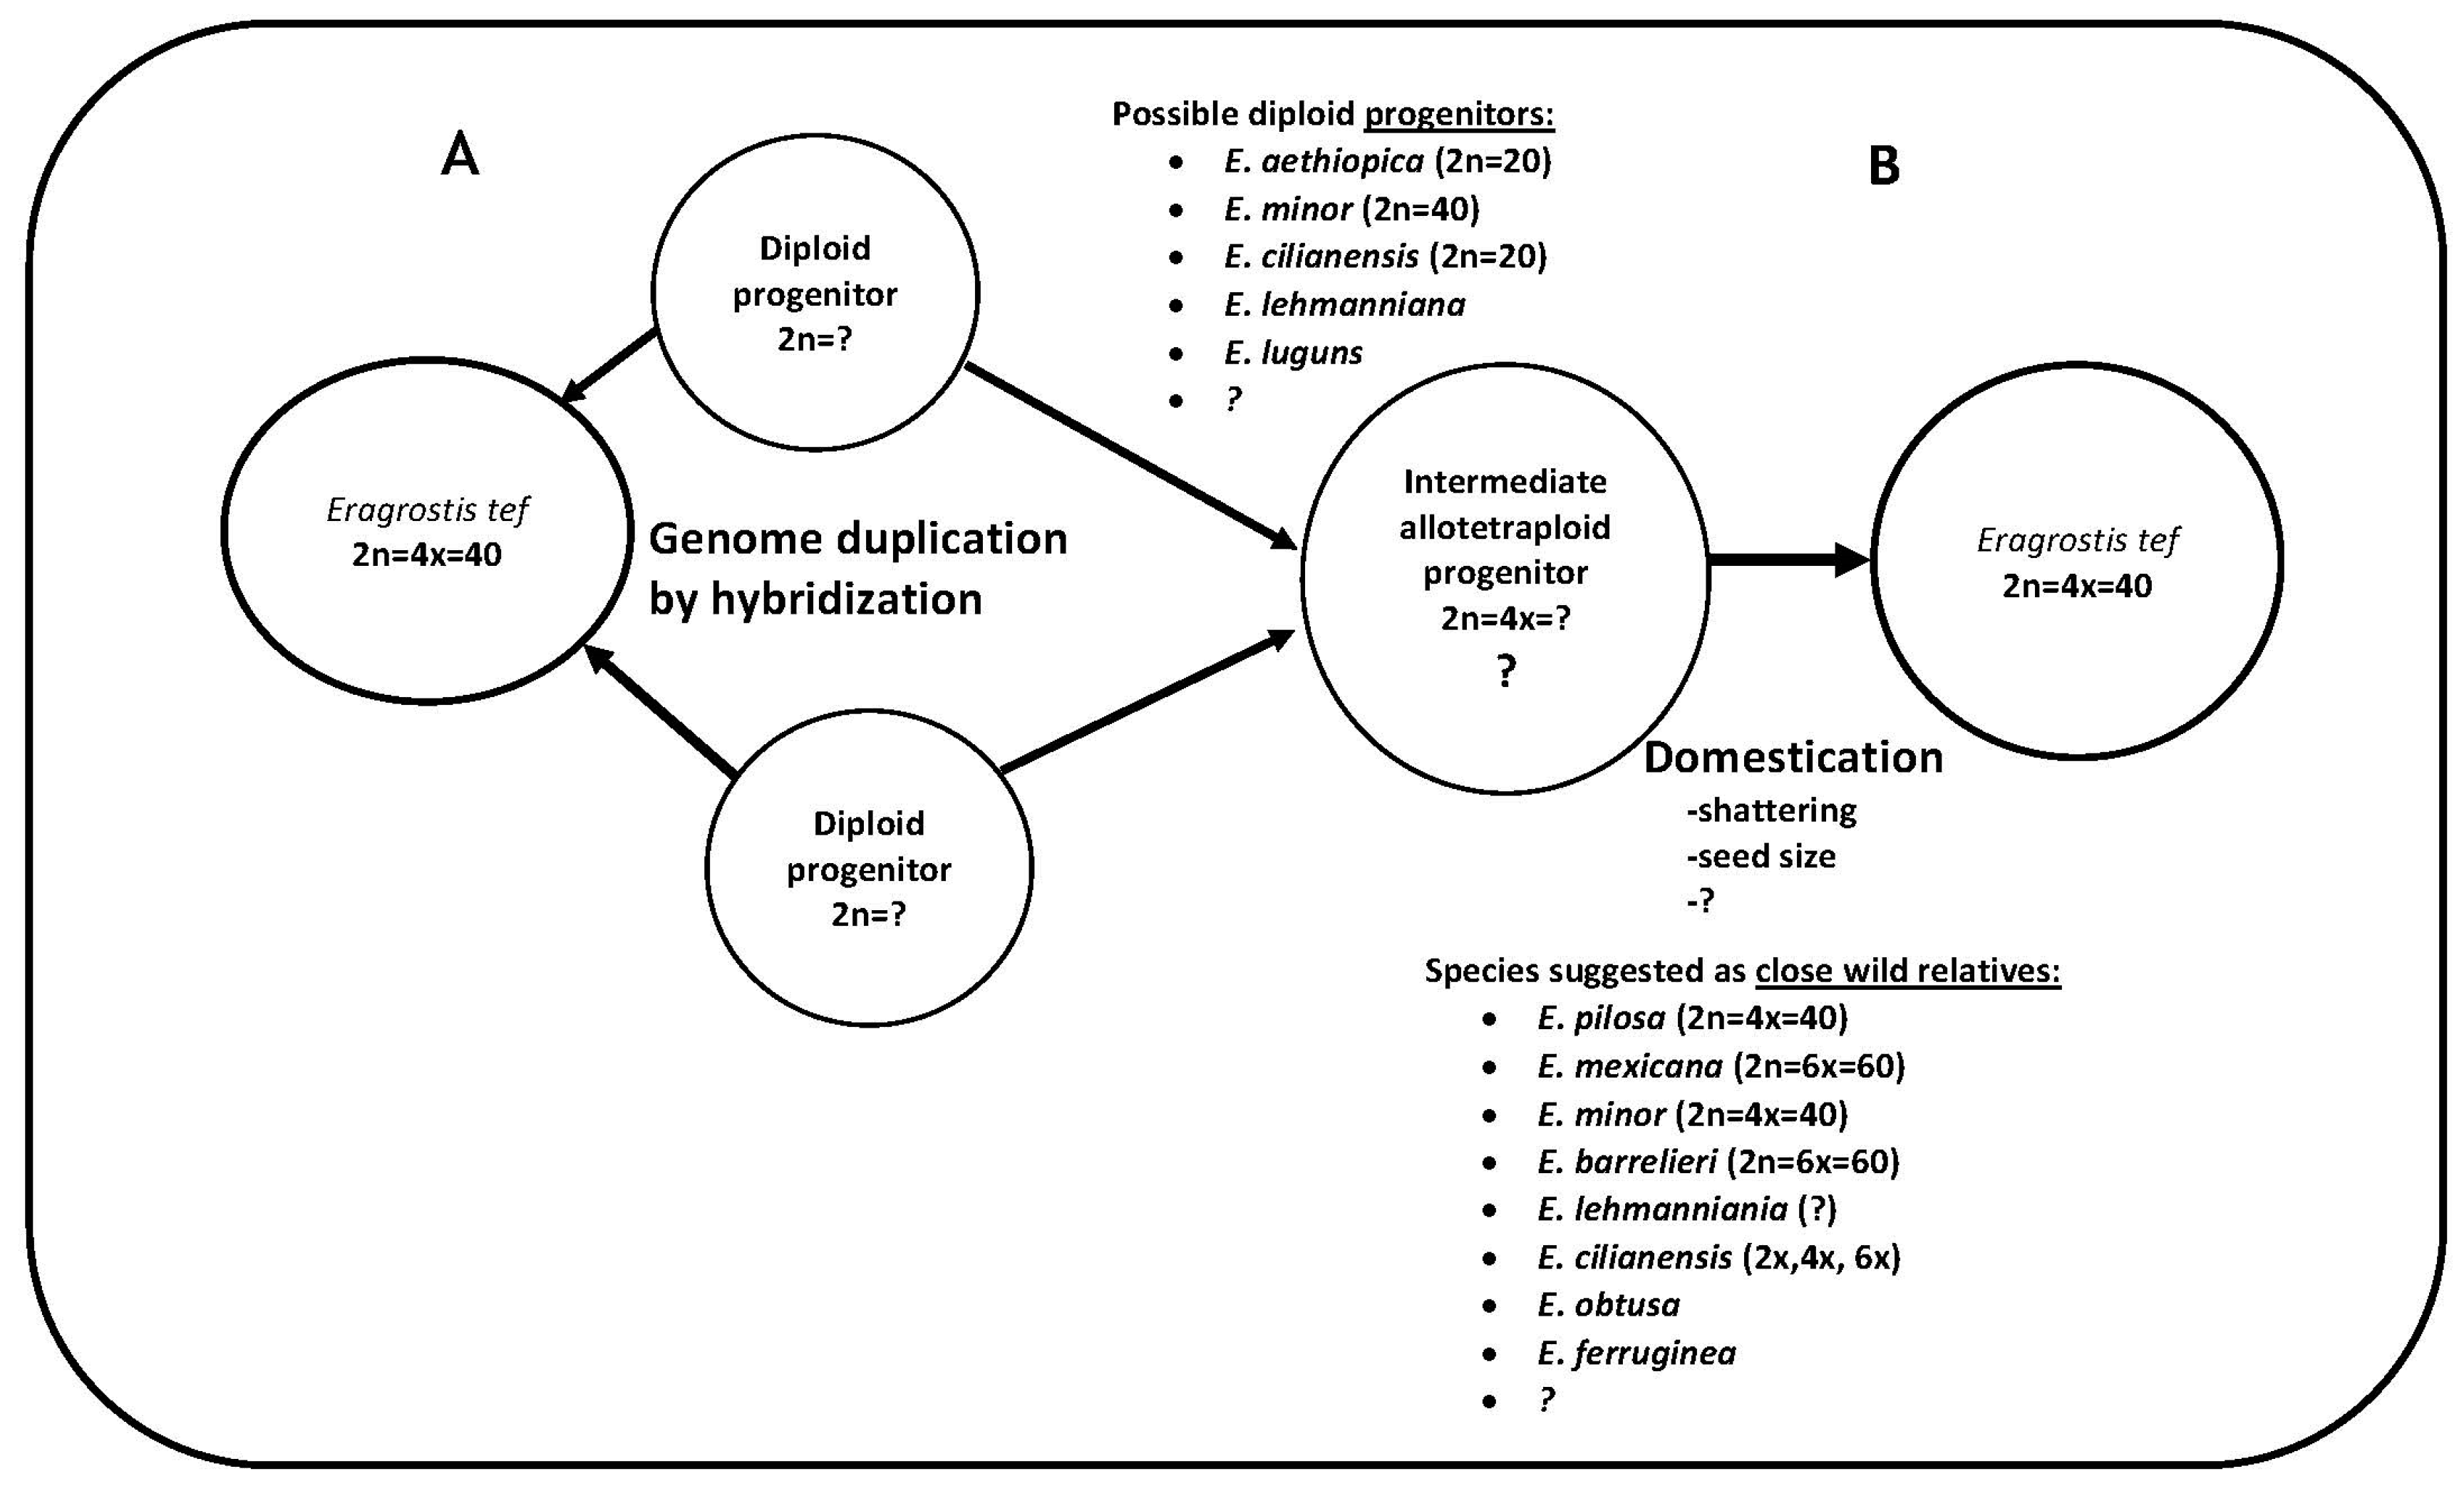
In general, the above-mentioned features render tef a difficult taxon for genomic studies and could hamper modern tef breeding efforts. While challenges such as identifying the exact identity of the two diploid subgenomes remain to be addressed, a framework through which there is interplay of the possible species toward the allotetraploid tef genome should not be too far off. By structuring the genetic and phylogenetic information on this species into a framework, we present a pathway depicting the two likely routes by which the tetraploid tef genome has evolved. This pathway (Figure 6) consists of the species suggested previously along with the species that were identified in the current study. This enables a more focused and framework-oriented approach, ultimately informing tef breeding and genomics research.
4.8. Phylogeny Tree from the Waxy Gene
Two different datasets were used to assess the relationships between tef and the wild species in this study. One is a study of the waxy gene tree, which has the advantage that the A and B sequences can be separated and show the subgenomes contributing to each species. The disadvantage is that gene-tree phylogeny does not necessarily reflect the species tree. However, it is usually a good estimate if no unusual hybridization or lineage sorting has occurred.
The GBS method has the advantage that it samples the entire genome. The disadvantage of GBS is that the SNPs coming from different subgenomes have not been separated, so only an average over all subgenomes is seen. The waxy gene tree and the GBS tree are consistent in that E. aethiopica and E. pilosa are within the tef clade.
The phylogenetic tree constructed from the waxy gene (Figure 5) reproduces the basic topology of Ingram and includes new sequences. As in Ingram, the closest Eragrostis to the B genome is E. heteromera, which is outside the tef/pilosa clade but a very close diploid. A new addition to the A clade is E. aethiopica, which falls within the clade containing tef and E. pilosa. This is strong evidence for E. aethiopica being a very close diploid to the A genome and the best candidate as a diploid progenitor for the A genome.
The waxy sequences of E. obtusa, E. ferruginea, E. lugens and E. lehmaniana are not close to the clades containing tef in the waxy tree presented here. E. lehmaniana is not close to tef in the waxy tree of Ingram. E. lugens has a D genome in the Ingram tree. We have two E. lugens sequences, which are not near the lugens sequence of Ingram or either E. tef clade.
5. Conclusions
In this study, the SNP data generated using the GBS protocol provides a useful molecular resource to facilitate tef improvement. The wild Eragrostis species demonstrated high genetic diversity and could prove essential in enriching the tef gene pool. The putative wild progenitors of tef, including diploids, showing high sequence similarity to the tef genome are clustered with the tef cultivars in the phylogenetic tree. Given the limited funding available, this could help minimize the species included in further genomic studies. The data generated here represents the most taxonomically inclusive genomic resource developed from Eragrostis species to date and demonstrates the potential of GBS as an alternative genotyping platform for tef genomics research for crop researchers with limited resources for genome sequencing. It also provides genome-scale genomic resources and framework to inform and guide additional genomic studies of the species for tef breeding research. The phylogenetic tree using the waxy gene suggests that E. aethiopica and E. pilosa are the closest relatives to tef, with E. heteromera the closest known diploid to the tef B genome and E. aethiopica within the tef clade of the A genome. To fully exploit the GBS data, sequencing of all subgenomes of the Eragrostis clade is vital for future diversity studies.
Supplementary Materials
The following are available online at https://www.mdpi.com/1424-2818/10/2/17/s1: Table S1. Germplasm class information and source; Table S2. Summary of the ApeKI Eragrostis GBS; Table S3. Number of read counts and mapping rate to the tef genome; Table S4. Number of SNPs detected on individual pseudomolecules and SNP density; Figure S1. Mean sequencing depth of the ApeKI Eragrostis library generated by the GBS protocol; Figure S2. SNP coverage statistics; Figure S3. SNP number vs. pseudomolecule length; Figure S4. Population structure at different clustering levels; Figure S5. Phylogenetic tree of the wild Eragrostis species.
Acknowledgments
This work was done as part of a PhD project by D.G. and was supported by the Syngenta Foundation for Sustainable Agriculture and the University of Bern. We dedicate this work to the late Sime Debela, a pioneer in Ethiopian agricultural research and a former Director General of the Ethiopian Institute of Agricultural Research.
Author Contributions
D.G. and Z.T. conceived and designed the experiment. D.G. and A.W. conducted the wet lab work. D.G. did the GBS data analysis. G.C. did the waxy sequence analysis. D.G. wrote the manuscript. G.C. and Z.T. revised the manuscript. All authors read and approved the final manuscript.
Conflicts of Interest
The authors declare no conflict of interest.
References
- Ketema, S. Tef, Eragrostis Tef (Zucc.) Trotter; Institute of Plant Genetics and Crop Plant Research, Gatersleben/International Plant Genetic Resources Institute: Rome, Italy, 1997; p. 52. [Google Scholar]
- Yemane, K.; Yilma, H. Food and grain losses in traditional storage facilities in three areas of Ethiopia. In Proceedings of the National Workshop on Food Strategies for Ethiopia, Alemaya University, Alemaya, Ethiopia, 8–12 December 1986; pp. 407–430. [Google Scholar]
- Central Statistical Agency (CSA). Agricultural Sample Survey for 2013/14; Central Statistical Agency: Addis Ababa, Ethiopia, 2014.
- Hamaker, B.R. Technology of Functional Cereal Products; Woodhead Publishing: Sawston, UK, 2007. [Google Scholar]
- Tome, D.; Bos, C. Lysine requirement through the human life cycle. J. Nutr. 2007, 137, 1642s–1645s. [Google Scholar] [CrossRef] [PubMed]
- Spaenij-Dekking, L.; Kooy-Winkelaar, Y.; Koning, F. The Ethiopian cereal tef in celiac disease. N. Engl. J. Med. 2005, 353, 1748–1749. [Google Scholar] [CrossRef] [PubMed]
- Cannarozzi, G.; Plaza-Wuthrich, S.; Esfeld, K.; Larti, S.; Wilson, Y.S.; Girma, D.; de Castro, E.; Chanyalew, S.; Blosch, R.; Farinelli, L.; et al. Genome and transcriptome sequencing identifies breeding targets in the orphan crop tef (Eragrostis tef). BMC Genom. 2014, 15, 581. [Google Scholar] [CrossRef] [PubMed]
- Clayton, S.D.; Renvoize, S.A. Genera Graminum: Grasses of the World; University of Chicago Press: Chicago, IL, USA, 1986. [Google Scholar]
- Vavilov, I. The Origin, Variation, Immunity and Breeding of Cultivated Plants; Translated from the Russian by Chester, K.S.; Ronald Press Co.: New York, NY, USA, 1951. [Google Scholar]
- Elshire, R.J.; Glaubitz, J.C.; Sun, Q.; Poland, J.A.; Kawamoto, K.; Buckler, E.S.; Mitchell, S.E. A robust, simple genotyping-by-sequencing (GBS) approach for high diversity species. PLoS ONE 2011, 6, e19379. [Google Scholar] [CrossRef] [PubMed]
- Baird, N.A.; Etter, P.D.; Atwood, T.S.; Currey, M.C.; Shiver, A.L.; Lewis, Z.A.; Selker, E.U.; Cresko, W.A.; Johnson, E.A. Rapid SNP discovery and genetic mapping using sequenced RAD markers. PLoS ONE 2008, 3, e3376. [Google Scholar] [CrossRef] [PubMed]
- Peng, Y.; Hu, Y.; Mao, B.; Xiang, H.; Shao, Y.; Pan, Y.; Sheng, X.; Li, Y.; Ni, X.; Xia, Y.; et al. Genetic analysis for rice grain quality traits in the YVB stable variant line using RAD-seq. Mol. Genet. Genom. 2016, 291, 297–307. [Google Scholar] [CrossRef] [PubMed]
- Begum, H.; Spindel, J.E.; Lalusin, A.; Borromeo, T.; Gregorio, G.; Hernandez, J.; Virk, P.; Collard, B.; McCouch, S.R. Genome-wide association mapping for yield and other agronomic traits in an elite breeding population of tropical rice (Oryza sativa). PLoS ONE 2015, 10, e0119873. [Google Scholar] [CrossRef] [PubMed]
- Tang, W.J.; Wu, T.T.; Ye, J.; Sun, J.; Jiang, Y.; Yu, J.; Tang, J.P.; Chen, G.M.; Wang, C.M.; Wan, J.M. SNP-based analysis of genetic diversity reveals important alleles associated with seed size in rice. BMC Plant Biol. 2016, 16. [Google Scholar] [CrossRef]
- Poland, J.A.; Brown, P.J.; Sorrells, M.E.; Jannink, J.L. Development of high-density genetic maps for barley and wheat using a novel two-enzyme genotyping-by-sequencing approach. PLoS ONE 2012, 7, e32253. [Google Scholar] [CrossRef] [PubMed]
- Liu, H.; Bayer, M.; Druka, A.; Russell, J.R.; Hackett, C.A.; Poland, J.; Ramsay, L.; Hedley, P.E.; Waugh, R. An evaluation of genotyping by sequencing (GBS) to map the Breviaristatum-e (ari-e) locus in cultivated barley. BMC Genom. 2014, 15, 104. [Google Scholar] [CrossRef] [PubMed] [Green Version]
- Morris, G.P.; Ramu, P.; Deshpande, S.P.; Hash, C.T.; Shah, T.; Upadhyaya, H.D.; Riera-Lizarazu, O.; Brown, P.J.; Acharya, C.B.; Mitchell, S.E.; et al. Population genomic and genome-wide association studies of agroclimatic traits in sorghum. Proc. Natl. Acad. Sci. USA 2013, 110, 453–458. [Google Scholar] [CrossRef] [PubMed] [Green Version]
- Lipka, A.E.; Gore, M.A.; Magallanes-Lundback, M.; Mesberg, A.; Lin, H.; Tiede, T.; Chen, C.; Buell, C.R.; Buckler, E.S.; Rocheford, T.; et al. Genome-wide association study and pathway-level analysis of tocochromanol levels in maize grain. G3 2013, 3, 1287–1299. [Google Scholar] [CrossRef] [PubMed]
- Romay, M.C.; Millard, M.J.; Glaubitz, J.C.; Peiffer, J.A.; Swarts, K.L.; Casstevens, T.M.; Elshire, R.J.; Acharya, C.B.; Mitchell, S.E.; Flint-Garcia, S.A.; et al. Comprehensive genotyping of the USA national maize inbred seed bank. Genome Biol. 2013, 14, R55. [Google Scholar] [CrossRef] [PubMed]
- Takuno, S.; Ralph, P.; Swarts, K.; Elshire, R.J.; Glaubitz, J.C.; Buckler, E.S.; Hufford, M.B.; Ross-Ibarra, J. Independent molecular basis of convergent highland adaptation in Maize. Genetics 2015, 200, 1297–1312. [Google Scholar] [CrossRef] [PubMed]
- Punnuri, S.M.; Wallace, J.G.; Knoll, J.E.; Hyma, K.E.; Mitchell, S.E.; Buckler, E.S.; Varshney, R.K.; Singh, B.P. Development of a high-density linkage map and tagging leaf spot resistance in Pearl Millet using genotyping-by-sequencing markers. Plant Genome 2016, 9. [Google Scholar] [CrossRef] [PubMed] [Green Version]
- Bajaj, D.; Das, S.; Upadhyaya, H.D.; Ranjan, R.; Badoni, S.; Kumar, V.; Tripathi, S.; Gowda, C.L.; Sharma, S.; Singh, S.; et al. A Genome-wide combinatorial strategy dissects complex genetic architecture of seed coat color in Chickpea. Front. Plant Sci. 2015, 6, 979. [Google Scholar] [CrossRef] [PubMed]
- Huang, Y.-F.; Poland, J.A.; Wight, C.P.; Jackson, E.W.; Tinker, N.A. Using genotyping-by-sequencing (GBS) for genomic discovery in cultivated oat. PLoS ONE 2014, 9, e102448–10. [Google Scholar] [CrossRef] [PubMed]
- Wallace, J.; Upadhyaya, H.; Vetriventhan, M.; Buckler, E.; Hash, T.; Ramu, P. The genetic makeup of a global barnyard millet germplasm collection. Plant Genome 2015, 1–39. [Google Scholar] [CrossRef]
- Wang, S.; Chen, J.D.; Zhang, W.P.; Hu, Y.; Chang, L.J.; Fang, L.; Wang, Q.; Lv, F.N.; Wu, H.T.; Si, Z.F.; et al. Sequence-based ultra-dense genetic and physical maps reveal structural variations of allopolyploid cotton genomes. Genome Biol. 2015, 16. [Google Scholar] [CrossRef] [PubMed]
- Hyma, K.E.; Barba, P.; Wang, M.; Londo, J.P.; Acharya, C.B.; Mitchell, S.E.; Sun, Q.; Reisch, B.; Cadle-Davidson, L. Heterozygous mapping strategy (HetMappS) for high resolution genotyping-by-sequencing markers: A case study in Grapevine. PLoS ONE 2015, 10, e0134880. [Google Scholar] [CrossRef] [PubMed]
- Hart, J.P.; Griffiths, P.D. Genotyping-by-sequencing enabled mapping and marker development for the by-2 potyvirus resistance allele in common bean. Plant Genome 2015, 8. [Google Scholar] [CrossRef]
- Lipka, A.E.; Lu, F.; Cherney, J.H.; Buckler, E.S.; Casler, M.D.; Costich, D.E. Accelerating the switchgrass (Panicum virgatum L.) breeding cycle using genomic selection approaches. PLoS ONE 2014, 9, e112227. [Google Scholar] [CrossRef] [PubMed]
- Ebba, T. Tef Cultivars: Morphology and Classification; Addis Ababa University, College of Agriculture: Dire Dawa, Ethiopia, 1975. [Google Scholar]
- Ministry of Agriculture (MoA). Crop Variety Register Issue No. 15; Ministry of Agriculture, Animal and Plant Health Regulatory Directorate: Addis Ababa, Ethiopia, 2014.
- Tadele, Z. Tef Improvement Project: Harnessing genetic and genomic tools to boost productivity. In Achievements and Prospects of Tef Improvement; Assefa, K., Chanyalew, S., Tadele, Z., Eds.; EIAR-University of Bern: Bern, Switzerland, 2013; pp. 333–342. [Google Scholar]
- Chua, K.Y.; Doyle, C.R.; Simpson, R.J.; Turner, K.J.; Stewart, G.A.; Thomas, W.R. Isolation of cDNA coding for the major mite allergen Der p II by IgE plaque immunoassay. Int. Arch. Allergy Appl. Immunol. 1990, 91, 118–123. [Google Scholar] [CrossRef] [PubMed]
- Glaubitz, J.C.; Casstevens, T.M.; Lu, F.; Harriman, J.; Elshire, R.J.; Sun, Q.; Buckler, E.S. TASSEL-GBS: A high capacity genotyping by sequencing analysis pipeline. PLoS ONE 2014, 9, e90346. [Google Scholar] [CrossRef] [PubMed]
- Li, H.; Durbin, R. Fast and accurate short read alignment with Burrows-Wheeler transform. Bioinformatics 2009, 25, 1754–1760. [Google Scholar] [CrossRef] [PubMed]
- Danecek, P.; Auton, A.; Abecasis, G.; Albers, C.A.; Banks, E.; DePristo, M.A.; Handsaker, R.E.; Lunter, G.; Marth, G.T.; Sherry, S.T.; et al. The variant call format and VCFtools. Bioinformatics 2011, 27, 2156–2158. [Google Scholar] [CrossRef] [PubMed]
- Wickham, H. ggplot2: Elegant Graphics for Data Analysis; Springer: New York, NY, USA, 2009. [Google Scholar]
- Zheng, X.; Levine, D.; Shen, J.; Gogarten, S.M.; Laurie, C.; Weir, B.S. A high-performance computing toolset for relatedness and principal component analysis of SNP data. Bioinformatics 2012, 28, 3326–3328. [Google Scholar] [CrossRef] [PubMed]
- Alexander, D.H.; Novembre, J.; Lange, K. Fast model-based estimation of ancestry in unrelated individuals. Genome Res. 2009, 19, 1655–1664. [Google Scholar] [CrossRef] [PubMed]
- Raj, A.; Stephens, M.; Pritchard, J.K. fastSTRUCTURE: Variational inference of population structure in large SNP data sets. Genetics 2014, 197, 573–589. [Google Scholar] [CrossRef] [PubMed]
- Stamatakis, A. RAxML Version 8: A tool for phylogenetic analysis and post-analysis of large phylogenies. Bioinformatics 2014, 30, 1312–1313. [Google Scholar] [CrossRef] [PubMed]
- Tamura, K.; Peterson, D.; Peterson, N.; Stecher, G.; Nei, M.; Kumar, S. MEGA5: Molecular evolutionary genetics analysis using maximum likelihood, evolutionary distance, and maximum parsimony methods. Mol. Biol. Evol. 2011, 28, 2731–2739. [Google Scholar] [CrossRef] [PubMed]
- Huson, D.H.; Richter, D.C.; Rausch, C.; Dezulian, T.; Franz, M.; Rupp, R. Dendroscope: An interactive viewer for large phylogenetic trees. BMC Bioinform. 2007, 8, 460. [Google Scholar] [CrossRef] [PubMed]
- Weir, B.S.; Cockerham, C.C. Estimating F-Statistics for the Analysis of Population Structure. Evolution 1984, 38, 1358–1370. [Google Scholar] [PubMed]
- Nei, M.; Li, W.H. Mathematical model for studying genetic variation in terms of restriction endonucleases. Proc. Natl. Acad. Sci. USA 1979, 76, 5269–5273. [Google Scholar] [CrossRef] [PubMed]
- Ingram, A.L.; Doyle, J.J. The origin and evolution of Eragrostis tef (Poaceae) and related polyploids: Evidence from nuclear waxy and plastid rps16. Am. J. Bot. 2003, 90, 116–122. [Google Scholar] [CrossRef] [PubMed]
- Wang, Y.; Ning, Z.; Hu, Y.; Chen, J.; Zhao, R.; Chen, H.; Ai, N.; Guo, W.; Zhang, T. Molecular mapping of restriction-site associated DNA markers in Allotetraploid Upland Cotton. PLoS ONE 2015, 10, e0124781. [Google Scholar] [CrossRef] [PubMed]
- Arai-Kichise, Y.; Shiwa, Y.; Nagasaki, H.; Ebana, K.; Yoshikawa, H.; Yano, M.; Wakasa, K. Discovery of genome-wide DNA polymorphisms in a landrace cultivar of Japonica rice by whole-genome sequencing. Plant Cell Physiol. 2011, 52, 274–282. [Google Scholar] [CrossRef] [PubMed]
- Yamamoto, T.; Nagasaki, H.; Yonemaru, J.; Ebana, K.; Nakajima, M.; Shibaya, T.; Yano, M. Fine definition of the pedigree haplotypes of closely related rice cultivars by means of genome-wide discovery of single-nucleotide polymorphisms. BMC Genom. 2010, 11, 267. [Google Scholar] [CrossRef] [PubMed]
- Lai, K.; Lorenc, M.T.; Lee, H.C.; Berkman, P.J.; Bayer, P.E.; Visendi, P.; Ruperao, P.; Fitzgerald, T.L.; Zander, M.; Chan, C.K.; et al. Identification and characterization of more than 4 million intervarietal SNPs across the group 7 chromosomes of bread wheat. Plant Biotechnol. J. 2015, 13, 97–104. [Google Scholar] [CrossRef] [PubMed]
- Hao, D.; Chao, M.; Yin, Z.; Yu, D. Genome-wide association analysis detecting significant single nucleotide polymorphisms for chlorophyll and chlorophyll fluorescence parameters in soybean (Glycine max) landraces. Euphytica 2012, 186, 919–931. [Google Scholar] [CrossRef]
- Yadav, C.B.; Bhareti, P.; Muthamilarasan, M.; Mukherjee, M.; Khan, Y.; Rathi, P.; Prasad, M. Genome-wide SNP identification and characterization in two soybean cultivars with contrasting Mungbean Yellow Mosaic India Virus disease resistance traits. PLoS ONE 2015, 10, e0123897. [Google Scholar] [CrossRef] [PubMed]
- Lee, J.; Izzah, N.K.; Jayakodi, M.; Perumal, S.; Joh, H.J.; Lee, H.J.; Lee, S.C.; Park, J.Y.; Yang, K.W.; Nou, I.S.; et al. Genome-wide SNP identification and QTL mapping for black rot resistance in cabbage. BMC Plant Biol. 2015, 15, 32. [Google Scholar] [CrossRef] [PubMed]
- Kujur, A.; Upadhyaya, H.D.; Shree, T.; Bajaj, D.; Das, S.; Saxena, M.S.; Badoni, S.; Kumar, V.; Tripathi, S.; Gowda, C.L.; et al. Ultra-high density intra-specific genetic linkage maps accelerate identification of functionally relevant molecular tags governing important agronomic traits in chickpea. Sci. Rep. 2015, 5, 9468. [Google Scholar] [CrossRef] [PubMed] [Green Version]
- Ingram, A.; Doyle, J. Eragrostis (Poaceae): Monophyly and infrageneric classification. J. Syst. Evolut. Bot. 2007, 23. [Google Scholar] [CrossRef]
- Buckler, E.S.T.; Thornsberry, J.M.; Kresovich, S. Molecular diversity, structure and domestication of grasses. Genet. Res. 2001, 77, 213–218. [Google Scholar] [CrossRef] [PubMed]
- Berhe, T.; Nelson, L.A.; Morris, M.R.; Schmidt, J.W. The genetics of qualitative traits in tef. In Proceedings of the International Workshop on Tef Genetics and Improvement, Debre Zeit, Ethiopia, 16–19 October 2000; pp. 79–85. [Google Scholar]
- Assefa, K.; Yu, J.K.; Zeid, M.; Belay, G.; Tefera, H.; Sorrells, M.E. Breeding tef [Eragrostis tef (Zucc.) trotter]: Conventional and molecular approaches. Plant Breed. 2011, 130, 1–9. [Google Scholar] [CrossRef]
- Smith, S.M.; Yuan, Y.; Doust, A.N.; Bennetzen, J.L. Haplotype analysis and linkage disequilibrium at five loci in Eragrostis tef. G3 2012, 2, 407–419. [Google Scholar] [CrossRef] [PubMed]
- Cao, K.; Zheng, Z.; Wang, L.; Liu, X.; Zhu, G.; Fang, W.; Cheng, S.; Zeng, P.; Chen, C.; Wang, X.; et al. Comparative population genomics reveals the domestication history of the peach, Prunus persica, and human influences on perennial fruit crops. Genome Biol. 2014, 15, 415. [Google Scholar] [CrossRef] [PubMed]
- Liu, A.; Burke, J.M. Patterns of nucleotide diversity in wild and cultivated sunflower. Genetics 2006, 173, 321–330. [Google Scholar] [CrossRef] [PubMed]
- Hanson, M.A.; Gaut, B.S.; Stec, A.O.; Fuerstenberg, S.I.; Goodman, M.M.; Coe, E.H.; Doebley, J.F. Evolution of anthocyanin biosynthesis in maize kernels: The role of regulatory and enzymatic loci. Genetics 1996, 143, 1395–1407. [Google Scholar] [PubMed]
- Tanksley, S.D.; McCouch, S.R. Seed banks and molecular maps: Unlocking genetic potential from the wild. Science 1997, 277, 1063–1066. [Google Scholar] [CrossRef] [PubMed]
- Tenaillon, M.I.; U’Ren, J.; Tenaillon, O.; Gaut, B.S. Selection versus demography: A multilocus investigation of the domestication process in maize. Mol. Biol. Evol. 2004, 21, 1214–1225. [Google Scholar] [CrossRef] [PubMed]
- Willing, E.M.; Hoffmann, M.; Klein, J.D.; Weigel, D.; Dreyer, C. Paired-end RAD-seq for de novo assembly and marker design without available reference. Bioinformatics 2011, 27, 2187–2193. [Google Scholar] [CrossRef] [PubMed]
- Wright, S. The genetical structure of populations. Ann. Eugen. 1951, 15, 323–354. [Google Scholar] [CrossRef] [PubMed]
- Yu, J.K.; Kantety, R.V.; Graznak, E.; Benscher, D.; Tefera, H.; Sorrells, M.E. A genetic linkage map for tef [Eragrostis tef (Zucc.) Trotter]. Theor. Appl. Genet. 2006, 113, 1093–1102. [Google Scholar] [CrossRef] [PubMed]
- Doolittle, W.F.; Logsdon, J.M., Jr. Archaeal genomics: Do archaea have a mixed heritage? Curr. Biol. 1998, 8, R209–R211. [Google Scholar] [CrossRef]
- Huynen, M.A.; Bork, P. Measuring genome evolution. Proc. Natl. Acad. Sci. USA 1998, 95, 5849–5856. [Google Scholar] [CrossRef] [PubMed]
- Snel, B.; Bork, P.; Huynen, M.A. Genome phylogeny based on gene content. Nat. Genet. 1999, 21, 108–110. [Google Scholar] [CrossRef] [PubMed]
- Foster, J.T.; Beckstrom-Sternberg, S.M.; Pearson, T.; Beckstrom-Sternberg, J.S.; Chain, P.S.; Roberto, F.F.; Hnath, J.; Brettin, T.; Keim, P. Whole-genome-based phylogeny and divergence of the genus Brucella. J. Bacteriol. 2009, 191, 2864–2870. [Google Scholar] [CrossRef] [PubMed]
- Bekele, E.; Lester, R.N. Biochemical Assessment of the Relationships of Eragrostis tef (Zucc.) Trotter with some Wild Eragrostis Species (Gramineae). Ann. Bot. 1981, 48, 717–725. [Google Scholar] [CrossRef]
- Costanza, S.H.; deWet, J.M.J.; Harlan, J.R. Literature review and numerical taxonomy of Eragrostis tef (T’ef). Econ. Bot. 1979, 33, 413–424. [Google Scholar] [CrossRef]
- Jones, B.M.G.; Ponti, J.; Tavassoli, A.; Dixon, P.A. Relationships of the Ethiopian Cereal T′ef (Eragrostis tef (Zucc.) Trotter): Evidence from morphology and chromosome number. Ann. Bot. 1978, 42, 1369–1373. [Google Scholar] [CrossRef]
- Prescott-Allen, R.; Prescott-Allen, C. Using Wild Genetic Resources for Food and Raw Materials; Earthscan Publications: London, UK, 1988. [Google Scholar]
- Hajjar, R.; Hodgkin, T. The use of wild relatives in crop improvement: A survey of developments over the last 20 years. Euphytica 2007, 156, 1–13. [Google Scholar] [CrossRef]
- Dempewolf, H.; Eastwood, R.J.; Guarino, L.; Khoury, C.K.; Müller, J.V.; Toll, J. Adapting agriculture to climate change: A global initiative to collect, conserve, and use crop wild relatives. Agroecol. Sustain. Food Syst. 2014, 38, 369–377. [Google Scholar] [CrossRef]
- Berhe, T. A break-through in tef breeding techniques. FAO Int. Bull. Cereal Improv. Prod. 1975, 12, 11–13. [Google Scholar]
- Zhang, D.; Ayele, M.; Tefera, H.; Nguyen, H.T. RFLP linkage map of the Ethiopian cereal tef [Eragrostis tef (Zucc) Trotter]. Theor. Appl. Genet. 2001, 102, 957–964. [Google Scholar] [CrossRef]
- Gottlieb, L.D. Plant polyploidy: Gene expression and genetic redundancy. Heredity 2003, 91, 91–92. [Google Scholar] [CrossRef] [PubMed]
- Ranwez, V.; Holtz, Y.; Sarah, G.; Ardisson, M.; Santoni, S.; Glémin, S.; Tavaud-Pirra, M.; David, J. Disentangling homeologous contigs in allo-tetraploid assembly: Application to durum wheat. BMC Bioinform. 2013, 14, S15–S11. [Google Scholar] [CrossRef] [PubMed]
- Tennessen, J.A.; Govindarajulu, R.; Ashman, T.-L.; Liston, A. Evolutionary origins and dynamics of octoploid strawberry subgenomes revealed by dense targeted capture linkage maps. Genome Biol. Evolut. 2014, 6, 3295–3313. [Google Scholar] [CrossRef] [PubMed]
Figure 1.
Distribution of single nucleotide polymorphisms (SNPs) by pseudo-chromosome. The number of SNPs (y-axis) is plotted by nucleotide position on each of the 10 tef pseudomolecules (x-axis). Each graph was generated using SNP data from an individual pseudomolecule. The number above each graph indicates the pseudomolecule.


Figure 2.
Principal component analysis (PCA) plots of the first two eigenvectors for the Eragrostis species SNP dataset. Each point represents a germplasm; some points overlap. The tef cultivars, all improved varieties, and the mutant line are genetically close and were grouped together (circled in red). The mutant line (indicated by green point) cannot be shown on the figure as it is overlapping with the tef cultivars. The wild Eragrostis species are dispersed without apparent structure. However, three species in the bottom right corner and five species in the top corner are grouped together.

Figure 3.
The population structure of Eragrostis species in the panel. (Top) Structure plot generated using the parameter estimates computed by the ADMIXTURE program at K = 2. (Bottom) Structure plot generated using the posterior mean of admixture proportions estimated by the fastStructure algorithms. Each vertical bar represents one germplasm, while each color represents the inferred ancestral population based on K clusters (in this case K = 2). For each germplasm, columns fully colored with only one color represent genetic homogeneity, while columns with mixed colors illustrate admixture.

Figure 4.
Maximum likelihood phylogenetic tree for species of the genus Eragrostis. The evolutionary history was inferred by using the maximum likelihood method based on the Tamura-Nei model in molecular evolutionary genetics analysis using maximum likelihood, evolutionary distance, and maximum parsimony methods (MEGA). The tree with the highest log likelihood is shown. Bootstrap values are shown above the branches. The tree is drawn to scale, with branch lengths measured in the number of substitutions per site. The analysis involved 79 nucleotide sequences. Codon positions included were 1st+2nd+3rd+Noncoding. All positions containing gaps and missing data were eliminated. The six wild Eragrostis species within the tef clade are noted by a red point.

Figure 5.
Phylogenetic tree constructed from partial sequences of the waxy gene obtained from the National Center for Biotechnology Information (shown in black) and cloning new sequences (shown in red). For the red sequences, the first marker indicates the band on the gel, either “low” or “up”, and the second number indicates the number of the clone. E. aethiopica had only one band and is only labeled for the clone number. The maximum likelihood tree was inferred using PhyML and the default model of HKY85 + G. The scale bar reflects evolutionary distance, measured in units of substitution per nucleotide site. Branch support was inferred using 100 rounds of bootstrapping; values are indicated. The length of the sorghum branch was shortened for visualization purposes; the branch length is 0.5354. The letters denote the subgenomes as labeled by Ingram.
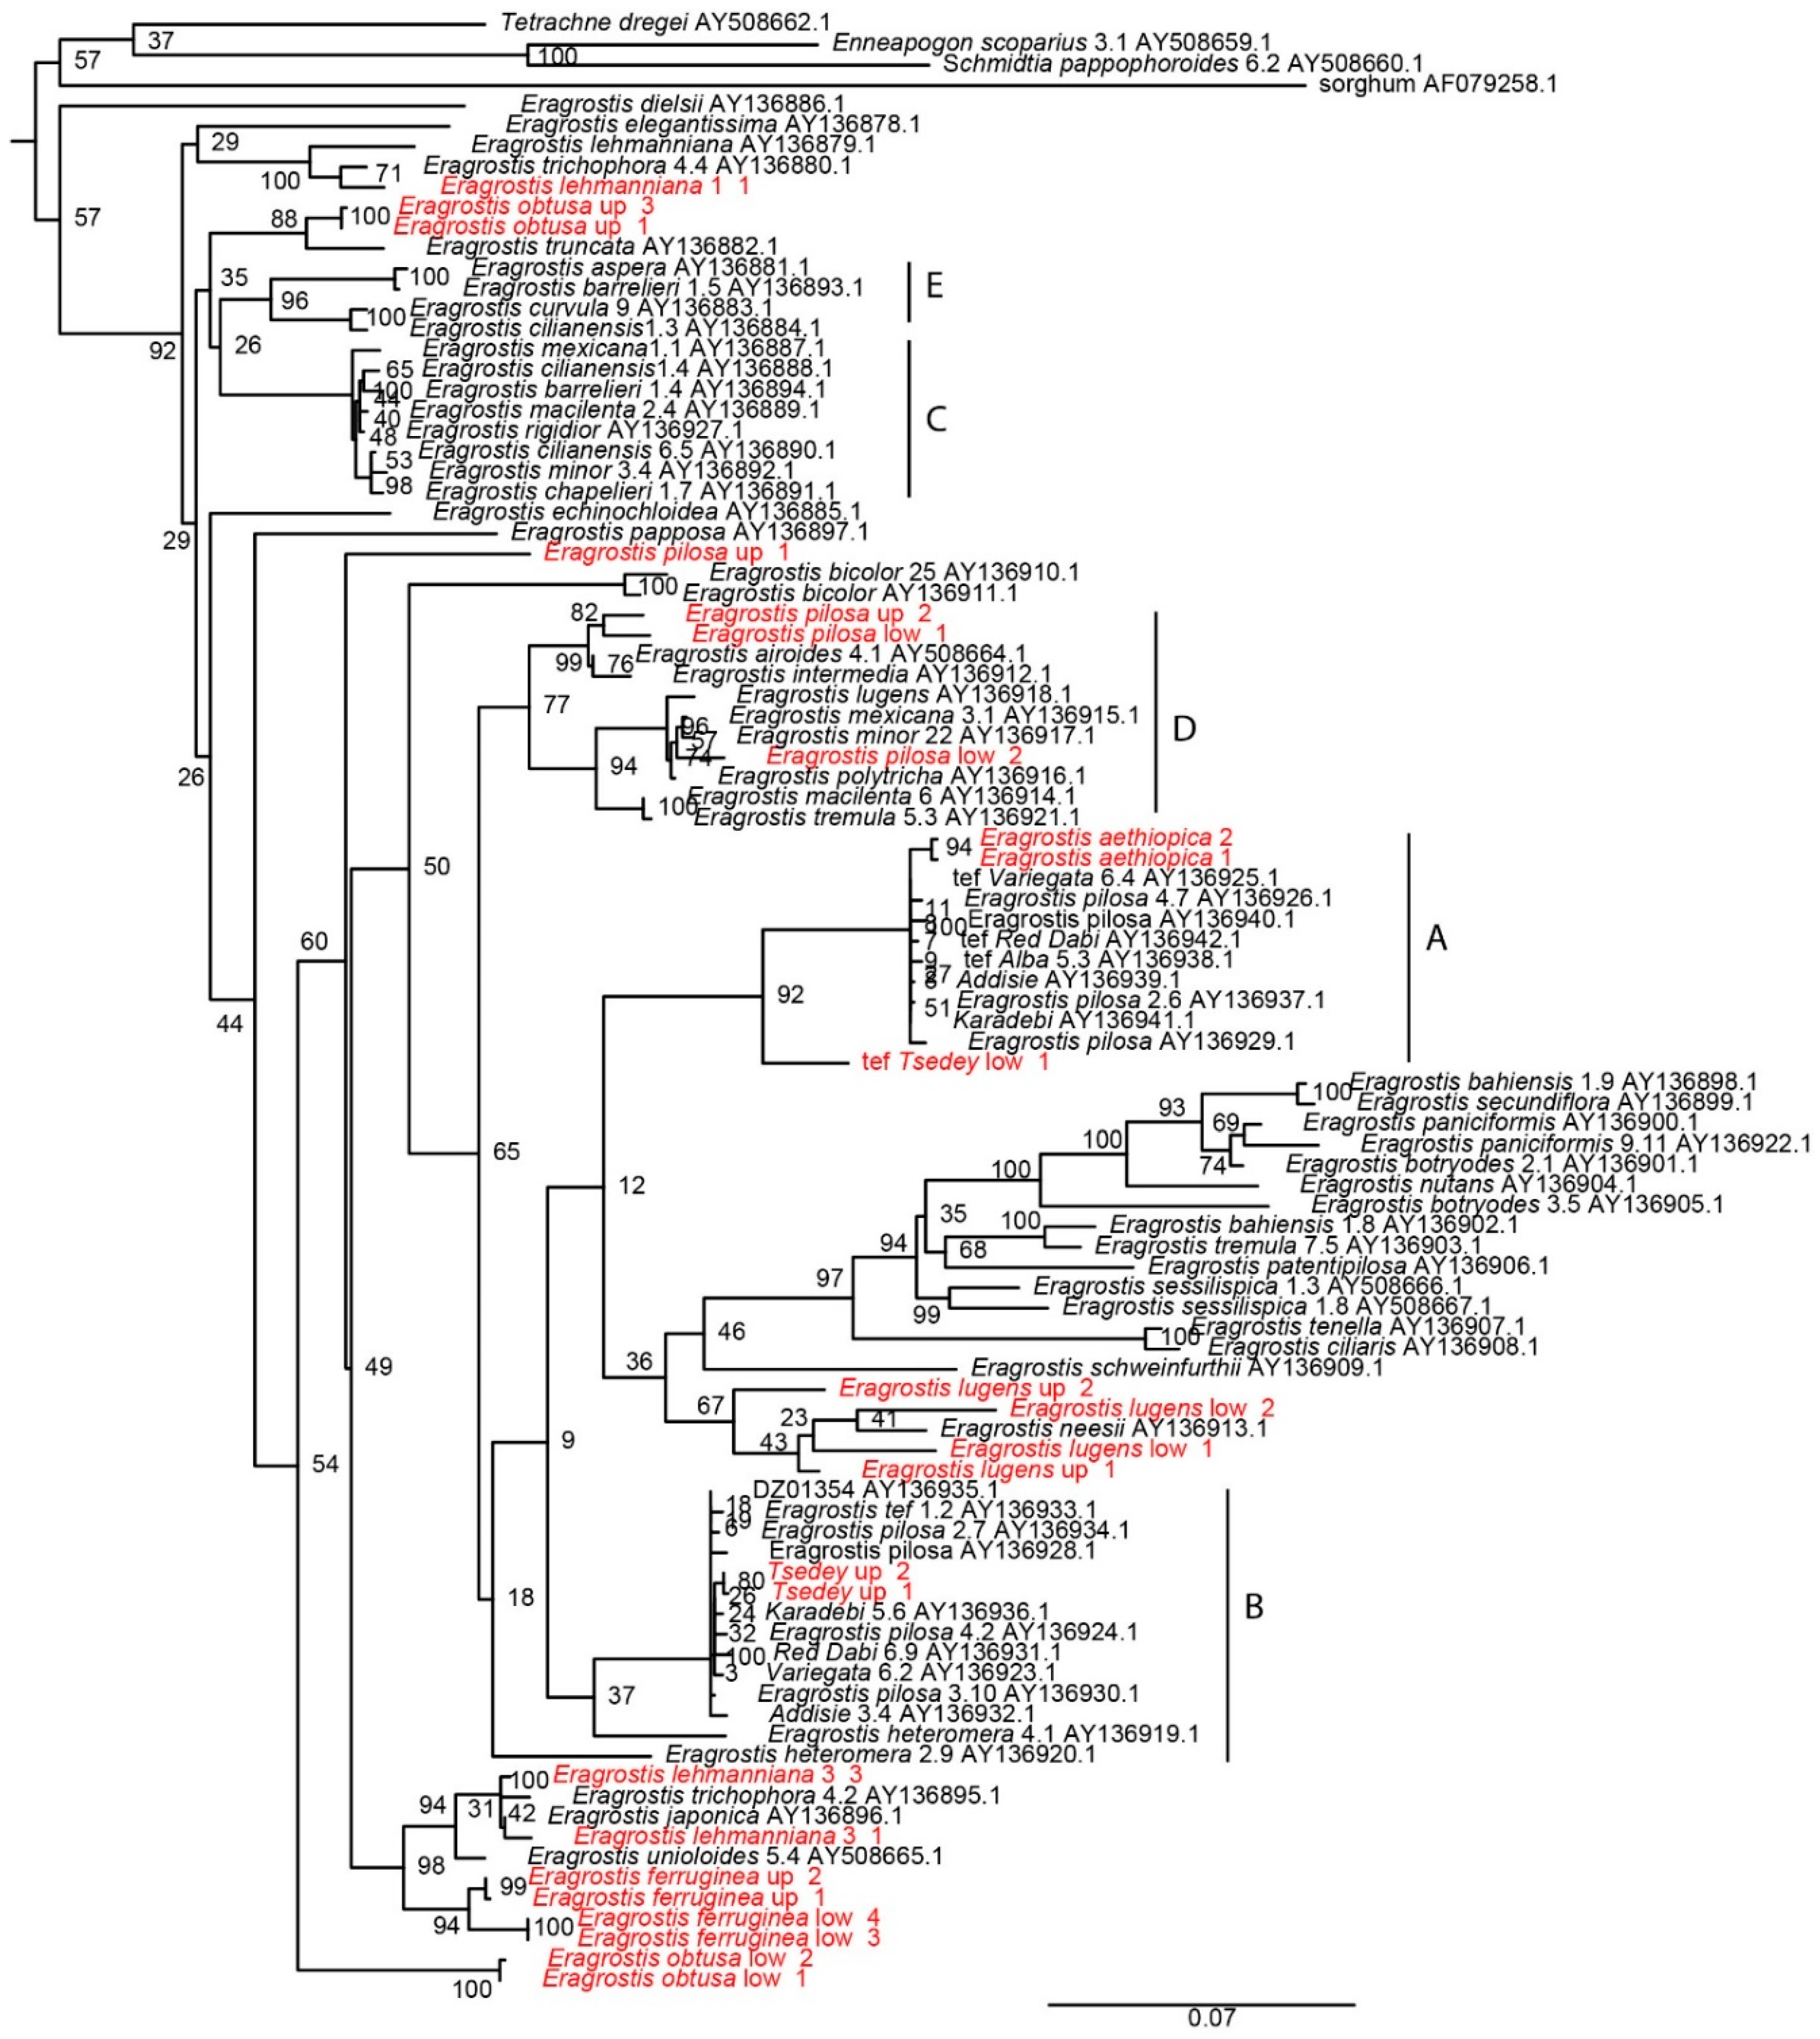
Figure 6.
Hypothetical pathway for the evolution of the allotetraploid tef genome. (A) Two diploid progenitors (still elusive) hybridized to generate the tetraploid tef. (B) Two diploid progenitors hybridized to generate the intermediate tetraploid progenitor through genome duplication by hybridization. In this hypothesis, tef is suggested to be a shattering domesticate of this intermediate progenitor, with several studies pointing to E. pilosa. Whether the evolution of the cultivated tef genome followed the A or B route in this pathway, knowing the identities of the two diploid progenitors could be central to the future of tef genomics research, and comparative genomics will be the key. The symbol “?” indicates what is not known or suggested so far.

Table 1.
Studies on the evolution and phylogenetic relationships between tef and the wild Eragrostis species. E. pilosa (1) and E. aethiopica (2) stand out as the two most consistent species identified as close relatives of tef. Of the five studies listed, only the last two studies used molecular data.
| Reference | [73] | [72] | [71] | [45] | This Study |
|---|---|---|---|---|---|
| Method | Morphological and cytological analysis | Morphometric analysis | Biochemical analysis | Nuclear gene waxy Platid rps16 loci | GBS |
| Suggested ancestor(s) of tef | E. aethiopica 2 | E. aethiopica 2 | E. aethiopica 2 | E. pilosa 1 | E. aethiopica 2 |
| E. pilosa 1 | E. pilosa 1 | E. pilosa 1 | E. longifolia | E. pilosa 1 | |
| E. bicolor | E. macilenta | E. barrelieri | E. lehmanniana | ||
| E. cilianensis | E. bicolor | E. lugens | |||
| E. heteromera | E. cilianensis | E. obtusa | |||
| E. mexicana | E. curvula | E. ferruginea | |||
| E. minor | E. diploachnoides | ||||
| E. papposa | E. heteromera | ||||
| E. barrelieri | E. mexicana | ||||
| E. minor | |||||
| E. papposa | |||||
| E. viscosa |
© 2018 by the authors. Licensee MDPI, Basel, Switzerland. This article is an open access article distributed under the terms and conditions of the Creative Commons Attribution (CC BY) license (http://creativecommons.org/licenses/by/4.0/).
Share and Cite
MDPI and ACS Style
Girma, D.; Cannarozzi, G.; Weichert, A.; Tadele, Z. Genotyping by Sequencing Reasserts the Close Relationship between Tef and Its Putative Wild Eragrostis Progenitors. Diversity 2018, 10, 17. https://doi.org/10.3390/d10020017
AMA Style
Girma D, Cannarozzi G, Weichert A, Tadele Z. Genotyping by Sequencing Reasserts the Close Relationship between Tef and Its Putative Wild Eragrostis Progenitors. Diversity. 2018; 10(2):17. https://doi.org/10.3390/d10020017
Chicago/Turabian StyleGirma, Dejene, Gina Cannarozzi, Annett Weichert, and Zerihun Tadele. 2018. "Genotyping by Sequencing Reasserts the Close Relationship between Tef and Its Putative Wild Eragrostis Progenitors" Diversity 10, no. 2: 17. https://doi.org/10.3390/d10020017
Note that from the first issue of 2016, this journal uses article numbers instead of page numbers. See further details here.