Polymorphisms within the Toll-Like Receptor (TLR)-2, -4, and -6 Genes in Cattle

Abstract
:1. Introduction
Materials and Methods
Samples:
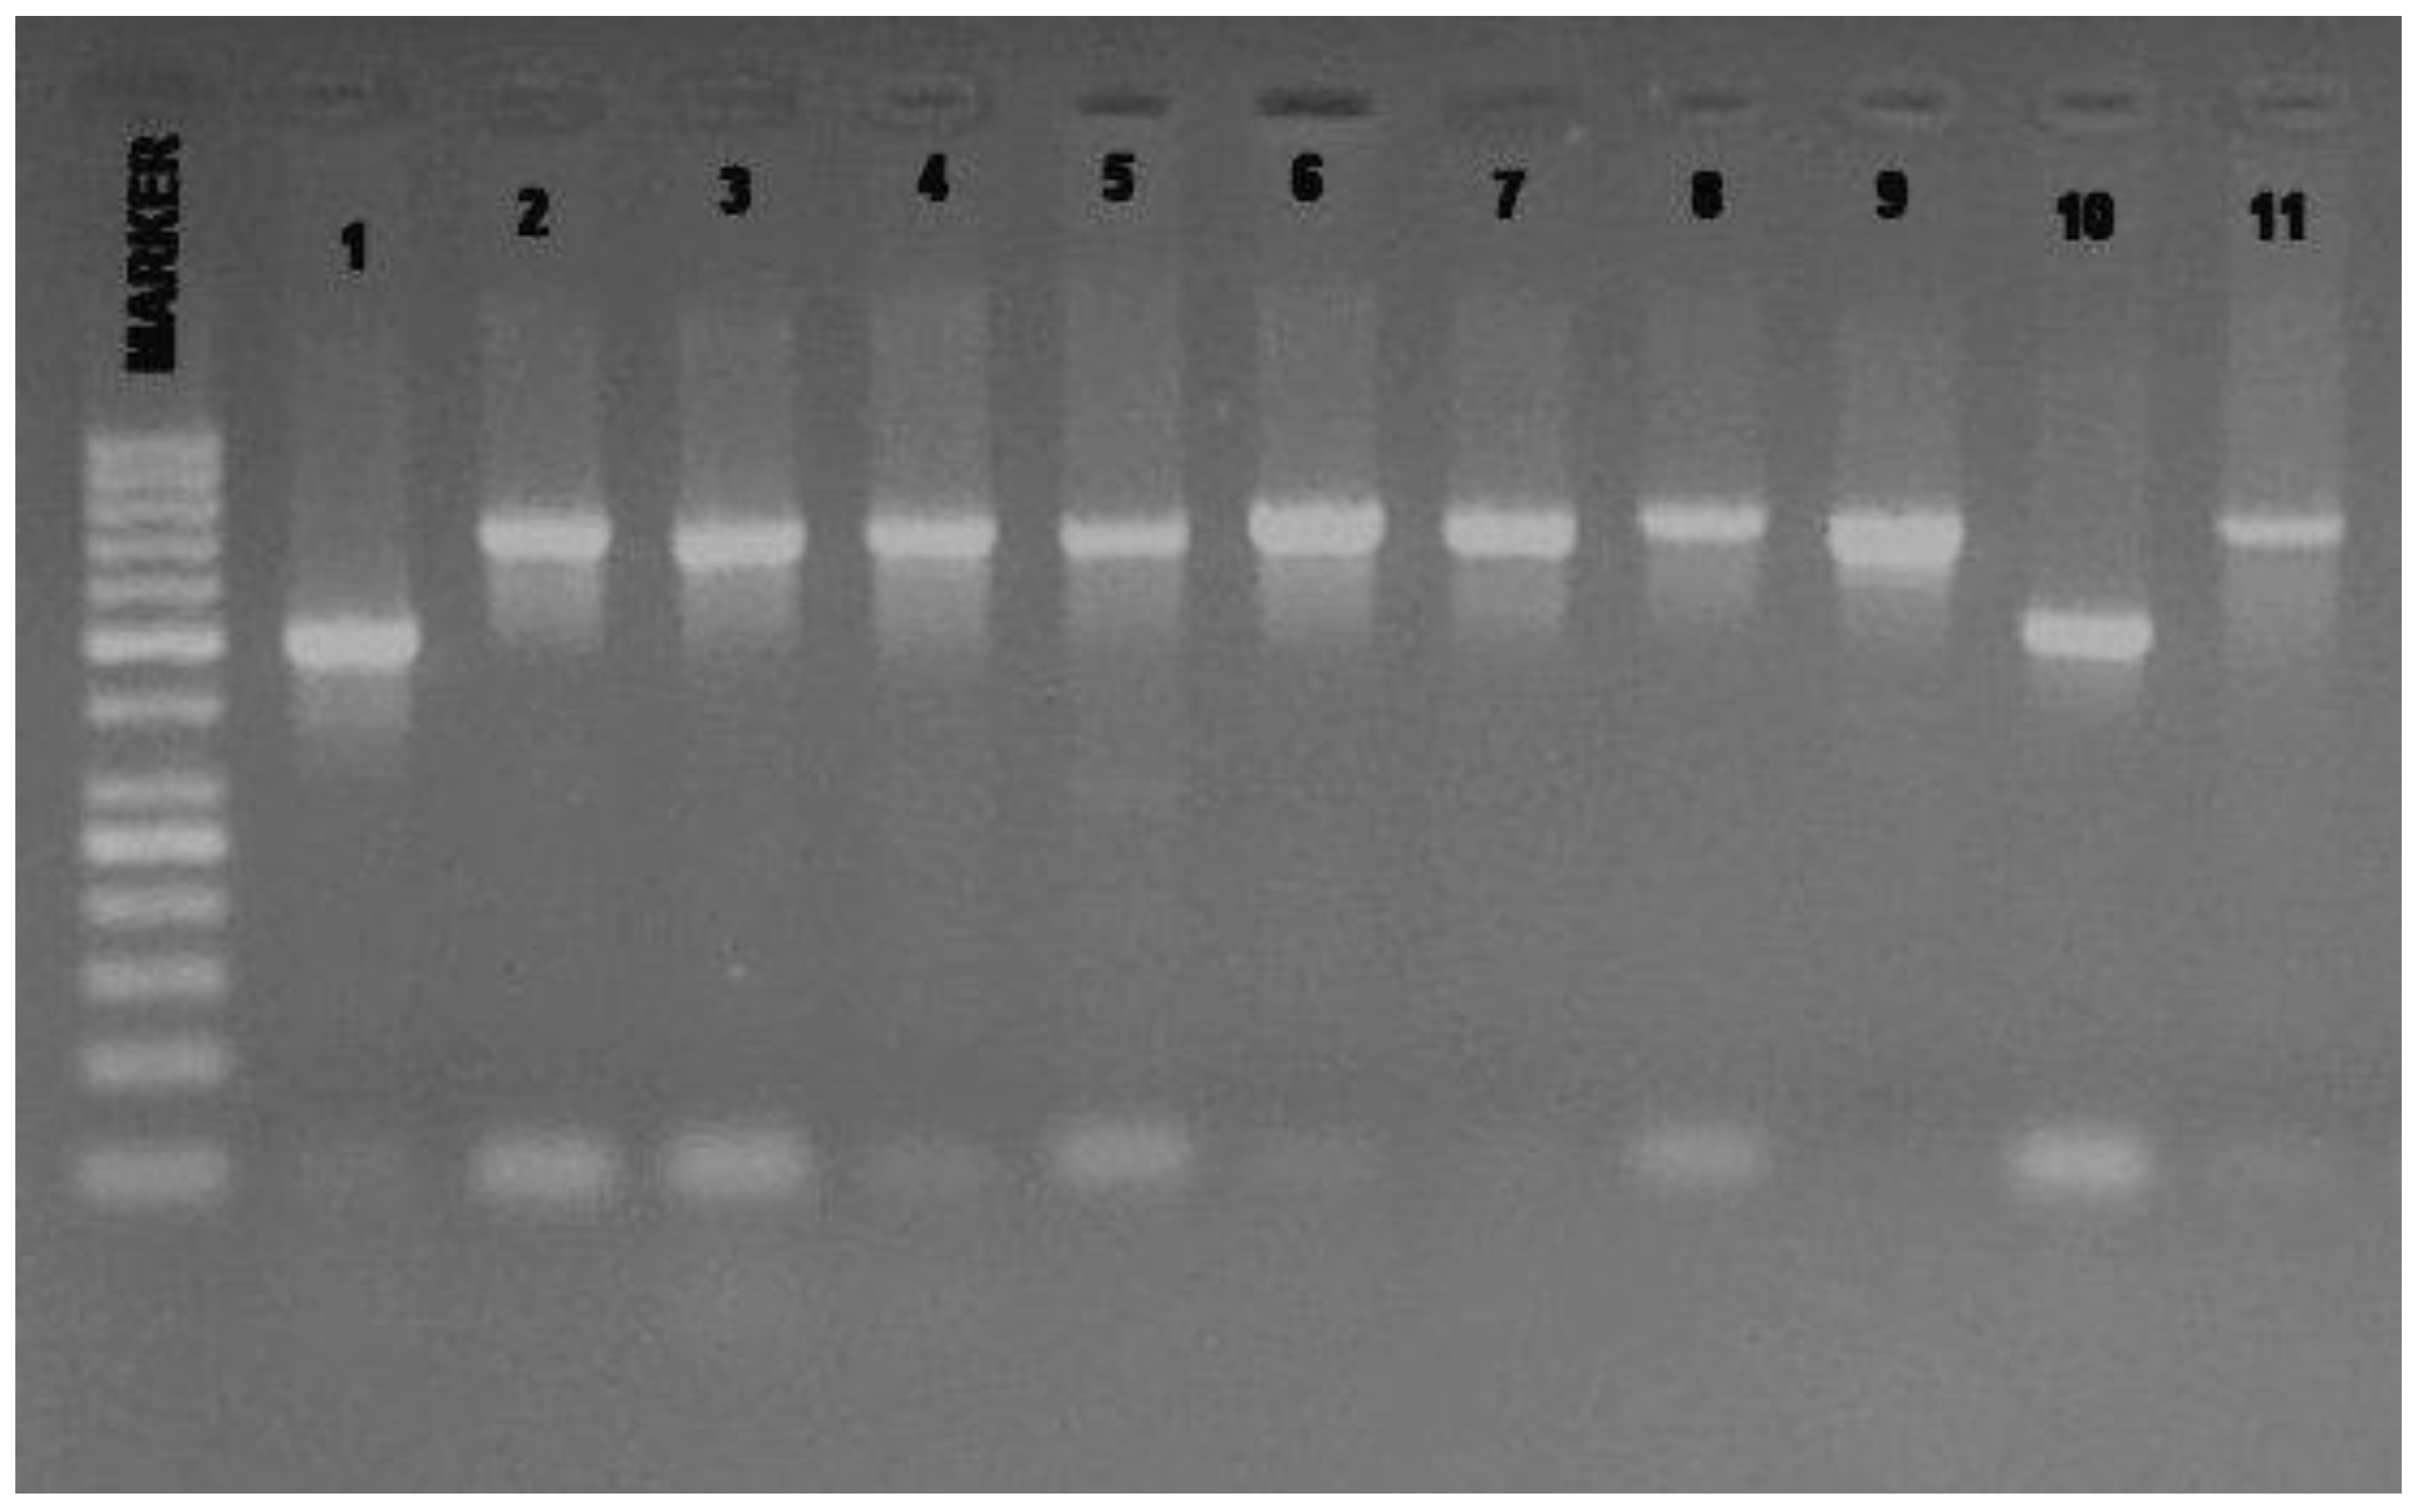
Polymerase Chain Reaction (PCR) Conditions:
Sequence analysis:
Data analysis:

| Locus | Sequence (5’→3’) | T.A. (°C) | Amplicon size (bp) | Amplicon position | Genbank Accession # |
|---|---|---|---|---|---|
| TLR2 | Fw: CTGTCCAACAATGAGATCACCT Rw: AATTCTGTCCAAACTCAGTGCT | 49 | 735 | 311-1045 | AY634629 |
| TLR2 | Fw: GTTCAGGTCCCTTTATGTCTTG Rw: ATGGGTACAGTCATCAAACTCT | 47 | 509 | 493-1003 | AY634629 |
| TLR2 | Fw: ACTACCGCTGTGACTCTCCCTC Rw: GACCACCACCAGACCAAGACT | 55 | 711 | 1818-2530 | AY634629 |
| TLR2 | Fw: CTCCCTTTCTGAATGCCACA Rw: AAAGTATTGGAGCTTCAGCA | 47 | 754 | 1876-2631 | AY634629 |
| TLR4 | Fw: GTGTGGAGACCTAGATGACTGG Rw: GTACGCTATCCGGAATTGTTCA | 50 | 705 | 7938-8644 | DQ839567 |
| TLR4 | Fw: CTACCAAGCCTTCAGTATCTAG Rw: GGCATGTCCTCCATATCTAAAG | 47 | 741 | 8880-9623 | DQ839567 |
| TLR4 | Fw: TCAGGAACGCCACTTGTCAGCT Rw: TGAACACGCCCTGCATCCATCT | 55 | 710 | 9635-10346 | DQ839567 |
| TLR6 | Fw: AAAGAATCTCCCATCAGAAGCT Rw: GAAGGATACAACTTAGGTGCAA | 46 | 515 | 228-745 | AJ618974 |
| TLR6 | Fw: CTGCCCATCTGTAAGGAATTTG Rw: GATAAGTGTCTCCAATCTAGCT | 47 | 739 | 624-1382 | AJ618974 |
| TLR6 | Fw: TTGGAAACACTGGATGTTAGCT Rw: ACTGGAGAGTTCTTTGGAGTTC | 49 | 710 | 1428-2138 | AJ618974 |
| TLR6 | Fw: CTGCCTGGGTGAAGAATGAATT Rw: TGTAGTTGCACTTCCGGGCT | 50 | 715 | 2173-2888 | AJ618974 |
2. Results and Discussion
| SNPs | Position in GeneBank sequence1 | aa change | Position in the protein2 | SNP ID number |
|---|---|---|---|---|
| TLR2_591G>A | 591 | non - coding | ss107911951 | |
| TLR2_738A>G | 738 | non - coding | ss107911952 | |
| TLR2_767G>A* | 767 | non - coding | ss107911953 | |
| TLR4_254G>A | 254 | non - coding | ss107911954 | |
| TLR4_1678C>T | 1678 | Synonymous (Ser) | 552: LRR domain | ss107911955 |
| TLR4_2043T>C | 2043 | non - coding | ss107911956 | |
| TLR6_855G>A* | 855 | Asp/Asn | 214 | ss107911957 |
| TLR6_2315T>C* | 2315 | Synonymous (Phe) | 315: TIR domain | ss107911958 |
| SNP | M.A.F. | He | Ho | PIC |
|---|---|---|---|---|
| TLR2_591 | 0.866 | 0..33 | 0.205 | 0.206 |
| TLR2_738 | 0.969 | 0.060 | 0.051 | 0.058 |
| TLR2_767 | 0.557 | 0.493 | 0.461 | 0.372 |
| TLR4_254 | 0.595 | 0.482 | 0.466 | 0.366 |
| TLR4_1678 | 0.655 | 0.452 | 0.421 | 0.350 |
| TLR4_2043 | 0.843 | 0.264 | 0.234 | 0.230 |
| TLR6_855 | 0.608 | 0.477 | 0.444 | 0.363 |
| TLR6_2315 | 0.688 | 0.429 | 0.425 | 0.337 |
| SNP | TLR2_591 | TLR2_738 | TLR2_767 | TLR4_254 | TLR4_1678 | TLR4_2043 | TLR6_855 | TLR6_2315 | ||||||||
|---|---|---|---|---|---|---|---|---|---|---|---|---|---|---|---|---|
| ALLELE | A | G | A | G | A | G | A | G | C | T | C | T | A | G | C | T |
| A. Angus | 0.011 | 0.989 | 0.012 | 0.988 | 0.693 | 0.307 | 0.837 | 0.163 | 0.683 | 0.317 | 0.989 | 0.011 | 0.581 | 0.419 | 0.349 | 0.651 |
| A. Valles | 0.086 | 0.914 | 0.016 | 0.984 | 0.548 | 0.452 | 0.581 | 0.419 | 0.635 | 0.365 | 0.898 | 0.102 | 0.373 | 0.627 | 0.234 | 0.766 |
| Avilena | 0.250 | 0.750 | 0.031 | 0.969 | 0.317 | 0.683 | 0.712 | 0.288 | 0.533 | 0.467 | 0.913 | 0.087 | 0.437 | 0.563 | 0.353 | 0.647 |
| Casina | 0.327 | 0.673 | 0.152 | 0.848 | 0.432 | 0.568 | 0.538 | 0.462 | 0.649 | 0.351 | 0.848 | 0.152 | 0.302 | 0.698 | 0.196 | 0.804 |
| Charolais | 0.114 | 0.886 | 0.044 | 0.956 | 0.487 | 0.513 | 0.545 | 0.455 | 0.671 | 0.329 | 0.840 | 0.160 | 0.353 | 0.647 | 0.336 | 0.664 |
| Danish Red | 0.035 | 0.965 | 0.017 | 0.983 | 0.595 | 0.405 | 0.632 | 0.368 | 0.582 | 0.418 | 0.796 | 0.204 | 0.500 | 0.500 | 0.324 | 0.676 |
| Highlands | 0.011 | 0.989 | 0 | 1 | 0.932 | 0.068 | 0.415 | 0.585 | 0.564 | 0.436 | 1 | 0 | 0.260 | 0.740 | 0.239 | 0.761 |
| Holstein | 0.147 | 0.853 | 0.154 | 0.846 | 0.759 | 0.241 | 0.417 | 0.583 | 0.740 | 0.260 | 0.855 | 0.145 | 0.366 | 0.634 | 0.364 | 0.636 |
| Jersey | 0.170 | 0.830 | 0 | 1 | 0.372 | 0.628 | 0.707 | 0.293 | 0.888 | 0.112 | 0.413 | 0.587 | 0.776 | 0.224 | 0.582 | 0.418 |
| Limousine | 0.271 | 0.729 | 0 | 1 | 0.479 | 0.521 | 0.583 | 0.417 | 0.616 | 0.384 | 0.819 | 0.181 | 0.340 | 0.660 | 0.326 | 0.674 |
| Marchigiana | 0.030 | 0.970 | 0 | 1 | 0.529 | 0.471 | 0.894 | 0.106 | 0.338 | 0.662 | 0.833 | 0.167 | 0.557 | 0.443 | 0.559 | 0.441 |
| Maremmana | 0.093 | 0.907 | 0 | 1 | 0.517 | 0.483 | 0.572 | 0.428 | 0.742 | 0.258 | 0.884 | 0.116 | 0.330 | 0.670 | 0.331 | 0.669 |
| Piemontese | 0.215 | 0.785 | 0.038 | 0.962 | 0.405 | 0.595 | 0.675 | 0.325 | 0.538 | 0.462 | 0.817 | 0.183 | 0.500 | 0.500 | 0.281 | 0.719 |
| Pirenaica | 0.132 | 0.868 | 0.014 | 0.986 | 0.650 | 0.350 | 0.418 | 0.582 | 0.690 | 0.310 | 0.963 | 0.037 | 0.215 | 0.785 | 0.174 | 0.826 |
| Simmenthal | 0.096 | 0.904 | 0 | 1 | 0.717 | 0.283 | 0.522 | 0.478 | 0.591 | 0.409 | 0.875 | 0.125 | 0.519 | 0.481 | 0.395 | 0.605 |
| S. Devon | 0 | 1 | 0 | 1 | 0.838 | 0.163 | 0.638 | 0.363 | 0.907 | 0.093 | 0.643 | 0.357 | 0.116 | 0.884 | 0.085 | 0.915 |
 ) and lower (
  ) confidence limits of 95% quantiles; median (-) of 200,000 replications of expected Fst and heterozygosity using the coalescent model.
) and lower ( ) confidence limits of 95% quantiles; median (-) of 200,000 replications of expected Fst and heterozygosity using the coalescent model.
) confidence limits of 95% quantiles; median (-) of 200,000 replications of expected Fst and heterozygosity using the coalescent model.
) and lower ( ) confidence limits of 95% quantiles; median (-) of 200,000 replications of expected Fst and heterozygosity using the coalescent model.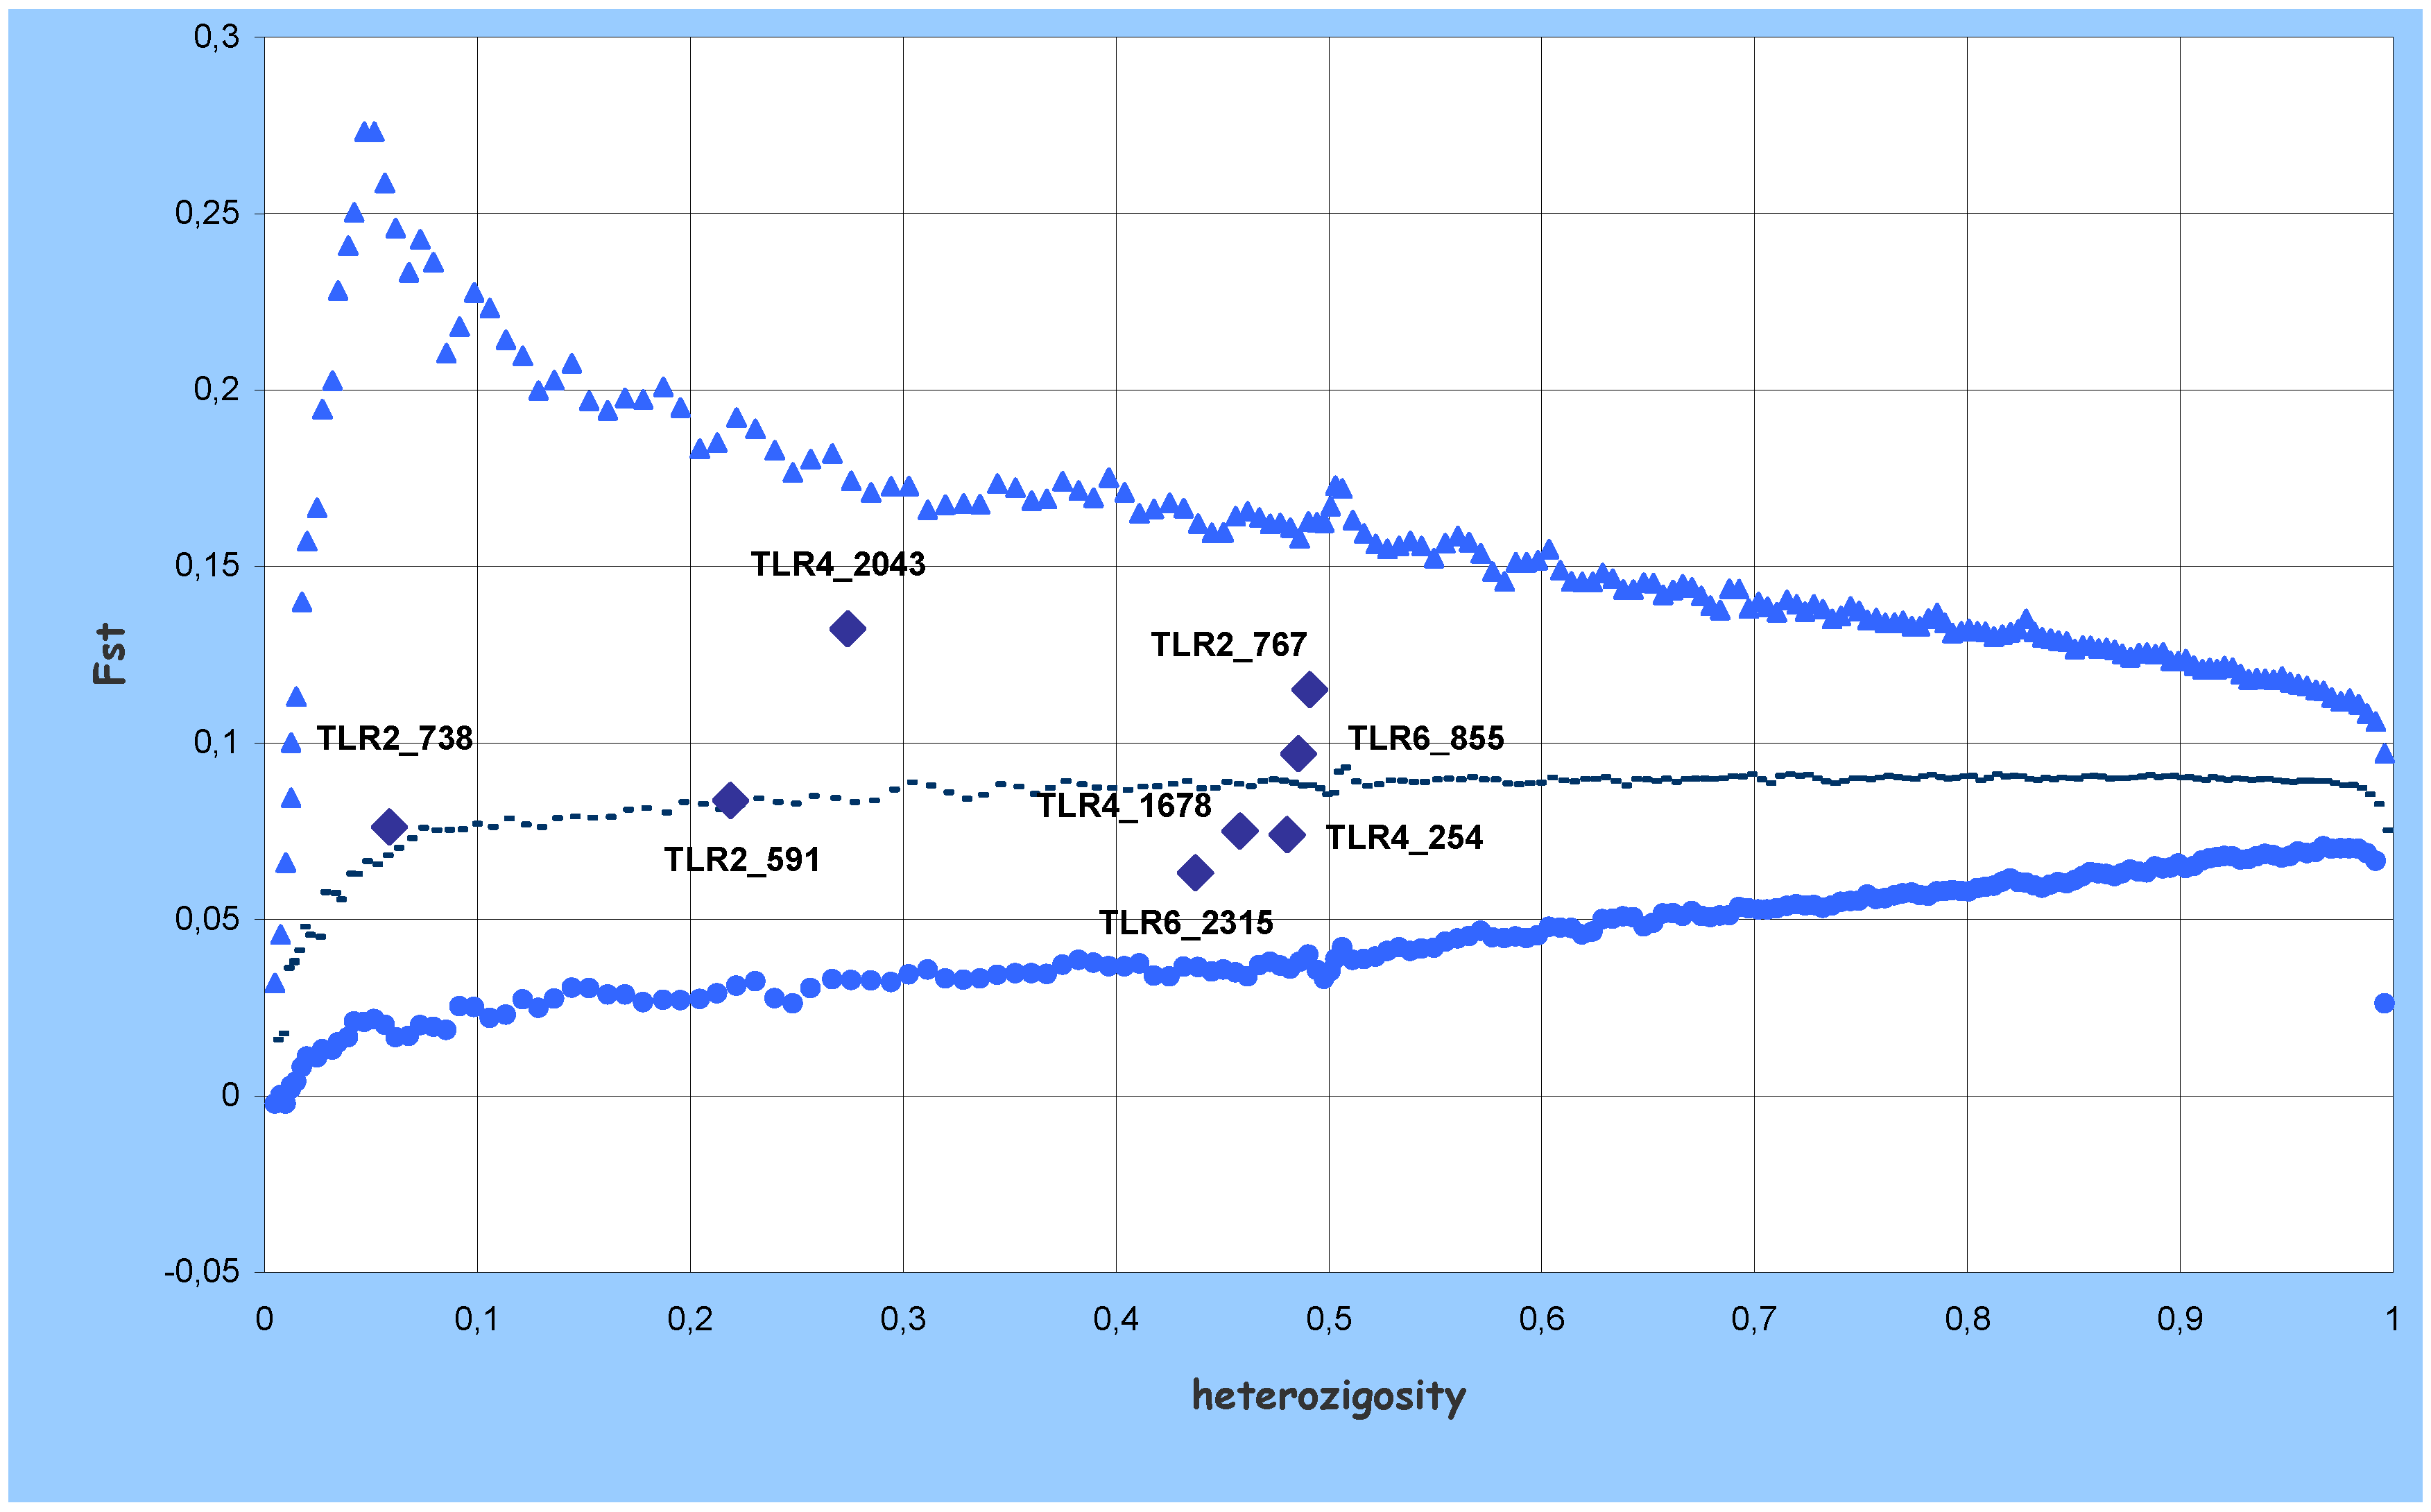
| Locus | Hw Test |
|---|---|
| TLR2_591 | 0.0007 |
| TLR2_738 | 0.0011 |
| TLR2_767 | 0.0542 |
| TLR4_254 | 0.2693 |
| TLR4_1678 | 0.0345 |
| TLR4_2043 | 0.0012 |
| TLR6_855 | 0.0303 |
| TLR6_2315 | 0.7460 |
| Geographic location of the breed | Aberdeen Angus | Asturiana de los Valles | Avilena | Casina | Charolais | Danish Red | Highlands | Holstein | Jersey | Limousin | Marchigiana | Maremmana | Piemontese | Pirenaica | Simmenthal | South Devon | |
|---|---|---|---|---|---|---|---|---|---|---|---|---|---|---|---|---|---|
| Aberdeen Angus | GB | 0 | |||||||||||||||
| Asturiana de los Valles | ES | 0.016 | 0 | ||||||||||||||
| Avilena | ES | 0.027 | 0.010 | 0 | |||||||||||||
| Casina | ES | 0.044 | 0.012 | 0.011 | 0 | ||||||||||||
| Charolais | FR | 0.023 | 0.002 | 0.008 | 0.009 | 0 | |||||||||||
| Danish Red | DK | 0.014 | 0.004 | 0.015 | 0.022 | 0.005 | 0 | ||||||||||
| Highlands | GB | 0.029 | 0.027 | 0.057 | 0.058 | 0.037 | 0.034 | 0 | |||||||||
| Holstein | DK | 0.032 | 0.013 | 0.027 | 0.014 | 0.009 | 0.015 | 0.033 | 0 | ||||||||
| Jersey | GB | 0.061 | 0.048 | 0.044 | 0.058 | 0.039 | 0.036 | 0.117 | 0.056 | 0 | |||||||
| Limousin | FR | 0.032 | 0.007 | 0.007 | 0.012 | 0.006 | 0.012 | 0.045 | 0.020 | 0.038 | 0 | ||||||
| Marchigiana | IT | 0.020 | 0.026 | 0.023 | 0.052 | 0.028 | 0.015 | 0.060 | 0.050 | 0.048 | 0.029 | 0 | |||||
| Maremmana | IT | 0.019 | 0.003 | 0.013 | 0.018 | 0.004 | 0.007 | 0.030 | 0.016 | 0.040 | 0.005 | 0.028 | 0 | ||||
| Piemontese | IT | 0.026 | 0.007 | 0.003 | 0.009 | 0.006 | 0.008 | 0.055 | 0.020 | 0.035 | 0.006 | 0.022 | 0.011 | 0 | |||
| Pirenaica | ES | 0.029 | 0.006 | 0.023 | 0.016 | 0.010 | 0.018 | 0.018 | 0.013 | 0.076 | 0.014 | 0.052 | 0.009 | 0.021 | 0 | ||
| Simmenthal | DK | 0.016 | 0.007 | 0.019 | 0.027 | 0.009 | 0.005 | 0.023 | 0.014 | 0.041 | 0.010 | 0.021 | 0.007 | 0.014 | 0.015 | 0 | |
| South Devon | GB | 0.053 | 0.035 | 0.073 | 0.060 | 0.040 | 0.037 | 0.046 | 0.044 | 0.082 | 0.049 | 0.076 | 0.033 | 0.060 | 0.035 | 0.044 | 0 |
3. Conclusions
Acknowledgements
Electronic Supplementary Information

References
- Takeda, K.; Akira, S. Roles of Toll-like receptors in innate immune responses. Genes Cells 2001, 6, 733–742. [Google Scholar] [CrossRef] [PubMed]
- Medzhitov, R.; Janeway, C.A., Jr. Innate immunity. N. Engl. J. Med. 2000, 343, 338–344. [Google Scholar] [CrossRef] [PubMed]
- Aderem, A.; Ulevitch, R.J. Toll-like receptors in the induction of the innate immune responses. Nature 2000, 406, 782–787. [Google Scholar] [CrossRef] [PubMed]
- Takeda, K.; Kaisho, T.; Akira, S. Toll-like receptors. Annu. Rev. Immunol. 2003, 21, 335–376. [Google Scholar] [CrossRef] [PubMed]
- Vasselon, T.; Detmers, P.A. Toll receptors: a central element in innate immune responses. Infec. Immunity 2002, 70, 1033–1041. [Google Scholar] [CrossRef]
- Kaisho, T.; Akira, S. Toll-like receptor function and signaling. J. Allergy Clin. Immunol. 2006, 117, 979–987. [Google Scholar] [CrossRef] [PubMed]
- Stein, D.; Roth, S.; Vogelsang, E.; Nusslein-Volhard, C. The polarity of the dorsoventral axis in the Drosophila embryo is defined by an extracellular signal. Cell 1991, 65, 725–735. [Google Scholar] [CrossRef] [PubMed]
- Lemaitre, B.; Nicolas, E.; Michaut, L.; Reichhart, J.M.; Hoffman, J.A. The dorsoventral regulatory gene cassette spatzle/Toll/cactus controls the potent antifungal response in Drosophila adults. Cell 1996, 86, 973–983. [Google Scholar] [CrossRef] [PubMed]
- Hashimoto, C.; Hudson, K.I.; Anderson, K.V. The toll gene of Drosophila, required for dorsal-ventral embryonic polarity, appears to encode a trans-membrane protein. Cell 1998, 52, 269–279. [Google Scholar] [CrossRef]
- Muzio, M.; Polentarutti, N.; Bosisio, D.; Prahladan, M.K.; Mantovani, A. Toll-like receptors: a growing family of immune receptors that are differentially expressed and regulated by different leukocytes. J. Leukocyte Biol. 2000, 67, 450–456. [Google Scholar] [PubMed]
- Jin, M.S.; Kim, S.E.; Heo, J.Y.; Lee, M.E.; Kim, H.M.; Paik, S.G.; Lee, H.; Lee, J.O. Crystal structure of the TLR1-TLR2 heterodimer induced by binding of a tri-acylated lipopeptide. Cell 2007, 130, 1071–1082. [Google Scholar] [CrossRef] [PubMed]
- Menzies, M.; Ingham, A. Identification and expression of Toll-like receptors 1-10 in selected bovine and ovine tissues. Vet. Immunol. Immunopathol. 2006, 109, 23–30. [Google Scholar] [CrossRef] [PubMed]
- De Schepper, S.; De Ketelaere, A.; Bannerman, D.D.; Paape, M.J.; Peelman, L.; Burvenich, C. The toll-like receptor-4 (TLR-4) pathway and its possible role in the pathogenesis of Escherichia coli mastitis in dairy cattle. Vet. Res. 2008, 39, 1–5. [Google Scholar] [CrossRef] [PubMed]
- Werling, D.; Jann, O.C.; Offord, V.; Glass, E.J.; Coffey, T.J. Variation matters: TLR structure and species-specific pathogen recognition. Trends Immunol. 2009, 30, 124–130. [Google Scholar] [CrossRef] [PubMed]
- Underhill, D.M.; Ozinsky, A.; Smith, K.D.; Aderem, A. Toll-like receptor-2 mediates mycobacteria-induced proinflammatory signaling in macrophages. Proc. Natl. Acad. Sci. USA 1999, 96, 14459–14463. [Google Scholar] [CrossRef] [PubMed]
- Buwitt-Beckmann, U.; Heine, H.; Wiesmuller, K.H.; Jung, G.; Brock, R.; Akira, S.; Ulmer, A.J. TLR1- and TLR6-independent recognition of bacterial lipopeptides. J. Biol. Chem. 2006, 281, 9049–9057. [Google Scholar] [CrossRef] [PubMed]
- Kirschning, C.J.; Schumann, R.R. TLR2: cellular sensor for microbial and endogenous molecular patterns. Curr. Top. Microbiol. Immunol. 2002, 270, 121–144. [Google Scholar] [PubMed]
- Akira, S.; Uematsu, S.; Takeuchi, O. Pathogen recognition and innate immunity. Cell 2006, 124, 783–801. [Google Scholar] [CrossRef] [PubMed]
- White, A.N.; Kata, S.R.; Womack, J.E. Comparative fine maps of bovine toll-like receptor 4 and toll-like receptor 2 regions. Mamm. Genome 2003, 14, 149–155. [Google Scholar] [CrossRef] [PubMed]
- McGuire, K.; Jones, M.; Werling, D.; Williams, J.L.; Glass, E.J.; Jann, O. Radiation hybrid mapping of all 10 characterized bovine Toll-like receptors. Anim. Genet. 2005, 37, 47–50. [Google Scholar] [CrossRef]
- Beutler, B.; Rehli, M. Evolution of the TIR, tolls and TLRs: functional inferences from computational biology. Curr. Top. Microbiol. Immunol. 2002, 270, 1–21. [Google Scholar] [PubMed]
- Pandey, S.; Agrawal, D.K. Immunobiology of Toll-like receptors: Emerging trends. Immun. Cell Biol. 2006, 84, 333–341. [Google Scholar] [CrossRef]
- Seabury, C.M.; Cargill, E.J.; Womack, J.E. Sequence variability and protein domain architectures for bovine Toll-like receptors 1,5 and 10. Genomics 2007, 90, 502–515. [Google Scholar] [CrossRef] [PubMed]
- Seabury, C.M.; Womack, J.E. Analysis of sequence variability and protein domain architectures for bovine peptidoglycan recognition protein 1 and Toll-like receptors 2 and 6. Genomics 2008, 92, 235–245. [Google Scholar] [CrossRef] [PubMed]
- Valarcher, J.F.; Taylor, G. Bovine respiratory syncytial virus infection. Vet. Res. 2007, 38, 153–180. [Google Scholar] [CrossRef] [PubMed]
- Mucha, R.; Bhide, M.R.; Chakurkar, E.B.; Novak, M.; Mikula, I., Sr. Toll-like receptors TLR1, TLR2 and TLR4 gene mutations and natural resistance to Mycobacterium avium subsp. paratuberculosis infection in cattle. Vet. Immunol. Immunopathol. 2009, 128, 381–388. [Google Scholar] [CrossRef]
- Valentini, A. PolyPrimers, version 1.00. 2006. Available online: http://www.unitus.it/SAG/primers.zip (accessed on 23 July, 2009).
- Hall, T.A. BioEdit: a user-friendly biological sequence alignment editor and analysis program for Windows 95/98/NT. Nucleic Acids Symp. Ser. 1999, 41, 95–98. [Google Scholar]
- Liu, K.; Muse, S.V. PowerMarker: an integrated analysis environment for genetic marker analysis. Bioinformatics 2005, 21, 2128–2129. [Google Scholar] [CrossRef] [PubMed]
- Beaumont, M.A.; Nichols, R.A. Evaluating loci for use in the genetic analysis of population structure. Proc. R. Soc. Lond. B. 1996, 263, 1619–1626. [Google Scholar] [CrossRef]
- Nei, M.; Tajima, F. Maximum likelihood estimation of the number of nucleotide substitutions from restriction sites data. Genetics 1983, 105, 207–217. [Google Scholar] [PubMed]
- Page, R.D. TreeView: an application to display phylogenetic trees on personal computer. Comput. Appl. Biosci. 1996, 12, 357–358. [Google Scholar] [PubMed]
- Mariotti, M. Polimorfismi nei geni Toll-like receptor 2,4 e 6 in Bos Taurus. Università degli studi della Tuscia: Viterbo, Italy, 2008. Available online: http://dspace.unitus.it/handle/2067/679 (accessed on 23 July, 2009).
- Negrini, R.; Nijman, I.J.; Milanesi, E.; Moazami-Goudarzi, K.; Williams, J.L.; Erhardt, G.; Dunner, S.; Rodellar, C.; Valentini, A.; Bradley, D.G.; Olsaker, I.; Kantanen, J.; Ajmone-Marsan, P.; Lenstra, J.A. European Cattle Genetic Diversity Consortium. Differentiation of European cattle by AFLP fingerprinting. Anim. Genet. 2007, 38, 60–66. [Google Scholar]
© 2009 by the authors; licensee Molecular Diversity Preservation International, Basel, Switzerland. This article is an open-access article distributed under the terms and conditions of the Creative Commons Attribution license (http://creativecommons.org/licenses/by/3.0/).
Share and Cite
Mariotti, M.; Williams, J.L.; Dunner, S.; Valentini, A.; Pariset, L. Polymorphisms within the Toll-Like Receptor (TLR)-2, -4, and -6 Genes in Cattle. Diversity 2009, 1, 7-18. https://doi.org/10.3390/d1010007
Mariotti M, Williams JL, Dunner S, Valentini A, Pariset L. Polymorphisms within the Toll-Like Receptor (TLR)-2, -4, and -6 Genes in Cattle. Diversity. 2009; 1(1):7-18. https://doi.org/10.3390/d1010007
Chicago/Turabian StyleMariotti, Marco, John L. Williams, Susana Dunner, Alessio Valentini, and Lorraine Pariset. 2009. "Polymorphisms within the Toll-Like Receptor (TLR)-2, -4, and -6 Genes in Cattle" Diversity 1, no. 1: 7-18. https://doi.org/10.3390/d1010007