Triphenylphosphine-(N,N-dimethyldithiocarbamato)-gold(I) Methanol Solvate


Département de chimie, Université de Montréal, Montréal QC H3C 3J7, Canada; [email protected]
*
Author to whom correspondence should be addressed.
Molbank 2017, 2017(2), M937; https://doi.org/10.3390/M937
Submission received: 1 March 2017
/
Revised: 20 March 2017
/
Accepted: 23 March 2017
/
Published: 30 March 2017
(This article belongs to the Section Structure Determination)
Abstract
:A gold(I) complex with a triphenylphosphine and a monodentate N,N-dimethyldithiocarbamate ligand was synthesized and characterized by Raman spectroscopy and single crystal X-ray diffraction. DFT calculations (Gaussian 09, PBE1PBE/Lanl2dz) were undertaken for a single complex in the gas phase. The DFT-optimized structure and calculated Raman spectrum are in good agreement with the crystal structure and the experimental spectrum. Assignments of the Raman peaks are based on these DFT calculations. Frontier molecular orbitals were calculated and their nature is discussed.
1. Introduction
Materials based on d10 configured Au(I) centers, often as coordination polymers, are of interest to modern applications, e.g., as luminescent sensors [1,2]. Dithiocarbamate (dtc) complexes are attractive due to their simple structures and wide variation of luminescence properties [3,4,5]. In this note we describe a monometallic gold(I) compound with Au–dtc coordination, an example of a molecular structure without Au(I)–Au(I) interactions. Its frontier molecular orbitals characterize an electronic structure without aurophilic effects.
2. Results and Discussion
2.1. X-ray Structures
The complex crystallizes in the triclinic space group along with a methanol solvent molecule (Figure 1). The crystal structure of the (Ph3P)Au(S2CNMe2)·0.5CH3OH system features two inequivalent complexes in the asymmetric unit with a linear coordination geometry (average S–Au–P angle of 174°) for the gold(I) center. It is noteworthy however that corresponding Au–S, Au–P, C–S or P–C bond lengths for the two inequivalent complexes are identical within three standard deviations. There are no substantial aurophilic interactions present in the crystal structure as the shortest Au–Au distance is ca. 5.11 Å [6].
The average Au–S and Au–P bond lengths are ca. 2.33 Å and 2.26 Å, respectively. These values are comparable within three standard deviations to ca. 2.34 and 2.25 Å measured for the ethyl-substituted analogue (Ph3P)Au(S2CNEt2) [7]. The dithiocarbamate ligand is coordinated in a monodentate fashion and the two C–S bond lengths for a single complex are nearly equivalent within three standard deviations. The average C–S bond length for the dithiocarbamate sulphur coordinated to the gold(I) center is ca. 1.75 Å, whereas it is ca. 1.70 Å for the uncoordinated sulphur. Similar values are obtained for the ethyl-substituted analogue [7] with ca. 1.75 and 1.68 Å for the dithiocarbamate sulphurs coordinated to the gold(I) center and uncoordinated respectively. Additionally, P–C and C–N (dtc) bond lengths (average value of ca. 1.82 and 1.33 Å) compare well with the (Ph3P)Au(S2CNEt2) [7] system with corresponding average values of ca. 1.81 and 1.33 Å.
Interestingly, the Au–S bond lengths are longer than the corresponding ones for Au2(S2CNEt2)2 [8] (average bond length of 2.29 Å) where the dithiocarbamate (dtc) moiety acts as a Au(I)–Au(I)–bridging bidentate ligand. This is in contrast to C–S and C–N (dtc) bond lengths which are undistinguishable within three standard deviations to Au2(S2CNEt2)2 [8] (average C–S and C–N (dtc) bond lengths of 1.72 and 1.34 Å respectively).
2.2. Raman Spectroscopy
The title compound is characterized by vibrational (Raman) spectroscopy (Figure 2). Some typical vibrations can be observed such as the C–N (dtc) stretching vibration (1488 cm−1) [9], the P–C stretching vibration (1098 cm−1) [10], the antisymmetric CS2 stretching vibration (972 cm−1) [9] or the symmetric CS2 stretching vibration (570 and 550 cm−1) [9]. Moreover, the most intense Raman peak, located at 998 cm−1, can be ascribed to a in-plane C–C–C angle deformation vibration for the phenyl rings of the triphenylphosphine moiety. Vibrational frequencies with detailed assignments obtained by DFT are given in Table S2 and a comparison of the experimental Raman spectrum with spectra of the precursors is also shown in Figure S1. The general agreement between the DFT-calculated Raman spectrum and the experimental one is good which confirms, along with the crystal structure, the identity of the synthesized complex.
2.3. Frontier Orbitals
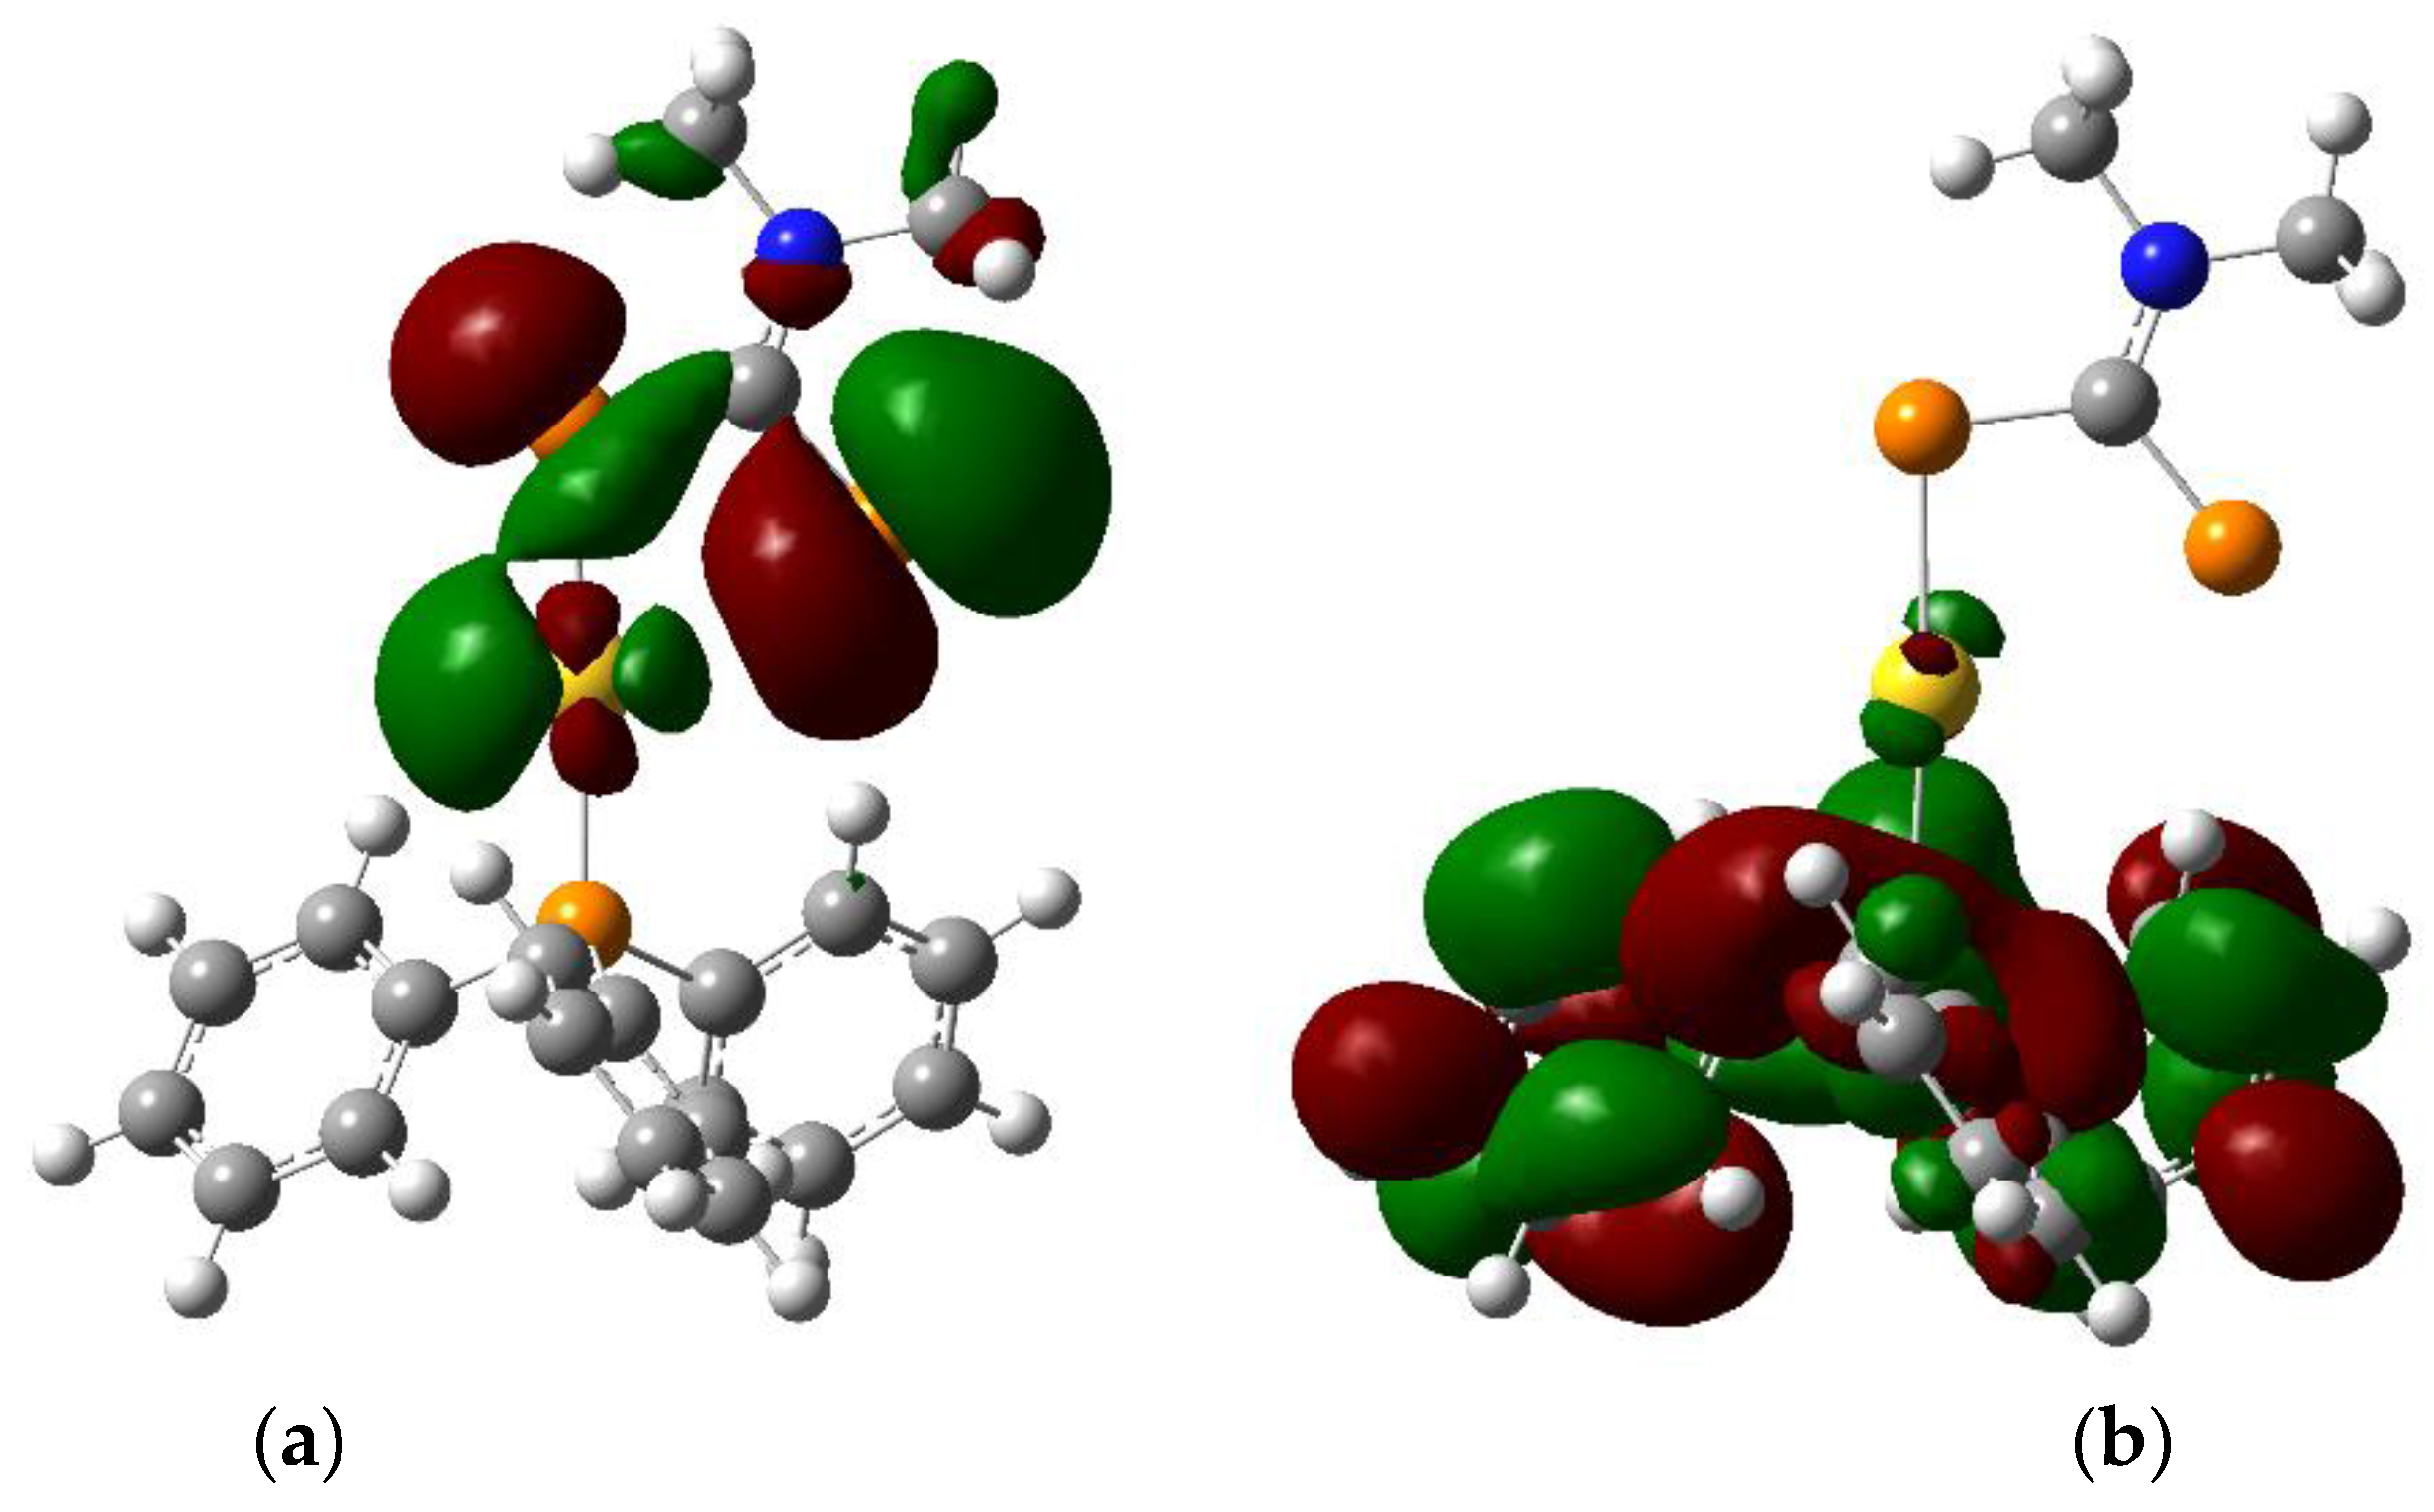
The HOMO (Figure 3) is centered on the sulphur atoms of the dithiocarbamate moiety with some contribution from a gold d orbital. In contrast, the LUMO (Figure 3) is centered on the triphenylphosphine ligand and exhibits π* character. The nature of the lowest-energy excited state can thus be ascribed to a LL′CT state, formed upon a transfer of electronic density from the dithiocarbamate ligand to the triphenylphosphine moiety. This is in stark contrast to the electronic structure in the presence of aurophilic interactions, where the frontier orbitals have strong M–M character [4,5]. The calculated HOMO–LUMO gap at the PBE1PBE/Lanl2dz level of theory in the gas phase is 32,100 cm−1 (312 nm), suggesting a high-lying first excited state.
3. Materials and Methods
3.1. General Methods and Physical Measurements
Raman spectra were measured using an InVia spectrometer (Renishaw, Wotton-under-Edge, Gloucestershire, UK) coupled to an imaging microscope (Leica, Wetzlar, Hesse, Germany). The excitation wavelength used was 785 nm for all Raman spectra. The infrared spectrum of the studied compound was measured with an ALPHA FTIR spectrometer (Bruker, Billerica, MA, USA) with a resolution of 4 cm−1. A single crystal of (Ph3P)Au(S2CNMe2)·0.5CH3OH was measured on a Venture Metaljet diffractometer (Bruker, Billerica, MA, USA). The crystal was kept at 105 K during data collection. Using Olex2 [11], the structure was solved with the SHELXT [12] structure solution program using Direct Methods and refined with the SHELXL [13] refinement package using least squares minimisation.
3.2. Synthesis of (Ph3P)Au(S2CNMe2)·0.5CH3OH
All reagents were purchased from commercial sources and used as received without further purification. Sodium dimethyldithiocarbamate monohydrate (NaS2CNMe2·H2O) was purchased from Sigma-Aldrich (St. Louis, MO, USA) and Chloro(triphenylphosphine)gold(I) (Ph3PAuCl, 99.99% metals basis) was purchased from Alfa Aesar (Ward Hill, MA, USA). Dichloromethane and methanol were of certified ACS grade and were purchased from Fisher Scientific (Hampton, NH, USA).
The procedure used was inspired by a literature procedure [3] and was initially applied to obtain X-ray quality single crystals of the Au(I) dithiocarbamate Au2(S2CNMe2)2. A first solution of Ph3PAuCl (0.20 mmol, 0.1005 g) in ca. 2 mL of dichloromethane was prepared at room temperature. A second solution of NaS2CNMe2·H2O (0.20 mmol, 0.0329 g) in ca. 2 mL of methanol was prepared at room temperature. The first solution was added to the second solution at ambient temperature. Upon mixing, the resulting solution became of a pale, faint yellow color. The resulting solution was then left to stir for ca. 19 h. After 19 h of stirring, the cloudy yellow solution was filtered off on a Büchner funnel to remove colorless PPh3 or (Ph3P)AuCl crystals. The filtered solution was collected and was left to evaporate slowly at room temperature. A suitable X-ray quality yellow crystal was then picked and used for X-ray diffraction.
(Ph3P)Au(S2CNMe2)·0.5CH3OH. Raman (room temperature, solid-state, cm−1): 168 (m), 189 (m), 214 (weak, sh), 225 (weak, sh), 257 (m), 299 (weak, sh), 391 (vw), 401 (vw), 433 (w), 445 (w), 463 (w), 513 (vw), 550 (m), 570 (s), 615 (m), 690 (m), 707 (w), 873 (vw), 935 (w), 972 (w), 998 (s), 1023 (m, sh), 1027 (m), 1072 (vw), 1098 (m), 1136 (w), 1156 (w), 1179 (w), 1207 (vw), 1244 (vw), 1314 (vw), 1370 (m), 1399 (vw), 1435 (w, br), 1488 (w, br), 1571 (w), 1585 (m). Single crystal X-ray diffraction for C43H46Au2N2OP2S4 (M = 1190.93 g/mol): triclinic, space group (no. 2), a = 10.7735(7) Å, b = 13.7435(10) Å, c = 14.5456(10) Å, α = 90.024(3)°, β = 94.461(2)°, γ = 93.349(3)°, V = 2143.5(3) Å3, Z = 2, T = 105 K, μ(GaKα) = 10.570 mm−1, Dcalc = 1.845 g/cm3, 48401 reflections measured (5.302° ≤ 2θ ≤ 110.428°), 8169 unique (Rint = 0.0588, Rsigma = 0.0360) which were used in all calculations. The final R1 was 0.0394 (I > 2σ(I)) and wR2 was 0.1064 (all data). CCDC 1533239 contains the supplementary crystallographic data for this paper. These data can be obtained free of charge via http://www.ccdc.cam.ac.uk/conts/retrieving.html.
3.3. DFT Calculations
All DFT calculations were undertaken using the Gaussian 09 (Gaussian Inc., Wallingford, CT, USA) [14] software package with methods as implemented in the software. All results of calculations were visualized with Gaussview (5.0.9 release, Gaussian Inc., Wallingford, CT, USA) [14]. A ground-state geometry optimization was performed on a single molecule of (Ph3P)Au(S2CNMe2) in the gas phase using one of the two inequivalent complexes in the asymmetric unit of the crystal structure presented in this report as a starting point. This optimization was carried out with the hybrid exchange-correlation functional PBE1PBE [15] along with the relativistic basis set Lanl2dz [16] with effective core potentials for all atoms using the default convergence criterion. A subsequent frequency calculation was performed on the optimized structure to obtain the calculated Raman spectrum presented in this work and revealed no imaginary frequencies. Additionally, molecular orbitals were also calculated for this optimized structure.
Supplementary Materials
The following are available online: Figure S1. Raman spectra of the synthesized compound (Ph3P)Au(S2CNMe2)·0.5CH3OH and of its precursors at room temperature. Raman spectra were measured with an excitation wavelength of 785 nm and are offset along the vertical axis for clarity. Figure S2. Comparison of the experimental infrared spectrum at room temperature of (Ph3P)Au(S2CNMe2)·0.5CH3OH with the DFT-calculated one in the gas phase for a single (Ph3P)Au(S2CNMe2) molecule (Gaussian 09, PBE1PBE/Lanl2dz). Table S1. Atoms′ coordinates of the DFT-optimized ground-state structure of (Ph3P)Au(S2CNMe2) in the gas phase (Gaussian 09, PBE1PBE/Lanl2dz). Table S2. Comparison between experimental and DFT-calculated (Gaussian 09, PBE1PBE/Lanl2dz) Raman shifts for the main Raman peaks.
Supplementary File 1Supplementary File 2Supplementary File 3Supplementary File 4Acknowledgments
We thank the Natural Sciences and Engineering Research Council (NSERC, Canada) for research grants and for graduate scholarships to N.B.-D.
Author Contributions
Nicolas Bélanger-Desmarais did the synthetic work and performed the measurements and the DFT calculations. Nicolas Bélanger-Desmarais and Christian Reber wrote the manuscript.
Conflicts of Interest
The authors declare no conflict of interest.
References
- Wenger, O.S. Vapochromism in organometallic and coordination complexes: Chemical sensors for volatile organic compounds. Chem. Rev. 2013, 113, 3686–3733. [Google Scholar] [CrossRef] [PubMed]
- He, X.; Yam, V.W.-W. Luminescent gold(I) complexes for chemosensing. Coord. Chem. Rev. 2011, 255, 2111–2123. [Google Scholar] [CrossRef]
- Paliwoda, D.; Wawrzyniak, P.; Katrusiak, A. Unwinding Au+···Au+ bonded filaments in ligand-supported gold(I) polymer under pressure. J. Phys. Chem. Lett. 2014, 5, 2182–2188. [Google Scholar] [CrossRef] [PubMed]
- Baril-Robert, F.; Radtke, M.A.; Reber, C. Pressure-dependent luminescence properties of gold(I) and silver(I) dithiocarbamate compounds. J. Phys. Chem. C 2012, 116, 2192–2197. [Google Scholar] [CrossRef]
- Roberts, R.J.; Bélanger-Desmarais, N.; Reber, C.; Leznoff, D.B. The luminescence properties of linear vs. kinked aurophilic 1-D chains of bis(dithiocarbamato)gold(I) dimers. Chem. Commun. 2014, 50, 3148–3150. [Google Scholar] [CrossRef] [PubMed]
- Schmidbaur, H.; Schier, A. Aurophilic interactions as a subject of current research: An up-date. Chem. Soc. Rev. 2012, 41, 370–412. [Google Scholar] [CrossRef] [PubMed]
- Wijnhoven, J.G.; Bosman, W.P.J.H.; Beurskens, P.T. Crystal and molecular structure of triphenylphosphine (N,N-diethyldithiocarbamato)gold(I). J. Cryst. Mol. Struct. 1972, 2, 7–15. [Google Scholar] [CrossRef]
- Heinrich, D.D.; Wang, J.-C.; Fackler, J.P., Jnr. Structure of Au2[S2CN(C2H5)2]2, bis(diethyldithiocarbamato)digold(I). Acta Cryst. C 1990, 46, 1444–1447. [Google Scholar] [CrossRef]
- Bradley, D.C.; Gitlitz, M.H. Preparation and properties of NN-dialkyldithiocarbamates of early transition elements. J. Chem. Soc. A 1969, 1152–1156. [Google Scholar] [CrossRef]
- Song, Y.; Butler, I.S.; Shaver, A. High-pressure vibrational study of the catalyst candidate cis-dimercaptobis(triphenylphosphine)platinum(II), cis-[(Ph3P)2Pt(SH)2]. Spectrochim. Acta Part A 2002, 58, 2581–2587. [Google Scholar] [CrossRef]
- Dolomanov, O.V.; Bourhis, L.J.; Gildea, R.J.; Howard, J.A.K.; Puschmann, H. OLEX2: A complete structure solution, refinement and analysis program. J. Appl. Cryst. 2009, 42, 339–341. [Google Scholar] [CrossRef]
- Sheldrick, G. SHELXT - Integrated space-group and crystal-structure determination. Acta Cryst. 2015, A71, 3–8. [Google Scholar] [CrossRef] [PubMed]
- Sheldrick, G. A short history of SHELX. Acta Cryst. 2008, A64, 112–122. [Google Scholar] [CrossRef] [PubMed]
- Frisch, M.J.; Trucks, G.W.; Schlegel, H.B.; Scuseria, G.E.; Robb, M.A.; Cheeseman, J.R.; Scalmani, G.; Barone, V.; Mennucci, B.; Petersson, G.A.; et al. Gaussian 09, Revision E.01. Gaussian, Inc.: Wallingford, CT, USA, 2013. [Google Scholar]
- Adamo, C.; Barone, V. Toward reliable density functional methods without adjustable parameters: The PBE0 model. J. Chem. Phys. 1999, 110, 6158–6170. [Google Scholar] [CrossRef]
- Hay, P.J.; Wadt, W.R. Ab initio effective core potentials for molecular calculations. Potentials for the transition metal atoms Sc to Hg. J. Chem. Phys. 1985, 82, 270–283. [Google Scholar] [CrossRef]
Figure 1.
Asymmetric unit of the crystal structure of (Ph3P)Au(S2CNMe2)·0.5CH3OH with ellipsoids drawn at the 50% probability level. All hydrogen atoms were omitted for clarity, except the protic hydrogen from the solvent molecule (drawn as a fixed 0.30 Å radius sphere).
Figure 1.
Asymmetric unit of the crystal structure of (Ph3P)Au(S2CNMe2)·0.5CH3OH with ellipsoids drawn at the 50% probability level. All hydrogen atoms were omitted for clarity, except the protic hydrogen from the solvent molecule (drawn as a fixed 0.30 Å radius sphere).
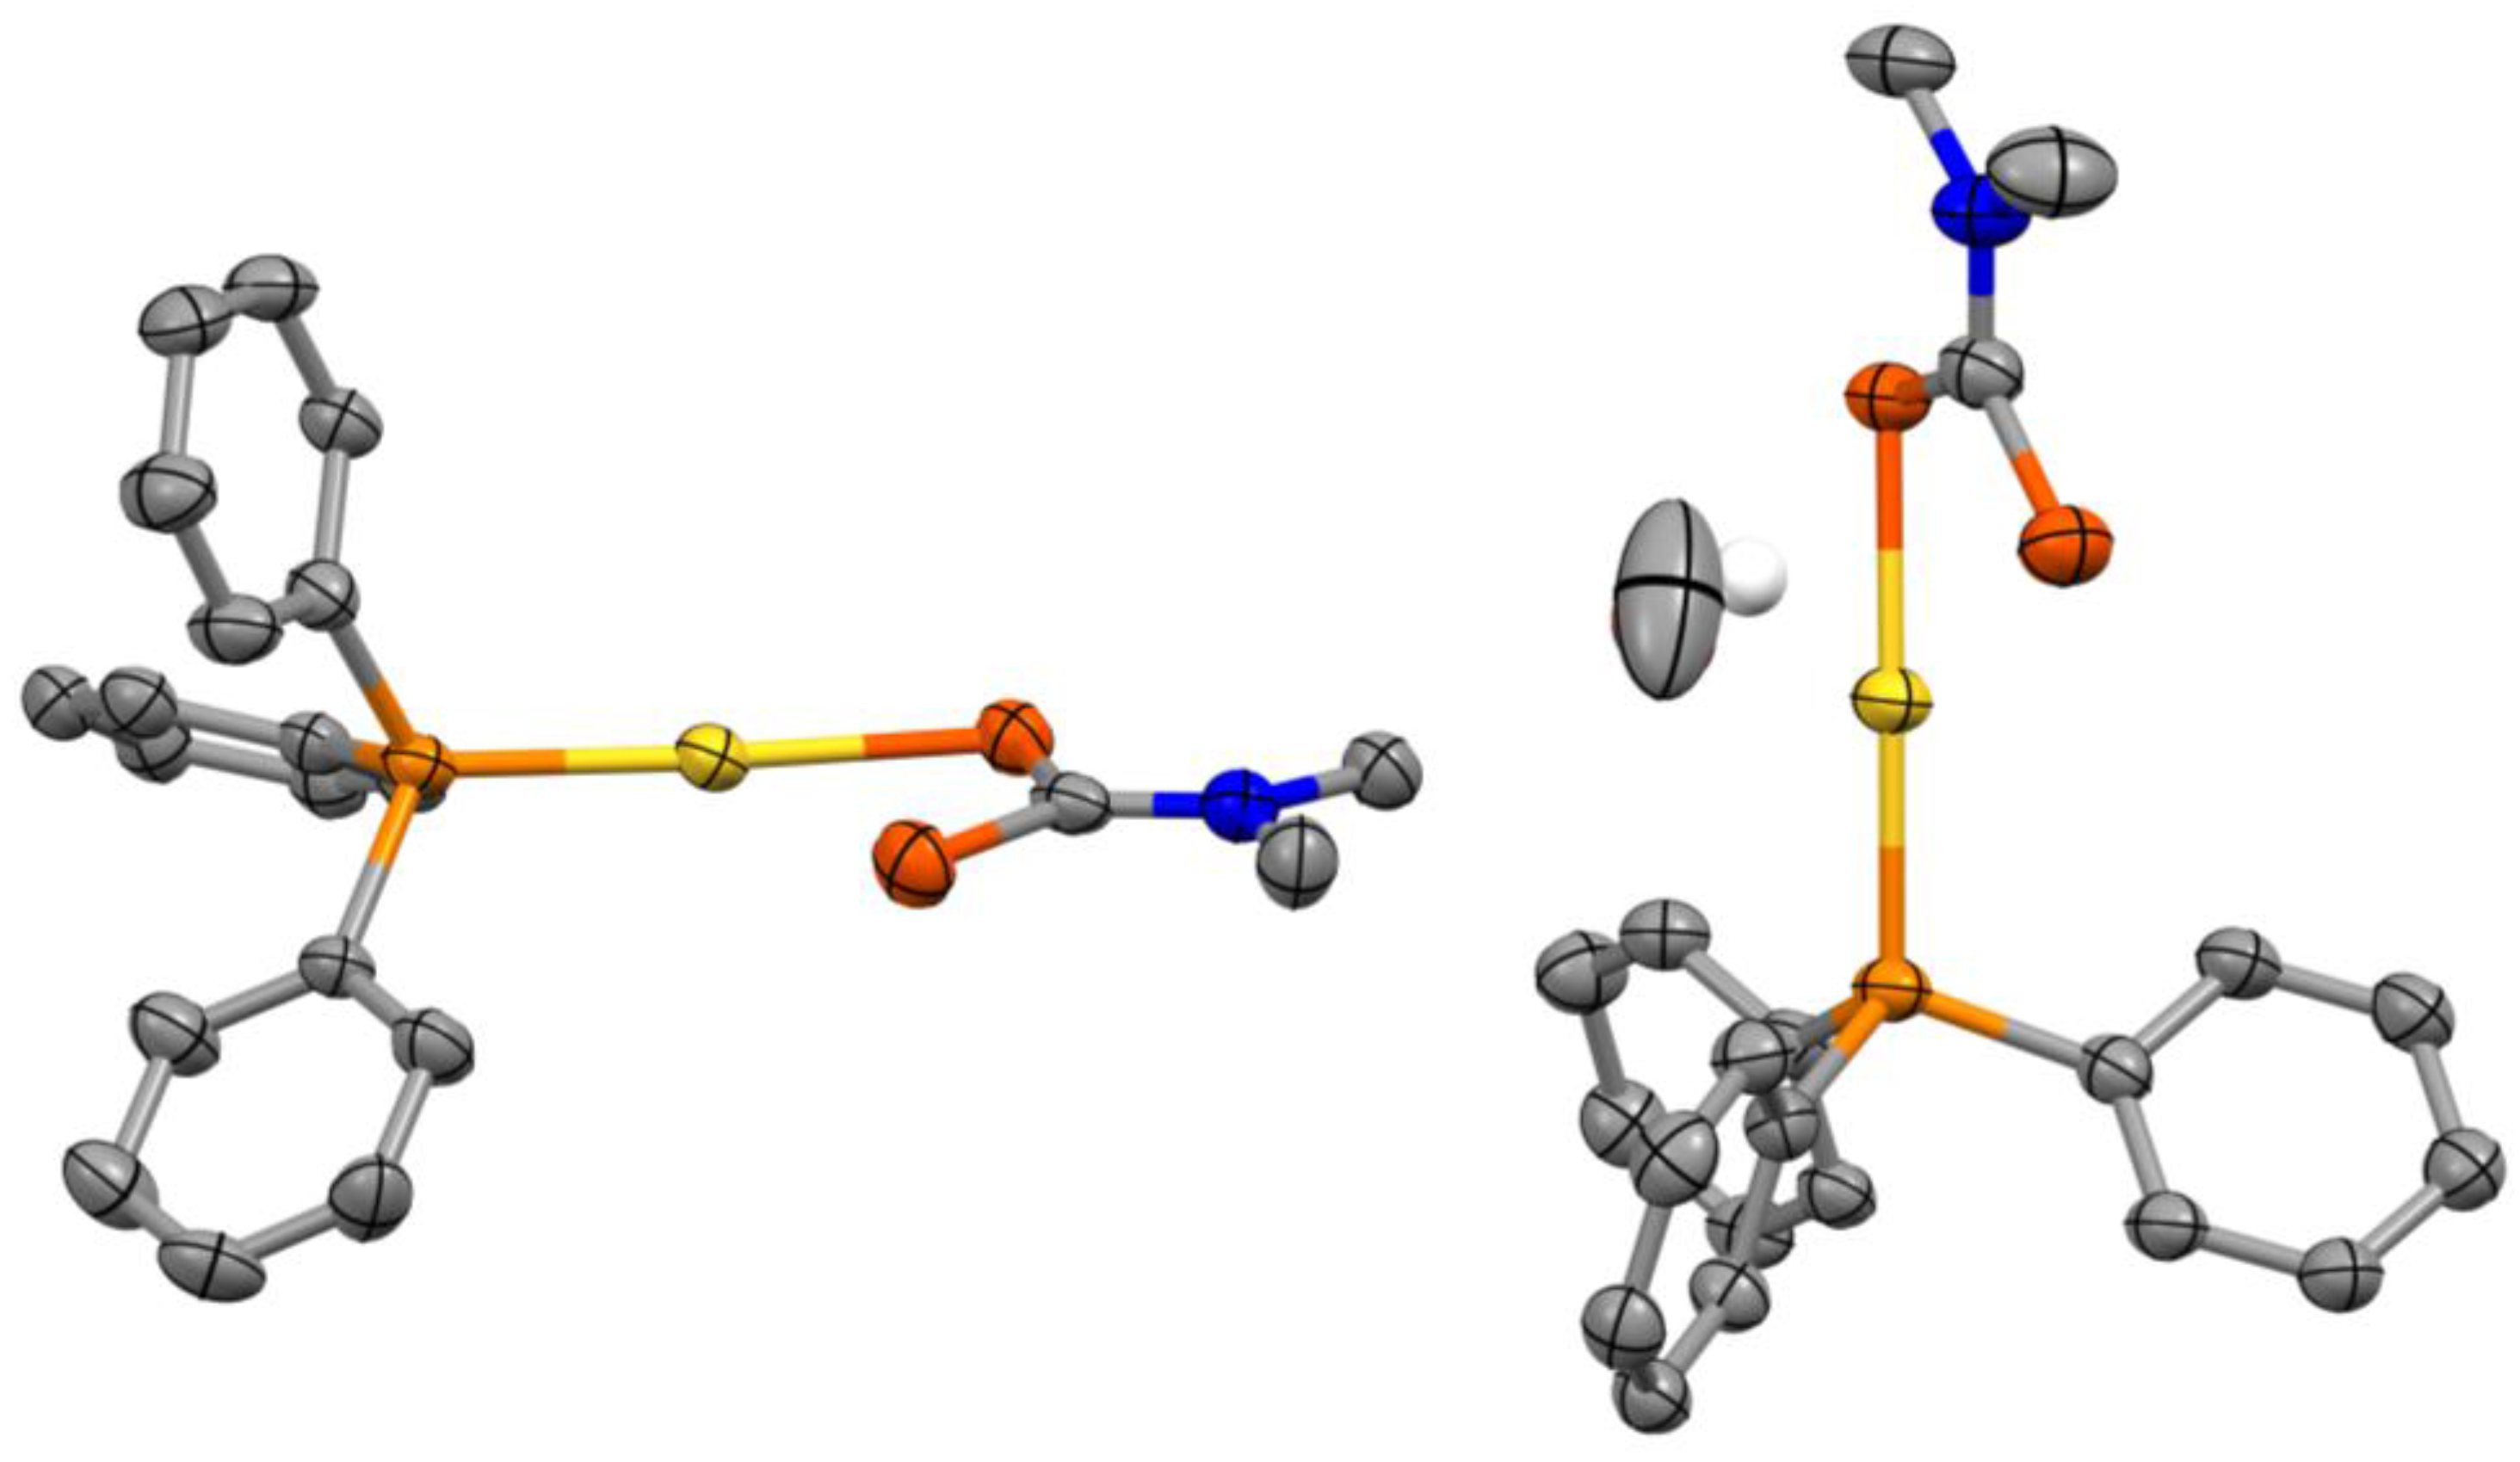
Figure 2.
Experimental Raman spectrum of (Ph3P)Au(S2CNMe2)·0.5CH3OH (black solid line, top) along with a DFT-calculated spectrum on a single molecule of (Ph3P)Au(S2CNMe2) (stick plot, bottom) in the gas phase (Gaussian 09, PBE1PBE/Lanl2dz).
Figure 2.
Experimental Raman spectrum of (Ph3P)Au(S2CNMe2)·0.5CH3OH (black solid line, top) along with a DFT-calculated spectrum on a single molecule of (Ph3P)Au(S2CNMe2) (stick plot, bottom) in the gas phase (Gaussian 09, PBE1PBE/Lanl2dz).
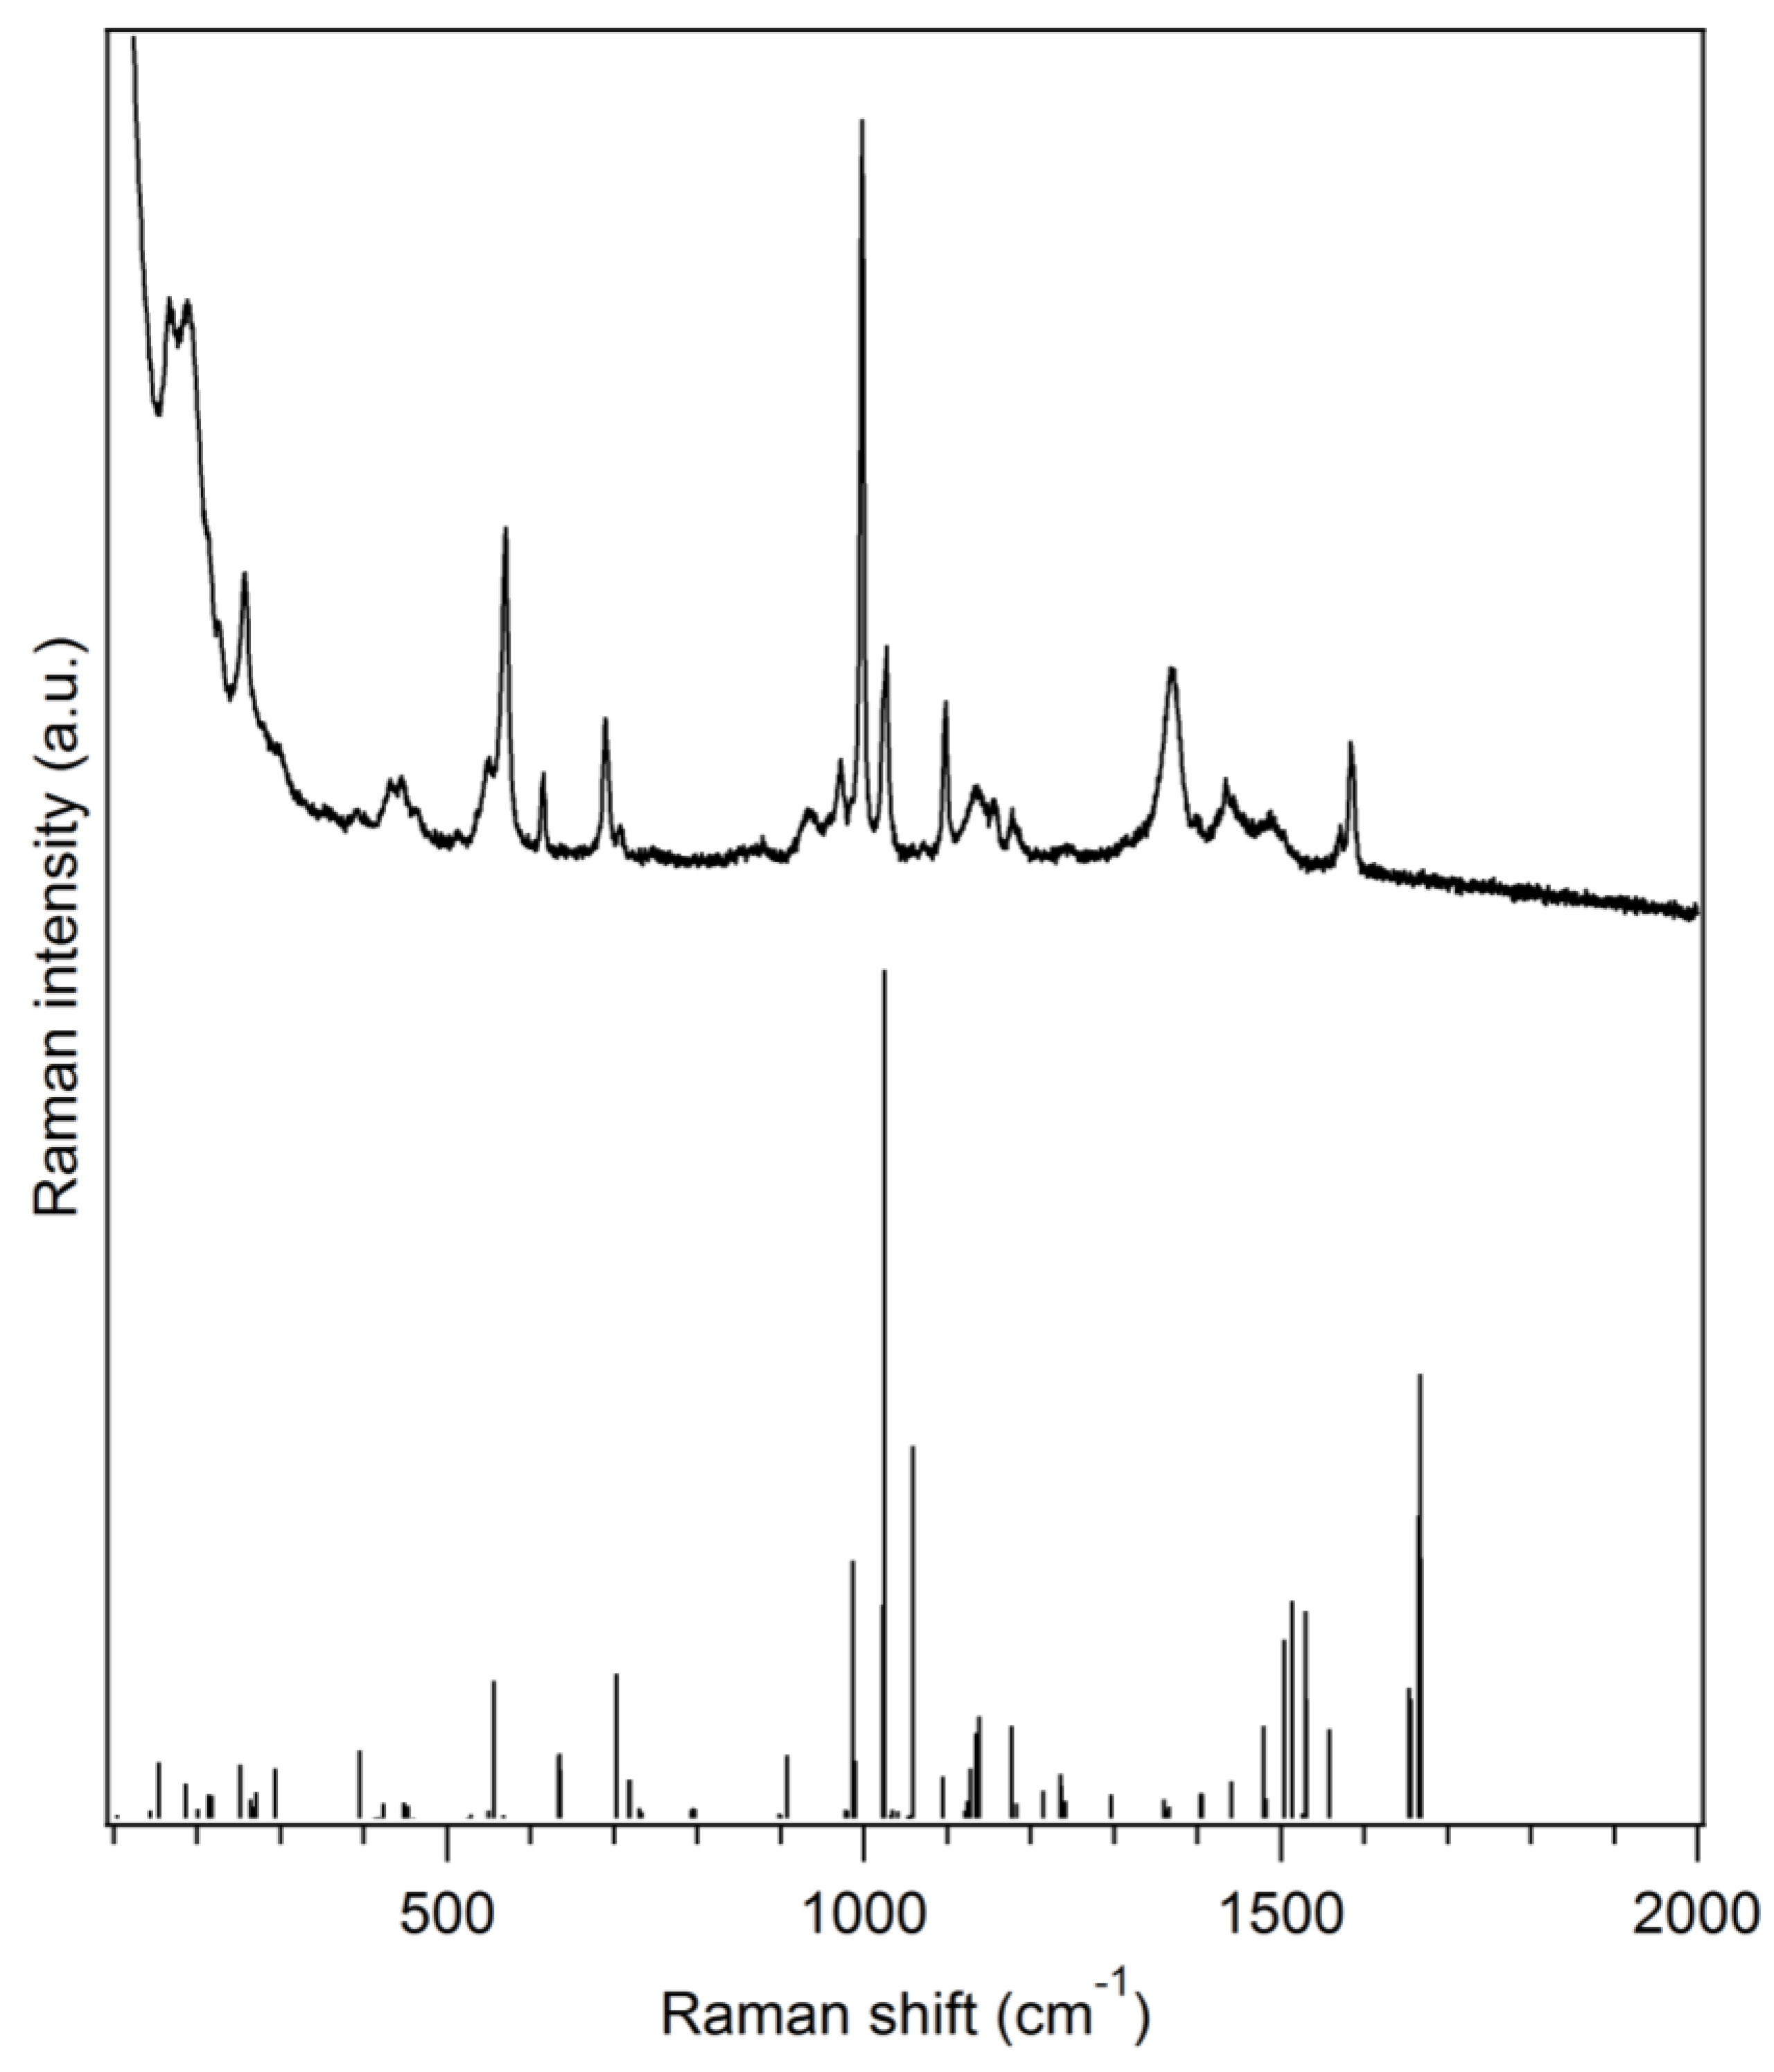
Figure 3.
Isodensity plots (0.02 atomic units) of (a) HOMO and (b) LUMO for (Ph3P)Au(S2CNMe2) calculated by DFT in the gas phase (Gaussian 09, PBE1PBE/Lanl2dz).
Figure 3.
Isodensity plots (0.02 atomic units) of (a) HOMO and (b) LUMO for (Ph3P)Au(S2CNMe2) calculated by DFT in the gas phase (Gaussian 09, PBE1PBE/Lanl2dz).


Table 1.
Selected bond lengths or angles for the complex (Ph3P)Au(S2CNMe2) obtained from the crystal structure and from a DFT optimization in the gas phase (Gaussian 09, PBE1PBE/Lanl2dz).
Table 1.
Selected bond lengths or angles for the complex (Ph3P)Au(S2CNMe2) obtained from the crystal structure and from a DFT optimization in the gas phase (Gaussian 09, PBE1PBE/Lanl2dz).
| Bonds or Angles | Crystal Structure | DFT (PBE1PBE/Lanl2dz) | ||
|---|---|---|---|---|
| Exp. Bond Length (Å) or Angle (°) | Avg. Bond Length (Å) or Angle (°) | Calc. Bond Length (Å) or Angle (°) | Difference (%) | |
| Au–S | 2.3371 (15) | 2.335 | 2.427 | 4.0 |
| 2.3322 (15) | ||||
| Au---S | 3.1321 (19) | 3.091 | 3.151 | 1.9 |
| 3.0505 (16) | ||||
| Au–P | 2.2524 (15) | 2.255 | 2.364 | 4.8 |
| 2.2576 (14) | ||||
| C–S (S coord. to Au) | 1.756 (6) | 1.753 | 1.809 | 3.2 |
| 1.750 (7) | ||||
| C–S (S not coord. to Au) | 1.696 (6) | 1.702 | 1.743 | 2.4 |
| 1.708 (7) | ||||
| C–P | 1.815 (5) | 1.820 | 1.864 | 2.4 |
| 1.813 (6) | ||||
| 1.820 (6) | 1.862 | |||
| 1.833 (6) | ||||
| 1.820 (6) | 1.864 | |||
| 1.820 (6) | ||||
| C–N (dtc) | 1.331 (8) | 1.332 | 1.357 | 1.9 |
| 1.333 (8) | ||||
| S–Au–P angle | 173.66 (6) | 174 | 176 | 1.1 |
| 175.07 (5) | ||||
| S–C–S angle | 120.8 (4) | 120 | 122 | 1.0 |
| 119.9 (4) | ||||
© 2017 by the authors. Licensee MDPI, Basel, Switzerland. This article is an open access article distributed under the terms and conditions of the Creative Commons Attribution (CC BY) license (http://creativecommons.org/licenses/by/4.0/).
Share and Cite
MDPI and ACS Style
Bélanger-Desmarais, N.; Reber, C. Triphenylphosphine-(N,N-dimethyldithiocarbamato)-gold(I) Methanol Solvate. Molbank 2017, 2017, M937. https://doi.org/10.3390/M937
AMA Style
Bélanger-Desmarais N, Reber C. Triphenylphosphine-(N,N-dimethyldithiocarbamato)-gold(I) Methanol Solvate. Molbank. 2017; 2017(2):M937. https://doi.org/10.3390/M937
Chicago/Turabian StyleBélanger-Desmarais, Nicolas, and Christian Reber. 2017. "Triphenylphosphine-(N,N-dimethyldithiocarbamato)-gold(I) Methanol Solvate" Molbank 2017, no. 2: M937. https://doi.org/10.3390/M937
Note that from the first issue of 2016, this journal uses article numbers instead of page numbers. See further details here.