Supported Phospholipid Bilayer Interaction with Components Found in Typical Room-Temperature Ionic Liquids – a QCM-D and AFM Study

New Crops and Processing Technology Research Unit, National Center for Agricultural Utilization Research, Agricultural Research Service, United States Department of Agriculture, 1815 N. University Street, Peoria, IL 61604, USA
Int. J. Mol. Sci. 2008, 9(4), 498-511; https://doi.org/10.3390/ijms9040498
Submission received: 16 October 2007
/
Revised: 26 February 2007
/
Accepted: 14 March 2008
/
Published: 4 April 2008
(This article belongs to the Special Issue Ionic Liquids)
Abstract
:Quartz crystal microbalance with dissipation (QCM-D) monitoring and atomic force microscopy (AFM) were combined to evaluate the defects created by an ionic liquid anion and a cation in a supported phospholipid bilayer composed of zwitterionic lipids on a silica surface. The cation 1-octyl-3-methyl imidazolium (OMIM+) was shown to remove lipids from the bilayer, increase the roughness to approximately 2.8 nm (~0.2 for stable supported bilayer) and possibly redeposit lipids with entrapped water. The anion bis(trifluoromethylsulfonyl)imide (Tf2N-) was found to leave distinct defects within the bilayer that had large pore-like interiors which left the surrounding bilayer intact. However, the ionic liquid 1-butyl-1-methyl pyrrolidinium bis(trifluoromethylsulfonyl)imide (BMP-Tf2N) formed a film over the supported bilayer. This work demonstrates, for the first time, the direct effects common components of ionic liquids have on a supported phospholipids bilayer.
1. Introduction
Over the past few years, considerable interest in developing biocatalytic systems in non-aqueous environments [1–3] has developed. By conducting biocatalytic processes in non-aqueous systems, one can extend catalytic specificity of the enzymes and substrates toward new substrates in novel reactions systems. For instance, substrates such as plant sterols [4], cinnamoylated lipids [5] and commodity vegetable oils [6], which are less soluble in water, could benefit significantly from non-aqueous media in which the substrates dissolve and the reaction occurs at a reasonable rate.
Typically, bioconversion of substrates like sterols, lipids and vegetable oils is done in organic solvents [4–6] because of the substrates’ incompatibility with water. However, typical organic solvents are hazardous because of their flammability and high vapor pressure. Recently, there has been a drive to overcome these hazards of organic solvents by choosing to conduct bioconversion reactions in a new class of solvents called room-temperature ionic liquids. Room-temperature ionic liquids have little or none of the hazards associated with typical organic solvents and have shown to maintain chemical/thermal stability along with high ionic conductivity [7, 8].
Bioconversion that uses enzymes poured into the solvent with lipids to form a “free-floating” system can be costly when it comes to separating enzyme from product or starting material. However, cost can be reduced if enzyme recovery is simplified through immobilizing the enzyme, making the bioconversion practical [9]. Bioelectrocatalysis, a more specific method of bioconversion, uses electron transfer enzyme (oxidoreductases) systems for chemical synthesis. Usually in bioelectrocatalysis, the enzyme is immobilized onto an electrode [10].
Our interest in using bioelectrocatalysis lies in our desire to use oxidoreductases to impart functionalities to fatty acid groups of plant lipids and commodity vegetable oils. Since oxidoreductases like cytochrome c are found bound to a membrane, our approach to stabilizing the function of the enzyme on an electrode is to incorporate phospholipid membranes.
Although it has been demonstrated that room-temperature ionic liquids will support biocatalytic [11–16] and enzymatic reactions [14–17], it is unclear what effects the ionic liquids would have on lipids in the proximity of the interface between the electrode and enzyme which is readily used in biocatalytic reactions. In other words, the question to answer is what happens to lipid membranes that are used as a reactor/immobilization surface for the enzyme [9] in ionic liquids. This study was undertaken to develop an understanding of the resultant interaction between individual components of ionic liquids and phospholipids bilayers on a surface by exploring the interaction of a common 1-alkyl-3-methyl imidazolium cation and a common anion species found in several room-temperature ionic liquids, focusing on two components from a previous study where membrane disruption occurred for phosphatidylcholine vesicles free in solution [18]. The intent is to shed more light on the details of interactions of these components with phosphatidylcholine bilayers.
2. Results and Discussion
2.1. Effect of 1-Octyl-3-Methyl imidazolium (OMIM+) on 1,2-dielaidoylphosphatidylcholine (DEPC) Supported Phospholipid Bilayer (SPB)
For the current study, DEPC was selected because its phase transition occurs between 0 and 23°C (~13°C). All measurements were conducted with DEPC vesicles at 125μM and at 20°C (this ensures vesicle interactions with 1-octyl-3-methyl imidazolium chloride (OMIM-Cl) and LiTf2N are not affected by lipids in a gel phase).
Quartz crystal microbalance with dissipation monitoring (QCM-D) is a well established tool for monitoring supported phospholipid bilayer formation and interaction with various materials [19]. In recent years, several studies have been conducted to demonstrate the effect that the lipid composition of vesicles [20], buffer contents [21] and ionic strength [22] have on SPB formation on a silicon dioxide surface. In these listed previous studies, the lipid head group was phosphatidylcholine and the tail groups were completely saturated (1,2-dimyristoylphosphatidylcholine - DMPC) or contained just one point of unsaturation (1,2-dioleoylphosphatidylcholine – DOPC). In the case for DMPC (phase transition of 23°C), it was found that the presence of a minimum of 90mM NaCl was required for vesicles to form a SPB through a two-step pathway which started with the collection of vesicles on the surface at a critical density followed by the final SPB formation [22]. Similarly, conditions were found for this study where a bilayer was formed that was consistent with known studies of SPB formation on silica [19, 21–24]. Therefore, all buffers from this point contained 100mM NaCl in addition to any ionic liquid. The relationship between the change in absorbed mass and corresponding frequency change has been described by Sauerbrey [25] using the following equation:
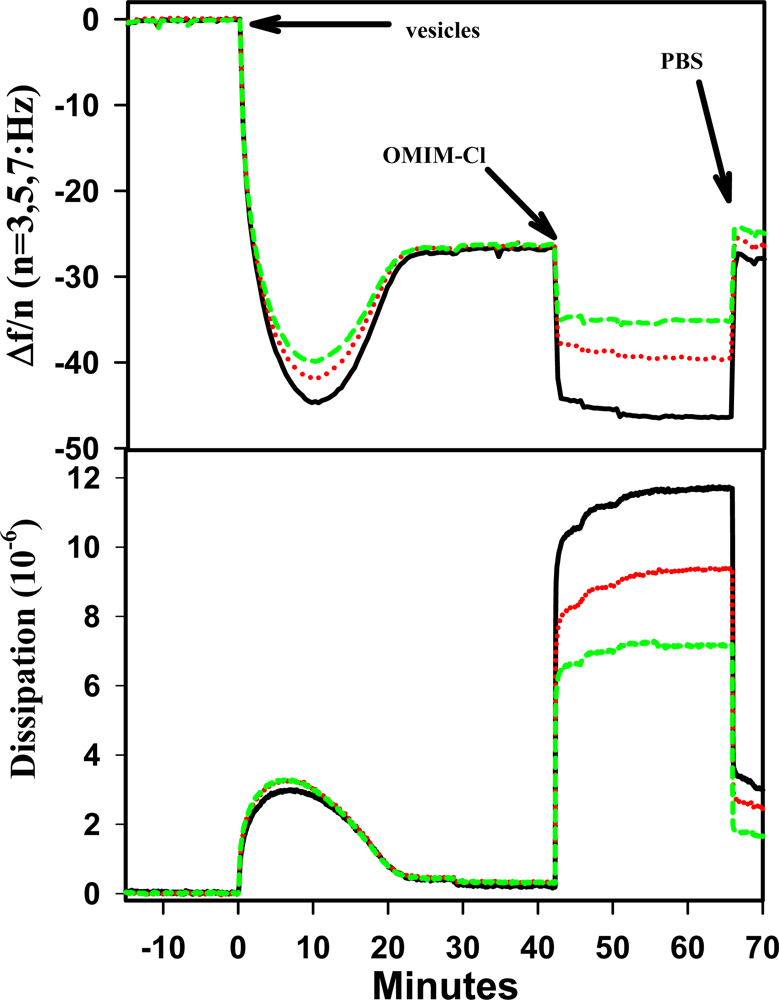
where C is the mass-sensitivity constant (17.7 ng/cm2/Hz at 5MHz), f is the frequency, n is the overtone number (1, 3, 5, or 7), and m is the adsorbed mass. Using this relationship which was proven to hold for thin, rigid films [24] and to underestimate unruptured vesicles (soft material) to within 5% error [26], it was found that the SPB formed had a mass of ~523 ng/cm2 (Table 1), which is slightly more than typically reported for SPB on SO2 [23, 24], 434 and 468 ng cm−2, respectively. This suggests that some vesicles were still unruptured with some entrapped buffer remaining. Upon exposing the SPB to OMIM+ for 15 min and flushing with buffer to remove the OMIM+, it was revealed that there was a loss of mass (~438 ng/cm2 remaining). Because the resulting mass is near the values reported for a rigid thin SPB, it is reasonable to conclude that residual vesicles were ruptured by OMIM+ (this is also inferred from fluorescent measurements done by Evans [18]). Consequently, the entrapped buffer was released resulting in the loss of mass. However, closer examination of the data after OMIM+ was rinsed away shows that there is a change in the frequency dependence of the signals and an increase in dissipation (Table 1). The increased dissipation change after rinsing away the bulk of OMIM+ indicates that there was an increase in effective viscosity of the adsorbed film. Further evidence of increased effective viscosity is indicated by the separation of each frequency (15, 25, 35MHz) and corresponding dissipation values after OMIM+ was flushed away (Figure 1), possibly the result of a softer layer bound to the crystal [27]. However, effects due to changes in surface roughness [28], changes in the coupling between the bilayer the surface, and/or a combination of changes due to film thickness and viscoelastic properties are not distinguishable and therefore not ruled out.
To further evaluate the effect OMIM+ had on DEPC as a SPB, AFM imaging was conducted under the same conditions as the QCM-D measurements. Figure 2a exhibits the SPB on a silica wafer prior to and Figure 2b is the SPB 15 min after exposure to OMIM+. The image was obtained using tapping mode with a scan rate of ~ 2.5 Hz over a 400 nm by 400 nm area. Dark areas in Figure 2a show where the SPB was removed by OMIM+. A cross-sectional analysis of the SPB (Figure 2b) revealed that the topography had regions with a maximum height of nearly 7.5 nm with an average roughness of 2.8 nm (compared to 0.2nm for a defect-free bilayer). Interpretation of the AFM height images after OMIM+ was rinsed away is that the bilayer was solubilized such that it was inhomogeneous on the silica, forming softer regions where water was possibly entrapped again. This interpretation fits well with the measured QCM-D data. Therefore, it is reasonable to conclude that such a change in the SPB topography would result in a non-uniform, softer bilayer that couples less to the silica surface (as indicated by the dissipation change after exposure to OMIM+). However, aggregation formation is not ruled out. Further support of the change in softness of the SPB after exposure to OMIM-Cl is suggested from the phase image of the SPB (Figure 2c) where there is quite a difference in phase of the low and high areas of image. Phase imaging is based on a difference in the oscillation of the AFM tip as it is driven by the piezo and the oscillation due to the tip responding to interactions with a surface. Because the phase contrast of a SPB is interpreted as a change in softness [29], the interpretation of Figure 2c is that the softness of the SPB varied over the surface after exposure to OMIM+.
An understanding of the mechanism of membrane disruption caused by OMIM+ is also possible when viewing the chemical structure of OMIM+ (Figure 2e). As Figure 2e shows, OMIM+ has a hydrophobic region and a polar region (charged imidazolium ring). With these amphiphilic properties, it is clear that OMIM+ probably can form aggregates [30, 31] and solubilize the supported bilayer as some mixed micelle structure.
2.2 Interaction of Tf2N− with a SPB
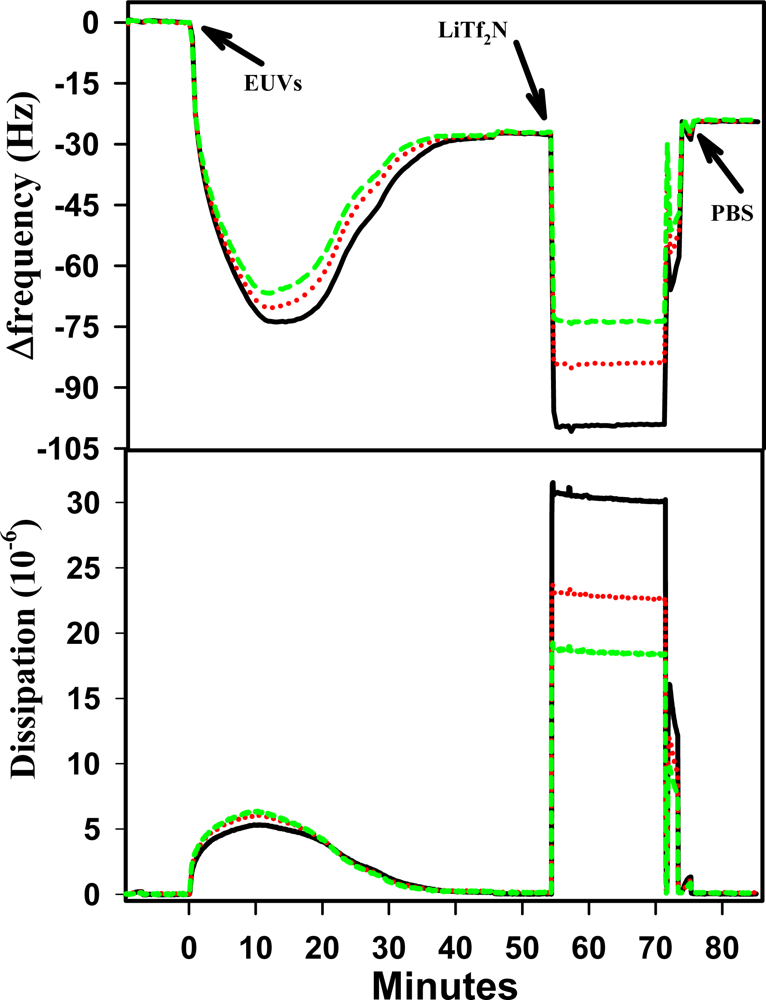
Figure 3 displays the frequency and dissipation changes associated with vesicle adsorption, fusion to form a SPB and subsequent interaction with Tf2N− on a SiO2 surface. Table 1 displays a comparison of the frequency and dissipation changes before and after exposure to Tf2N−. The data indicates a slight reduction in frequency change after the SPB was exposed to Tf2N−. This difference in frequency before and after Tf2N− exposure translates into a difference in mass present (confirmed by t-test analysis where p was 0.0358).
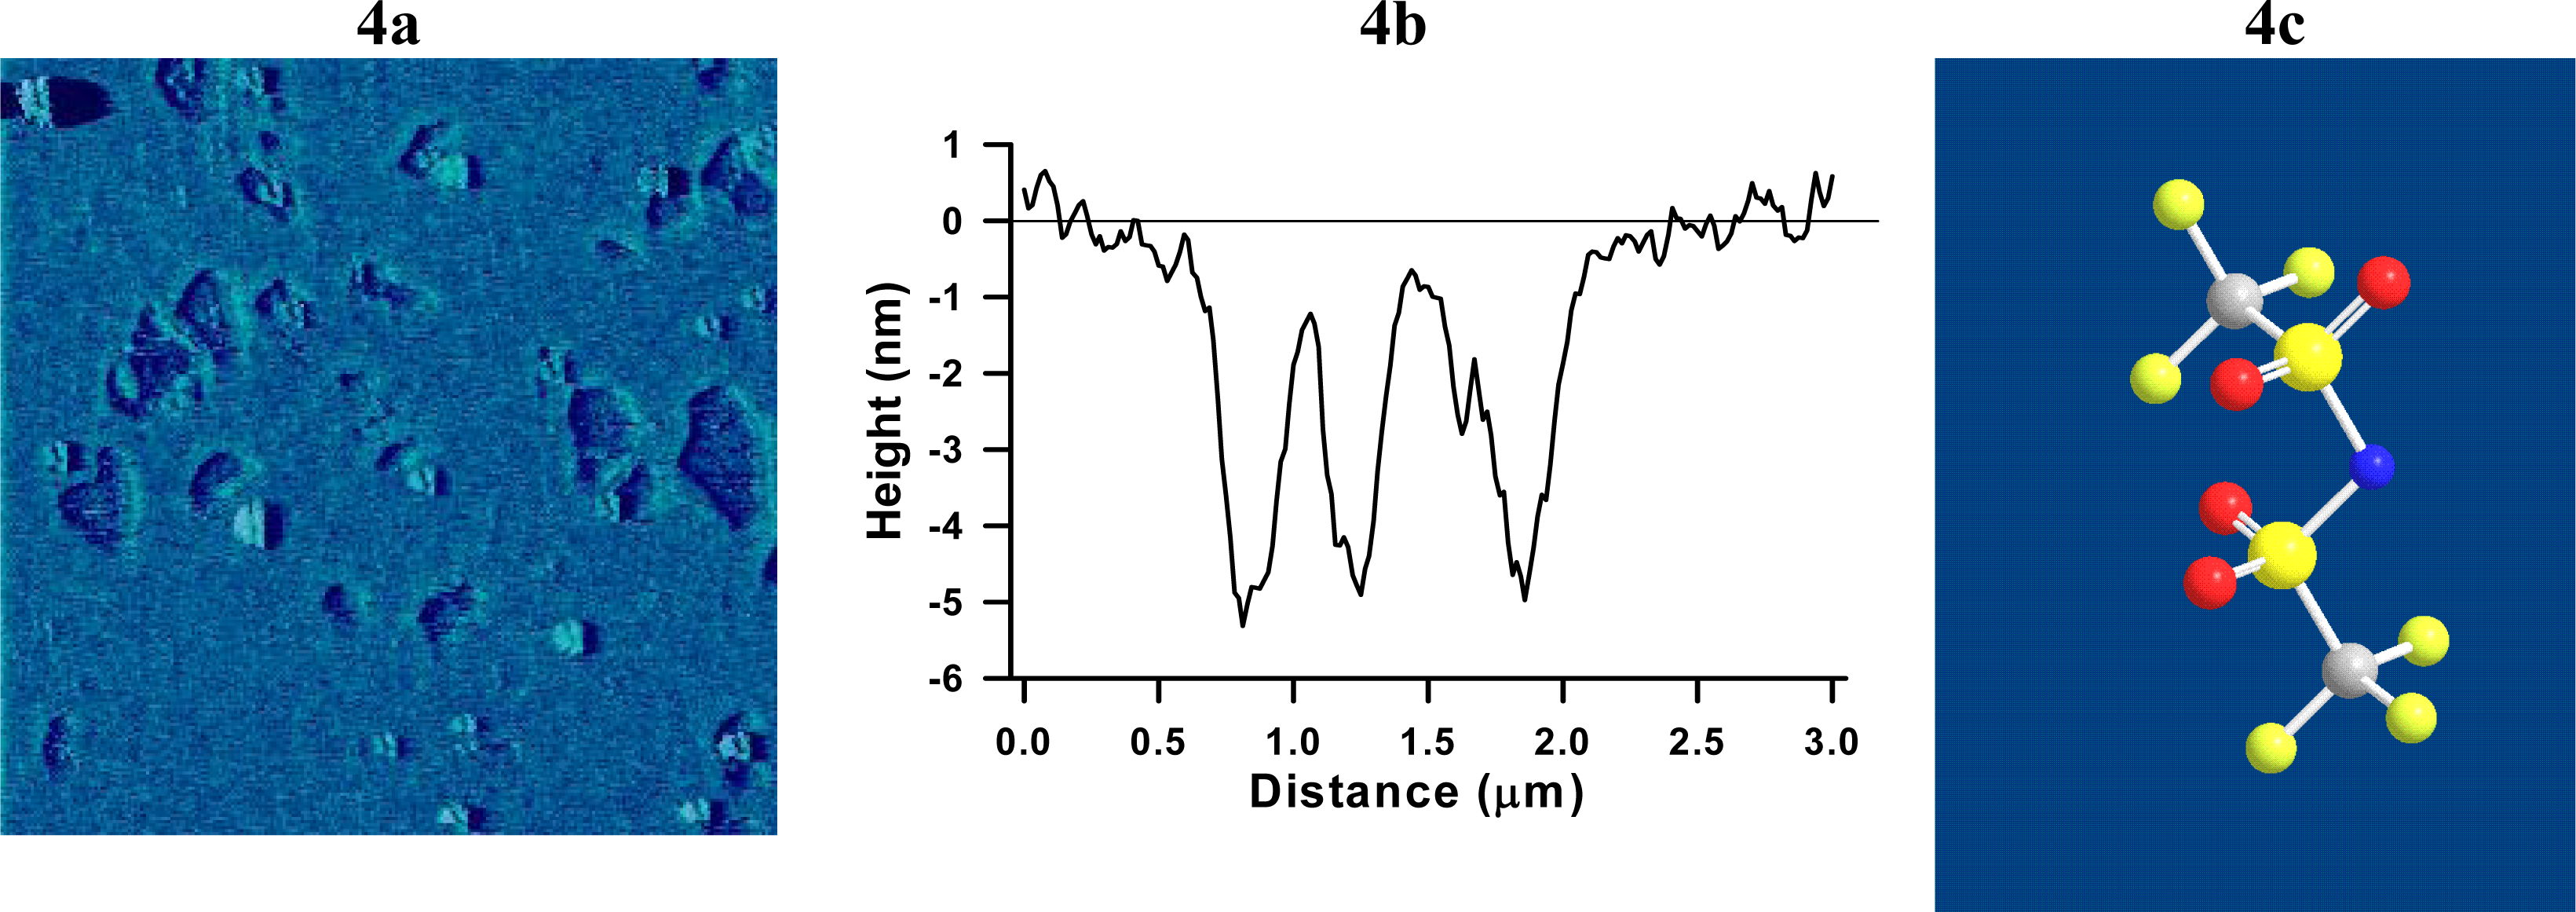
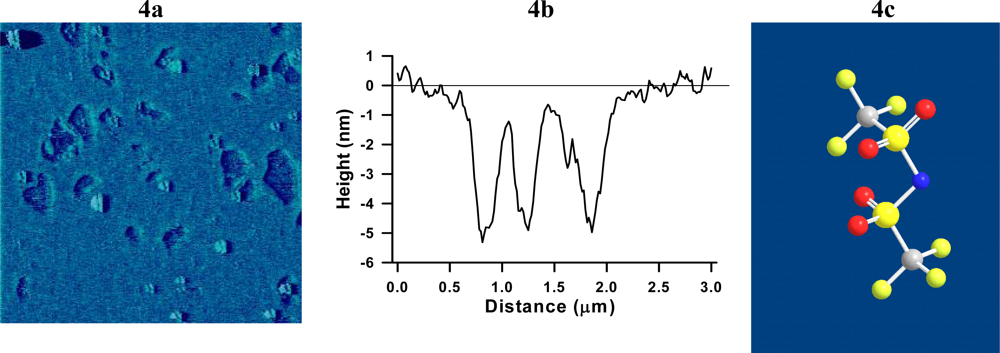
AFM imaging was done to confirm the interpretation made from the QCM-D data. AFM tapping mode imaging show that the bilayer after exposure to Tf2N− contained large defects approximately 400–600 nm wide (Figure 4a). Height measurements (Figure 4b) revealed that the defects had a maximal depth (ΔH) of 5.5 ± 1.1 nm (tapered interior is an artifact of the AFM tip probe). The AFM image data is consistent with the QCM-D data in that Tf2N− caused a loss of lipids from bilayer but left the remaining bilayer undisturbed and rigidly bound to SiO2. This is also consistent with recently measured fluorescence data on intact vesicles in the presence of Tf2N− [18], although it is unclear what role curvature of the vesicles or surface interactions with the supported bilayer played in each case. It possible though, that the chemical structure of Tf2N+ (Figure 4c) may play a more direct role in disrupting the membrane. Tf2N− may form dendrimer-like structures that are capable of disrupting the bilayer by removing lipids and creating nanoscale holes which leave behind nearly bare substrate in places [32–34].
2.3 Result of BMP-Tf2N Interaction with SPB
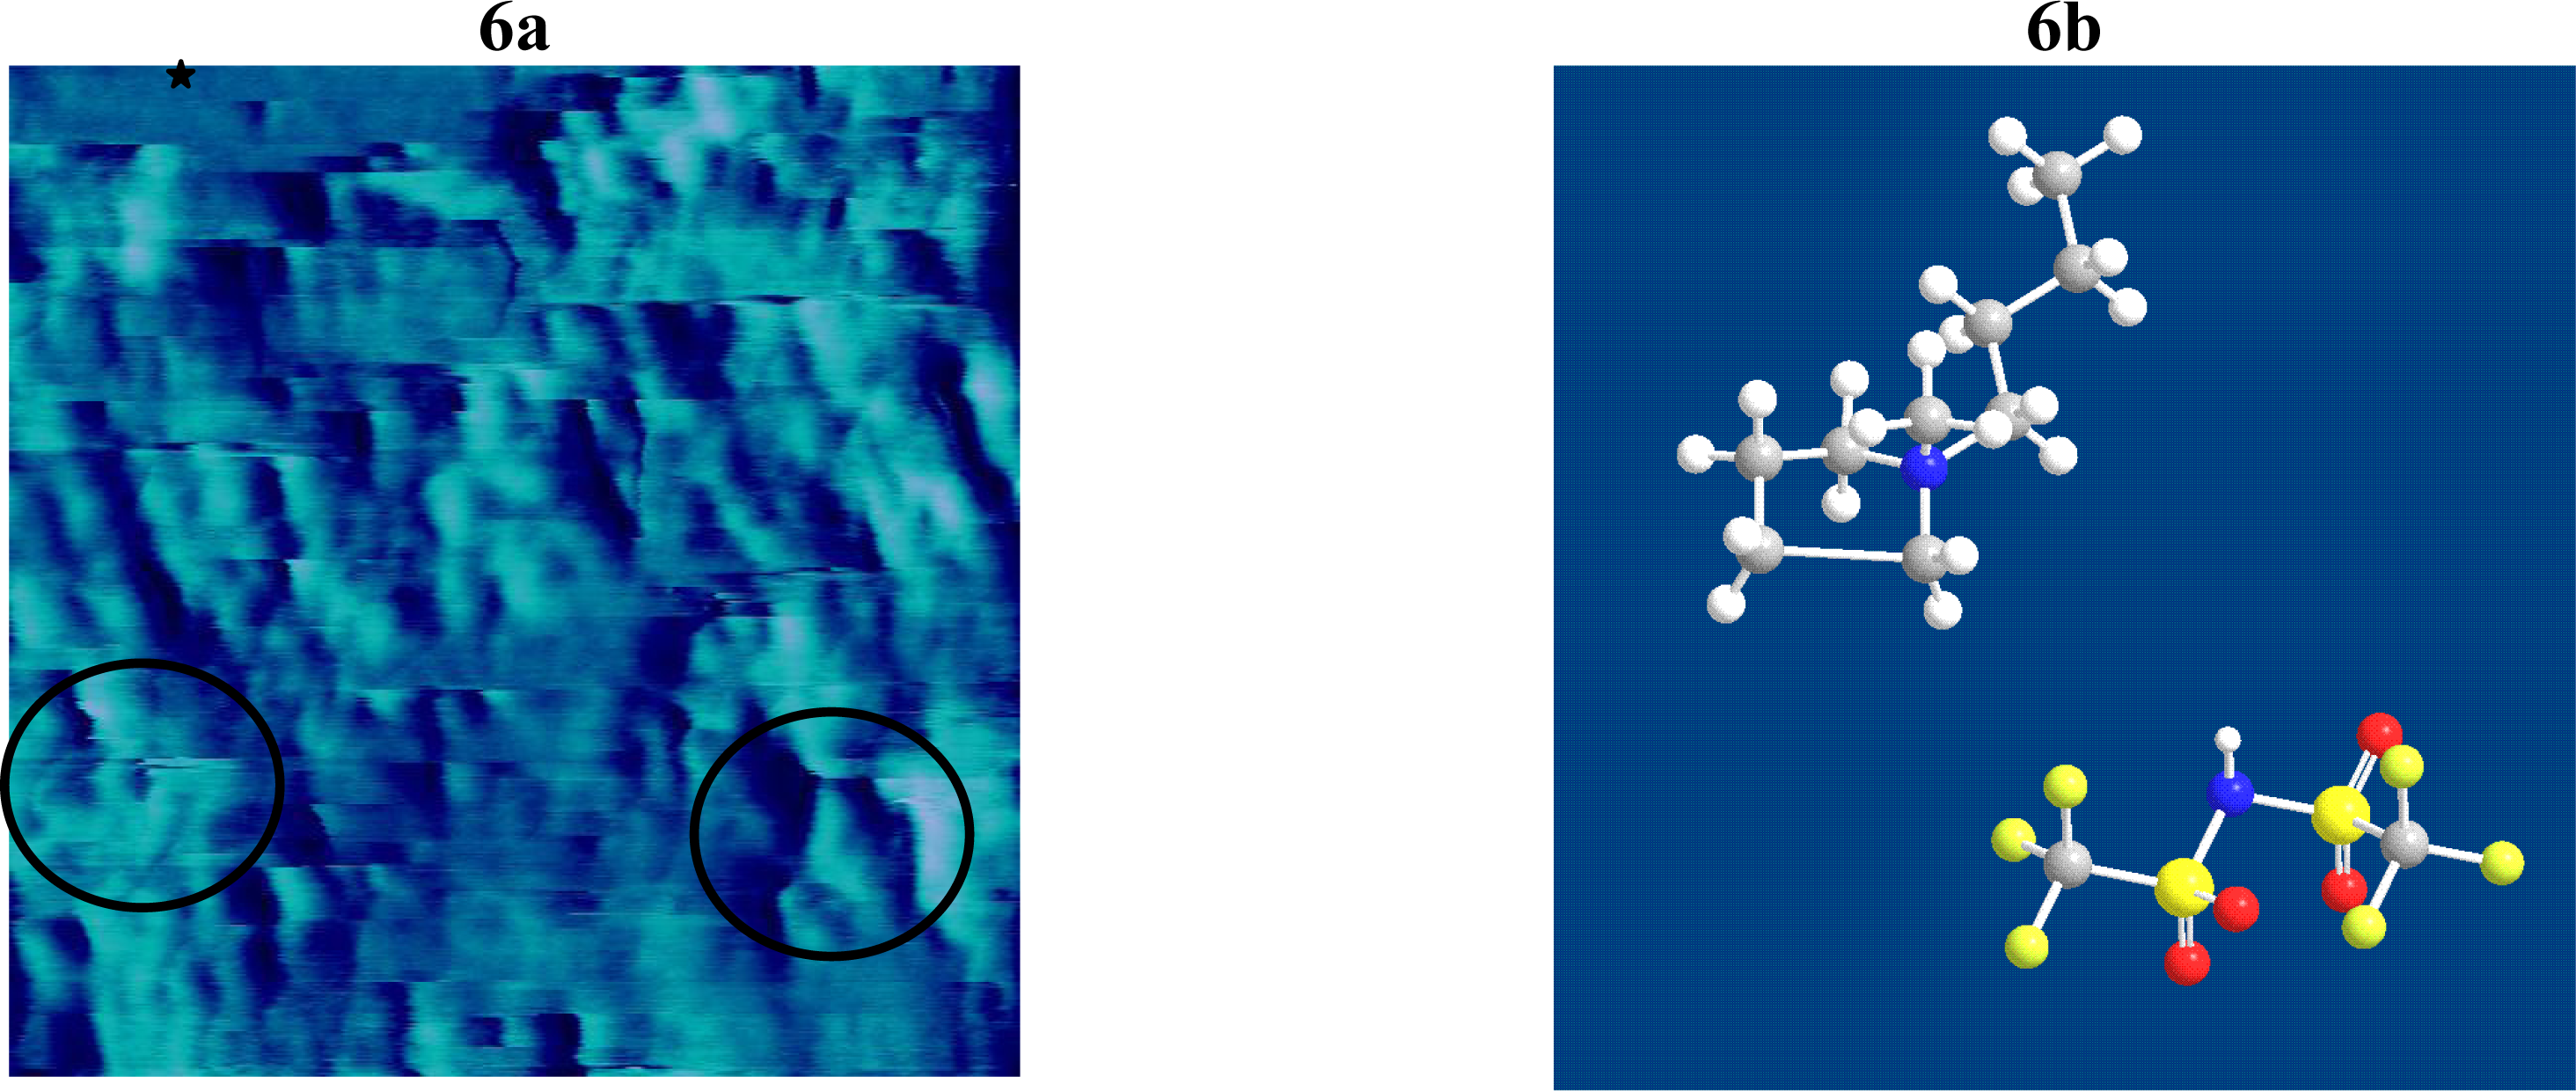
DEPC vesicles were allowed to adsorb to a silica surface to form a supported bilayer. The supported bilayer was incubated with BMP-Tf2N for at least 30 min. Figure 6a shows the typical QCM-D response of a silica crystal at 15, 25, and 35 MHz during the experiment. The data clearly shows a slight increased frequency change after the supported bilayer was exposed to BMP-Tf2N at 52mg/ml and subsequently rinsed several times with buffer. The data also shows a highly dissipative system after the rinses, suggesting the existence of a loosely bound layer. This now loosely bound layer could result from either a thin layer of BMP-Tf2N loosely adsorbing onto the SPB or from BMP-Tf2N molecules that have inserted into the SPB and caused portions of the bilayer to be bound loosely to the silica. Assuming that the frequency change is strictly proportional to mass even when there is large dissipation, then there was an increase in mass after exposure to BMP-Tf2N (table 1) and the former is favored. Figure 6b shows an image of a typical SPB interacting with ~ 52mg/ml BMP-Tf2N after incubation. The image shows a surface that contains uneven or “rippled” features where the roughness over these “rippled” areas is approximately 6 nm, which is considerably greater than the roughness (~0.3 nm) of the same area just prior to BMP-Tf2N. The area roughness (an average height above the surface) of the “rippled” region is in close agreement with the estimate thickness (~5.4 nm; determined from Voight modeling) of the adsorbed material after the buffer rinses. In addition, the area marked by the star (top segment of image) revealed an area of roughness close to the value for the untreated SPB. The interpretation of the AFM and QCM-D data together is that BMP-Tf2N formed a thin layer over the SPB, although lipid removal is not ruled out.
2.4 Conclusions
The present work characterized the nature of the membrane defects created by two RT-IL components of interest, OMIM+ and Tf2N−. It was shown that OMIM+ disrupted a membrane and caused a change in bilayer “softness”. Tf2N−, on the other hand, created large, stable pore-like defects in a SPB. The room-temperature ionic liquid BMP-Tf2N resulted in an adsorbed layer of ionic liquid. Clearly, the tuneability of physical properties of ionic liquid also dictates the effects the ionic liquids have on SPB. And, the combined use of QCM-D and AFM clearly proves to be powerful tools to characterize the different effects ionic liquids exhibit on SPB.
3. Experimental Section
3.1. Extruded unilamellar vesicles preparation
1,2-Dielaidoyl-sn-glycero-3-phosphatidylcholine in chloroform at 10mg/ml (purchased without further purification from Avanti Polar Lipids, Inc., Alabaster, AL) was stored under argon at –20°C. An aliquot of lipids was placed in a brown, amber vial and dried under a gentle stream of argon to achieve a thin film of lipids at the bottom of the vial. Lipids were further dried in a rotary evaporator for an hour and left under house vacuum overnight to remove remaining traces of chloroform. Dried lipids were reconstituted in 10mM potassium phosphate buffer, 100mM NaCl at pH 7 (appropriate amounts of potassium phosphate monobasic - KH2PO4 and dibasic - K2HPO4 from Fisher Scientific at ACS grade or better; NaCl was also from Fisher Scientific) to give a final lipid concentration of 5mM. The rehydrated lipids were kept at room temperature (well-above the phase transition temperature of 13°C) and vortexed periodically for one hour. The multi-unilamellar vesicles created from the periodic vortexing were put through five cycles of freeze-thaw that was carried out in dry ice in 2-propanol (Sigma-Aldrich Chemicals, St. Louis, MO) and nanopure water at 18.2MΩcm (Barnstead Nanopure water purification system, model # D11911) heated to 50°C, respectively. The MUVs were manually extruded 31-times through two 50-nm pore size filters using a LiposoFast hand-held extruder (AVESTIN, Inc, Ottawa, Canada). The sizes of the extruded, unilamellar vesicles were determined through dynamic light scattering (Nicomp Submicron Particle Sizer, Particle Sizing Systems, Inc., Santa Barbara, CA) to have a diameter ~ 83 nm. Vesicles were kept under argon and used within three days of extrusion.
1-Octyl-3-methyl imidazolium chloride and lithium bis(trifluoromethylsulfonyl)imide were purchased (Sigma-Aldrich Chemicals) at the highest purity available and dissolved in PBS to give final stock concentrations of 100 and 500 mM, respectively. All water used was obtained from the above-mentioned water purification system. 1-Butyl-1-methyl pyrrolidinium bis(trifluoromethylsulfonyl)imide was purchased from EMD Chemicals (Gibbstown, NJ). 1-Butyl-1-methyl pyrrolidinium bis(trifluoromethylsulfonyl)imide is only partially miscible with water. Therefore, it was weighed into an empty, clean amber vial using a syringe. Buffer was added and the mixture was vortexed just prior to injection into the cell where a SPB was formed.
3.2. Quartz crystal microbalance with dissipation monitoring
A Q-Sense D300 system with an axial flow sample chamber (Q-Sense, Inc., Glen Burnie, MD) was used to record vesicle adsorption, bilayer formation and interaction with the RT-ILs of interest. A brief background of QCM methods and a complete description of the instrument were presented by Patel and Frank [35] and Rodahl and Kasemo [36], respectively. Briefly, experiments were run such that gravity caused the samples to flow into the crystal chamber. Flow rate was reduced to minimize incomplete mixing. The system was allowed to equilibrate in the buffer for at least 20 min before addition of vesicle to reduce drift. All experiments were conducted at 23°C. Frequency (as well dissipation) shifts were recorded for all four frequencies (the fundamental frequency of 5MHz and the 3rd, 5rd and 7th overtones at 15, 25 and 35MHz, respectively). Data were recorded using Q-Soft 301 software version 1.6.16 and analyzed using Q-Tools software version 2.0.6.79 (software was supplied with Q-Sense system). Silicon dioxide crystals purchased from Q-Sense were cleaned by first rinsing in water followed by an ethanol rinse and drying under a gentle nitrogen stream. The crystals were next placed into an UV/Ozone chamber (Bioforce Nanosciences, Ames, IA) for 10 min [37]. The crystals were submerged in 2 – 4% (v/v) sodium dodecyl sulfate in nanopure water for 30 min to remove any biological contaminants [38, 39], followed by rinses with water and then ethanol, drying with a nitrogen stream, and a final cycle in the UV/Ozone cleaner just prior to use.
3.3 Atomic Force Microscopy
AFM imaging was conducted in PBS using a multimode system equipped with a Nanoscope IV controller, E-scanner and heater (Veeco, Inc., Santa Barbara, CA). A fluid cell with a silicon o-ring was utilized to reduce evaporation. Silicon nitride cantilevers with a nominal spring constant of 0.06 N/m were used. Cantilevers were cleaned by soaking in ethanol for 15 min, allowed to air dry and exposed to UV/ozone for 10 min just prior to use. Fluid cell and tubing were rinsed in water and then ethanol, followed by sonication for 10 min in water and a final rinse of water followed by an ethanol rinse. Fluid cell and tubing were dried using a nitrogen stream. All images were taken in tapping mode, using a minimum force to eliminate any artifacts created by the tip (minimum force was accomplished by maintaining the lowest drive amplitude and lowest set point amplitude possible without loosing contact with the surface). Scan speed was set to 1–2.5 Hz. Silica wafers (Wafer World, Inc., West Palm Beach, FL) were cut to size with a diamond scribe and epoxied onto metal pucks at least 24 hrs prior to imaging. The fluid cell was allowed to equilibrate for 30 min with PBS that was flowed into the cell. Vesicles were flowed into the cell at 125 μM, allowed to adsorb onto the silica surface and form a bilayer within 15 min. Unabsorbed vesicles were flushed away with buffer. The SPB was then exposed to OMIM-Cl (at 100 mM) or LiTf2N (at 500mM) for 15 min, flushed with buffer and imaged after 15–45 min equilibration (PBS and RT-IL were maintained at 20°C).
Acknowledgments
The author is greatly indebted to Kendra Brandon for providing technical assistance in performing the QCM-D measurements for this work and to Garyia Hawkins in performing AFM measurements as a part of a summer research project. Garyia Hawkins was supported through a 2006 Project SEED volunteer fellowship from the American Chemical Society.
- †Product names are necessary to report factually on available data; however, the USDA neither guarantees nor warrants the standard of the product. In addition, the use of the name by the USDA implies no approval of the product to the exclusion of others that may be suitable.
References and Notes
- Hudson, EP; Eppler, RK; Clark, DS. Biocatalysis in semi-aqueous and nearly anhydrous conditions. Curr Opin Biotechnol 2005, 16, 637–643. [Google Scholar]
- Sardessai, YN; Bhosle, S. Industrial potential of organic solvent tolerant bacteria. Biotechnol Prog 2004, 20, 655–660. [Google Scholar]
- Wang, P; Dai, S; Waezsada, SD; Tsao, AY; Davison, BH. Enzyme stabilization by covalent binding in nanoporous sol-gel glass for nonaqueous biocatalysis. Biotechnol Bioeng 2001, 74, 249–255. [Google Scholar]
- Perez, C; Falero, A; Duc, HL; Balcinde, Y; Hung, BR. A very efficient bioconversion of soybean phytosterols mixtures to androstanes by mycobacteria. J Ind Microbiol Biotechnol 2006, 33, 719–723. [Google Scholar]
- Karboune, S; Safari, M; Lue, B-M; Yeboah, FK; Kermasha, S. Lipase-catalyzed biosynthesis of cinnamoylated lipids in a selected organic solvent medium. J Biotechnol 2005, 119, 281–290. [Google Scholar]
- Noureddini, H; Gao, X; Philkana, RS. Immobilized Pseudomonas cepacia lipase for biodiesel fuel production from soybean oil. Bioresourc Technol 2005, 96, 769–777. [Google Scholar]
- Quinn, BM; Ding, Z; Moulton, R; Bard, AJ. Novel Electrochemical Studies of Ionic Liquids. Langmuir 2002, 18, 1734–1742. [Google Scholar]
- Zhao, H; Malhotra, SV. Applications of ionic liquids in organic synthesis. Aldrichim Acta 2002, 35, 75–83. [Google Scholar]
- Xuebing, X. Engineering of enzymatic reactions and reactors for lipid modification and synthesis. Eur J Lipid Sci Technol 2003, 105, 289–304. [Google Scholar]
- Wu, Y; Hu, S. Biosensors based on direct electron transfer in redox proteins. Microchim Acta 2007, 159, 1–17. [Google Scholar]
- Pfruender, H; Jones, R; Weuster-Botz, D. Water immiscible ionic liquids as solvents for whole cell biocatalysis. J Biotechnol BioPerspectives 2006, 124, 182–190. [Google Scholar]
- Reetz, MT; Wiesenhofer, W; Francio, G; Leitner, W. Biocatalysis in ionic liquids: batchwise and continuous flow processes using supercritical carbon dioxide as the mobile phase. Chem Commun (Camb) 2002, 992–993. [Google Scholar]
- Laszlo, JA; Compton, DL. Alpha-chymotrypsin catalysis in imidazolium-based ionic liquids. Biotechnol Bioeng 2001, 75, 181–186. [Google Scholar]
- van Rantwijk, F. Lau, R.M.; Sheldon, R.A. Biocatalytic transformations in ionic liquids. Trends Biotechnol 2003, 21, 131–138. [Google Scholar]
- Yang, Z; Pan, W. Ionic liquids: Green solvents for nonaqueous biocatalysis. Enzyme Microb Technol 2005, 37, 19–28. [Google Scholar]
- Kragl, U; Eckstein, M; Kaftzik, N. Enzyme catalysis in ionic liquids. Curr Opin Biotechnol 2002, 13, 565–571. [Google Scholar]
- Laszlo, JA; Compton, DL. Comparison of peroxidase activities of hemin, cytochrome c and microperoxidase-11 in molecular solvents and imidazolium-based ionic liquids. J Mol Catal B Enzym 2002, 18, 109–120. [Google Scholar]
- Evans, KO. Room-temperature ionic liquid cations act as short-chain surfactants and disintegrate a phospholipid bilayer. Colloids Surf A 2005, 274, 11–17. [Google Scholar]
- Richter, RP; Berat, R; Brisson, AR. Formation of Solid-Supported Lipid Bilayers: An Integrated View. Langmuir 2006, 22, 3497–3505. [Google Scholar]
- Seantier, B; Breffa, C; Felix, O; Decher, G. In situ investigations of the formation of mixed supported lipid bilayers close to the phase transition temperature. Nano Lett 2004, 4, 5–10. [Google Scholar]
- Seantier, B; Breffa, C; Felix, O; Decher, G. Dissipation-Enhanced Quartz Crystal Microbalance Studies on the Experimental Parameters Controlling the Formation of Supported Lipid Bilayers. J Phys Chem B 2005, 109, 21755–21765. [Google Scholar]
- Boudard, S; Seantier, B; Breffa, C; Decher, G; Felix, O. Controlling the pathway of formation of supported lipid bilayers of DMPC by varying the sodium chloride concentration. Thin Solid Films 2006, 495, 246–251. [Google Scholar]
- Richter, R; Mukhopadhyay, A; Brisson, A. Pathways of Lipid Vesicle Deposition on Solid Surfaces: A Combined QCM-D and AFM Study. Biophys J 2003, 85, 3035–3047. [Google Scholar]
- Keller, CA; Kasemo, B. Surface specific kinetics of lipid vesicle adsorption measured with a quartz crystal microbalance. Biophy J 1998, 75, 1397–1402. [Google Scholar]
- Sauerbrey, G. The use of quartz oscillators for weighing thin layers and for microweighing. Z Phys 1959, 155, 206–222. [Google Scholar]
- Reimhult, E; Hook, F; Kasemo, B. Vesicle Adsorption on SiO2 and TiO2: Dependence on Vesicle Size. J Chem Phys 2002, 117, 7401–7404. [Google Scholar]
- Hook, F; Kasemo, B; Nylander, T; Fant, C; Sott, K; Elwing, H. Variations in coupled water, viscoelastic properties, and film thickness of a Mefp-1 protein film during adsorption and cross-linking: a quartz crystal microbalance with dissipation monitoring, ellipsometry, and surface plasmon resonance study. Anal Chem 2001, 73, 5796–5804. [Google Scholar]
- Daikhin, L; Urbakh, M. Effect of Surface Film Structure on the Quartz Crystal Microbalance Response in Liquids. Langmuir 1996, 12, 6354–6360. [Google Scholar]
- Leonenko, ZV; Carnini, A; Cramb, DT. Supported planar bilayer formation by vesicle fusion: the interaction of phospholipid vesicles with surfaces and the effect of gramicidin on bilayer properties using atomic force microscopy. Biochim Biophys Acta Biomemb 2000, 1509, 131–147. [Google Scholar]
- Singh, T; Kumar, A. Aggregation Behavior of Ionic Liquids in Aqueous Solutions: Effect of Alkyl Chain Length, Cations, and Anions. J Phys Chem B 2007, 111, 7843–7851. [Google Scholar]
- Bowers, J; Butts, CP; Martin, PJ; Vergara-Gutierrez, MC. Aggregation Behavior of Aqueous Solutions of Ionic Liquids. Langmuir 2004, 20, 2191–2198. [Google Scholar]
- Leroueil, PR; Berry, SA; Duthie, K; Han, G; Rotello, VM; McNerny, DQ; Baker, JR; Orr, BG; BanaszakHoll, MM. Wide Varieties of Cationic Nanoparticles Induce Defects in Supported Lipid Bilayers. Nano Lett 2008, 8, 420–424. [Google Scholar]
- Mecke, A; Majoros, IJ; Patri, AK; Baker, JR; BanaszakHoll, MM; Orr, BG. Lipid Bilayer Disruption by Polycationic Polymers: The Roles of Size and Chemical Functional Group. Langmuir 2005, 21, 10348–10354. [Google Scholar]
- Hong, S; Bielinska, AU; Mecke, A; Keszler, B; Beals, JL; Shi, X; Balogh, L; Orr, BG; Baker, JR; BanaszakHoll, MM. Interaction of Poly(amidoamine) Dendrimers with Supported Lipid Bilayers and Cells: Hole Formation and the Relation to Transport. Bioconjugate Chem 2004, 15, 774–782. [Google Scholar]
- Patel, AR; Frank, CW. Quantitative Analysis of Tethered Vesicle Assemblies by Quartz Crystal Microbalance with Dissipation Monitoring: Binding Dynamics and Bound Water Content. Langmuir 2006, 22, 7587–7599. [Google Scholar]
- Rodahl, M; Kasemo, B. A simple setup to simultaneously measure the resonant frequency and the absolute dissipation factor of a quartz crystal microbalance. Rev Sci Instrum 1996, 67, 3238–3241. [Google Scholar]
- Krozer, A; Rodahl, M. X-ray photoemission spectroscopy study of UV/ozone oxidation of Au under ultrahigh vacuum conditions. J Vac Sci Technol A 1997, 15, 1704–1709. [Google Scholar]
- Harewood, K; Wolff, JSI. A rapid electrophoretic procedure for the detection of SDS-released oncorna-viral RNA using polyacrylamide-agarose gels. Anal Biochem 1973, 55, 573–581. [Google Scholar]
- Penfold, J; Staples, E; Tucker, I; Thomas, RK. Adsorption of Mixed Anionic and Nonionic Surfactants at the Hydrophilic Silicon Surface. Langmuir 2002, 18, 5755–5760. [Google Scholar]
Figure 1.
QCM-D response at 15 (black), 25 (red) and 35 (green) MHz as DEPC vesicles form a SPB on SiO2 and interact with 1-octyl-3-methyl imidazolium chloride at 20°C.
Figure 1.
QCM-D response at 15 (black), 25 (red) and 35 (green) MHz as DEPC vesicles form a SPB on SiO2 and interact with 1-octyl-3-methyl imidazolium chloride at 20°C.
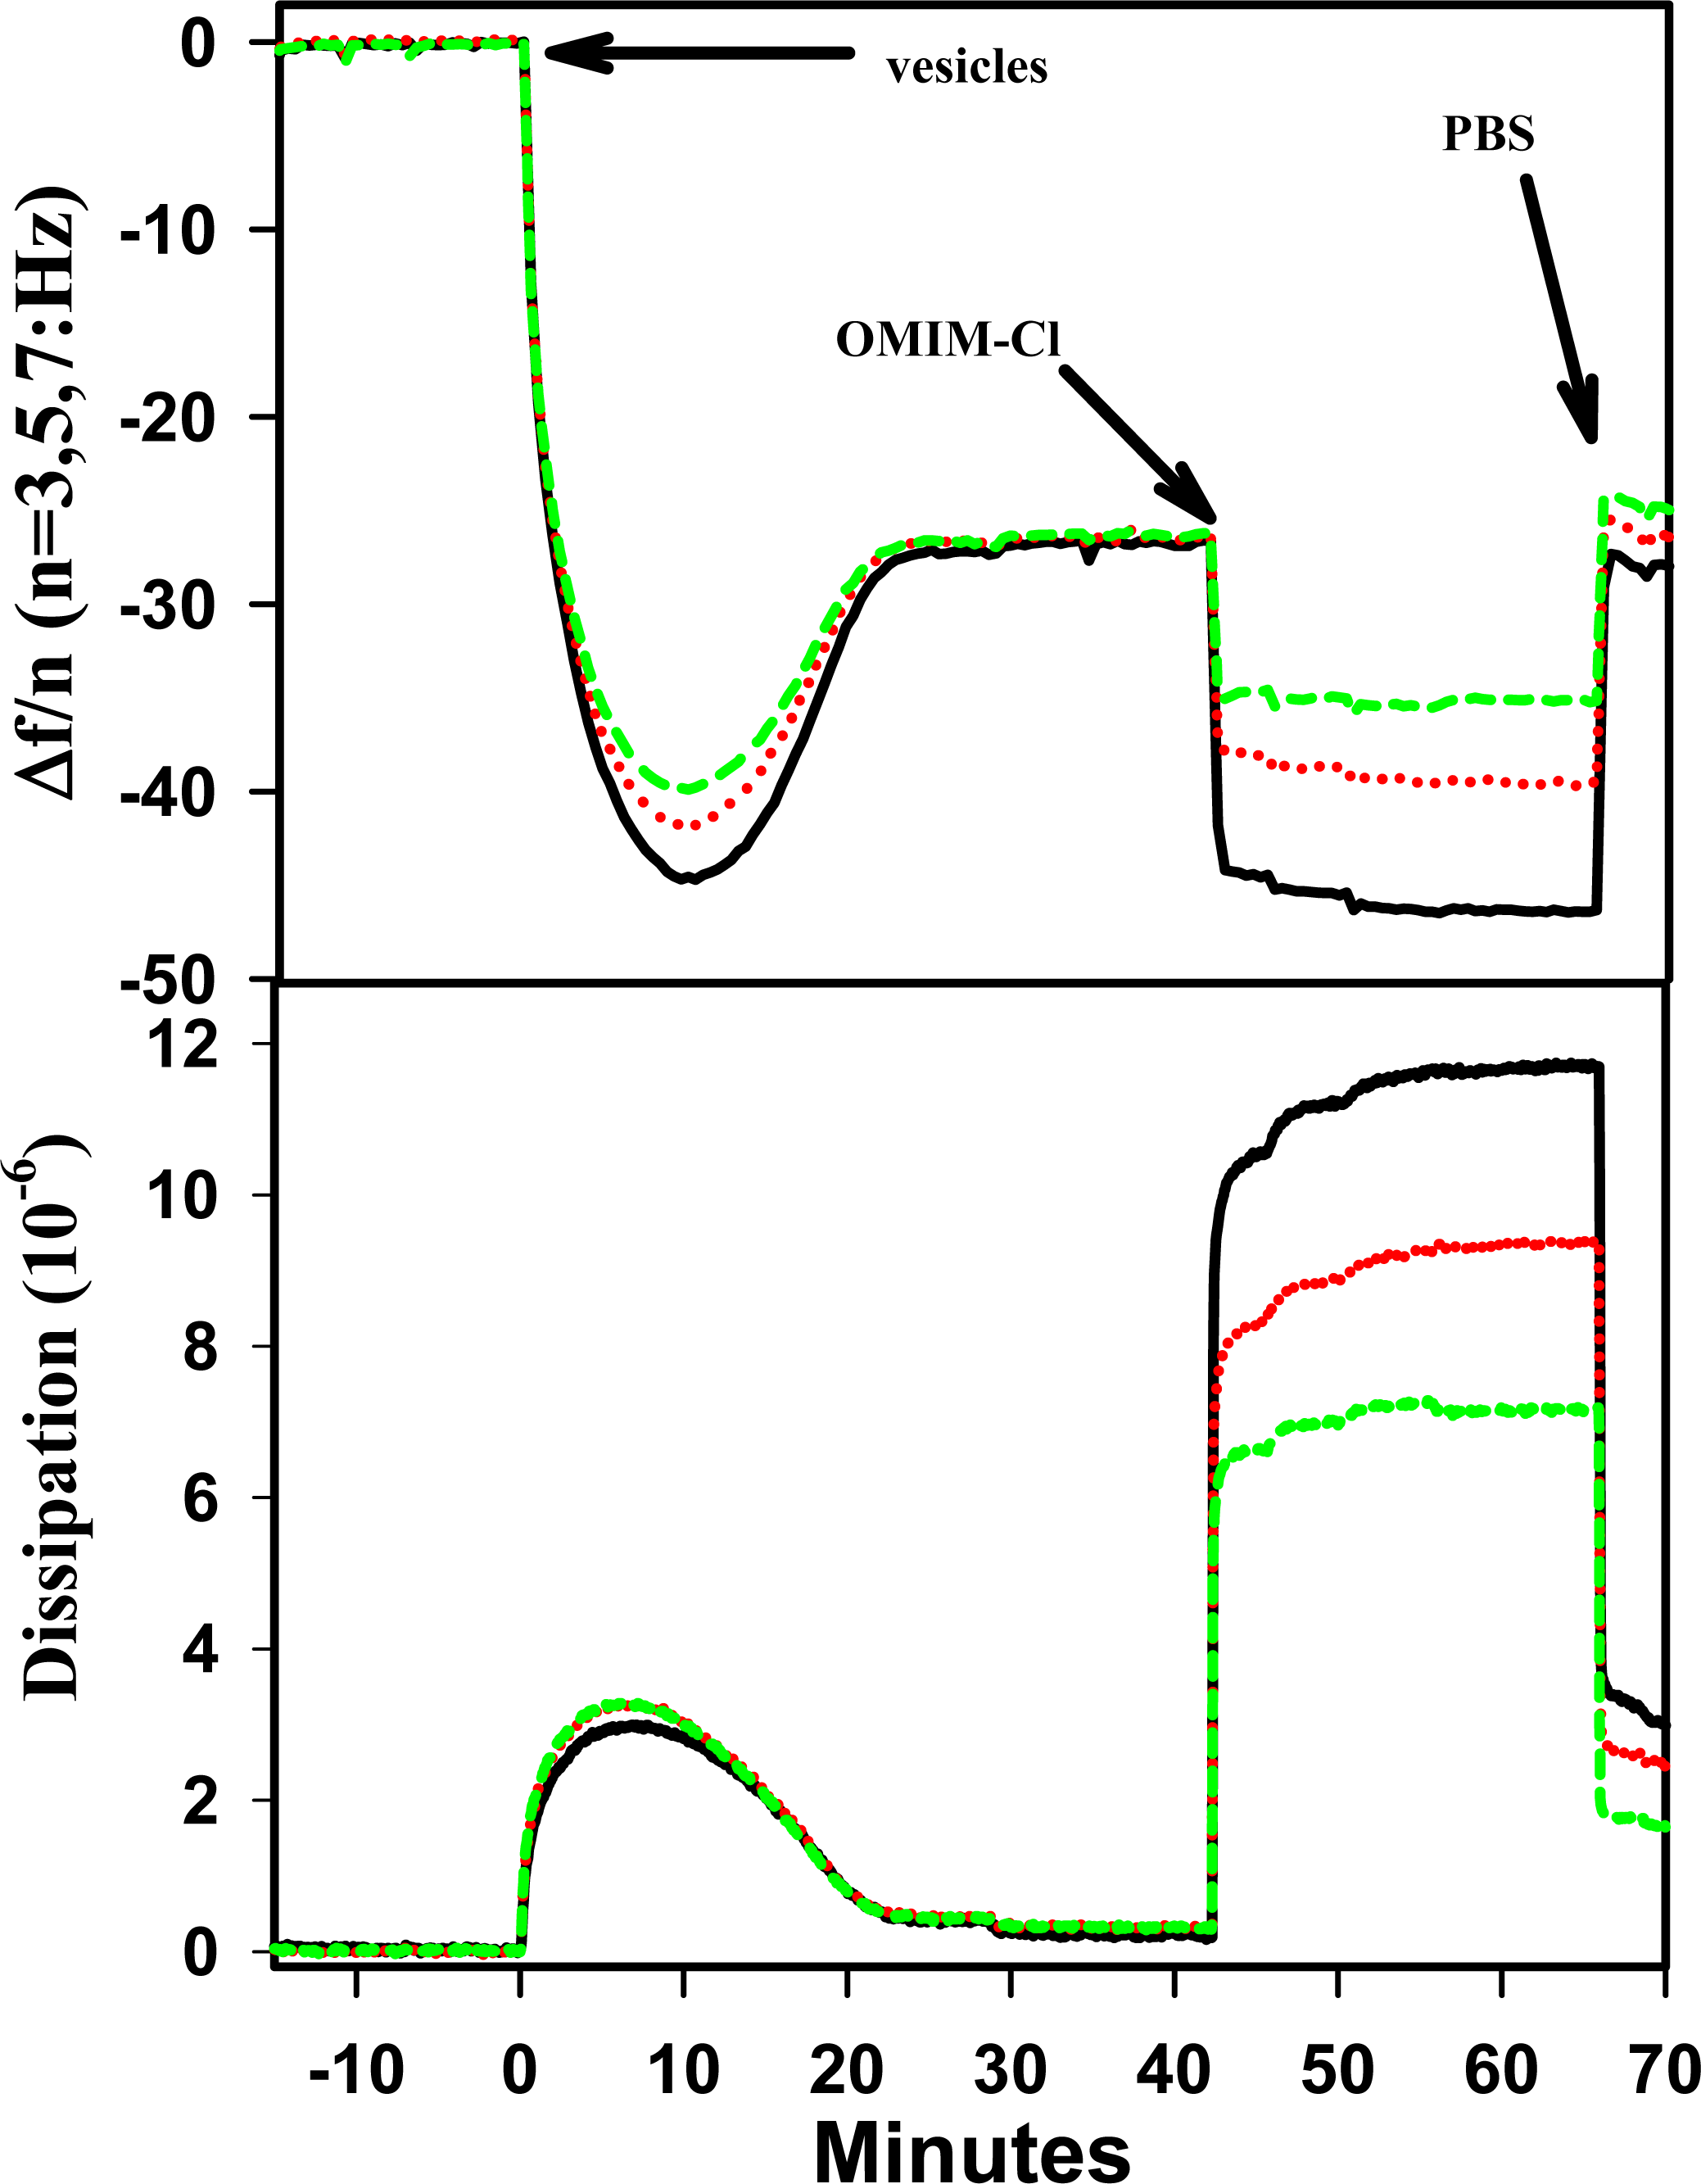
Figure 2.
AFM image of DEPC SPB after 15 min exposure to OMIM-Cl in PBS (10mM potassium phosphate, 100mM NaCl, pH 7) solution. Scan size was 400 × 400 nm2 in tapping mode with a minimum force by keeping the amplitude set point and drive amplitude as low as possible. (a) SPB prior to OMIM-Cl exposure; (b) SPB after 15min exposure to OMIM-Cl; (c) Cross-section graph of the topography of the SPB after exposure to OMIM-Cl for 15 min displays the “hills and valleys” that remain; (d) Phase image of SPB after exposure to OMIM-Cl; (e) space-filled model of OMIM+.
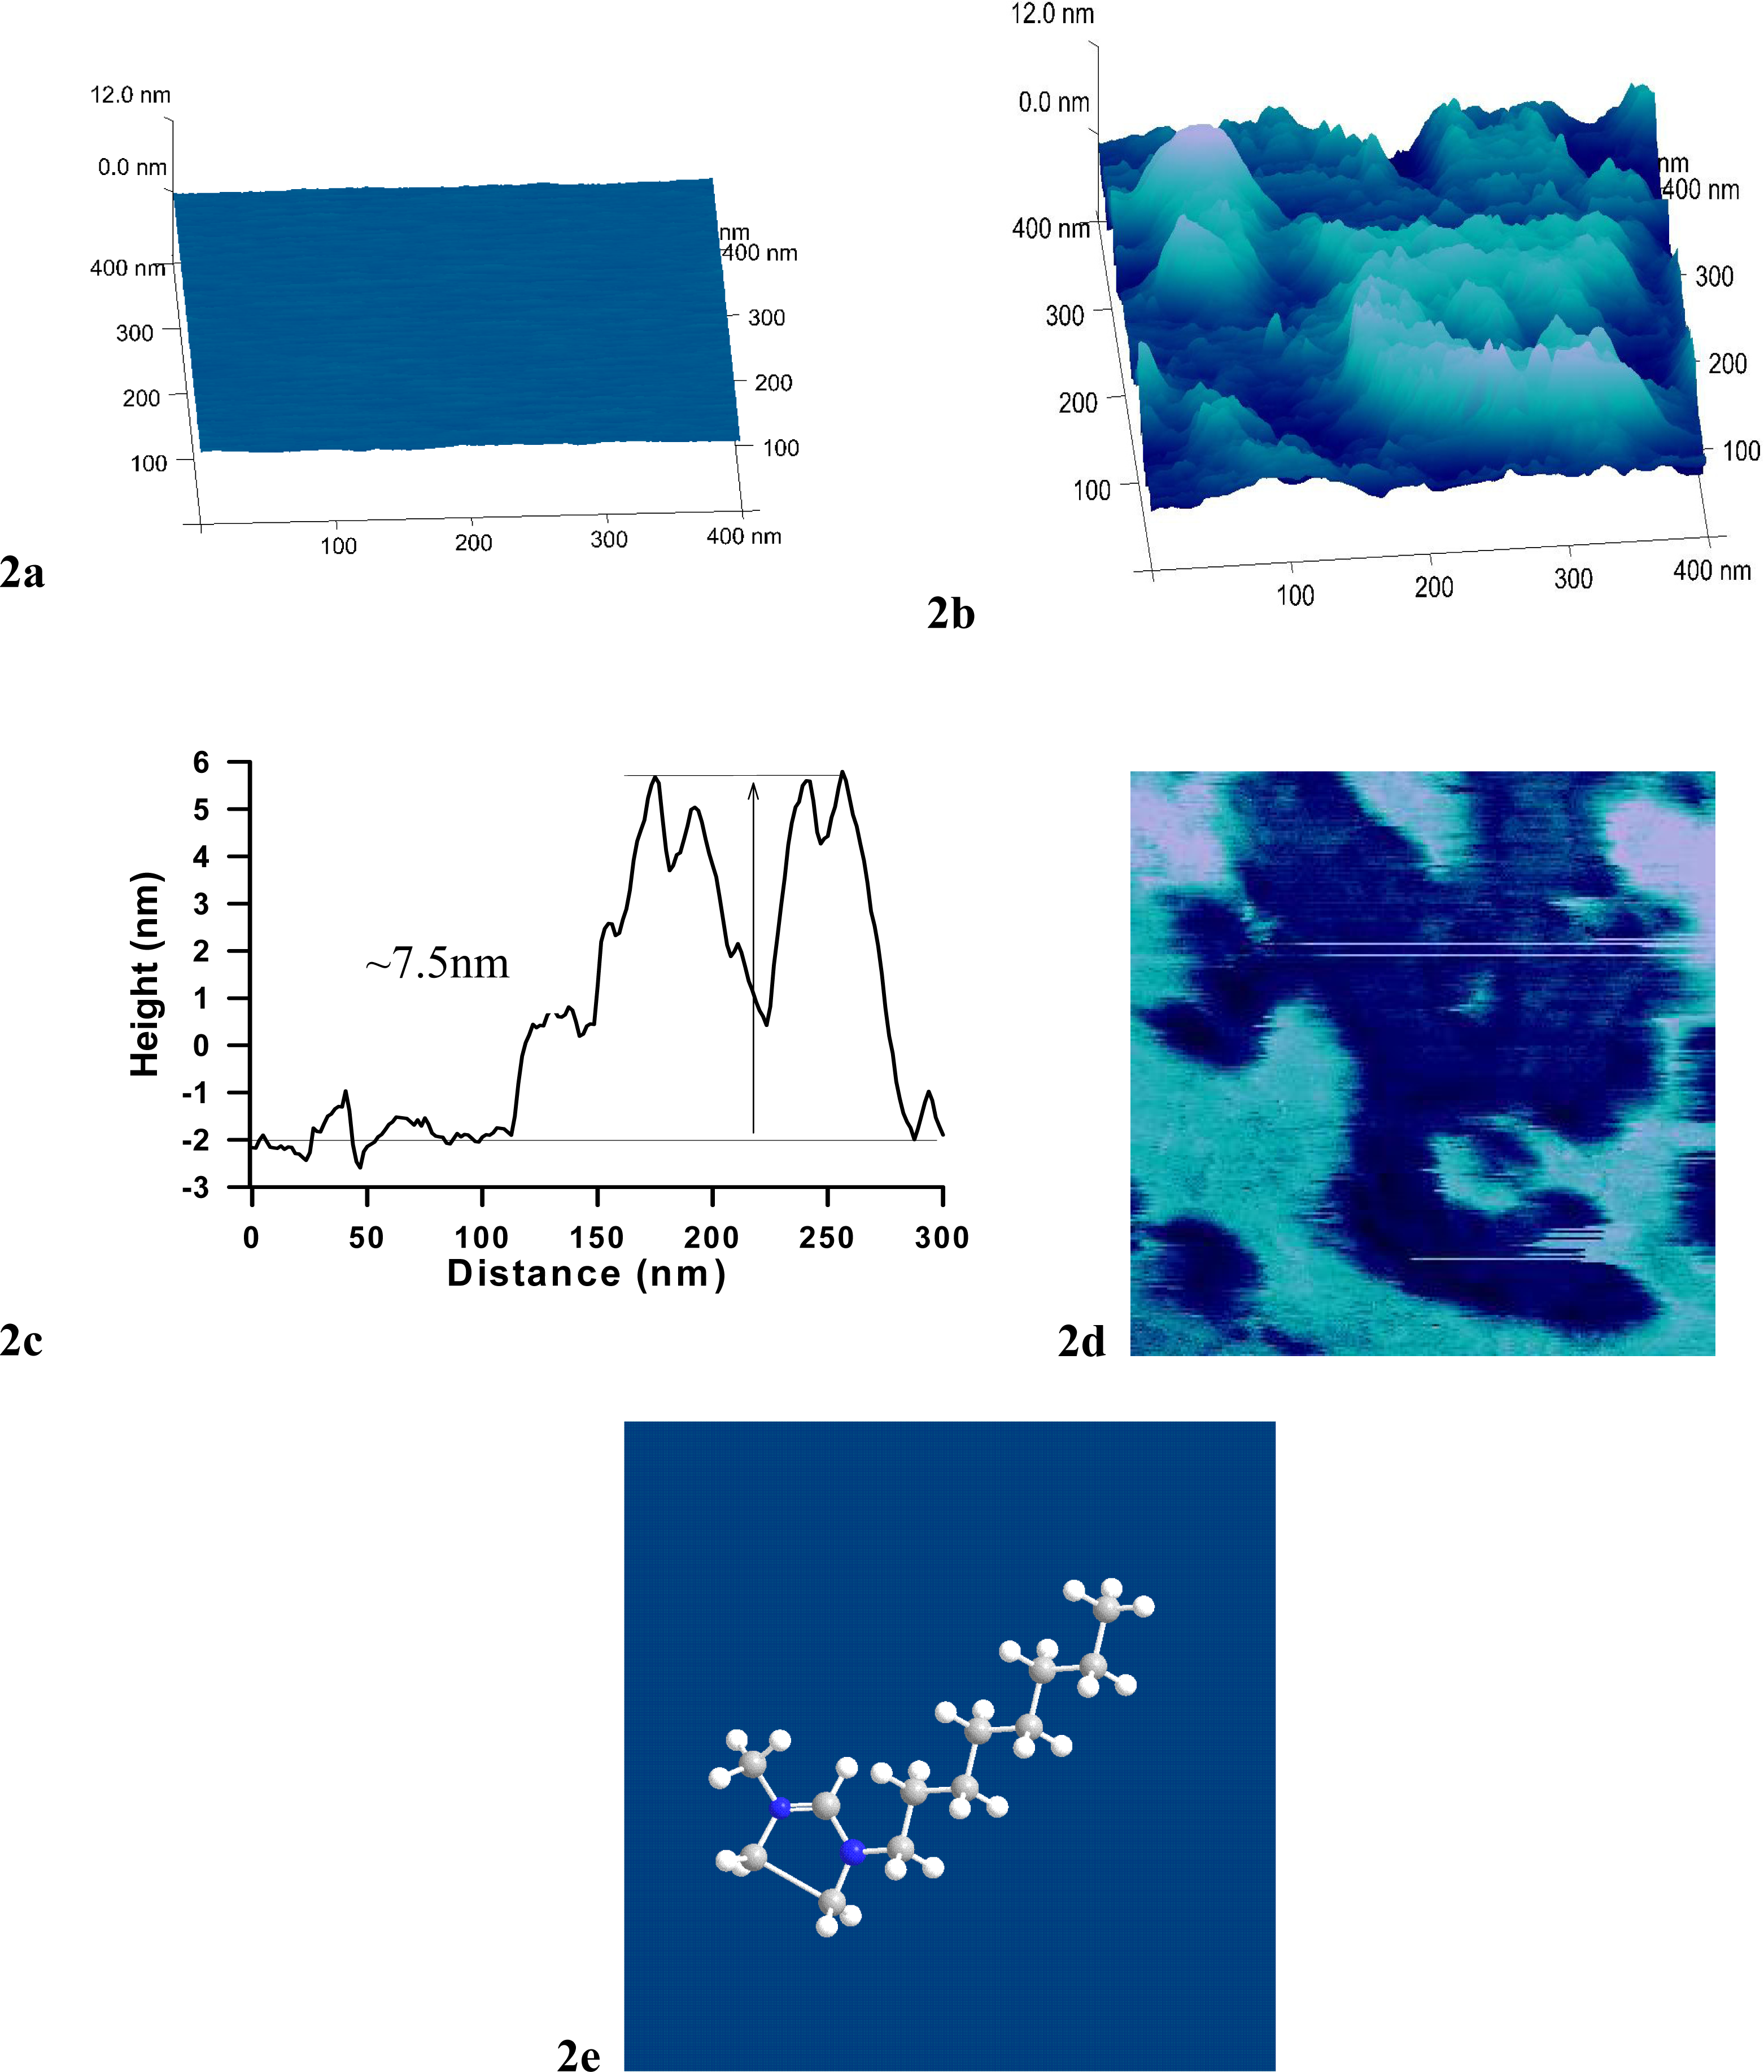
Figure 3.
QCM-D response (at 15, 25, and 35 MHz) during DEPC SPB formation and interaction with lithium bis(trifluoromethylsulfonyl)imide (Tf2N−) at 500mM on SiO2 at 20°C. (The peak feature after rinsing the ionic liquid away is due to incomplete mixing of the two solutions).
Figure 3.
QCM-D response (at 15, 25, and 35 MHz) during DEPC SPB formation and interaction with lithium bis(trifluoromethylsulfonyl)imide (Tf2N−) at 500mM on SiO2 at 20°C. (The peak feature after rinsing the ionic liquid away is due to incomplete mixing of the two solutions).

Figure 4.
(a) TM-AFM image of DEPC SPB after exposure to LiTf2N for 15 min. (b) Height profile of typical defects found in a SPB after exposure to LiTf2N; (c) space-filled model of Tf2N−.
Figure 4.
(a) TM-AFM image of DEPC SPB after exposure to LiTf2N for 15 min. (b) Height profile of typical defects found in a SPB after exposure to LiTf2N; (c) space-filled model of Tf2N−.
Figure 5.
Typical QCM-D response (at 15, 25, and 35 MHz) during DEPC SPB formation and interaction with 1-butyl-1-methylpyrrolidinium bis(trifluoromethylsulfonyl)imide (BMP-Tf2N) on SiO2 at 20°C. (The spike feature after adding the ionic liquid is due to a temperature surge).
Figure 5.
Typical QCM-D response (at 15, 25, and 35 MHz) during DEPC SPB formation and interaction with 1-butyl-1-methylpyrrolidinium bis(trifluoromethylsulfonyl)imide (BMP-Tf2N) on SiO2 at 20°C. (The spike feature after adding the ionic liquid is due to a temperature surge).
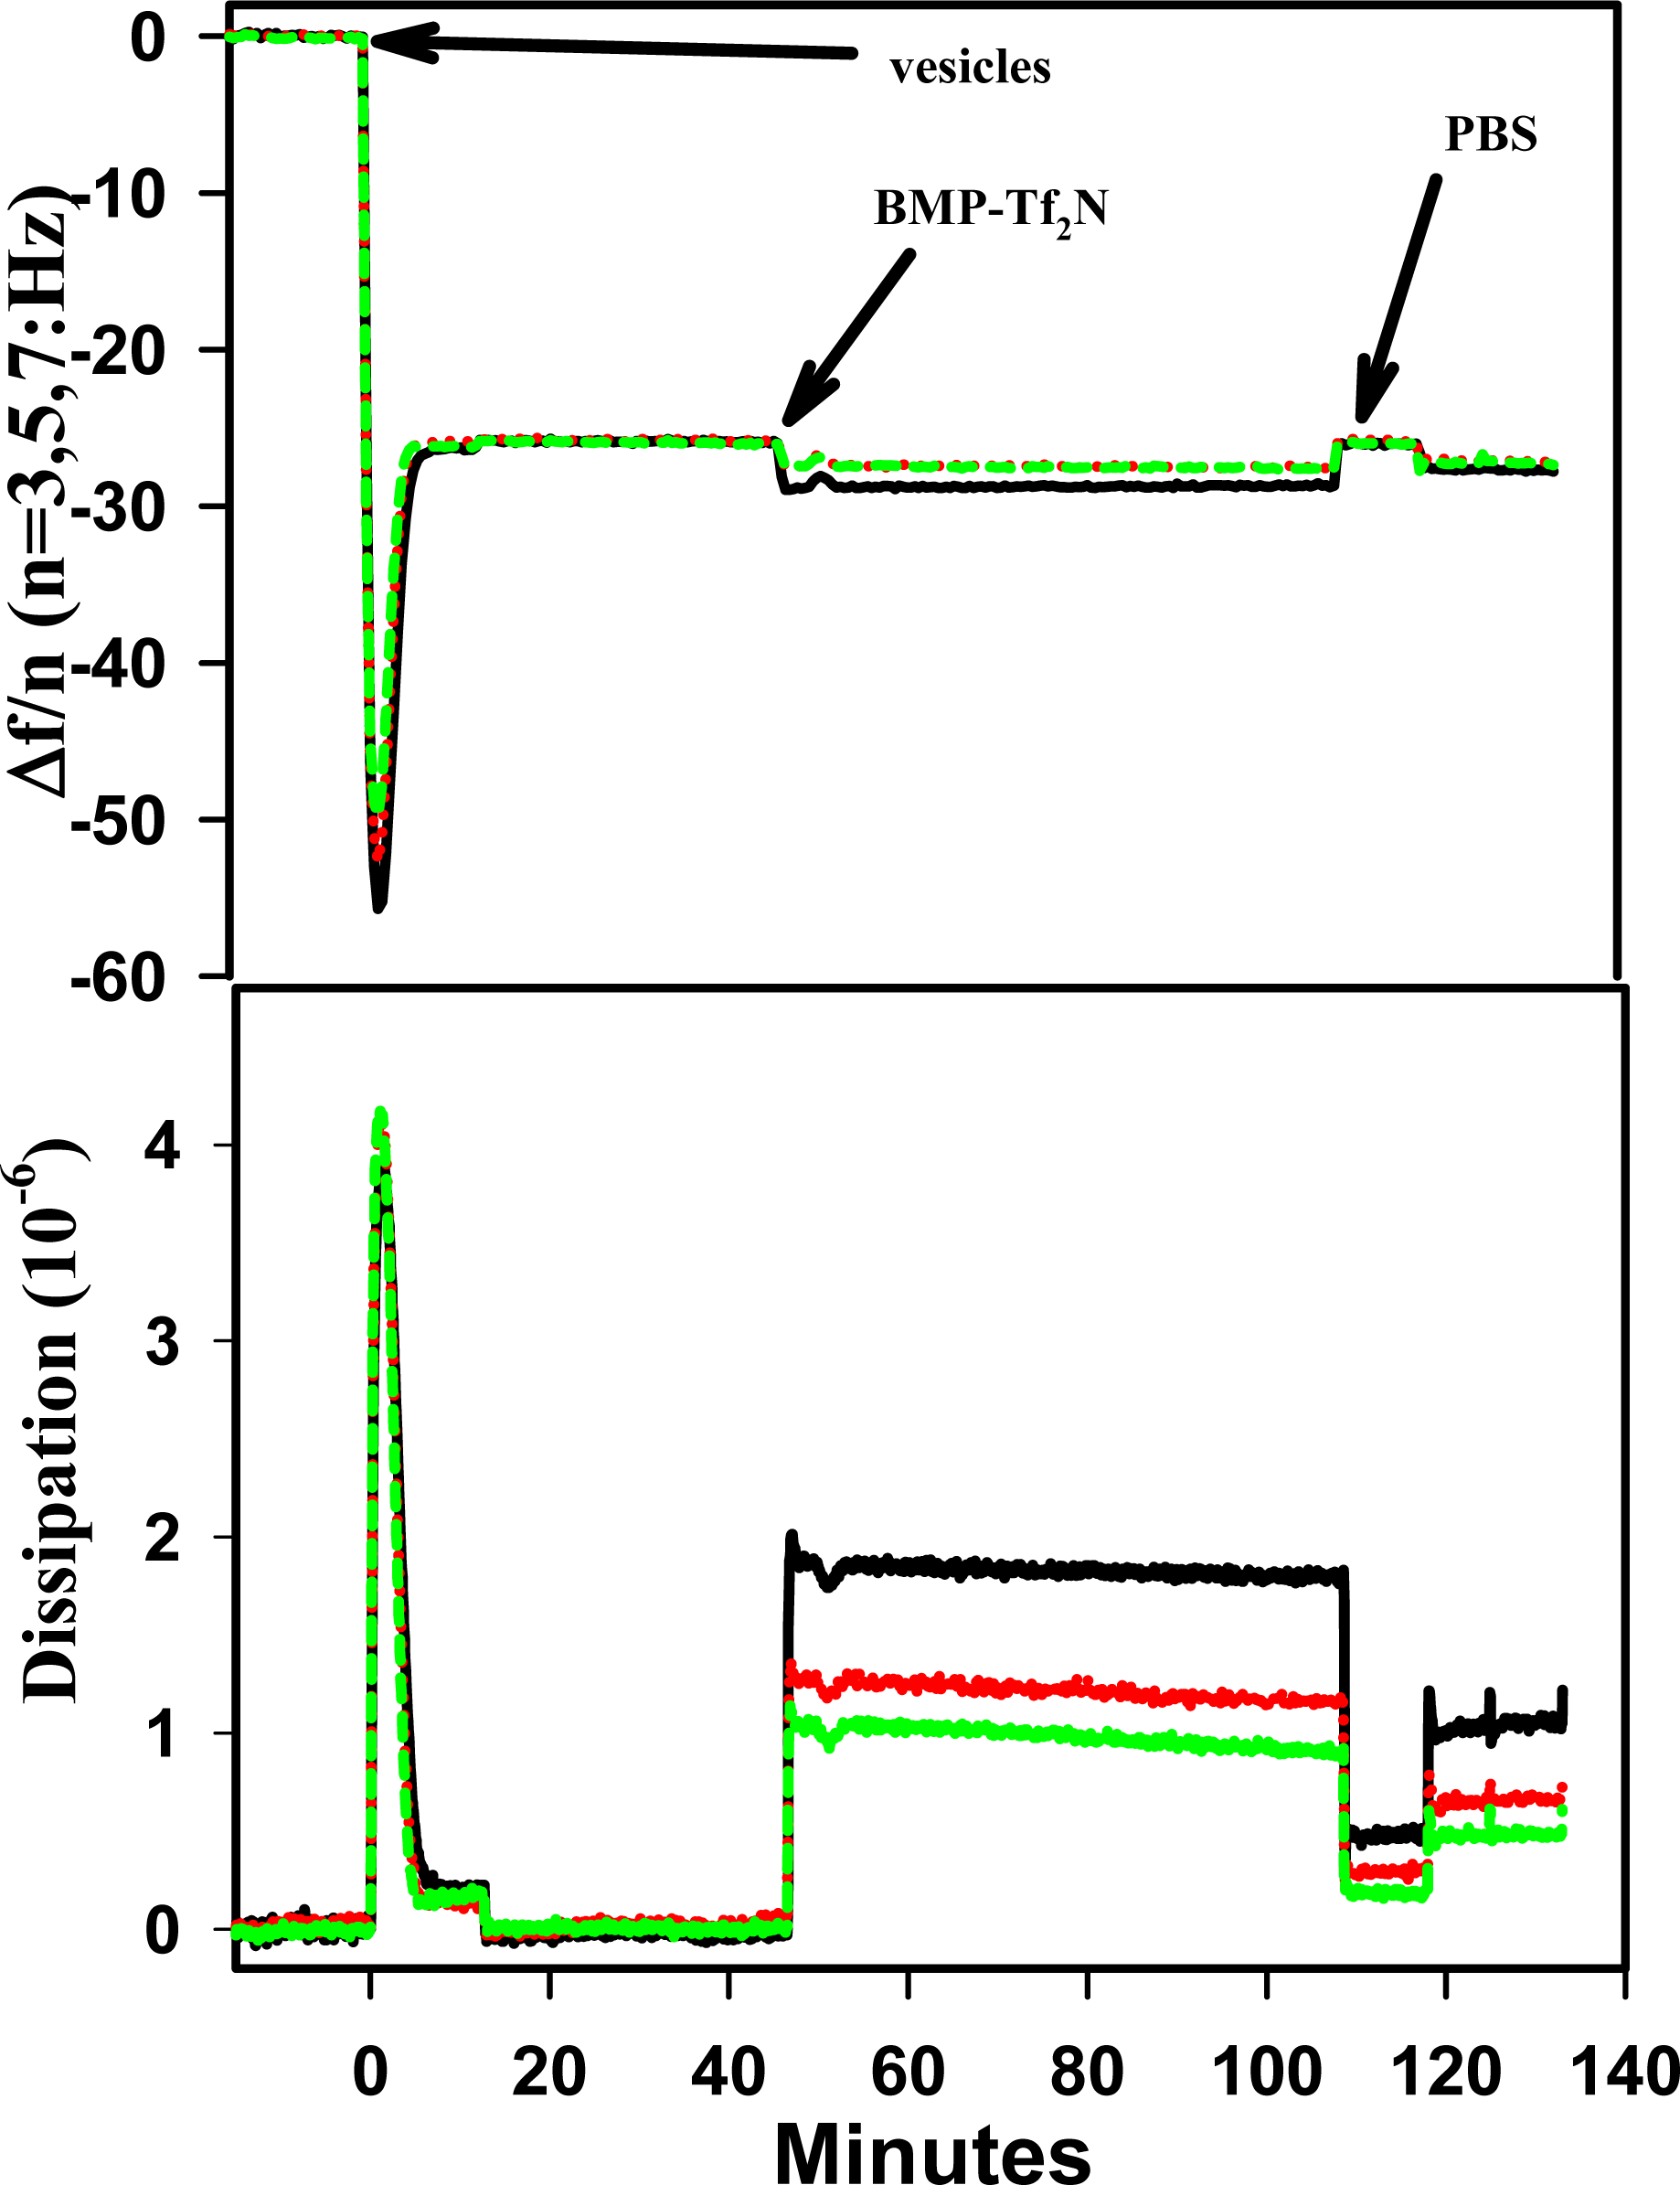
Figure 6.
(a) Tapping Mode-AFM topographical image of BMP-Tf2N effects on a SPB on silica. The black star highlights an area as smooth as an untreated SPB; circles highlight areas where ripples were formed; (b) Chem3D Pro structure of BMP-Tf2N.
Figure 6.
(a) Tapping Mode-AFM topographical image of BMP-Tf2N effects on a SPB on silica. The black star highlights an area as smooth as an untreated SPB; circles highlight areas where ripples were formed; (b) Chem3D Pro structure of BMP-Tf2N.

| RT-IL Component | Δ f3 (Hz) a, b | Δ D3 (10-6) b | Mass (ng/cm2) c | |||
|---|---|---|---|---|---|---|
| Before | After | Before | After | Before | After | |
| OMIM+ | –29.0 ± 3.2 | –24.2 ± 5.5 | 0.61 ± 1.2 | 1.1 ± 2.1 | 522 ± 58 | 437 ± 97 |
| Tf2N- | –30.0 ± 2.6 | –25.0 ± 2.4 | 0.36 ± 0.47 | 0.026 ± 0.005 | 542 ± 32 | 452 ± 20 |
| BMP-Tf2N | –26.0 ± 0.1 | –28.2 ± 0.8 | 0.03 ± 0.08 | 1.1 ± 0.1 | 460 ± 3 | 500 ± 14 |
(a) Standard deviation was determined from 2 or 3 experiments;
(b) Frequency and dissipation values were reported from the 3rd overtone;
(c) Sauerbrey relationship was used to estimate the mass.
Share and Cite
MDPI and ACS Style
Evans, K.O. Supported Phospholipid Bilayer Interaction with Components Found in Typical Room-Temperature Ionic Liquids – a QCM-D and AFM Study. Int. J. Mol. Sci. 2008, 9, 498-511. https://doi.org/10.3390/ijms9040498
AMA Style
Evans KO. Supported Phospholipid Bilayer Interaction with Components Found in Typical Room-Temperature Ionic Liquids – a QCM-D and AFM Study. International Journal of Molecular Sciences. 2008; 9(4):498-511. https://doi.org/10.3390/ijms9040498
Chicago/Turabian StyleEvans, Kervin O. 2008. "Supported Phospholipid Bilayer Interaction with Components Found in Typical Room-Temperature Ionic Liquids – a QCM-D and AFM Study" International Journal of Molecular Sciences 9, no. 4: 498-511. https://doi.org/10.3390/ijms9040498