Article

Branched-chain Amino Acid Biosensing Using Fluorescent Modified Engineered Leucine/Isoleucine/Valine Binding Protein

1
Department of Biotechnology, Graduate School of Engineering, Tokyo University of Agriculture & Technology, 2-24-16 Naka-cho, Koganei, Tokyo 184-8588, Japan
2
Department of Technology Risk Management, Graduate School of Technology Management- Tokyo University of Agriculture & Technology, 2-24-16 Naka-cho, Koganei, Tokyo 184-8588, Japan
*
Author to whom correspondence should be addressed.
Int. J. Mol. Sci. 2007, 8(6), 513-525; https://doi.org/10.3390/i8060513
Submission received: 20 December 2006 / Revised: 23 April 2007 / Accepted: 12 May 2007 / Published: 13 June 2007
(This article belongs to the Section Molecular Recognition)

Abstract

:
A novel fluorescence sensing system for branched-chain amino acids (BCAAs) was developed based on engineered leucine/isoleucine/valine-binding proteins (LIVBPs) conjugated with environmentally sensitive fluorescence probes. LIVBP was cloned from Escherichia coli and Gln149Cys, Gly227Cys, and Gln254Cys mutants were generated by genetic engineering. The mutant LIVBPs were then modified with environmentally sensitive fluorophores. Based on the fluorescence intensity change observed upon the binding of the ligands, the MIANS-conjugated Gln149Cys mutant (Gln149Cys-M) showed the highest and most sensitive response. The BCAAs Leu, Ile, and Val can each be monitored at the sub-micromolar level using Gln149Cys-M. Measurements were also carried out on a mixture of BCAFAs and revealed that Gln149Cys-M-based measurement is not significantly affected by the change in the molar ratio of Leu, Ile and Val in the sample. Its high sensitivity and group-specific molecular recognition ability make the new sensing system ideally suited for the measurement of BCAAs and the determination of the Fischer ratio, an indicator of hepatic disease involving metabolic dysfunction.

1. Introduction

Periplasmic binding proteins from Gram-negative bacteria (periplasmic proteins; PBPs) serve as essential primary receptors for the transport of carbohydrates, amino acids, anions, metal ions, and peptides [15]. PBPs are monomeric and consist of two domains linked by a hinge region. The ability of PBPs to undergo drastic conformational changes upon binding with the target molecule has led to the design of several novel biosensing systems [6]. A number of PBPs have recently been successfully used as scaffolds for the development of fluorescence nanosensors through modification with appropriately positioned fluorescent probes [7]. PBPs labeled with environmentally sensitive fluorophores undergo changes in fluorescence intensity or emission spectra when binding with their corresponding target molecules.
One of the advantageous properties of PBPs is their ligand specificity. However, the specificities of PBPs are strongly dependent on the nature and role of the transport system in the original microorganisms, where they usually serve a role in group-specific transport systems. For example, leucine/isoleucine/valine-binding protein (LIVBP) is a component of the branched chain amino-acid group-specific transport system in Escherichia coli. [8]. LIVBP is a periplasmic water-soluble protein with a molecular!weight of 37 kDa. LIVBP binds with the branched-chain amino acids (BCAAs) Leu (Kd = 2.3 μM), Ile (Kd = 0.9 μM) and Val (Kd = 4.0 μM) [9]. However, there have been no reports to date on the application of LIVBP to biosensing.
Metabolic abnormalities involving free amino acids in plasma, particularly the BCAAs L-Leu, L-Ile, and L-Val, as well as aromatic amino acids (AAAs) and methionine are frequently observed in patients with hepatic disorders [10]. The Fischer ratio, or the ratio of the concentration of BCAAs to the concentration of AAAs, is recognized and has been utilized as an indicator of hepatic disease involving metabolic dysfunctions since it was defined in the 1970’s [1115]. In the past, these amino acids have been determined by HPLC, gas chromatography or enzymatic spectrophotometry![1619]. Considering the future potential of PBPs in clinical diagnosis, we hereby propose the application of LIVBP for BCAA measurement focusing on its group-specific molecular recognition property.
In this paper, we describe the development of a novel biosensing system for BCAAs based on fluorescence-probe-conjugated engineered LIVBP. Engineered LIVBPs were generated on which environmentally sensitive fluorophores were site-specifically conjugated. Based on the fluorescence intensity change observed upon the binding of the ligands, the BCAA concentration was determined at the sub-micromolar level.

2. Results and Discussion

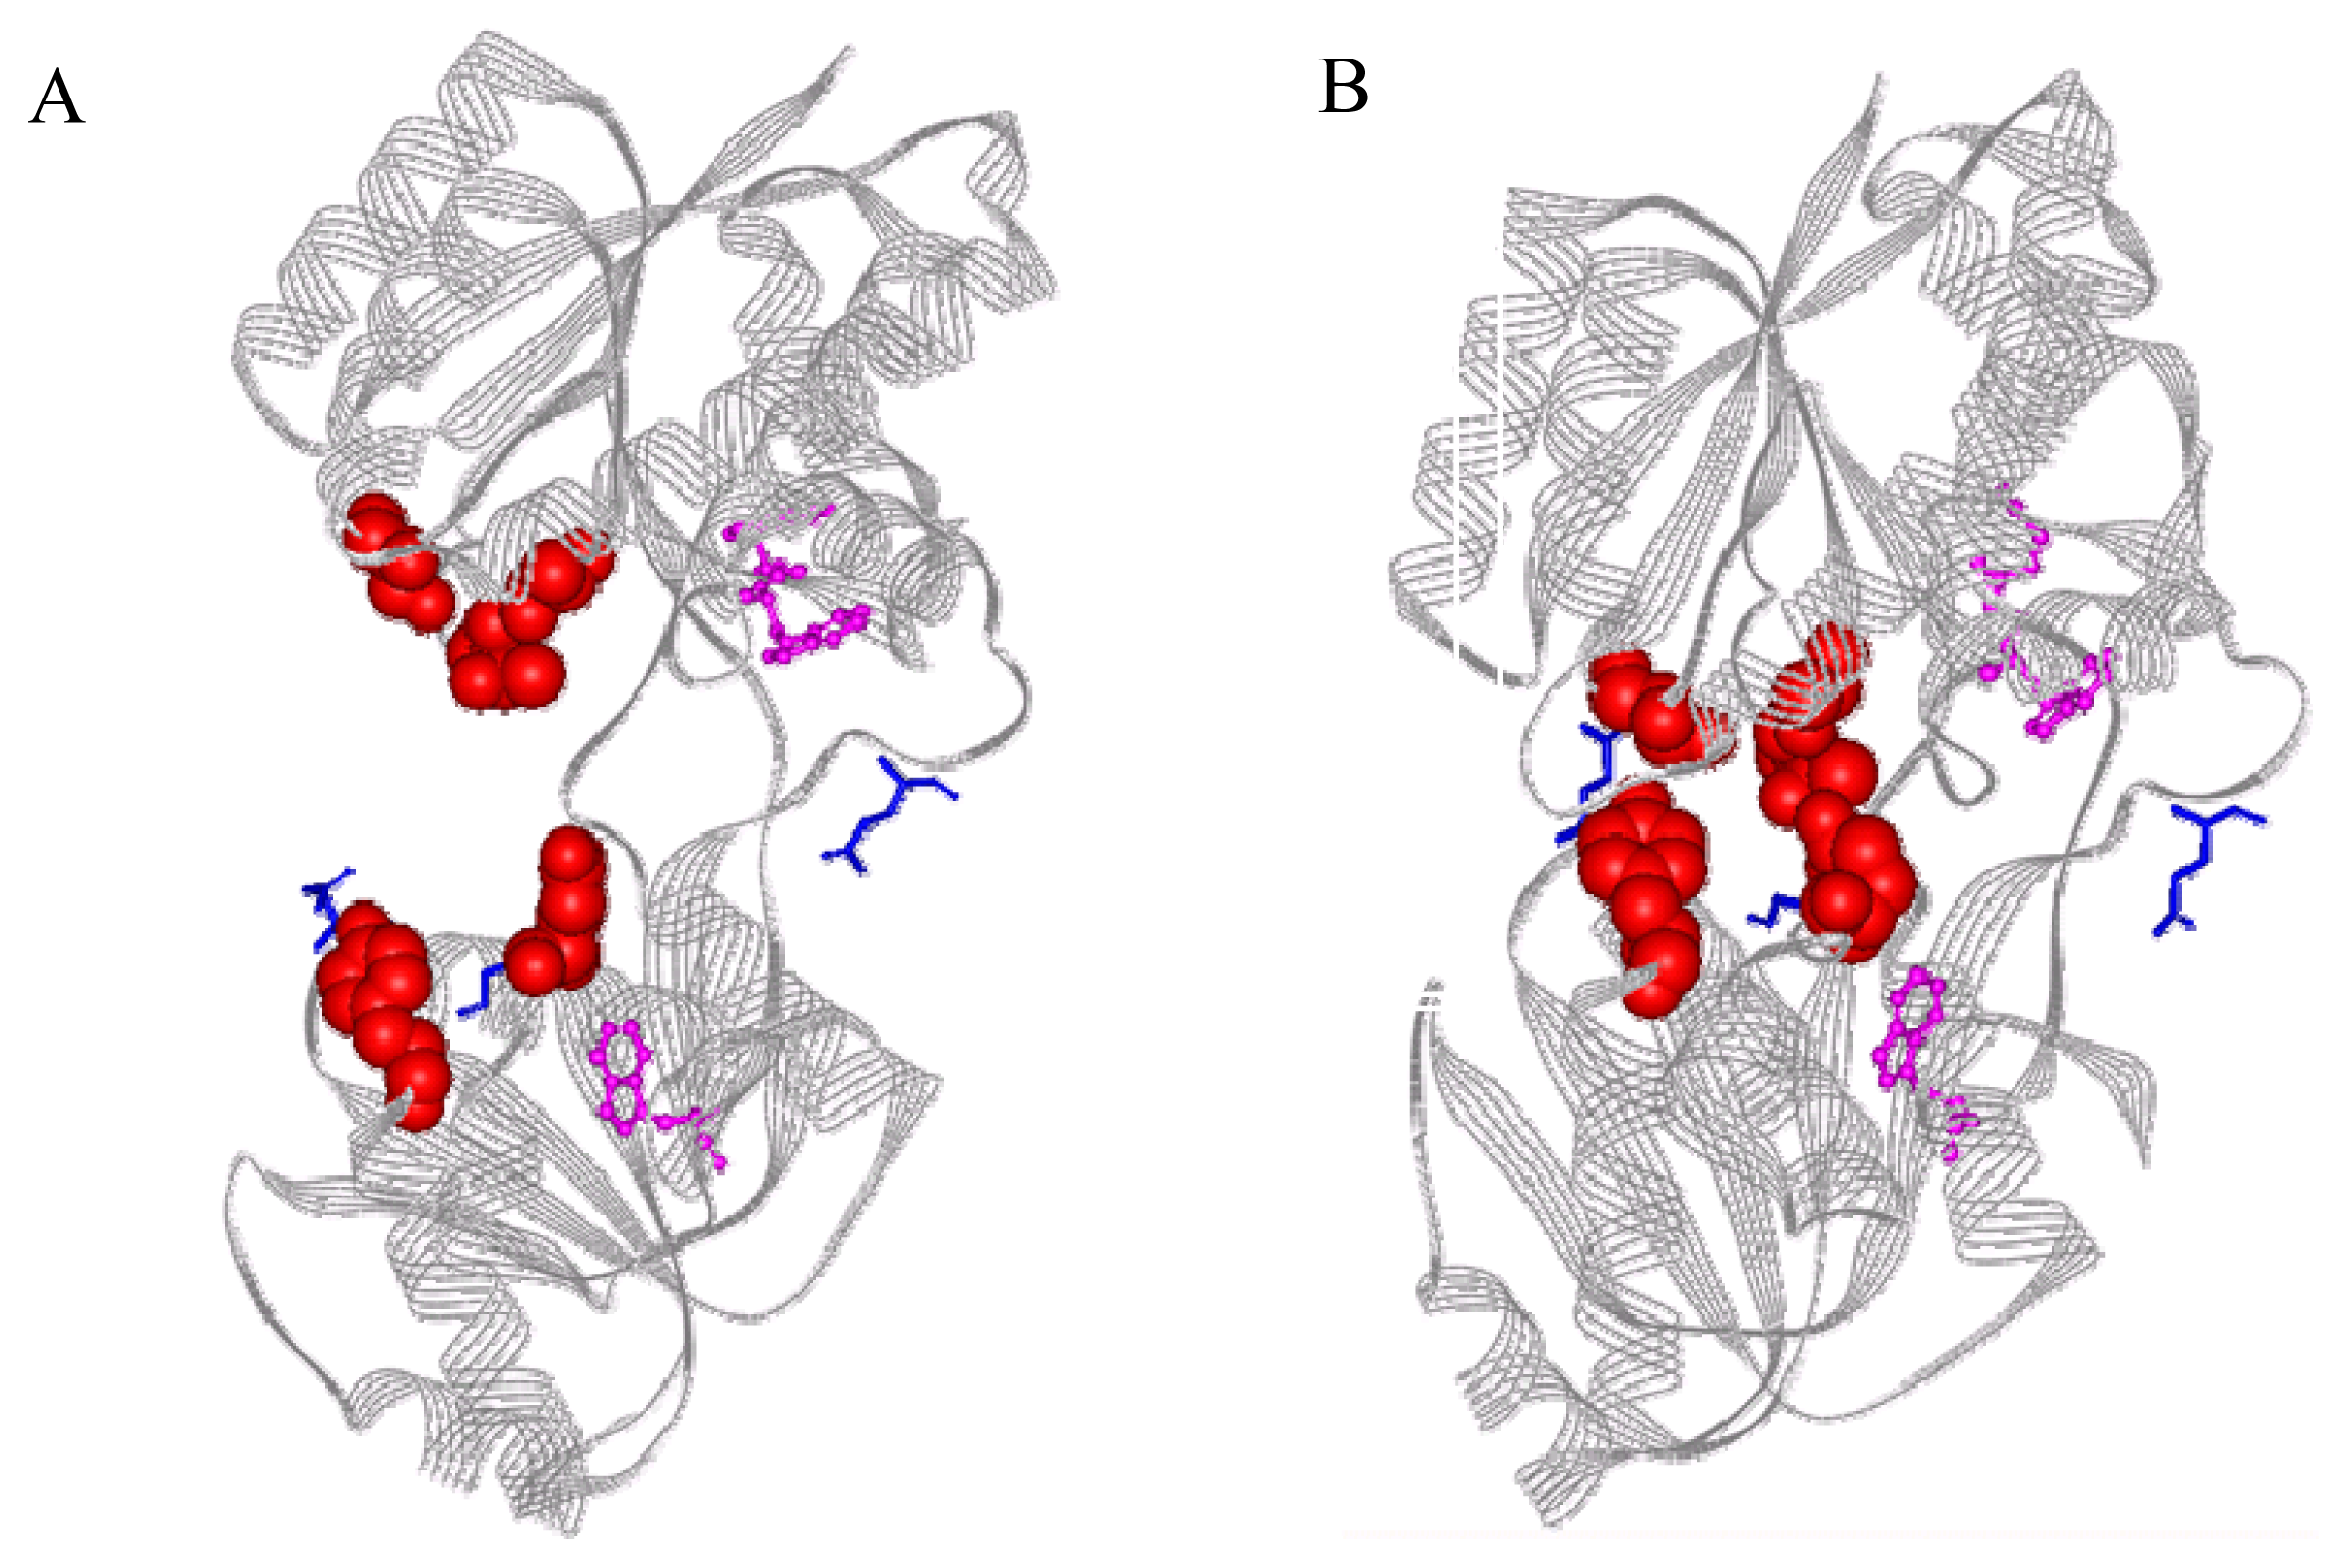
2.1 Fluorophore modification sites

Figures 1A and 1B represent the open form (PDB ID: 1Z16) and the closed form (PDB ID:1Z15) of LIVBP, respectively, showing the previously elucidated ligand-binding sites and amino-acid residues in which we introduced the amino-acid substitution in this study. It has been reported that Ser79, Ala100, Thr102, Tyr202, and Glu226, located at the cleft between the two domains, are responsible for ligand binding. Because modification of these residues would likely adversely affect ligand binding, they were avoided as candidate sites for fluorophore labeling. Gln149, Gly227, and Gln254 are located near the cleft of LIVBP’s two domains, where the molecular environment seems to change upon ligand binding. However, based on the X-ray structures, these residues do not appear to contribute to ligand recognition or binding and were therefore chosen for substitution to Cys and site-specific modification with environmentally sensitive fluorescence probes.

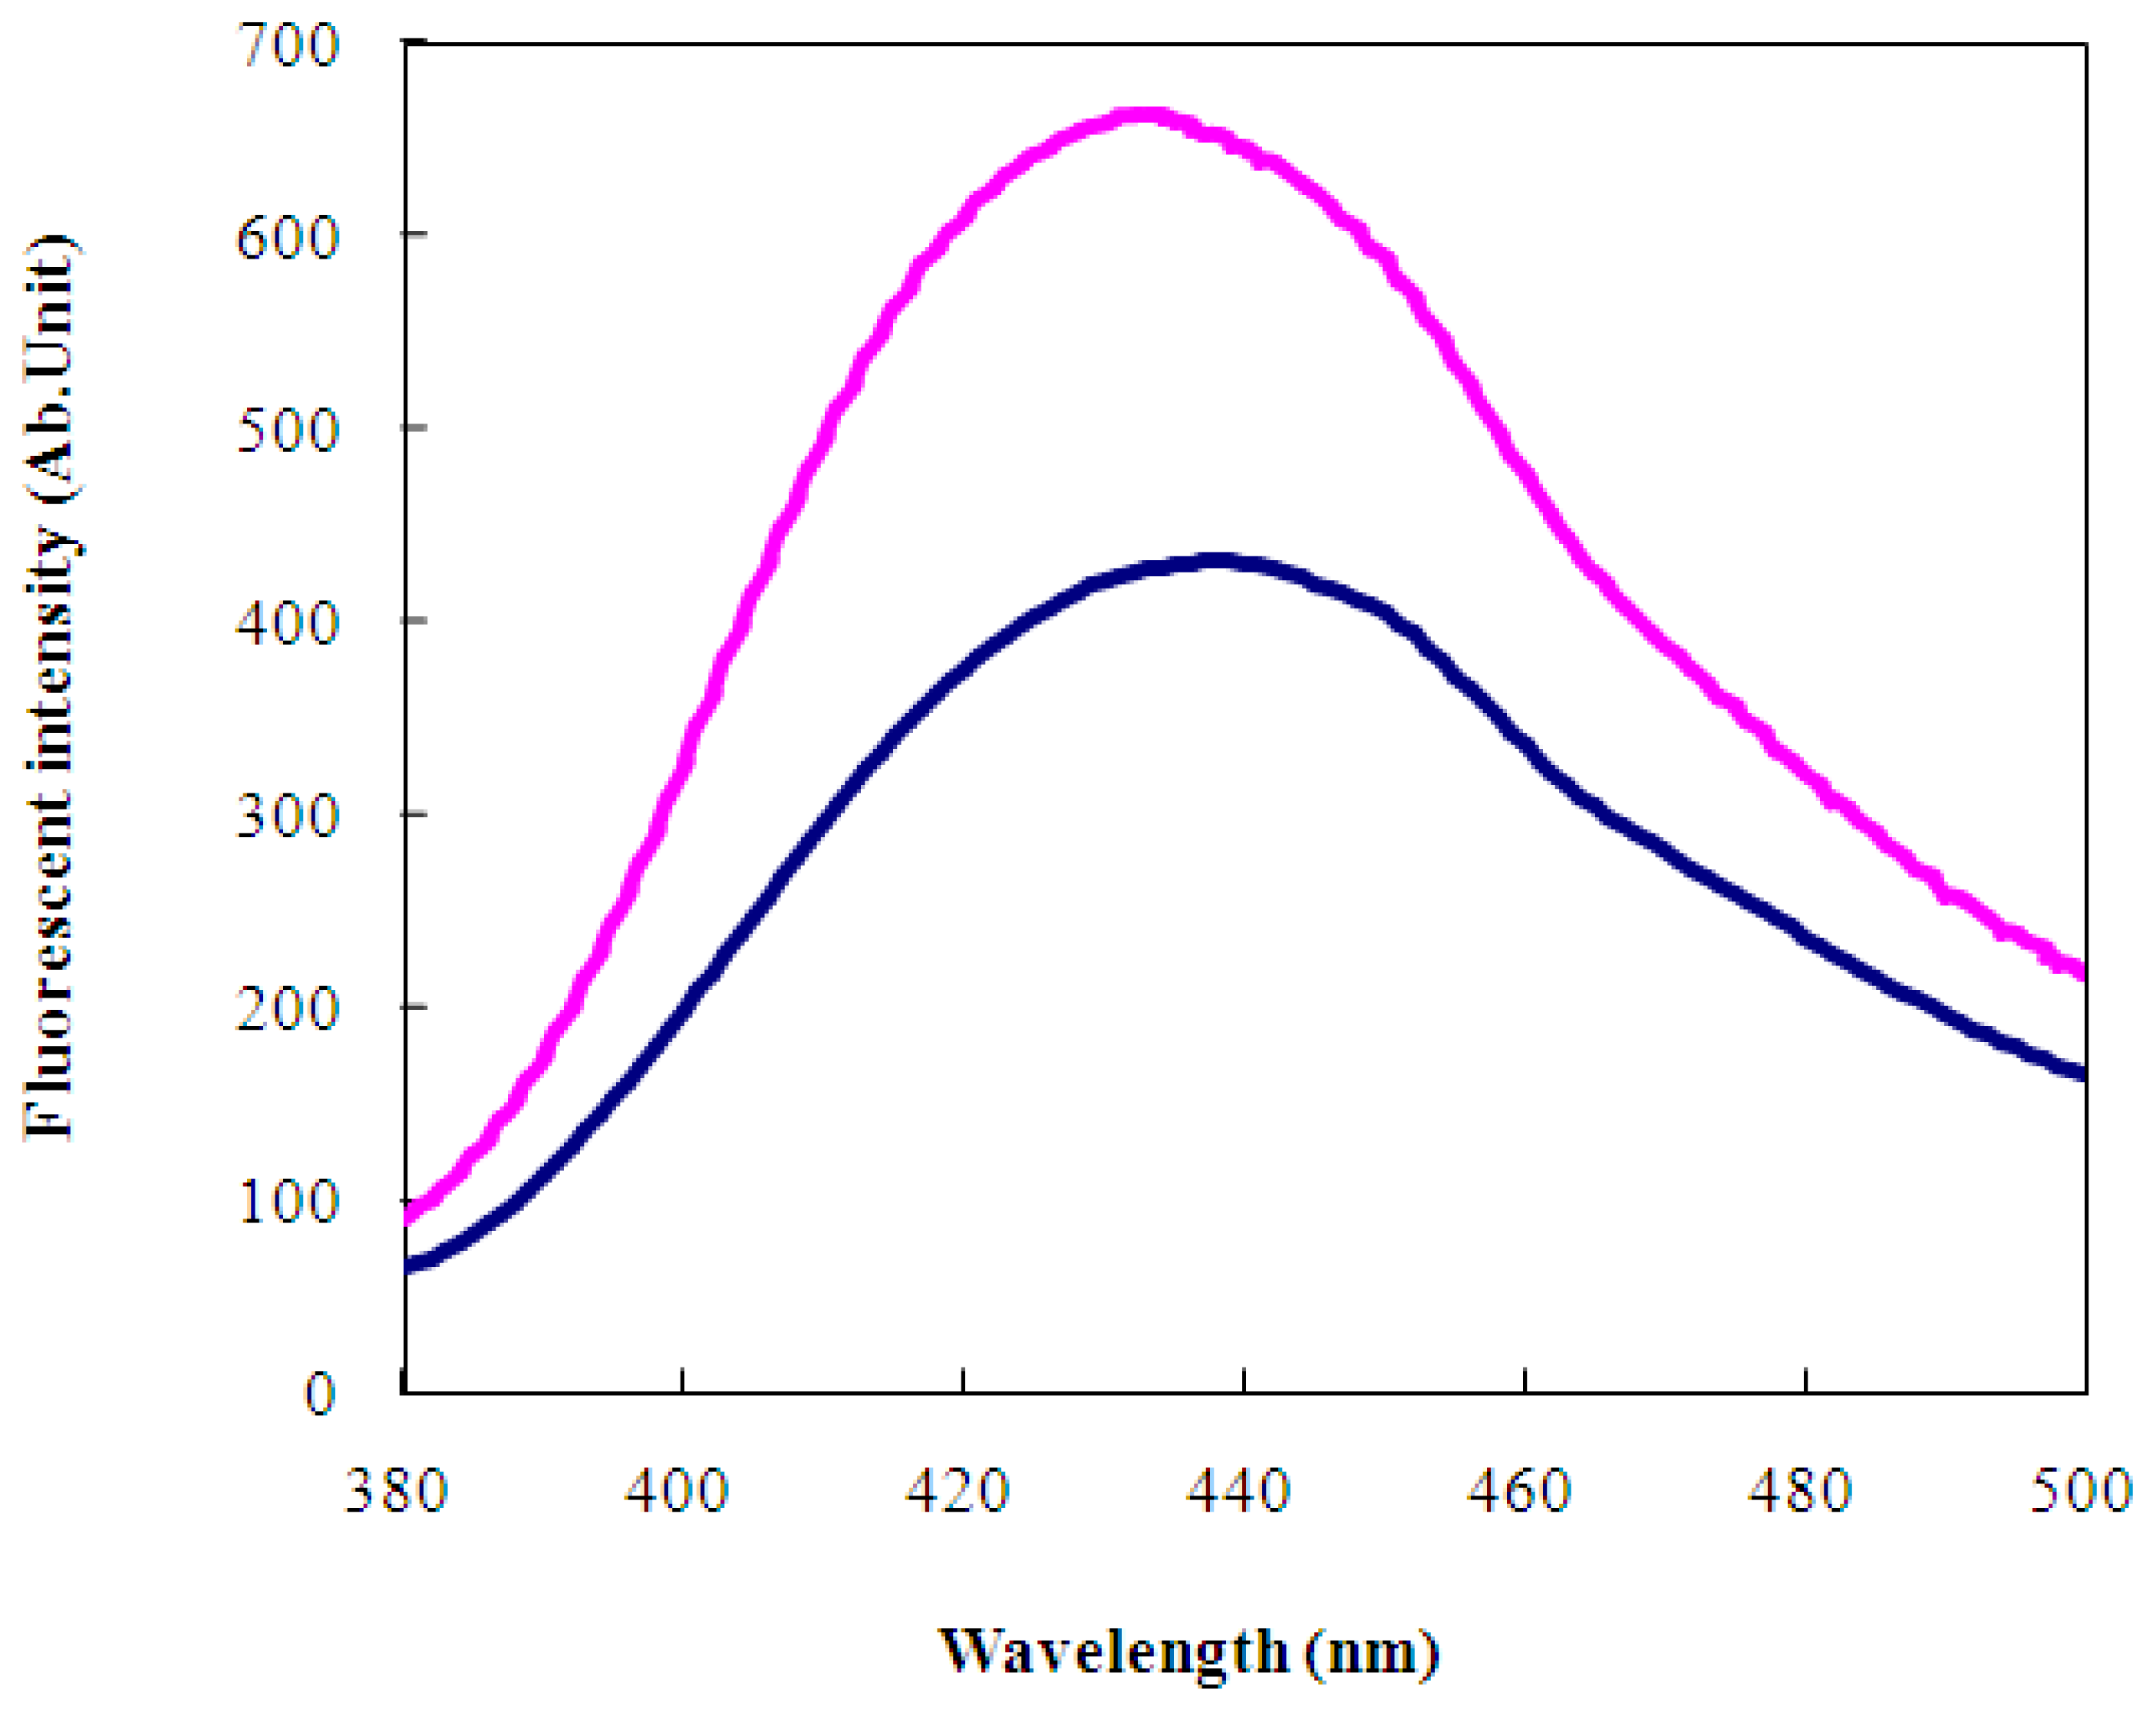
2.2 Characterization of wild-type and engineered LIVBPs by autofluorescence

We first examined the effect of the Gln149Cys, Gly227Cys, and Gln254Cys amino-acid substitutions on the ability of LIVBP to bind the ligand, in this case Leu. Ligand binding was monitored by the change in Trp-derived autofluorescence caused by the conformation change resulting from ligand binding. The maximal autofluorescence intensity of each LIVBP was measured at about 330 nm with an excitation wavelength of 295 nm. Figure 2 shows the correlation between the Leu concentration and the autofluorescence change observed in each sample. The autofluorescence intensity of the wild-type increased with increasing Leu concentration and became saturated above 5 μM. Gln254Cys showed a Leu-concentration-dependent autofluorescence change that was almost identical to that in the wild-type. Gln149Cys showed a different curve and saturation at a lower Leu concentration. Gly227Cys showed less than 30 % of the maximum fluorescence change of the wild-type indicating that the amino-acid substitution at Gly227 significantly affected the dynamics of the conformation change upon ligand binding. We therefore chose Gly149Cys and Gln254Cys as the engineered LIVBPs to be modified with environmentally sensitive fluorescence probes, since they showed ligand-binding properties similar to that of the wild-type protein.

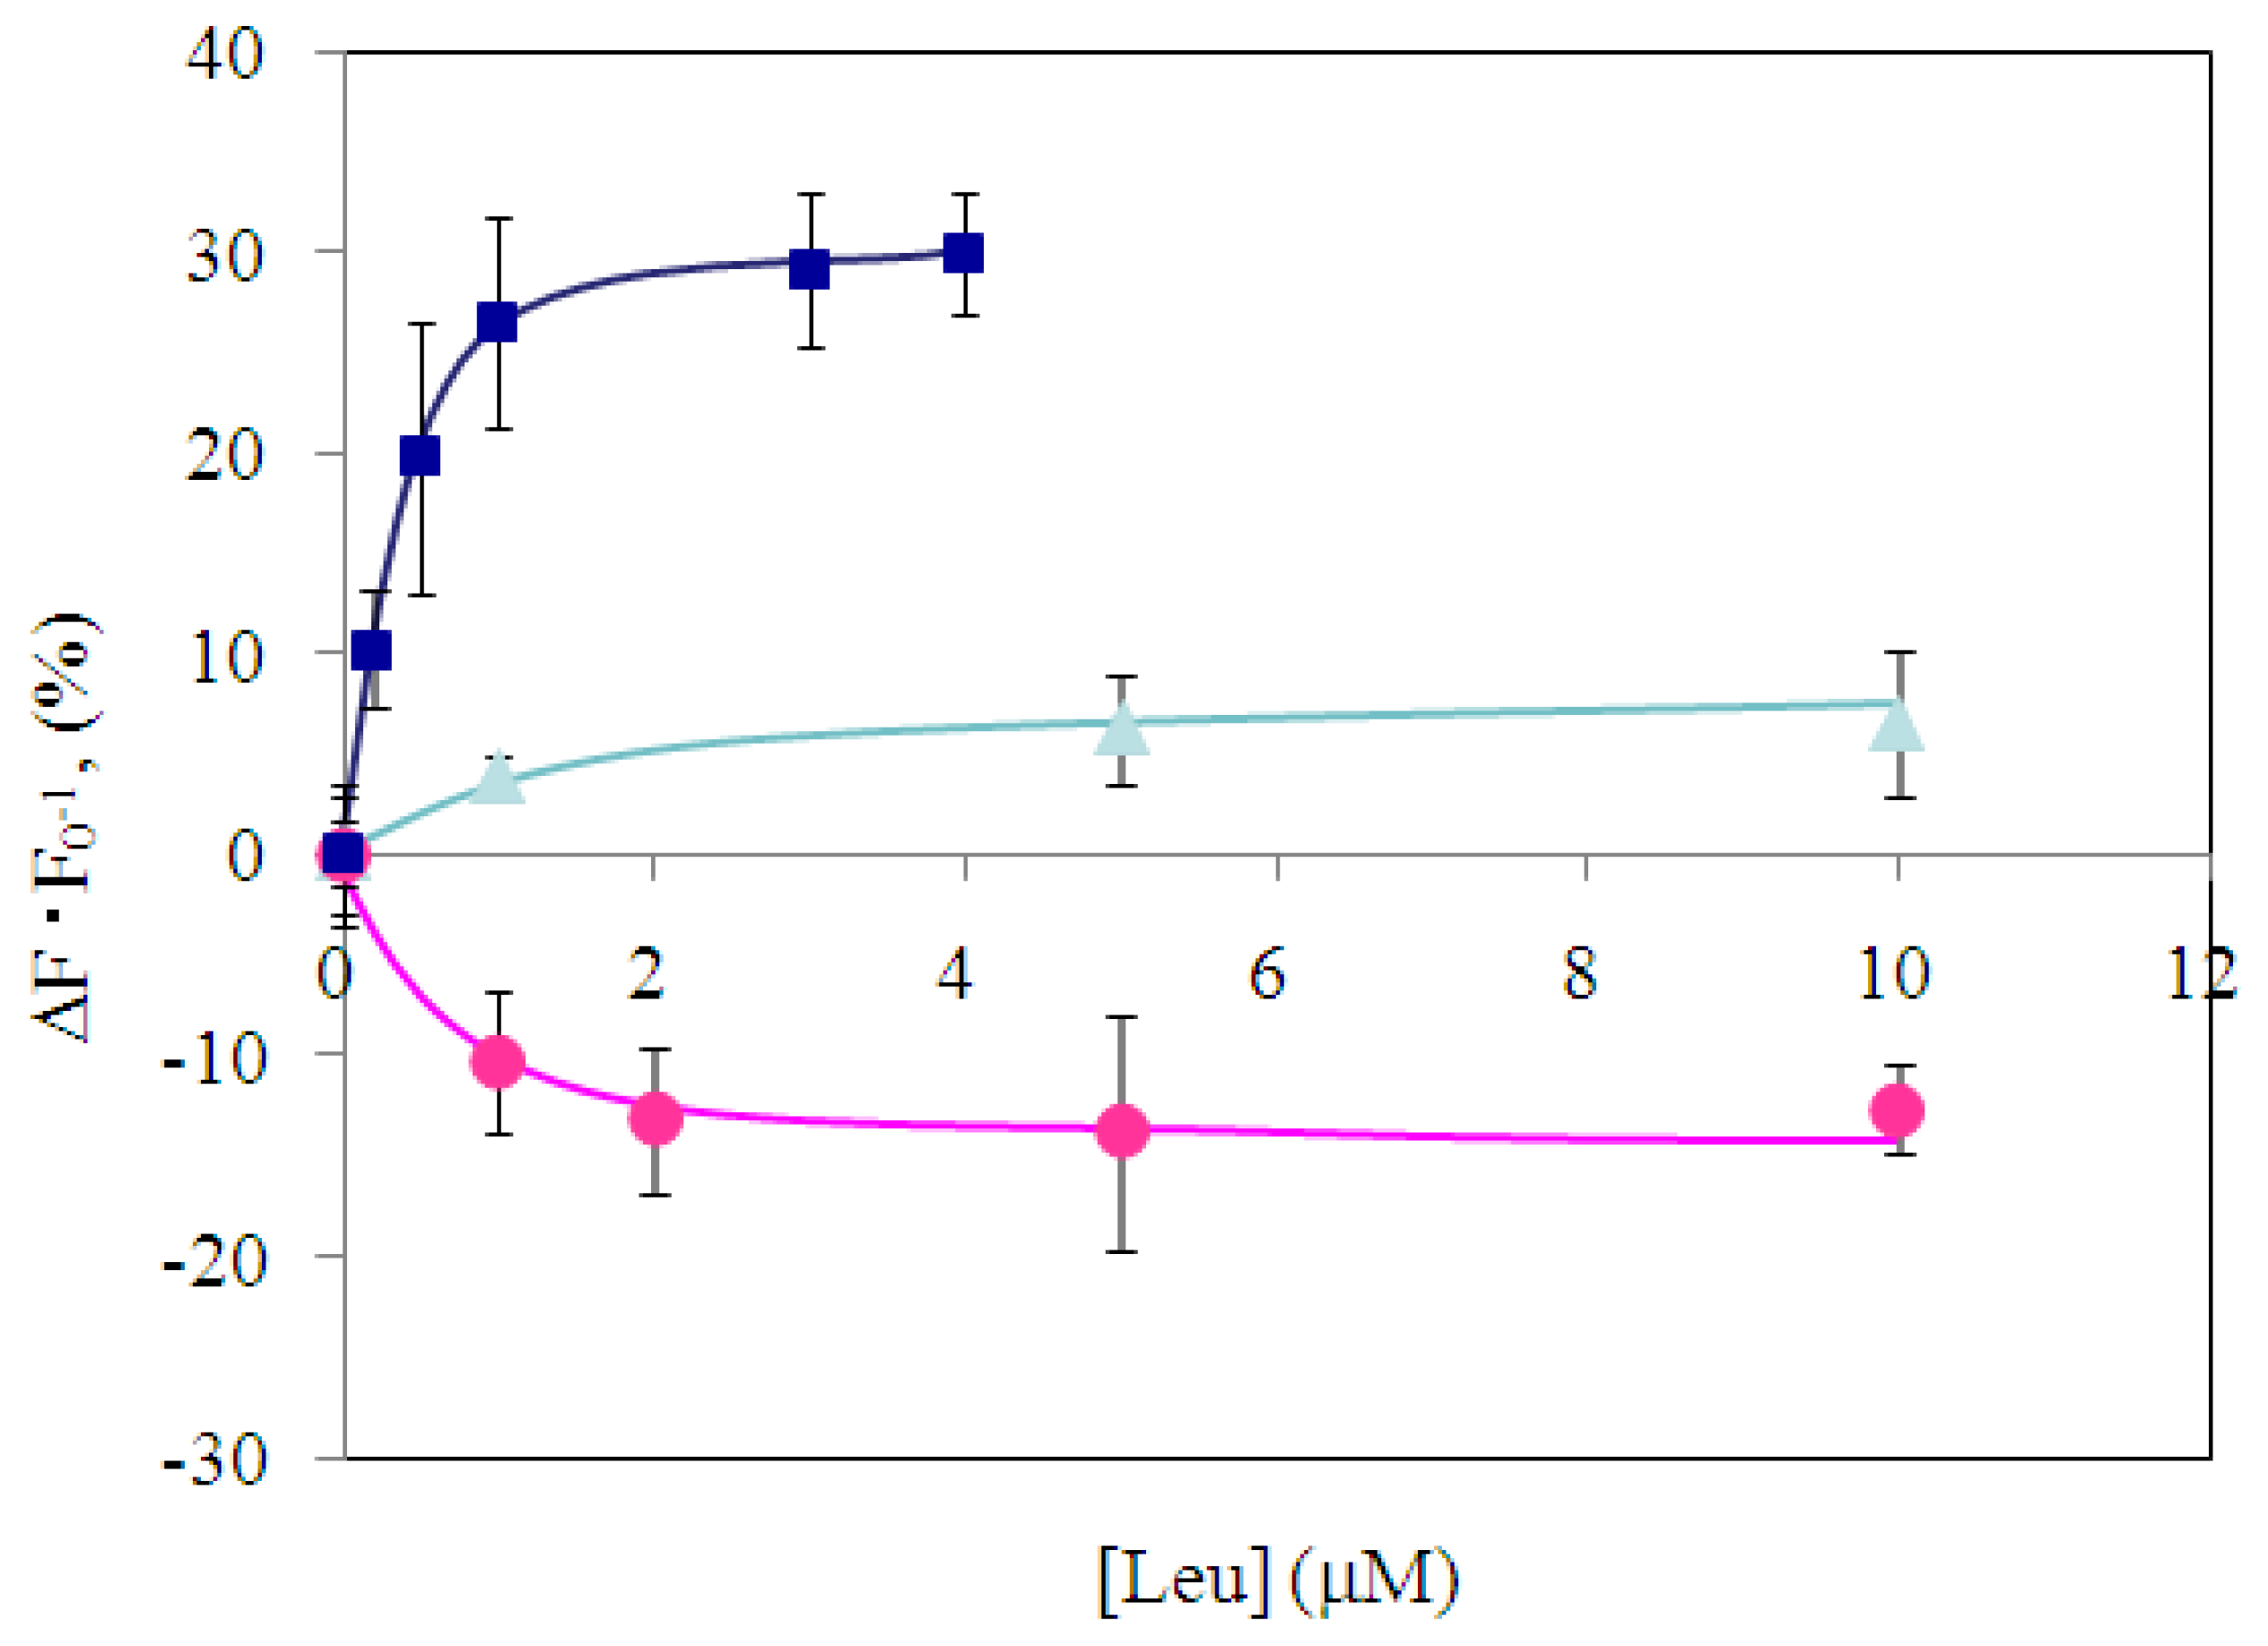
2.3 Characterization of environmentally sensitive fluorescence probe-modified LIVBPs

The two engineered LIVBPs Gly149Cys and Gln254Cys were then modified with the environmentally sensitive fluorophores MIANS or acrylodan to investigate their potential as!elements in fluorescence sensors. The fluorescence emission of these compounds is highly sensitive to the local environment when they are bound to protein and exhibit changes in both intensity and emission wavelength that reflect the effective dielectric constant of the environment around the fluorophore. The emission spectrum of MIANS-conjugated Gln149Cys (Gln149Cys-M) showed a single emission peak at 434 nm with excitation at 325 nm (Figure 3), just like the other mutant conjugated with MIANS (data not shown). As was observed in the autofluorescence change in the unconjugated Gln149Cys, the presence of 4 μM Leu resulted in an increase in fluorescence intensity due to the binding of Gln149Cys-M with Leu. However, the increase in the fluorescence intensity of Gln149Cys-M upon ligand binding was very considerable, a 30 % increase compared with the fluorescence intensity in the absence of the ligand. This relative fluorescence intensity change in Gln149Cys-M in the presence of 4 μM Leu was about 6-fold higher than that of Trp-dependent autofluorescence change at 330 nm in the unconjugated Gln149Cys LIVBP. This increase may be due to the high signal and sensitivity of MIANS toward environmental change.
A progressive increase in the fluorescence intensity at 434 nm was observed with increasing Leu concentration between 0.2 μM and 1.0 μM, and saturation was reached above 4 μM (Figure 4). The ligand binding of the acrylodan-conjugated Gln149Cys mutant (Gln149Cys-Ac), which showed its maximal emission intensity at 517 nm with an excitation wavelength of 383 nm, was also investigated. Gln149Cys-Ac also showed an increase in fluorescence intensity with increasing Leu concentration up to 10 μM, but with a smaller intensity change (6.5 %) compared with that observed in Gln149Cys-M. MIANS-conjugated Gln254Cys (Gln254Cys-M) showed an inverted response: the fluorescence intensity decreased with increasing Leu concentration, with a much lower level of intensity change than Gln149Cys-M. The reasons for this inverse response in Gln254Cys-M and the low signal observed in Gln149Cys-Ac are unclear, and may be related to the correlation between the chemical structure of the fluorescence probe and the position and/or local environment of the probe. However, these results clearly indicate that, among the engineered LIVBPs constructed in this study, Gln149Cys- M is a suitable sensing molecule for BCAA monitoring and was therefore used for further experiments. As with other general members of the periplasmic binding protein family [20,21],! fluorophore conjugated-LIVBPs in solution showed high stability, with no detectable changes their fluorescence intensity after 2 weeks of storage in 10 mM MOPS buffer (pH 7.0) at 4 °C.

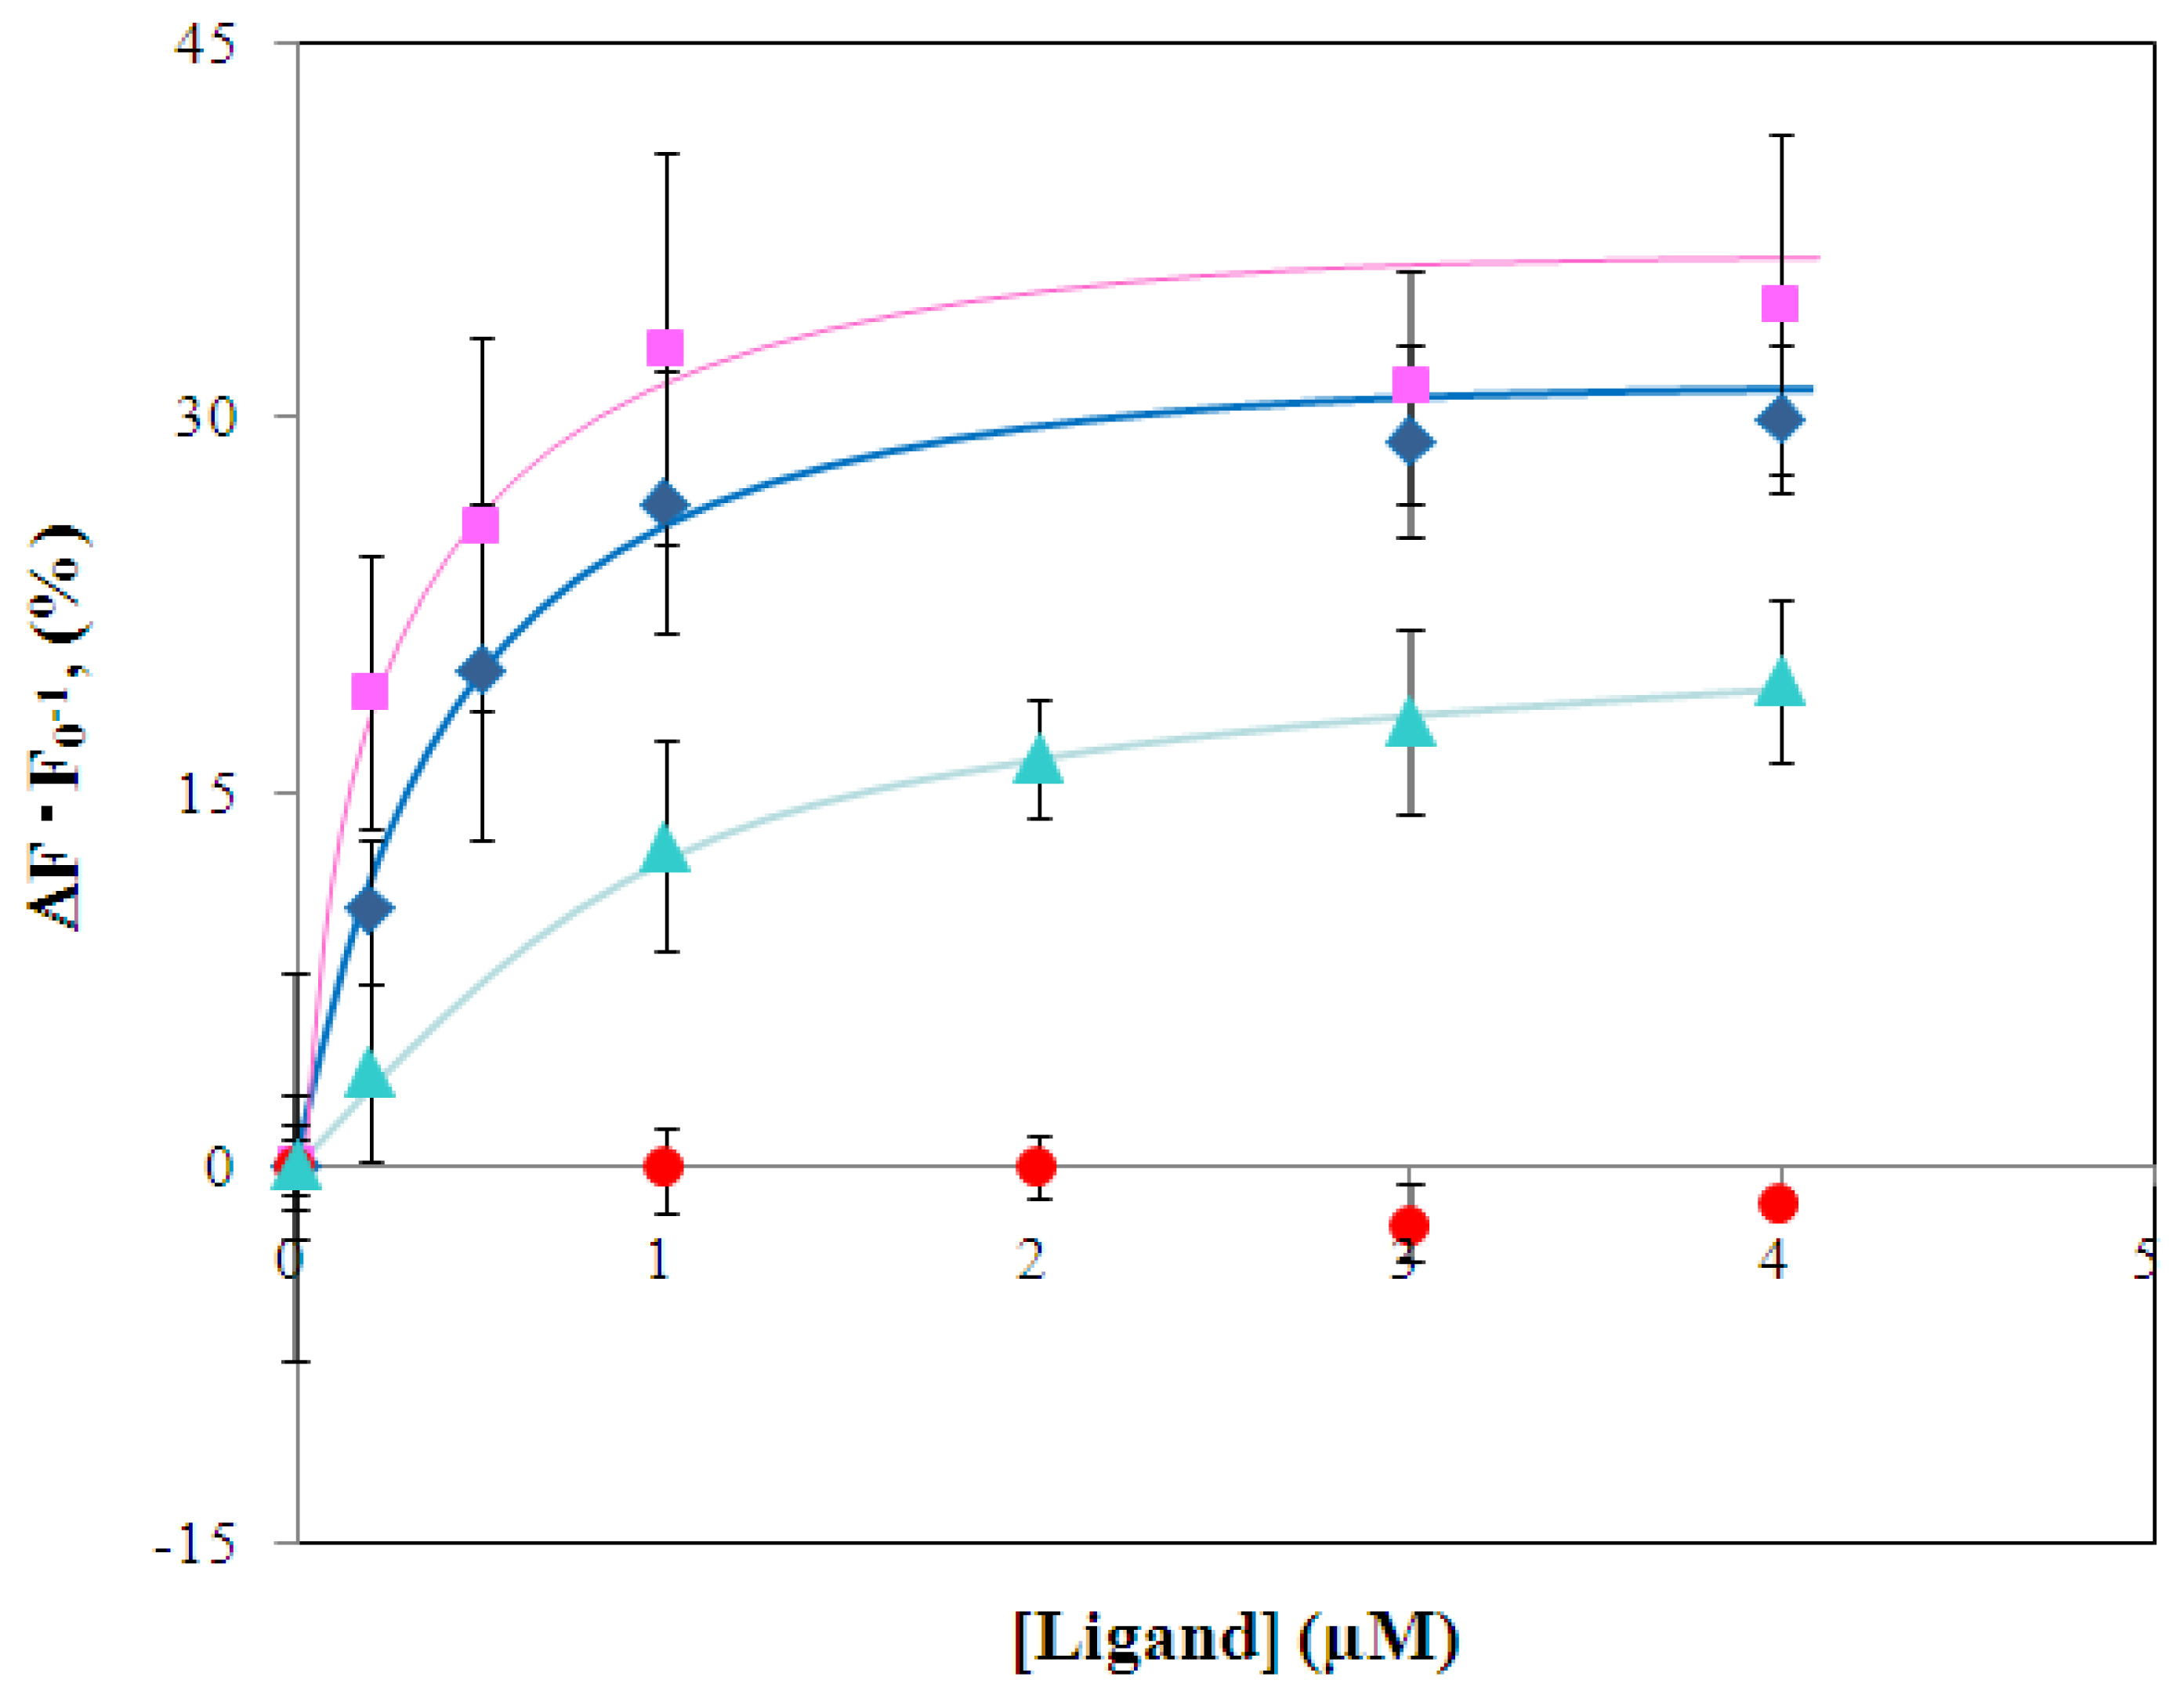
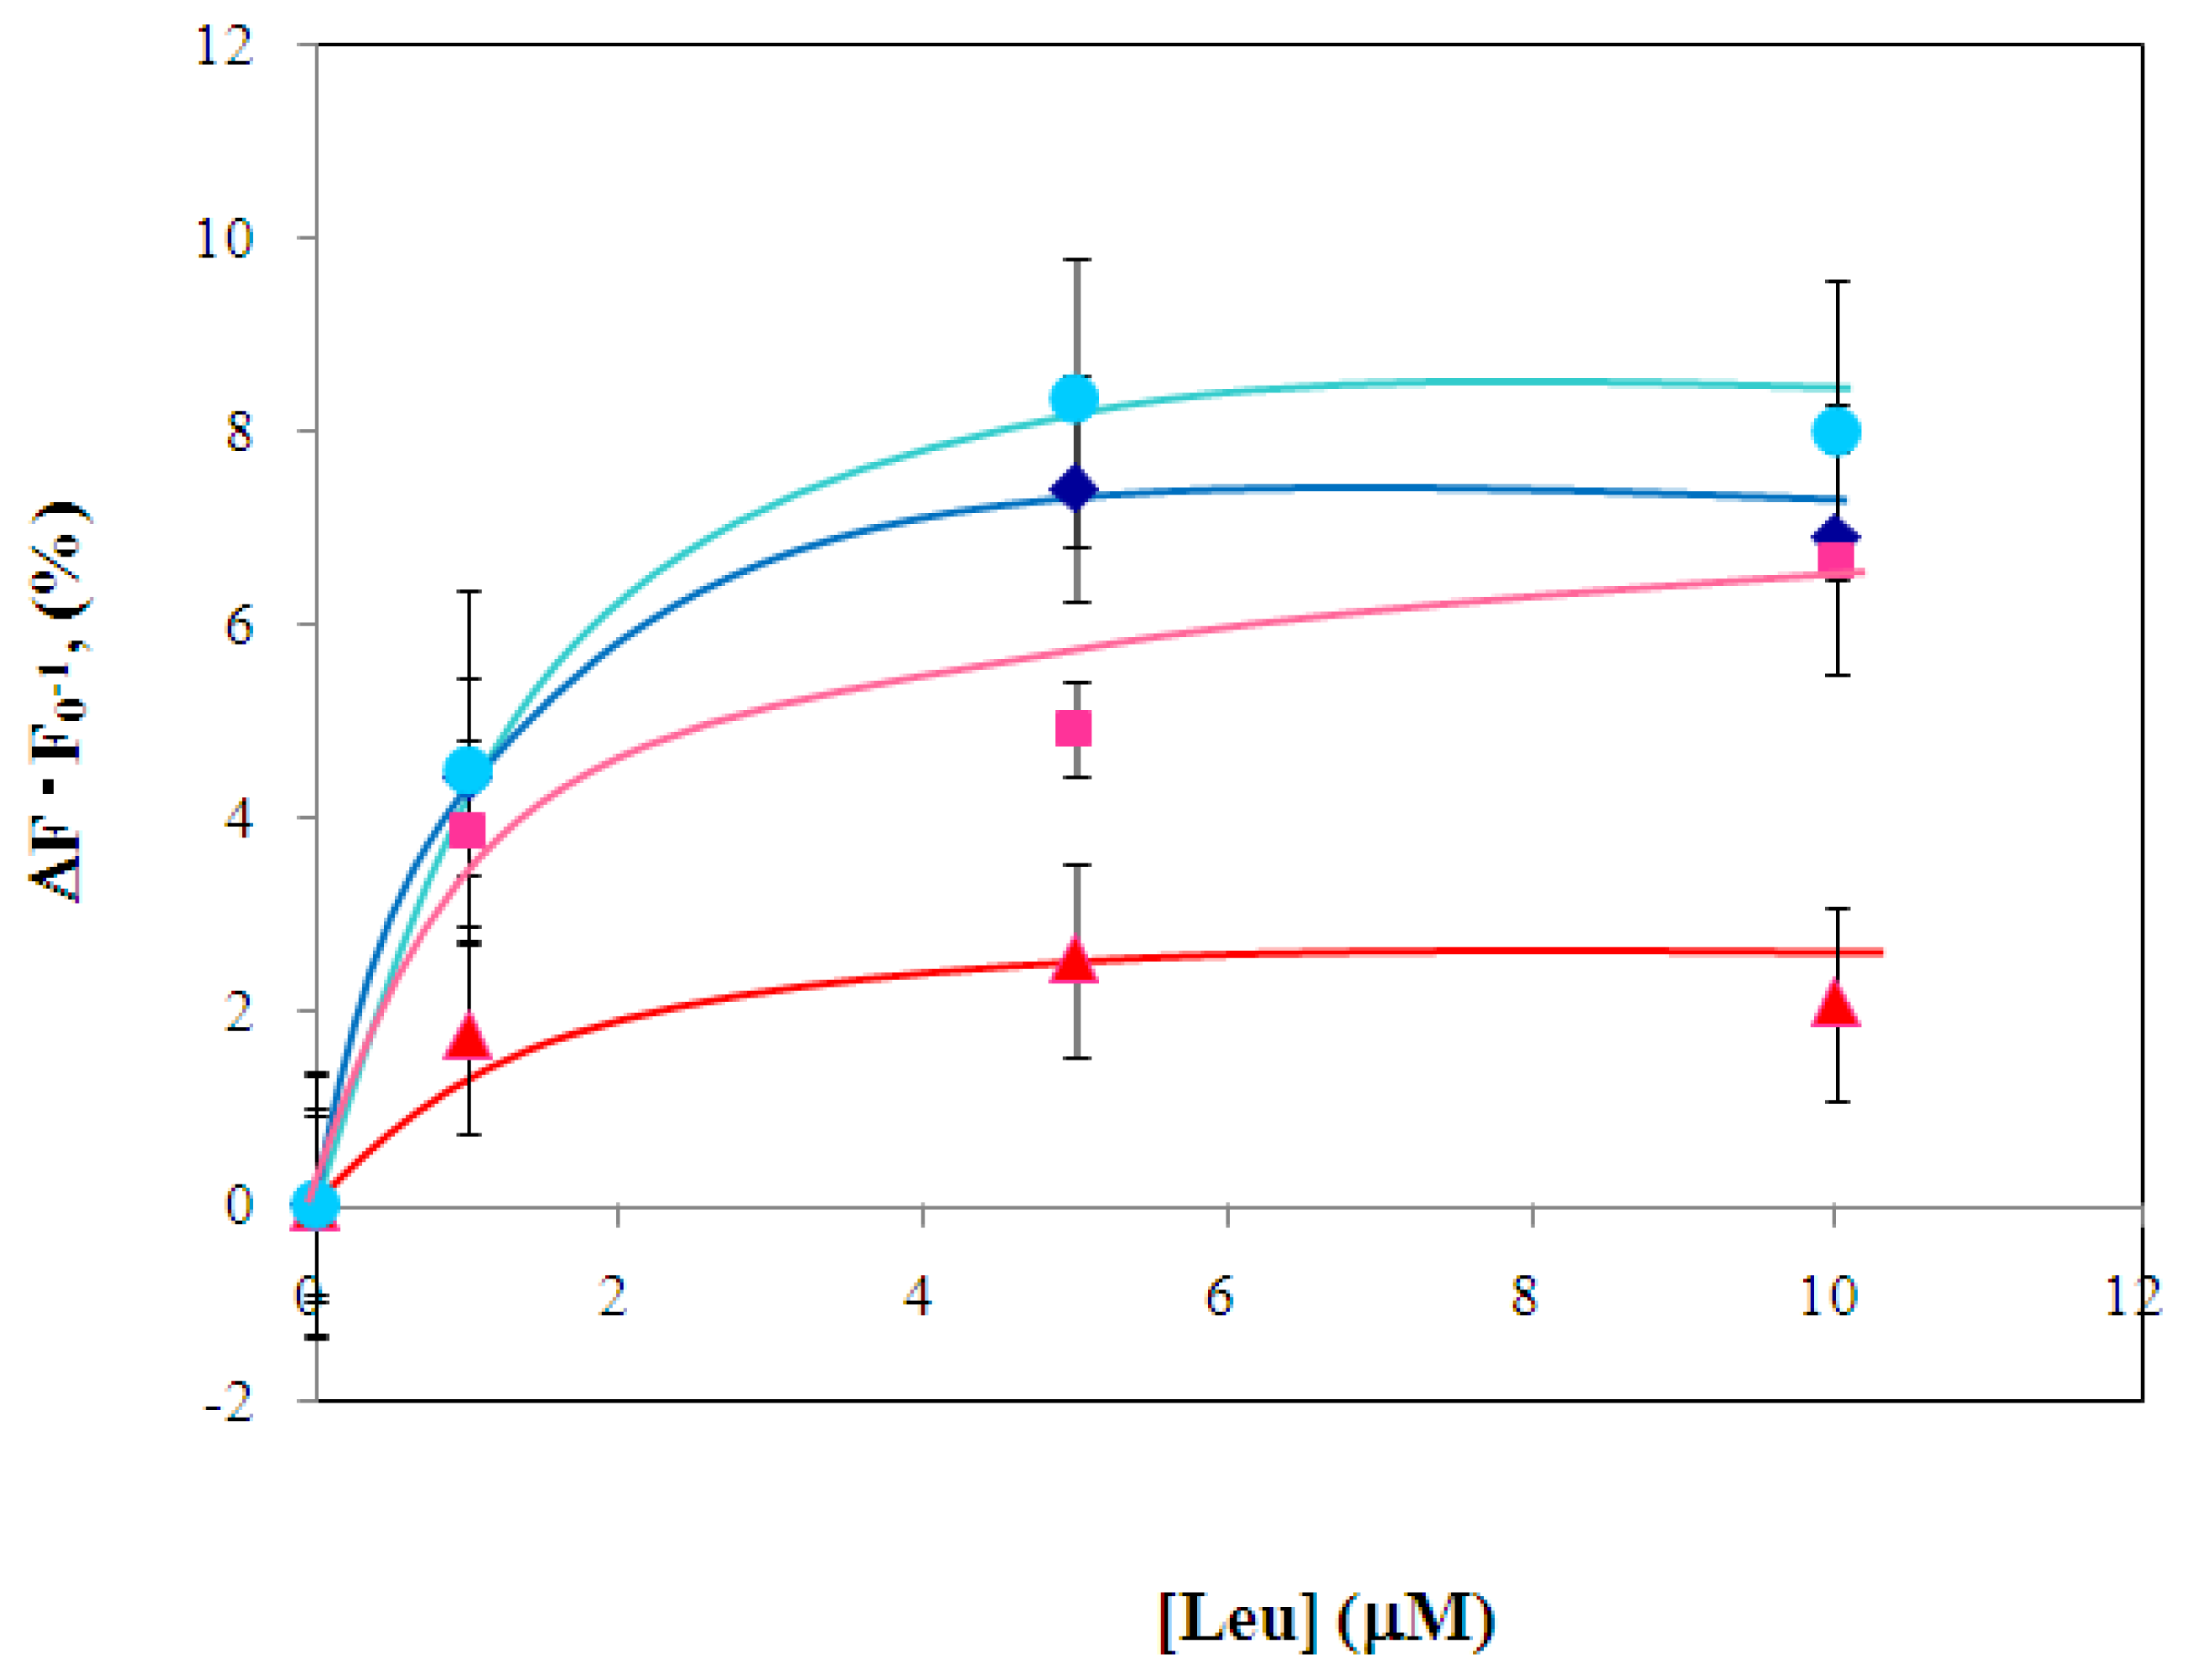
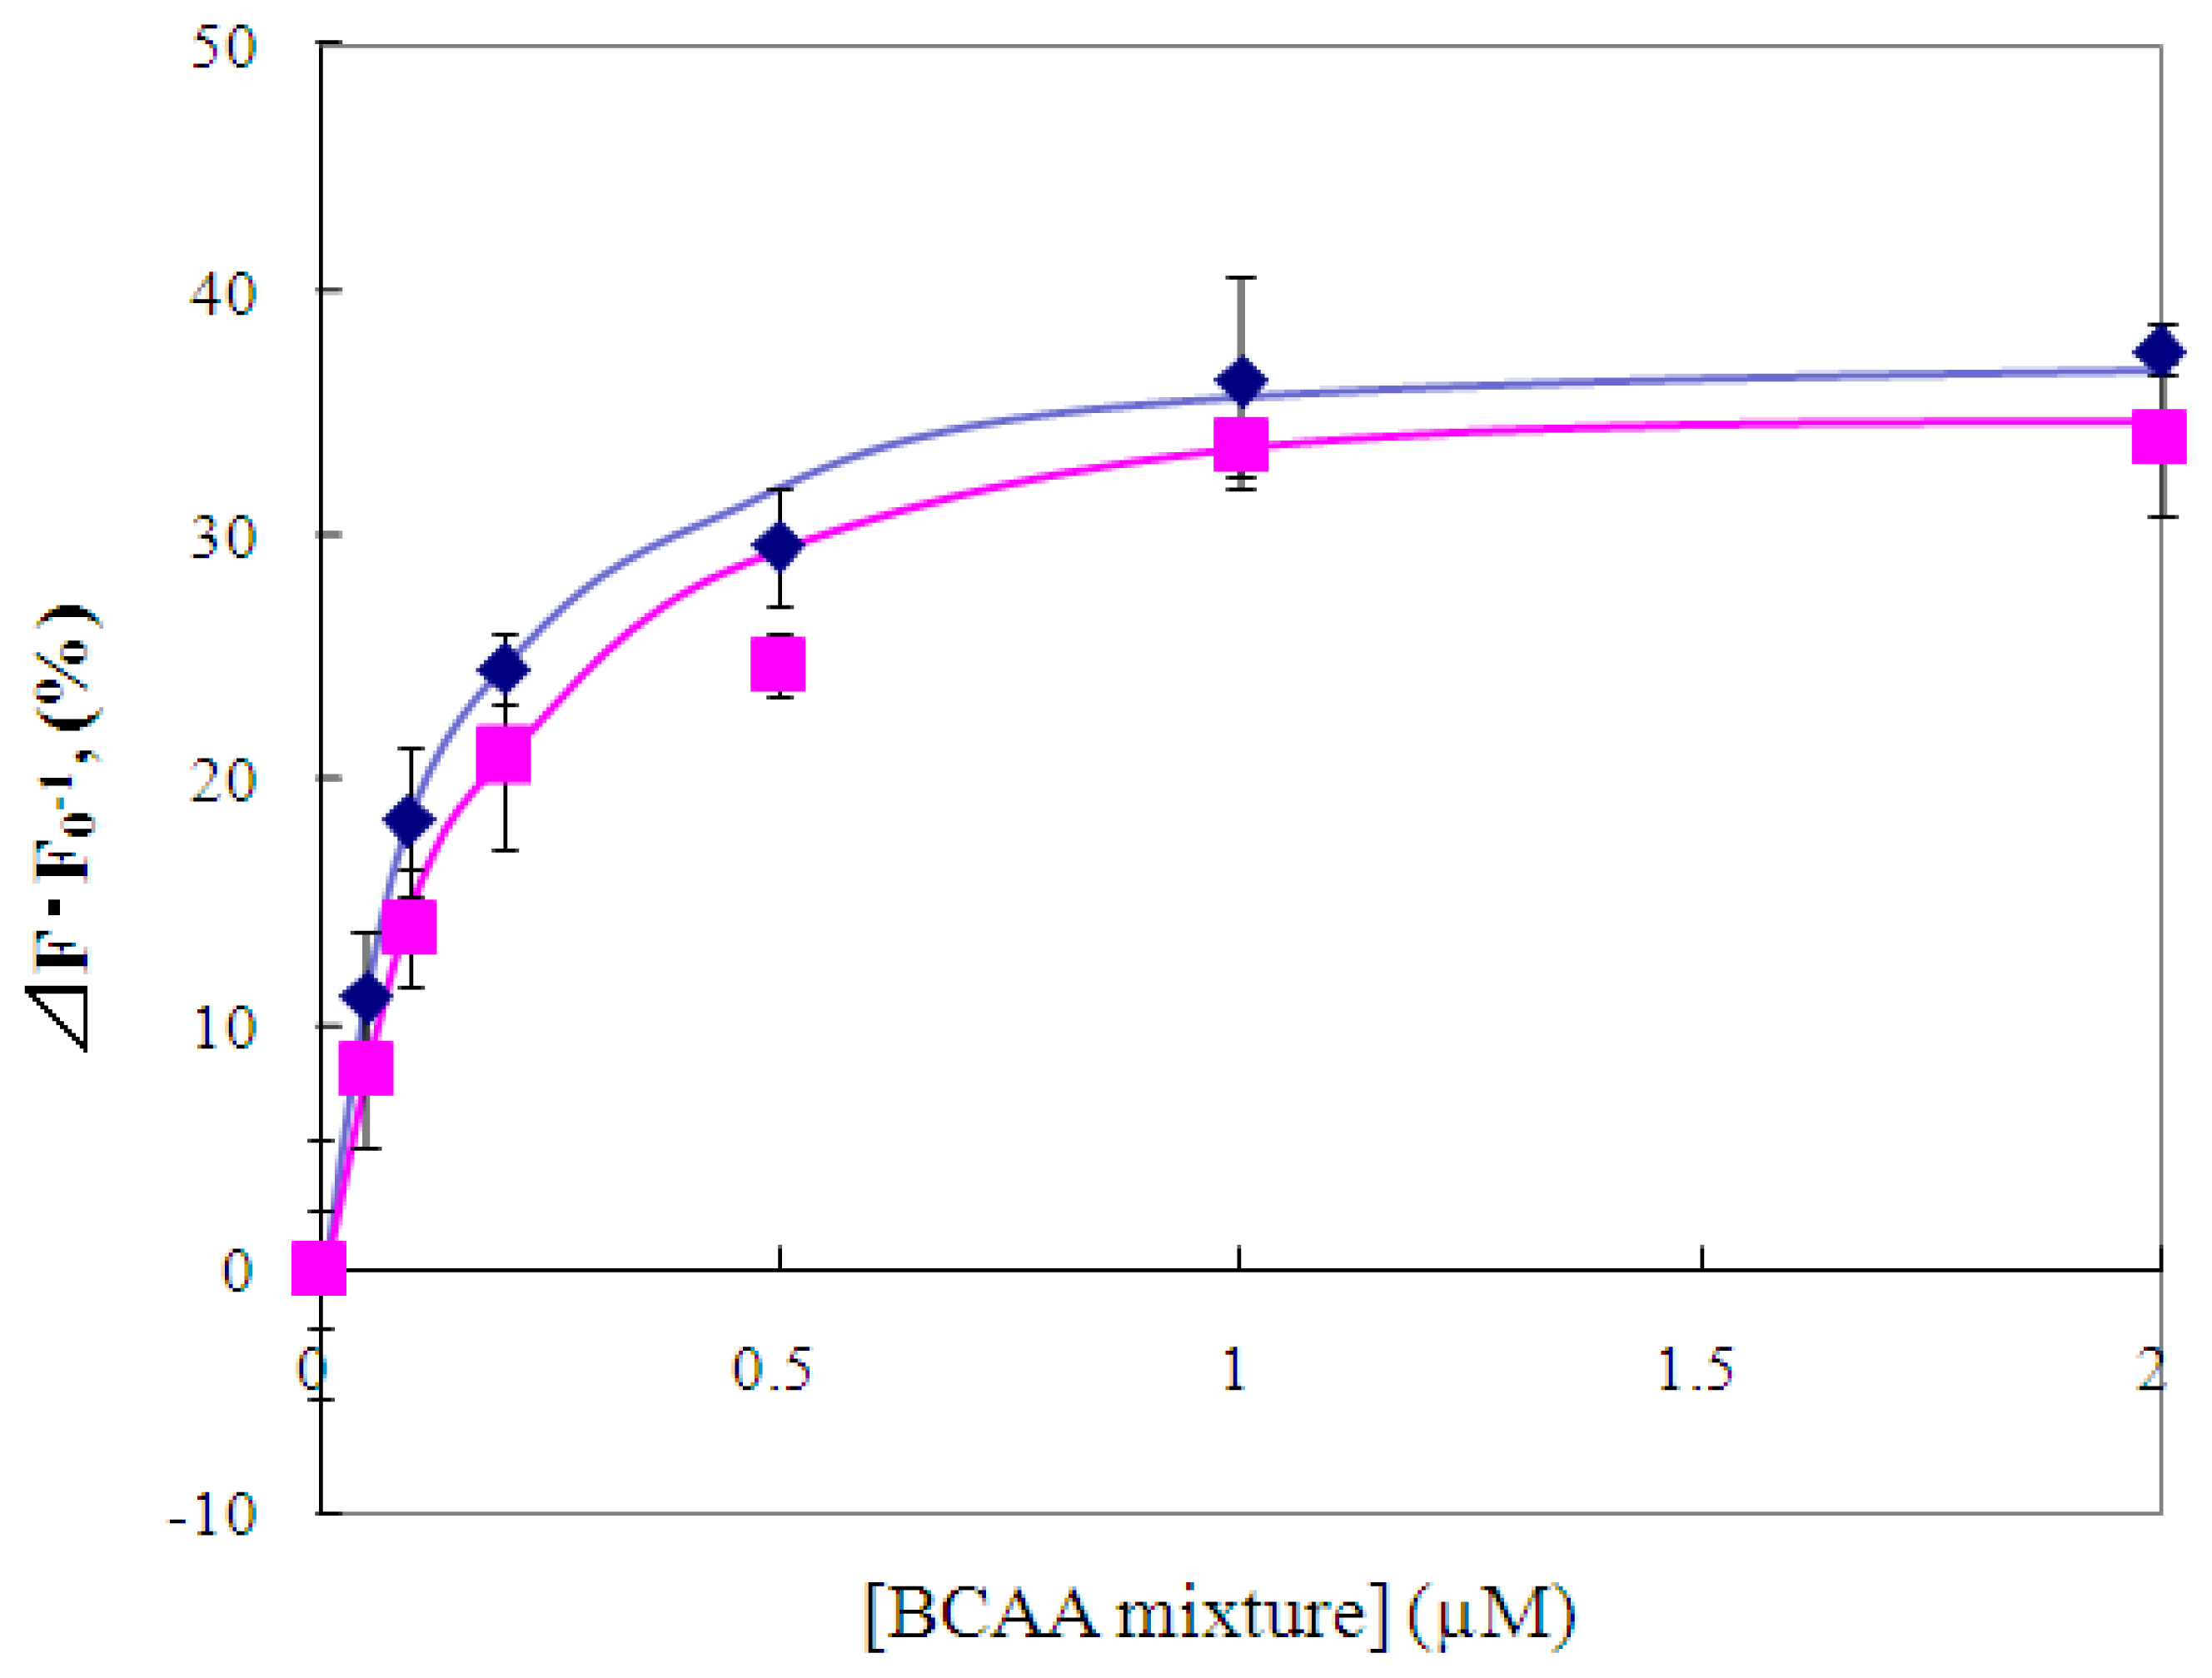
2.4 Fluorescence measurement of branched-chain amino acids using Gln149Cys-MIANS

Figure 5 shows the correlation between the fluorescence intensity change in Gln149Cys-M and the concentration of different ligands. As was observed in the experiment using Leu as the ligand, the fluorescence intensity of Gln149Cys-M increased with increasing concentrations of Ile and Val. The observed fluorescence intensity change with Ile was similar to that observed with Leu, and saturation was reached at levels higher than 1 μM Ile. The response toward Val was slightly lower than that toward Leu or Ile. The calculated binding constants of Gln149Cys-M toward these ligands are 0.5 μM for Leu, 0.2 μM for Ile, and 1.1 μM for Val. These values represent the ligand group-specificity of Gln149Cys-M, and are consistent with those reported previously for wild-type LIVBP (2.3 μM for Leu, 0.9 μM for Ile and 4 μM for Val) [9]; therefore, the ligand group-specificity of the wild-type was retained in Gln149Cys-M. As shown in Figure 5, the presence of Phe did not result in any fluorescence intensity change. The other AAA Tyr also did not lead to any change (data not shown).
Finally, Gln149Cys-M was used for measuring mixtures of BCAAs. The plasma concentration of each BCAA is as follows: Leu, 70–165 μM: Ile, 45–105 μM: Val, 122–303 μM. Consequently, the total BCAA concentration is within the range of 300–550 μM. Considering that the fluorescence measurement of BCAAs using Gln149Cys-M can be achieved within the sub-micromolar range, the sample must be diluted before being measured. Although, the concentrations of Leu, Ile, and Val can vary greatly depending on the patient, the range of the molar ratio relatively constant. Based on the reported molar ratio of Leu, Ile, and Val in naturally occurring BCAA mixtures[2223], Leu is within 15–22 %, Ile is within 28–34 %, and Val is within 50–56 %. Considering these facts, we prepared two different BCAA mixture samples with different Leu:Ile:Val molar ratios: 15:29:56 and 22:28:50. These mixtures were adequately diluted in the sub-micromolar range, and subjected to fluorescence measurement using Gln149Cys-M (Figure 6). Good correlations were observed between the BCAA fluorescence increase and the BCAA concentration in both samples. As was shown in Figure 5, the fluorescence intensity increase at 0.05 μM of BCAA mixture, the minimal concentration tested in this study, was about 10% and it became saturated above 1 μM BCAA. The system thus demonstrated a sufficient dynamic range (at least from 0.05–1 μM) for measurement of serum BCAA. Considering the serum BCAA concentration level, the measurement using engineered Gln149Cys-M LIVBP!should be carried out with adequately diluted samples (e.g. 500-fold). The sample with Leu:Ile:Val = 15:29:56 showed a slightly higher response compared with the sample Leu:Ile:Val = 22:28:50, however, the difference was less than 8 % of the signal. Therefore, BCAA measurement based on the engineered Gln149Cys-M LIVBP can be employed on samples with different molar ratios of BCAA within the range reported in the literature. A highly sensitive system was achieved for the measurement of BCAAs from plasma sample.
In conclusion, we reported here the construction of a novel fluorescence sensing system for BCAAs based on engineered LIVBPs conjugated with environmentally sensitive fluorescence probes. Based on the fluorescence intensity change observed upon the binding of the ligands, Gln149Cys-M showed the highest and most sensitive response. Using Gln149Cys-M, the BCAAs Leu, Ile, and Val can each be monitored at the sub-micromolar level. Measurements were also carried out on a mixture of BCAAs and revealed that Gln149Cys-M-based measurement is not significantly affected by the change in the molar ratio of Leu, Ile, and Val in the sample. Thanks to the high sensitivity of this principle, the serum sample should be greatly diluted prior to be applied to the measurement system, thus minimizing any potential influence from the presence of other serum components. In addition, since the!excitation wavelength of MIANS-modified LIVBP is longer than those for the excitation of Trp or Tyr, the fluorescence measurements are expected not to be affected by any autofluorescence from these amino acid residues. The high sensitivity and group-specific molecular recognition ability of MIANS-modified LIVBP make the new sensing system ideally suited for the measurement of BCAAs.

3. Experimental Section

3.1 Chemicals, enzymes and bacterial strain

Ampli Taq Gold was purchased from Promega (WI, USA). PfuUltra High-Fidelity DNA polymerase was purchased from Stratagene (CA, USA). Restriction endonucleases were purchased from Takara (Kyoto, Japan). 6-Acryloyl-2-dimethylaminonaphthalene (acrylodan)! and! 2-(4′-maleimidylanilino)! naphthalene-6-sulfonic acid, sodium salt (MIANS) were purchased from Molecular Probes Invitrogen Detection Technologies (CA, USA). All other chemicals were reagent-grade.

3.2 Cloning and recombinant expression of wild-type LIVBP

The livJ gene encoding LIVBP [24] was amplified by PCR from a template of genomic DNA isolated from E. coli DH5α. The forward primer introduced an NdeI site at the start codon, while the reverse primer replaced the stop codon with a lysine and introduced an HindIII site (Table 1). The PCR product was digested with NdeI and HindIII, and ligated into pET-30(c) (Novagen, WI, USA) digested with the same enzymes. The nucleotide sequence of the constructed plasmid, pELIV, was confirmed by ABI Prism BigDye Terminator Cycle Sequencing Kit v3.0 on an ABI Prism 3100 Genetic Analyzer (Applied Biosytems, CA, USA).

3.3 Construction of engineered LIVBPs

Based on the 3D X-ray structures of LIVBP, residues Gln149, Gly227, and Gln254 were selected for substitution to cysteine to construct the engineered LIVBPs. Site-directed mutagenesis was carried out on the LIVBP expression vector pELIV by the QuikChange method (Stratagene, CA, USA) using the mutagenic primer pairs listed in Table 1. The sequences of the resulting mutants were confirmed using the ABI Prism BigDye Terminator Cycle Sequencing Kit v3.0 on an ABI Prism 3100 Genetic Analyzer (Applied Biosytems, CA, USA).

3.4 Purification of recombinant LIVBPs

E. coli BL21(DE3) cells harboring the pELIV plasmid or a plasmid containing one of the genes encoding an engineered LIVBP were cultivated aerobically in 2 L of LB medium containing 50 μg/ml of kanamycin at 37 °C in a bioreactor. The periplasm fraction was prepared by osmotic shock, as described in Novagen’s pET System Manual. The periplasmic fraction was then dialyzed against buffer A (300 mM NaCl, 50 mM sodium phosphate buffer, pH 8.0) containing 10 mM imidazole and loaded onto a 2-mL Ni-NTA agarose (QIAGEN GmbH, Hilden, Germany) column. The column was washed with 3 column volumes of wash buffer (buffer A containing 20 mM imidazole) to remove unbound proteins, and LIVBP was eluted with one column volume of elution buffer (buffer A containing 250 mM imidazole). The thus prepared protein samples were used for the analytical experiments.
The expression and purification levels of LIVBP were determined by SDS-PAGE. The protein concentration was determined by the Bradford method using the Bio-Rad Protein Assay Kit (CA, USA), with bovine serum albumin as the standard protein.

3.5 Autofluorescence monitoring

Both the purified wild-type and engineered LIVBPs were subjected to the analysis of BCAA binding ability. The autofluorescence of the LIVBPs was monitored in a 0.5 x 0.5 cm cuvette using a FP-6500 ETC-273 spectrofluorometer (JASCO, Tokyo, Japan) with a thermostat cell holder. The slits of the excitation and emission monochromators were set at 1 nm and 3 nm, respectively. With an excitation wavelength of 295 nm, the fluorescence intensity at 330 nm was measured as the maximal intensity after the incubation of the LIVBPs at a final concentration of 1.2 μM in 30mM MOPS buffer (pH 7.0)!with Leu for 2 min at 25 °C. The relative intensity changes (ΔF·F0−1) were calculated as the percentage of the total intensity in the absence of substrate, and were used to evaluate the LIVBP autofluorescence changes.

3.6 Fluorescence modification of the engineered LIVBPs

Purified engineered LIVBPs were modified with the environmentally sensitive fluorophores acrylodan or MIANS, as described in the Molecular Probes Manual for thiol-reactive probes. Briefly, each purified engineered LIVBP was incubated at a concentration of 30 μM in 30 mM MOPS, pH 7.0, containing 300 μM of each fluorophore for 2.5 h at 25 °C. The unconjugated fluorophore was removed using a gel filtration column (5 mL, Molecular Probes) equilibrated with 30 mM MOPS buffer (pH 7.0).

3.7 Fluorescence measurement of BCAAs using the engineered LIVBPs

The fluorescence of the fluorophore-conjugated engineered LIVBPs was monitored using the same system as in autofluorescence monitoring. The slits of excitation and emission monochromators were set at 3 nm and 10 nm, respectively. The excitation wavelength for acrylodan and MIANS were 383 nm and 325 nm, respectively. The maximum intensity was measured after incubating the fluorophore-conjugated engineered LIVBPs at a final concentration of 0.4 μM in 30 mM MOPS buffer (pH 7.0) with Leu for 2 min at 25 °C.
The intensity changes in the MIANS-LIVBP (Gln149Cys) fluorescence with each of the three BCAAs, tyrosine, phenylalanine, or the BCAA mixtures were determined to investigate the potential of fluorescence-modified engineered LIVBPs as elements in BCAA biosensing. BCAA mixtures at two different Leu:Ile:Val ratios (29:15:56 and 28:22:50) were prepared. The dissociation constants were calculated using the Scatchard plot with the ratio of the fluorescence intensity change (ΔF·F0−1) to the ligand concentration.
Figure 1. Fluorophore modification sites on open (A) and closed (B) forms of LIVBP X-ray 3D structures (PDB: 1Z16 and 1Z15, respectively). Trp residues are shown in stick and ball form. The residues (Ser79, Ala100, Thr102, Tyr202, and Glu226) shown in space fill style are predicted to make up the substrate binding domain. The residues selected for substitution to Cys (Gln149, Gly227, and Gln254) are shown in stick form. !
Ijms 08 00513f1
Figure 2. Correlation between fluorescence intensity change and Leu concentration. The autofluorescence intensity changes at 330 nm of wild-type LIVBP (lozenge ◆) and its mutants, Gln149Cys (square ■), Gly277Cys (triangle ▲), and Gln254Cys (circle ●), were determined at different Leu concentrations. Error bars indicate SD (n=3).
Ijms 08 00513f2
Figure 3. Effect of Leu binding on the fluorescence spectrum of MIANS-conjugated-LIVBP (Gln149Cys-M). The fluorescence emission spectra of MIANS-conjugated LIVBP mutant Gln149Cys (0.4 μM) were determined in the absence (broken line) and presence (solid line) of 4 μM Leu.
Ijms 08 00513f3
Figure 4. Correlation between fluorescence intensity change and Leu concentration for fluorophore modified-LIVBPs. The fluorescence intensity changes of fluorophore modified-LIVBP at a final concentration of 1.2 μM at 434 nm for Gln149Cys-M (filled square ■) and Gln254Cys-M (circle ●), and at 517 nm for Gln149Cys-Ac (triangle ▲) were determined at different Leu concentrations. Error bars indicate SD (n=3).
Ijms 08 00513f4
Figure 5. Effect of BCAAs and phenylalanine on the fluorescent intensity change of Gln149Cys- MIANS. The fluorescence intensity changes (at 434 nm) of MIANS-modified LIVBP at a final concentration of 0.4 μM were determined with different ligand concentrations; Leu (lozenge ◆), Ile (square ■), Val (triangle ▲), and Phe (circle ●). Error bars indicate SD (n=3).
Ijms 08 00513f5
Figure 6. Correlation between fluorescence intensity change of Gln149Cys-MIANS and BCAA mixtures. The fluorescence intensity changes (at 434 nm) of Gln149Cys-MIANS at a final concentration of 0.4 μM were determined at different concentrations of BCAA mixtures; mixture 1) Leu:Ile:Val = 29:15:56 (lozenge ◆), mixture 2) Leu:Ile:Val = 28:22:50 (square ■). Error bars indicate SD (n=3).
Ijms 08 00513f6
Table 1. Primers used for cloning and mutagenesis of LIVBP.
NameSequence
livJ F5′-GGATTCTCCATATGAACATAAAGGGTAAAGC-3′Cloning
livJ R5′-GATTAAAAGCTTCTTCGCATCGGTCGCCGTG-3′Cloning
Q149CF5′-GTTCACGACAAACAGTGCTACGGCGAAGGTC TGGCG-3′For Gln149Cys mutant
Q149CR5′-CGCCAGACCTTCGCCGTAGCACTGTTTGTCGT GAAC-3′For Gln149Cys mutant
G227CF5′-GTTTATGGGGCCGGAATGCGTGGCTAACGTTTC G-3′For Gly227Cys mutant
G227CR5′-CGAAACGTTAGCCACGCATTCCGGCCCCATAA AC-3′For Gly227Cys mutant
Q254CF5′-CAAGCCGAAGAACTACGATTGCGTTCCGGCGA ACAAACC-3′For Apn254Cys mutant
Q254CR5′-GGTTTGTTCGCCGGAACGCAATCGTAGTTCTTC GGCTTG-3′For Apn254Cys mutant
*underlined letters indicate site of mutation

References and Notes

  1. Wandersman, C.; Schwartz, M.; !Ferenci, T. Escherichia coli mutants impaired in maltodextrin transport. J. Bacteriol 1979, 140, 1–13. [Google Scholar]
  2. Oh, B.H.; Kang, C.H.; De Bondt, H.; Kim, S.H.; Nikaido, K.; Joshi, A.K.; !Ames, G.F. The bacterial periplasmic histidine-binding protein. structure/function analysis of the ligand-binding site and comparison with related proteins. J. Biol. Chem 1994, 269, 4135–4143. [Google Scholar]
  3. Powlowski, J.; !Sahlman, L. Reactivity of the two essential cysteine residues of the periplasmic mercuric ion-binding protein, MerP. J. Biol. Chem 1999, 274, 33320–33326. [Google Scholar]
  4. Jacobson, B.L.; He, J.J.; Vermersch, P.S.; Lemon, D.D.; !Quiocho, F.A. Engineered interdomain disulfide in the periplasmic receptor for sulfate transport reduces flexibility. Site-directed mutagenesis and ligand-binding studies. J. Biol. Chem 1991, 266, 5220–5225. [Google Scholar]
  5. Davies, T.G.; Hubbard, R.E.; !Tame, J.R. Relating structure to thermodynamics: the crystal structures and binding affinity of eight OppA-peptide complexes. Protein. Sci 1999, 8, 1432–1444. [Google Scholar]
  6. Dwyer, M.A.; Hellinga, H.W. Periplasmic binding proteins: a versatile superfamily for protein engineering. Curr. Opin. Struct. Biol 2004, 14, 495–504. [Google Scholar]
  7. de Lorimier, R.M.; Smith, J.J.; Dwyer, M.A.; Looger, L.L.; Sali, K.M.; Paavola, C.D.; Rizk, S.S.; Sadigov, S.; Conrad, D.W.; Loew, L.; Hellinga, H.W. Construction of a fluorescent biosensor family. Protein. Sci 2002, 11, 2655–2675. [Google Scholar]
  8. Oxender, D.L.; Anderson, J.J.; Daniels, C.J.; Landick, R.; Gunsalus, R.P.; Zurawski, G.; Selker, E.; Yanofsky, C. Structural and functional analysis of cloned DNA containing genes responsible for branched-chain amino acid transport in Escherichia coli. Proc. Natl. Acad. Sci. U. S. A 1980, 77, 1412–1416. [Google Scholar]
  9. Vorotyntseva, T.I.; Surin, A.M.; Trakhanov, S.D.; Nabiev, I.R.; Antonov, V.K. Spectral properties of the leucine-isoleucine-valine binding protein and its complexes with substrates. Bioorg. Khim 1981, 7, 45–57. [Google Scholar]
  10. Fischer, J.E.; Rosen, H.M.; Ebeid, A.M.; James, J.H.; Keane, J.M.; Soeters, P.B. The effect of normalization of plasma amino acids on hepatic encephalopathy in man. Surgery 1976, 80, 77–91. [Google Scholar]
  11. Fischer, J.E.; Yoshimura, N.; Aguirre, A.; James, J.H.; Cummings, M.G.; Abel, R.M.; Deindoerfer, F. Plasma amino acids in patients with hepatic encephalopathy. Effects of amino acid infusions. Am. J. Surg 1974, 127, 40–47. [Google Scholar]
  12. Soeters, P.B.; Fischer, J.E. Insulin, glucagon, amino acid imbalance, and hepatic encephalopathy. Lancet 1976, 2, 880–882. [Google Scholar]
  13. Klassen, P.; Furst, P.; Schulz, C.; Mazariegos, M.; Solomons, N.W. Plasma free amino acid concentrations in healthy Guatemalan adults and in patients with classic dengue. Am. J. Clin. Nutr 2001, 73, 647–52. [Google Scholar]
  14. Nishitani, S.; Ijichi, C.; Takehana, K.; Fujitani, S.; Sonaka, I. Pharmacological activities of branched-chain amino acids: specificity of tissue and signal transduction. Biochem Biophys Res Commun 2004, 313, 387–9. [Google Scholar]
  15. Nieuwoudt, M.; Kunnike, R.; Smuts, M.; Becker, J.; Stegmann, GF.; Van der Walt, C.; Neser, J.; Van der Merwe, S. Standardization criteria for an ischemic surgical model of acute hepatic failure in pigs. Biomaterials 2006, 27, 3836–45. [Google Scholar]
  16. Dickinson, J.C.; Rosenblum, H.; Hamilton, P.B. Ion Exchange Chromatography of the Free Amino Acids in the Plasma of the Newborn Infant. Pediatrics 1965, 36, 2–13. [Google Scholar]
  17. Hughes, G.J.; Winterhalter, K.H.; Boller, W.; Wilson, K.J. Amino acid analysis using standard high-performance liquid chromatography equipment. J. Chromatogr 1982, 235, 417–426. [Google Scholar]
  18. Azuma, Y.; Maekawa, M.; Kuwabara, Y.; Nakajima, T.; Taniguchi, K.; Kanno, T. Determination of branched-chain amino acids and tyrosine in serum of patients with various hepatic diseases, and its clinical usefulness. Clin. Chem 1989, 35, 1399–1403. [Google Scholar]
  19. Nakamura, T.; Mori, M.; Yoshida, T.; Murakami, N.; Kato, T.; Sugihara, J.; Saito, K.; Moriwaki, H.; Tomita, E.; Muto, Y.; et al. Enzymatic determination of a molar ratio of free branched-chain amino acids to tyrosine (BTR) and its clinical significance in plasma of patients with various liver diseases. Rinsho Byori 1989, 37, 911–917. [Google Scholar]
  20. Dattelbaum, J.D.; Lakowicz, J.R. Optical determination of glutamine using a genetically Engineered protein. Anal. Biochem 2001, 291, 89–95. [Google Scholar]
  21. Salins, L.L.; Goldsmith, E.S.; Ensor, C.M.; Daunert, S. A fluorescence-based sensing system for the environmental monitoring of nickel using the nickel binding protein from Escherichia coli. Anal. Bioanal. Chem 2002, 372, 174–80. [Google Scholar]
  22. Morgan, M.Y.; Marshall, A.W.; Milsom, J.P.; Sherlock, S. Plasma amino-acid patterns in liver disease. Gut 1982, 23, 362–370. [Google Scholar]
  23. Abe, A.; Okuno, M.; Noma, A.; Imamine, T.; Nakamura, T.; Muto, Y. Enzymatic Assay of tyrosine and branched-chain Amino Acids in Plasma and Its Application to Liver Diseases. Jpn. J. Clin. Chem 1990, 19, 124–130. [Google Scholar]
  24. Landick, R.; Oxender, D.L. The complete nucleotide sequences of the Escherichia coli LIV-BP and LS-BP genes. Implications for the mechanism of high-affinity branched-chain amino acid transport. J. Biol. Chem 1985, 260, 8257–8261. [Google Scholar]

