Article

Differences in Functional Expression of Connexin43 and NaV1.5 by Pan- and Class-Selective Histone Deacetylase Inhibition in Heart

1
Department of Pharmacology, State University of New York (SUNY) Upstate Medical University, Syracuse, NY 13210, USA
2
Department of Cell and Molecular Biology, SUNY Upstate Medical University, Syracuse, NY 13210, USA
*
Author to whom correspondence should be addressed.
Current Address: Department of Psychiatry, Brain Research Center, The University of British Columbia, 2255 Wesbrook Mall, Vancouver, BC V6T 1Z3, Canada.
Int. J. Mol. Sci. 2018, 19(8), 2288; https://doi.org/10.3390/ijms19082288
Submission received: 15 July 2018 / Revised: 1 August 2018 / Accepted: 2 August 2018 / Published: 4 August 2018
(This article belongs to the Special Issue Histone Deacetylase Inhibitors in Health and Disease)

Abstract

:
Class-selective histone deacetylase (HDAC) inhibitors were designed to improve safety profiles and therapeutic effectiveness in the treatment of multiple cancers relative to pan-HDAC inhibitors. However, the underlying mechanisms for their therapeutic and cardiotoxic potentials remain poorly understood. Cardiac sodium currents (INa) and gap junction conductance (gj) were measured by whole cell patch clamp techniques on primary cultures of neonatal cardiomyocytes. Cardiac NaV1.5 sodium channel and connexin43 (Cx43) gap junction protein levels were assessed by Western blot analyses. Panobinostat produced concentration-dependent reductions in ventricular gj, peak INa density, and NaV1.5 protein expression levels. Membrane voltage (Vm)-dependent activation of INa was shifted by +3 to 6 mV with no effect on inactivation. Entinostat (1 μM) did not affect ventricular gj, peak INa density, or INa activation. However, the INa half-inactivation voltage (V½) was shifted by −3.5 mV. Ricolinostat had only minor effects on ventricular gj and INa properties, though INa activation was shifted by −4 mV. Cx43 and NaV1.5 protein expression levels were not altered by class-selective HDAC inhibitors. The lack of effects of class-selective HDAC inhibitors on ventricular gj and INa may help explain the improved cardiac safety profile of entinostat and ricolinostat.

Graphical Abstract

1. Introduction

Histone acetyltransferases (HATs) and histone deacetylases (HDACs) regulate the dynamic balance between acetylation and deacetylation of lysine residues of both histone and non-histone proteins. Non-histone proteins are involved in numerous critical cellular physiological functions, including apoptosis, autophagy and DNA damage repair [1]. HDACs have been suggested to be overexpressed in tumor cells and alter the expression and function of many tumor suppressor genes like p53 [2,3]. However, the four U. S. Food and Drug Administration (FDA) approved pan-HDAC inhibitors are limited to non-solid tumors and have been reported to cause serious cardiotoxicities such as QT interval prolongation, ventricular arrhythmia and unexpected sudden cardiac death [4,5,6,7]. In order to improve their effectiveness on solid tumors as well as to minimize their cardiac side effects, a new generation of HDAC inhibitors, class-selective HDAC inhibitors were designed and developed [8]. Significantly, some of them have shown promising therapeutic effects against leukemias as well as breast and lung cancers with less cardiotoxicities [9,10,11,12]. However, the mechanisms behind their therapeutic and lack of cardiotoxic potentials is still unclear.
Our previous studies have suggested the involvement of the inward depolarizing cardiac sodium current (INa) and connexin43 (Cx43) on pan-HDAC inhibitor induced cardiac side effects [13,14]. Physiologically, Cx43, the predominant gap junction protein in the ventricles, is required for synchronous longitudinal and transverse conduction of cardiac action potentials throughout the heart [15]. Furthermore, cardiac INa through the voltage-gated cardiac sodium channel (Nav1.5) is vital for normal cardiac electrical activity [16]. Gain or loss of function of this protein is related to long QT syndrome or Brugada syndrome [17]. Previous research in our laboratory has indicated that both the protein expression of Cx43 and Nav1.5 and their resultant electrophysiological currents were reduced by pan-HDAC inhibition [13,14]. These functional reductions in rapid depolarization and electrical coupling likely contribute to decreased excitability and slowed conduction, thereby increasing the vulnerability to reentrant arrhythmias. Since entinostat (MS-275), a class I selective HDAC inhibitor, apparently causes minimal cardiotoxic effects [7,8,18], we hypothesize that class-selective HDAC inhibition does not cause the functional downregulation of the cardiac INa or gap junction conductance (gj) observed with the first two FDA-approved pan-HDAC inhibitors, vorinostat (VOR, Zolinza®) and romidepsin (FK228, Istodax®) [13,14]. In this study, we examine the effects of another FDA-approved HDAC inhibitor, panobinostat (LBH589, Farydak®), and two clinical trial class-selective HDAC inhibitors, entinostat (MS-275, HDAC class I selective), and ricolinostat (ACY-1215, HDAC class IIb selective), on Cx43-mediated cardiac gap junction coupling and excitatory cardiac sodium current density mediated primarily by NaV1.5.

2. Results

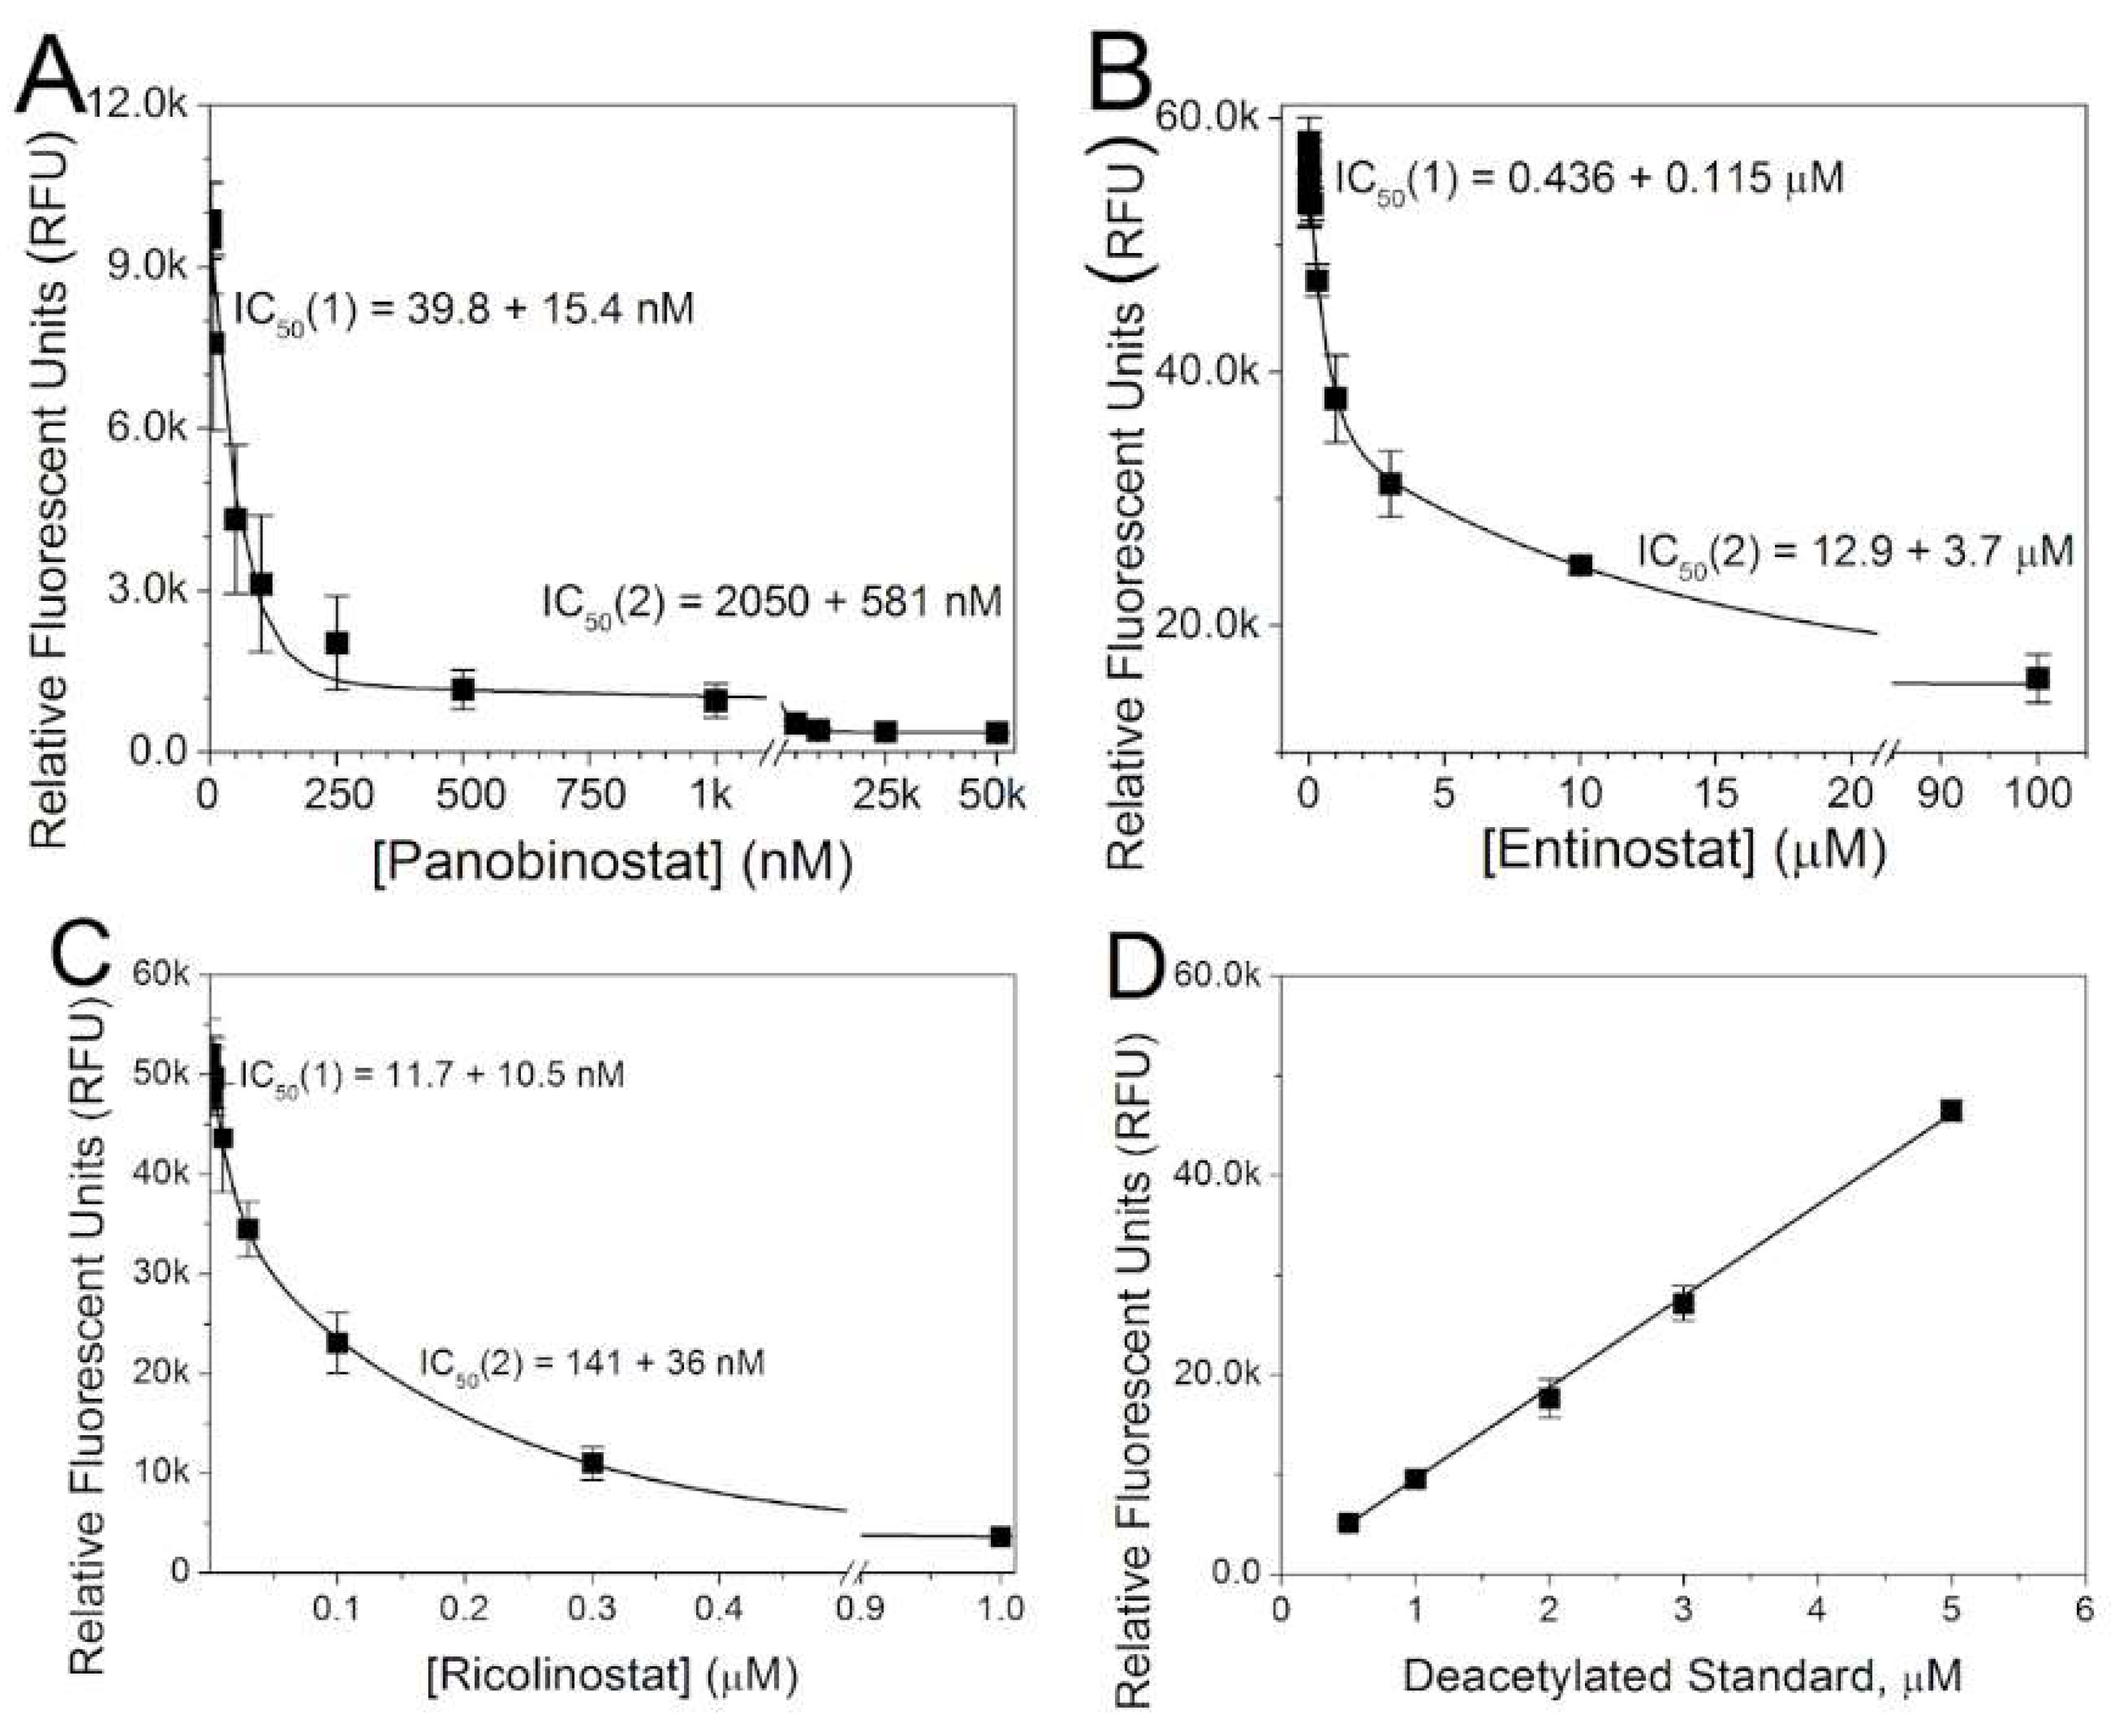
2.1. Inhibition of Cardiac HDAC Activity by Pan- and Class-Selective HDAC Inhibitors

The inhibitory action of panobinostat, entinostat, and ricolinostat on total HDAC activity in cultured ventricular cardiomyocytes was assessed using the fluorometric Fluor de Lys assay as performed in our previous studies [13,14]. As with Trichostatin A (TSA), vorinostat (VOR), and romidepsin (FK228), the inhibitory dose-response curves for the three HDAC inhibitors used in this study were best described by a double exponential decay curve, indicative of two inhibitory sites with a >10-fold difference in the apparent IC50s between the high and low affinity HDAC inhibitory sites (Figure 1). The fluorometric data was fitted with the equation RFU = A1·exp(−[HDACI]/C1) + A2·exp(−[HDACI]/C2) + B where AX = the amplitude of each exponential component, [HDACI] = HDAC inhibitor concentration, CX = the decay constant for each exponential component, B = the background fluorescence count constant, RFU = relative fluorescence units = total counts for each sample, and the IC50 = 0.693·CX for each apparent inhibitory site. The fit parameters for all HDACIs examined thus far are listed in Table 1.
Thus far, all HDAC inhibitors tested on cultured neonatal mouse ventricular cardiomyocytes (NMVMs) exhibit two apparent IC50s for total HDAC activity, which we hypothesize corresponds to the different classes (I, II, IV) and subclasses (IIa/b) of zinc-dependent HDACs. Entinostat is reported to inhibit HDACs 1 and 3 with an IC50 <1 μM and exhibits incomplete inhibition of HeLa nuclear extract HDAC activity with an IC50 of 11 μM [19]. Our apparent high and low affinity IC50s for total cardiac HDAC activity of 0.43 and 12.9 nM are in close agreement with these IC50 values. Ricolinostat possesses >10-fold selectivity for HDAC6 over HDACs 1, 2, and 3 with IC50s of approximately 5 and 50 nM, respectively [20]. Our observed IC50s of 12 and 140 nM are approximately 2 times higher than those reported IC50s, but are otherwise consistent with HDAC6 and HDAC1-3 inhibition.

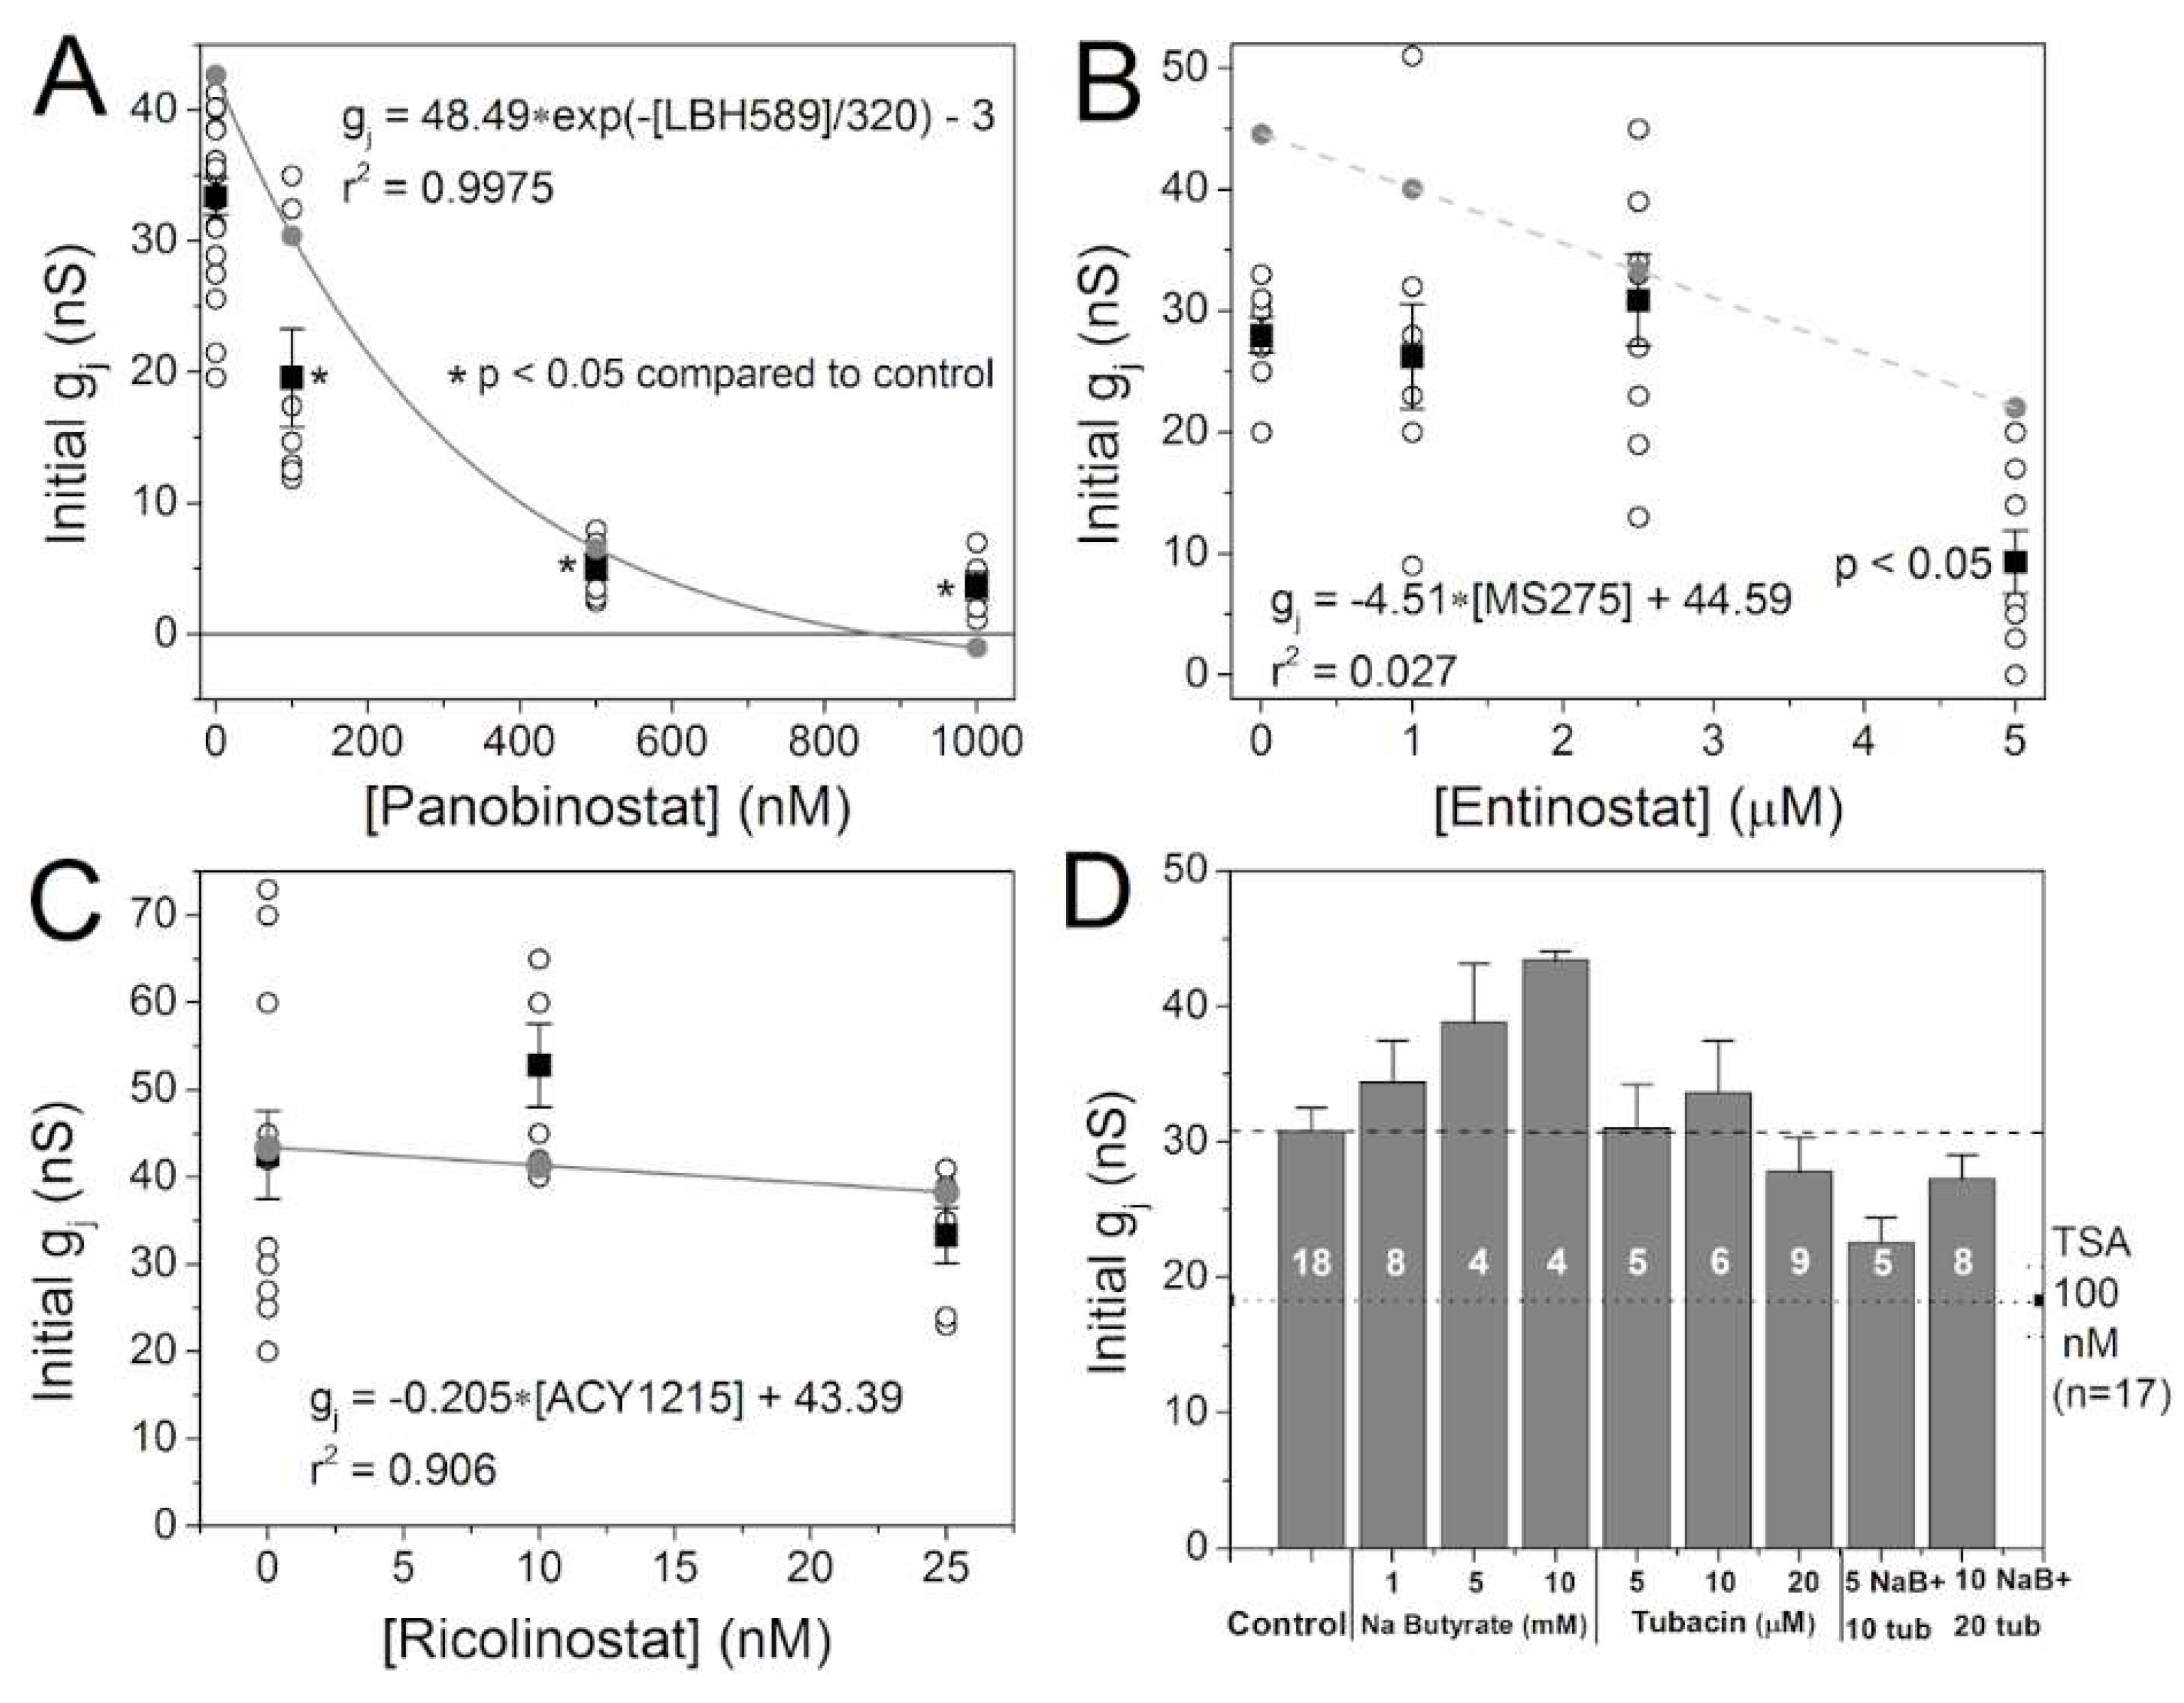
2.2. Effects of Class-Selective HDAC Inhibitors on Gap Junction Coupling

Previous results with three pan-HDACIs consistently showed a dose-dependent decrease in cardiac ventricular gap junction conductance (gj) [14]. To assess whether this observation holds true for panobinostat and if class I and IIb HDAC inhibition has similar effects, gj was measured in NMVM cell pairs after 18–24 h treatment with varying concentrations of panobinostat, entinostat, and ricolinostat. Consistent with previous findings, pan-HDAC inhibition by panobinostat produced a significant dose-dependent decrease in ventricular gj (Figure 2A). The concentration-dependent decline in gj by panobinostat was best fit by an exponentially decaying function with an amplitude of 48.5 and exponential decay constant of 320 nM (gray points and curve). By contrast, class I HDAC-selective inhibition by 1 or 2.5 μM entinostat did not reduce gj, though a significant reduction in gj was obtained with 5 μM entinostat, 10-fold higher than the observed high affinity IC50 that likely corresponds to the class I-selective HDAC inhibition (Figure 2B). Linear regression fits correlated poorly with the gj – [entinostat] relationship (gray points and dashed gray line). Class IIb HDAC inhibition with 10 or 25 nM ricolinostat produced modest but non-significant increases and decreases in gj, respectively (Figure 2C). Linear regression analysis of this data produced a straight line with a slope of only −0.2 ns/nM ricolinostat (gray points and line). These results suggest that class-selective HDAC inhibition does not affect ventricular gj as dramatically as pan-HDAC inhibition, and even then only produces downregulatory effects only when HDACI concentrations were high enough to begin to exceed the HDAC class-selective properties of entinostat and ricolinostat.
Prior to the development of entinostat and ricolinostat, we explored the combinatorial effect of class I and IIb HDAC inhibition using sodium butyrate and the prototypical HDAC6 inhibitor, tubacin [21]. Sodium butyrate (NaB) is a short chain fatty acid non-specific HDAC inhibitor with mM affinities for the class II HDACs, even weaker and incomplete inhibitory activity of class IIa HDAC isoforms, and no activity against the class IIb HDAC6 [22,23]. 4-phenylbutyrate (4-PB) belongs to this group of HDAC inhibitors and is known to upregulate Cx43 expression in human glioblastoma and embryonic kidney cells [24,25]. The HDAC inhibitory profiles of the HDAC inhibitors used in this study are listed in Table 2. The HDAC inhibition assays from the cited studies were performed using different reagents, but the highlighted columns indicate HDAC activities measured using the Fluor-De-Lys® substrate on recombinant human HDACs [23]. Sodium butyrate increased ventricular gj in a dose-dependent manner while tubacin exhibited a biphasic response, causing a slight increase in gj or no effect at low doses, followed by a slight decrease at the highest tested dose of 20 μM (Figure 2D). However, when we combined 5 mM NaB with 10 μM tubacin, concentrations of these two HDAC inhibitors that increased gj slightly when applied individually, the opposite effect occurred. The reduction in gj when combining 5 mM NaB and 10 μM tubacin was 25% relative to control gj values and 40% relative to 5 mM NaB, suggesting that combinatorial class I and IIb HDAC inhibition negatively affects ventricular gap junction coupling while inhibition of either of these two classes of HDACs alone has negligible effects.

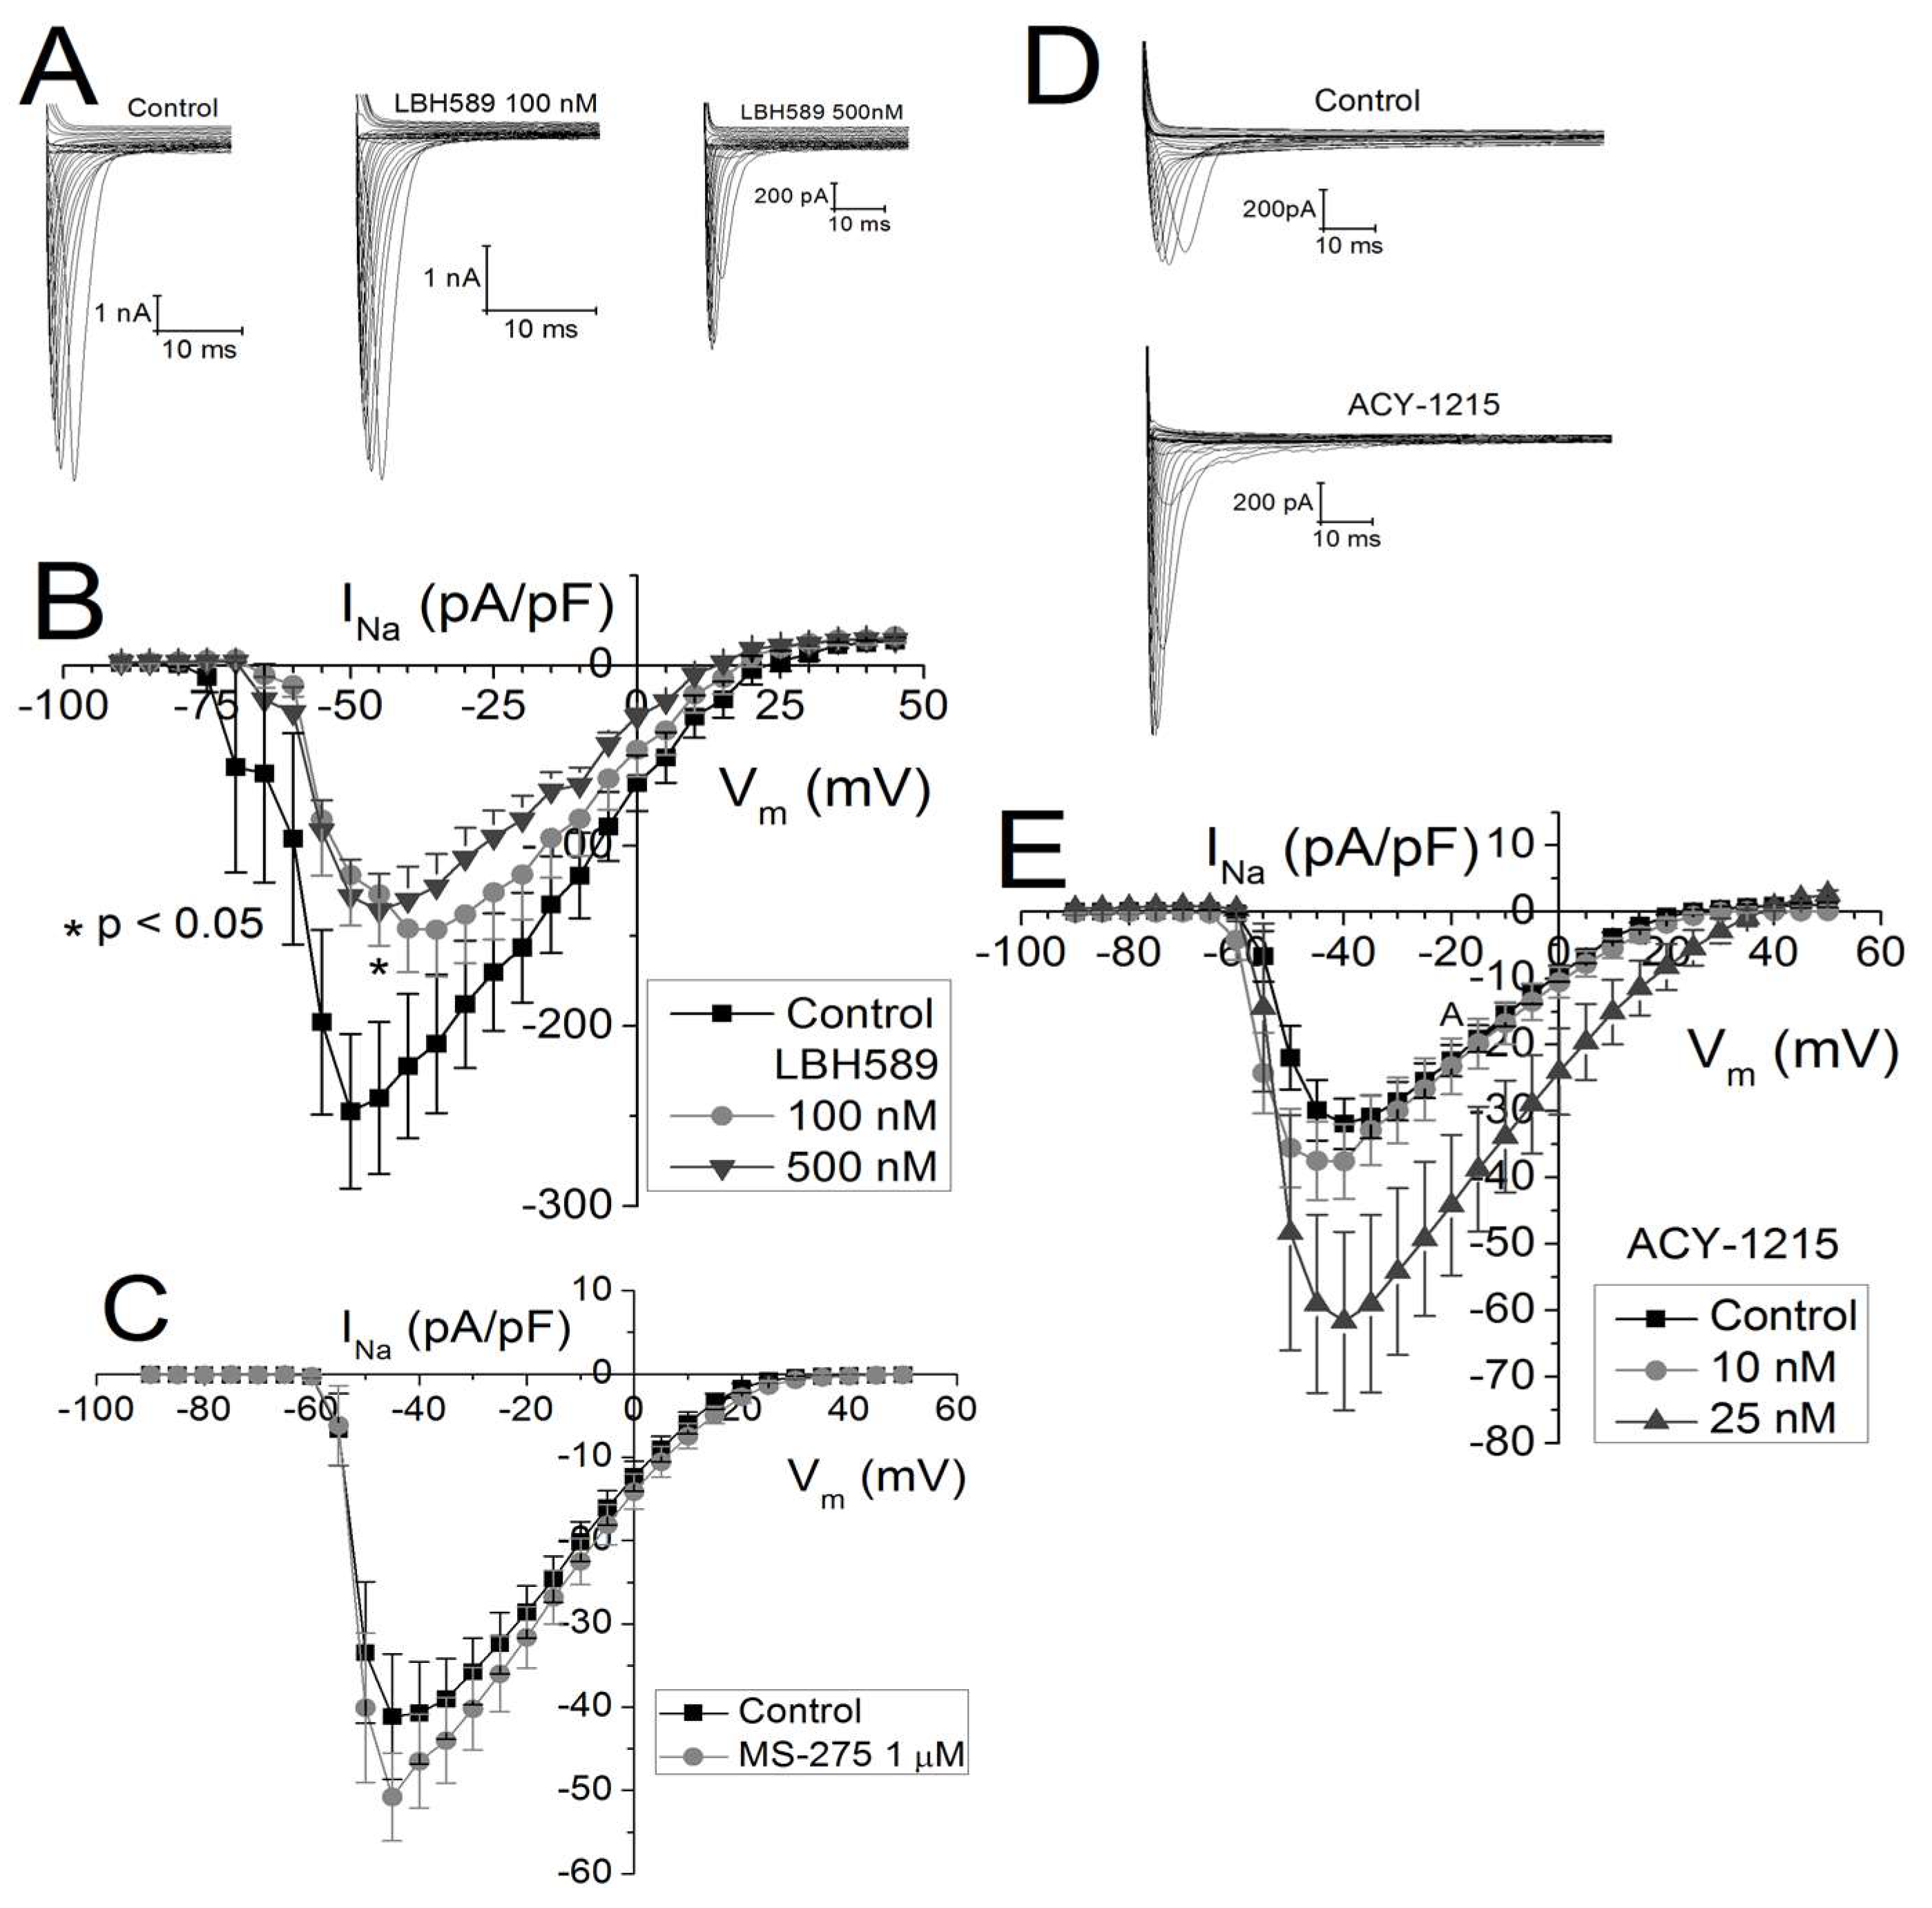
2.3. Effects of Class-Selective HDAC Inhibitors on Peak Cardiac Na+ Current Density

As with gap junction coupling, previous results with pan-HDAC inhibitors have revealed a significant reduction in sodium current density [13]. Thus, we examined the effect of panobinostat on the cardiac Na+ current density in NMVMs. True to form, panobinostat decreased the cardiac sodium current density in a dose-dependent manner (Figure 3A,B). Contrary to pan-HDAC inhibition, class I HDAC inhibition with 1 μM entinostat had no significant effect on the peak Na+ current density (Figure 3C). Surprisingly, the opposite effect was seen with HDAC6 inhibition by 25 nM ricolinostat (Figure 3D,E). Despite the apparent 93% increase in peak INa with 25 nM ricolinostat, the mean values did not achieve statistical significance (p = 0.054, one-way ANOVA).

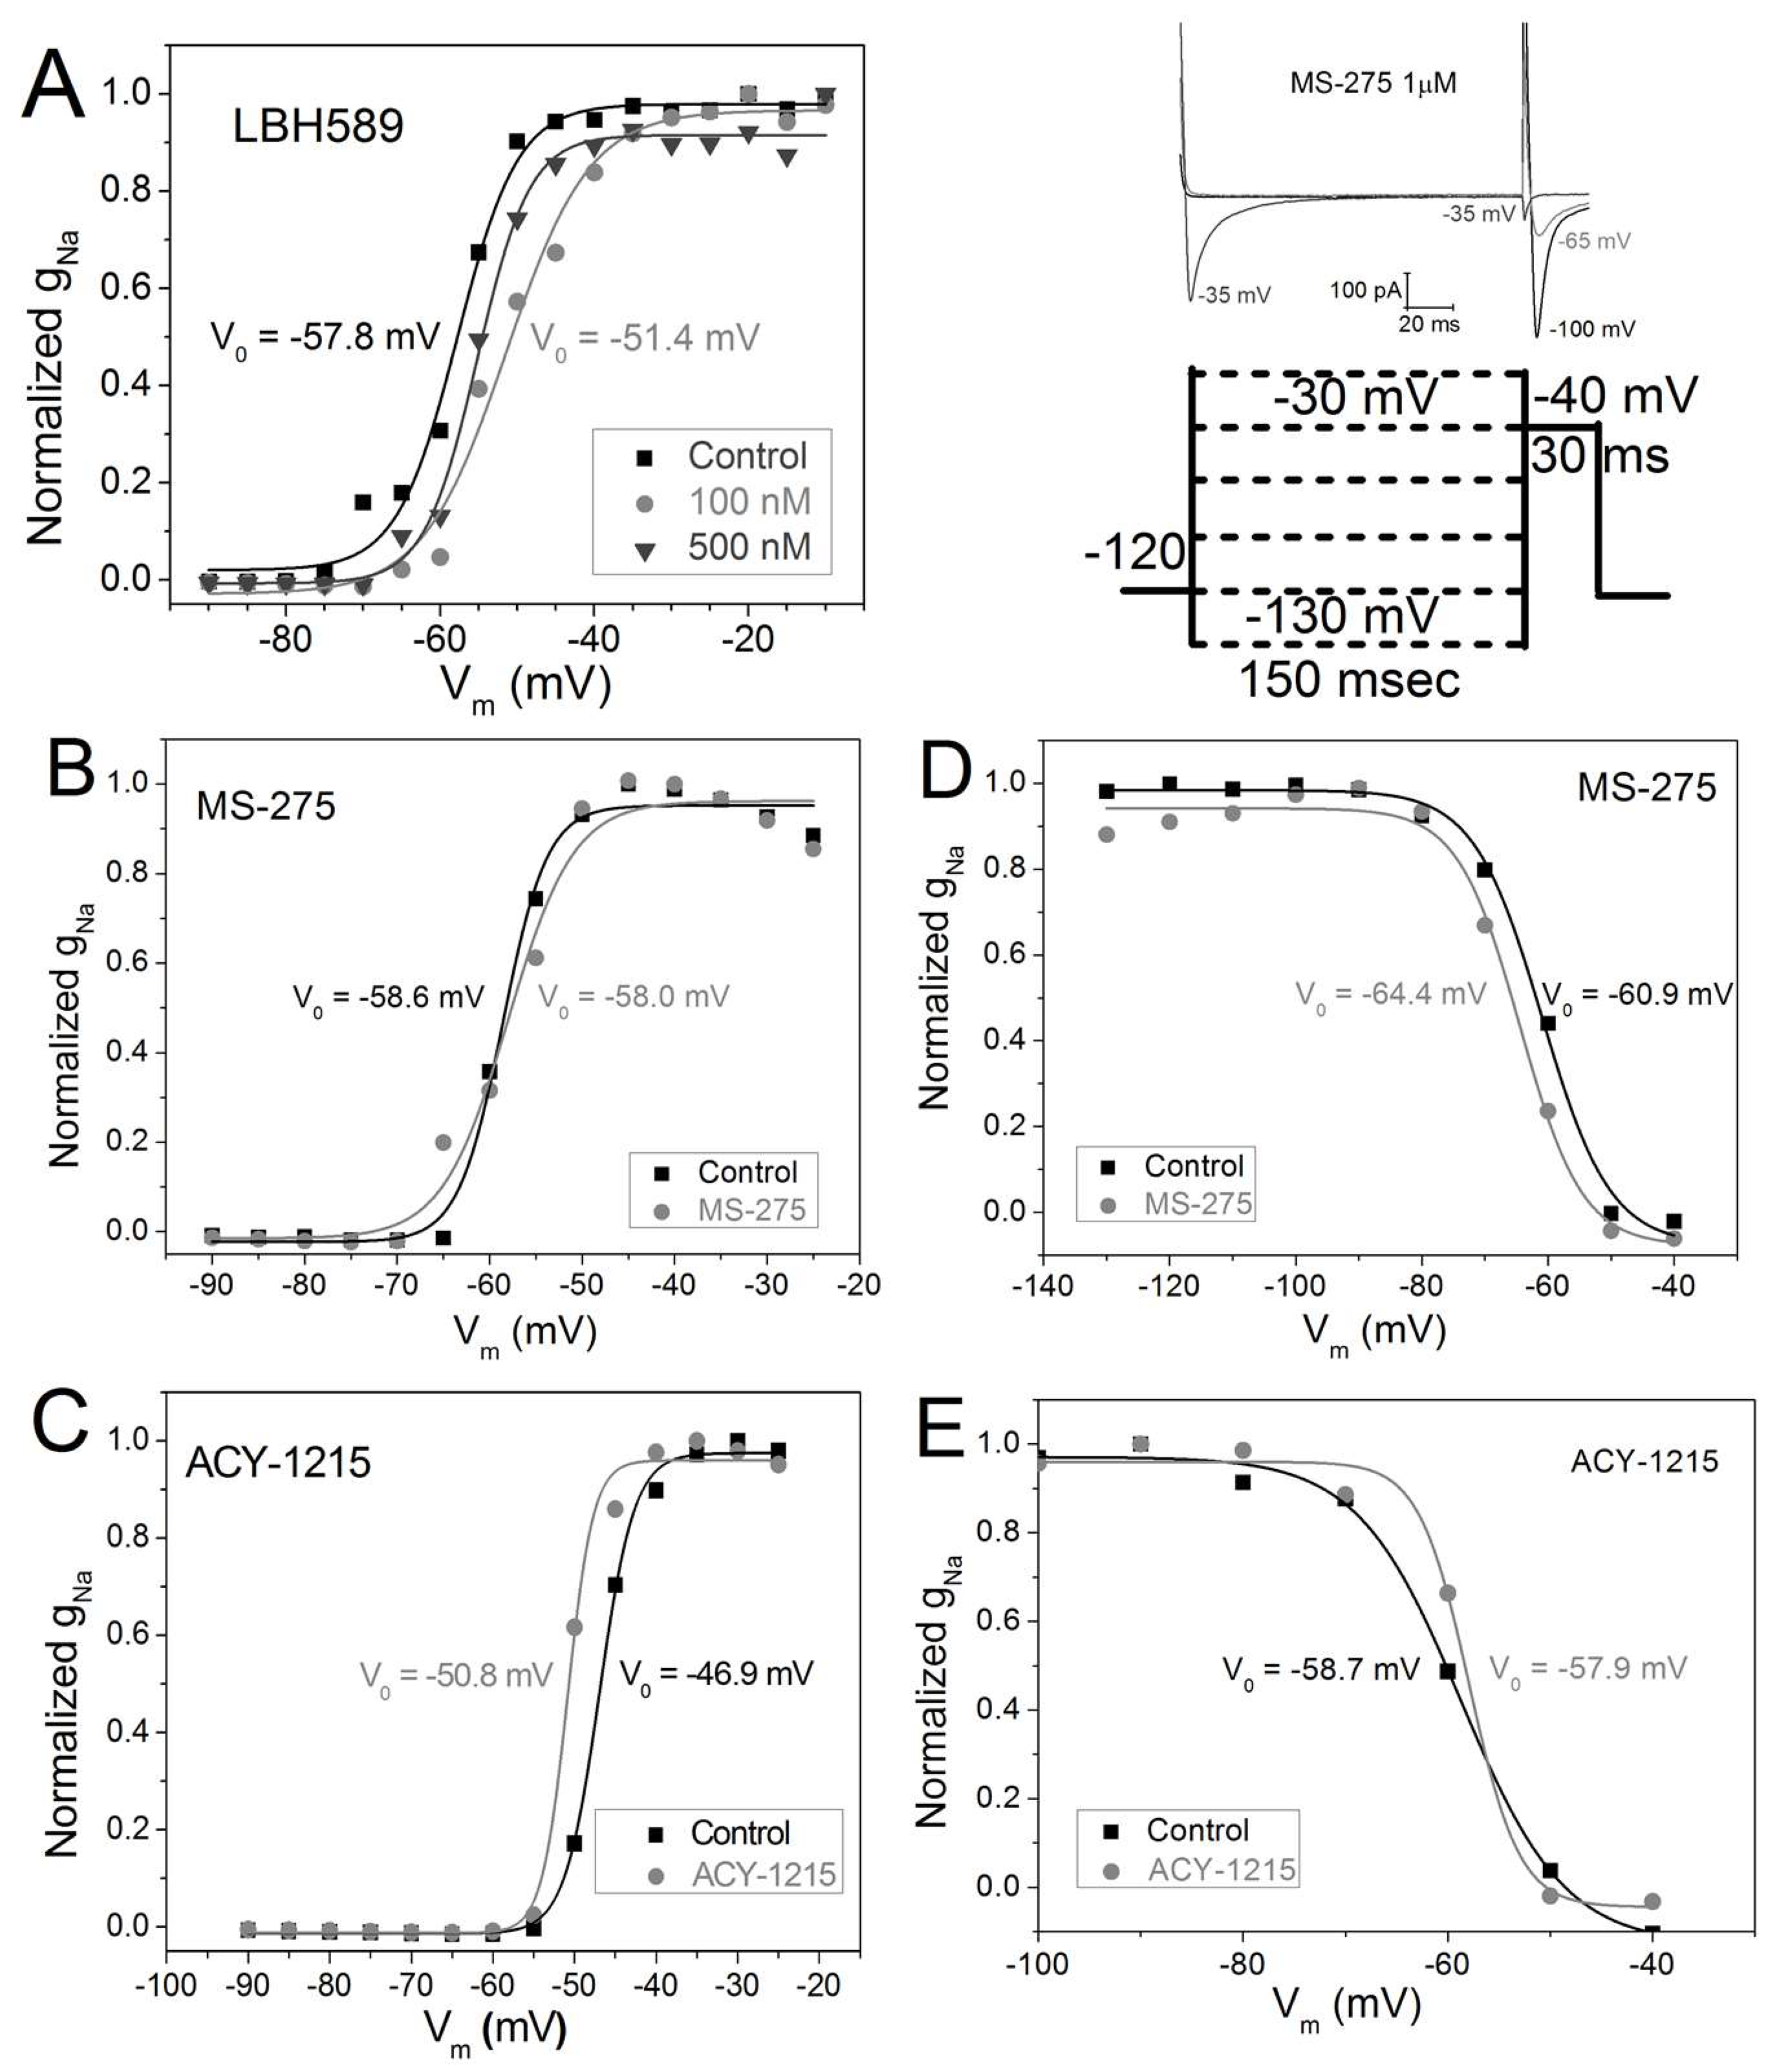
2.4. Vm-Dependence of gNa Activation and Inactivation

Since both the activation and inactivation of INa are dependent on the membrane potential (Vm), we calculated the normalized Na+ conductance (gNa) by dividing the average peak INa by the difference between Vm and the reversal potential (Erev) for INa, and then divided the gNa value for each Vm by the maximum gNa value for each experiment. The gNa–Vm curves were fit with a Boltzmann function g Na =   g Na max +   ( g Na   g Na max ) [ 1 + exp ( ( V m   V 1 / 2 ) d V m ) ] using Origin 8.6. A positive shift in the half activation voltage (V½) of +2 to +8 mV was seen with trichostatin A, vorinostat, and romidepsin in previous experiments [13]. A maximum positive shift in the gNa activation curve of +6.4 mV was observed with 100 nM panobinostat (Figure 4A), again consistent with previous findings using pan-HDAC inhibitors. No shift in the activation threshold is apparent in the entinostat I–V relationship and the gNa activation curve substantiates this observation (Figure 3C and Figure 4B). In contrast to the other HDAC inhibitors, 25 nM ricolinostat shifted the INa activation threshold and the gNa V½ by approximately −4 mV (Figure 3E and Figure 4C). Previously, no shift in the Vm-dependent gNa inactivation curved was observed trichostatin A, vorinostat, or romidepsin [13]. The gNa inactivation protocol was not performed on panobinostat treated NMVMs, but the V½ for inactivation was shifted by −3.5 mV in the presence of 1 μM entinostat. No shift in the gNa inactivation curve was observed with 25 nM ricolinostat. To summarize, pan-HDAC inhibition by panobinostat shifted the V½ for activation, consistent with previous pan-HDACIs. Class I HDAC inhibition by 1 μM entinostat had no effect on activation but shifted inactivation in the hyperpolarizing direction by 3–4 mV and HDAC6 inhibition with ricolinostat shifted activation approximately 4 mV negative while having no effect on inactivation.

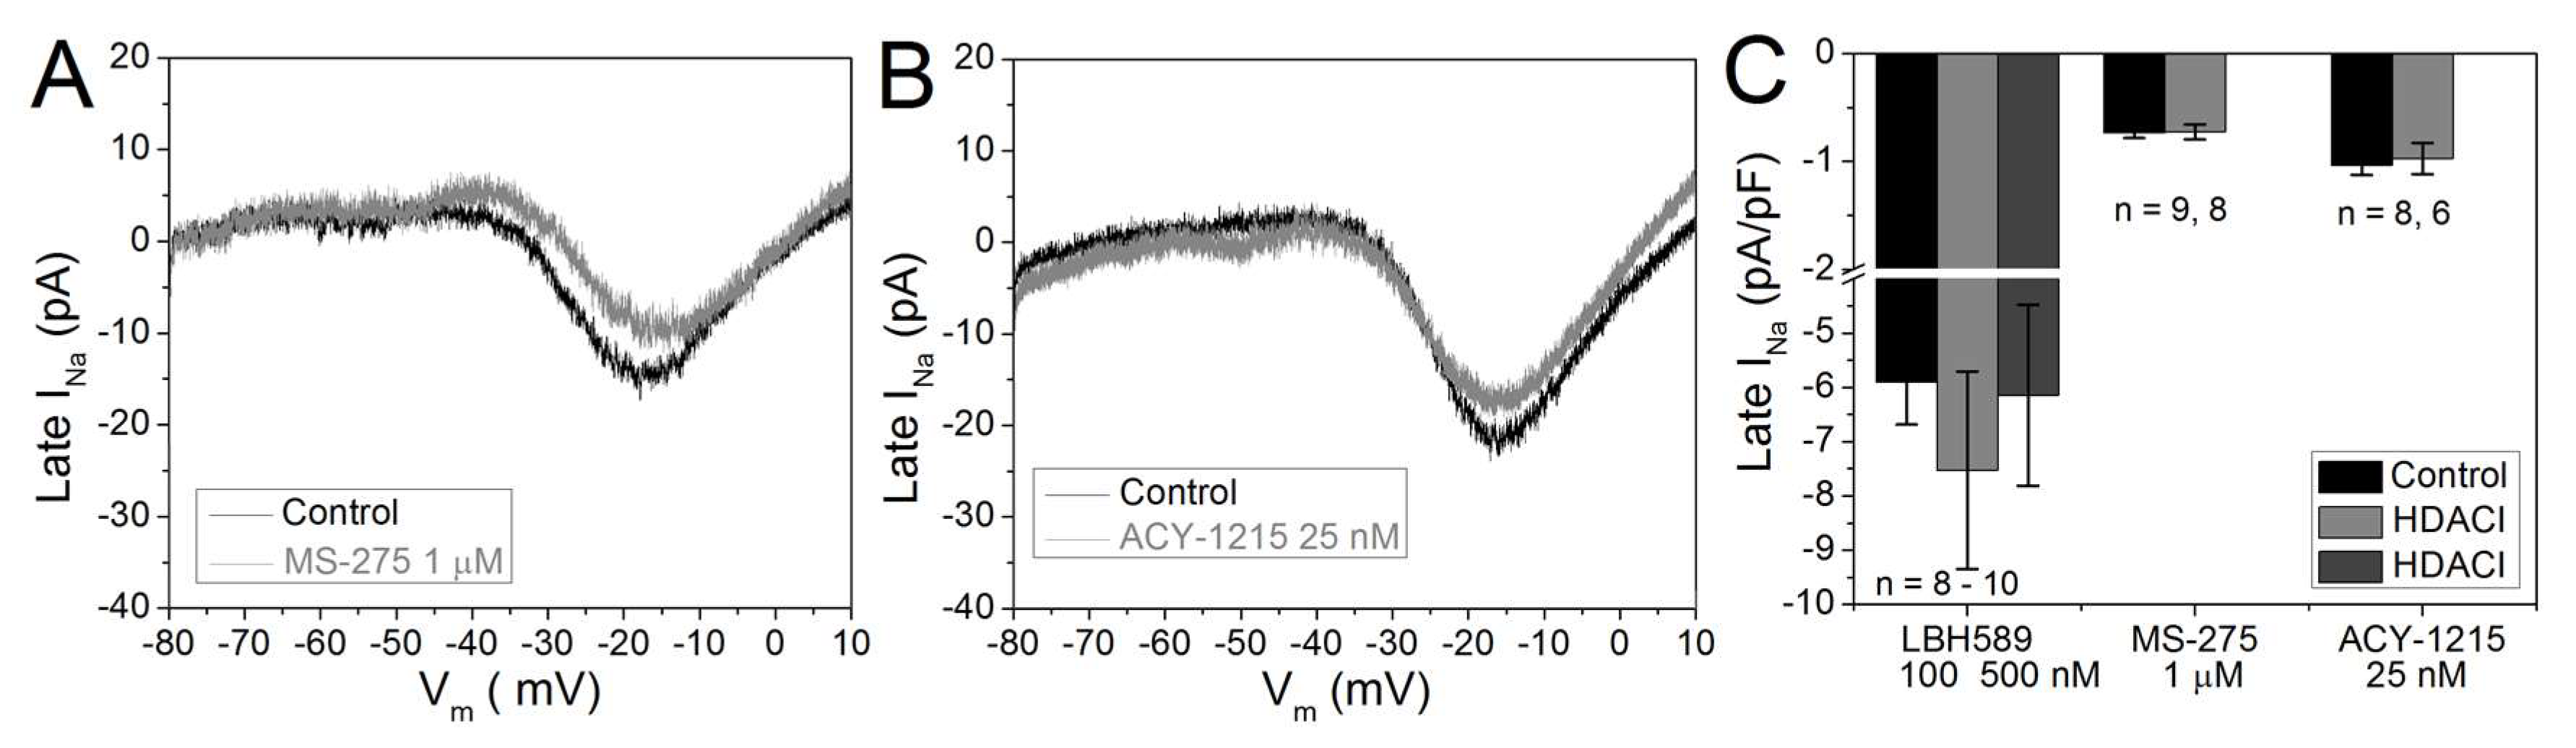
2.5. Cardiac Late INa

Increases in late or persistent INa have been linked to cardiac arrhythmias and heart failure [27]. To examine the effects of HDAC inhibitors on late INa, we either measured the average INa from 100 to 150 ms in response to the INa activating Vm steps or applied a slow (40 msec/mV) Vm ramp from −80 to +10 mV from a holding potential of −60 mV. Using the averaged inward whole cell current from 100 to 150 msec, no difference in late INa was observed after overnight treatment with 100 or 500 nM panobinostat compared to control INa recordings, again consistent with our previous pan-HDAC inhibitor results (Figure 5C). Subsequently, we modified a voltage clamp ramp protocol designed to generate late INa I–V relationships [28]. Late INa currents recorded from control, 1 μM entinostat, and 25 nM ricolinostat treated NMVMs are shown in Figure 5A,B. Again, no increase in late Na+ current density was observed with class I or IIb HDAC inhibition (Figure 5C).

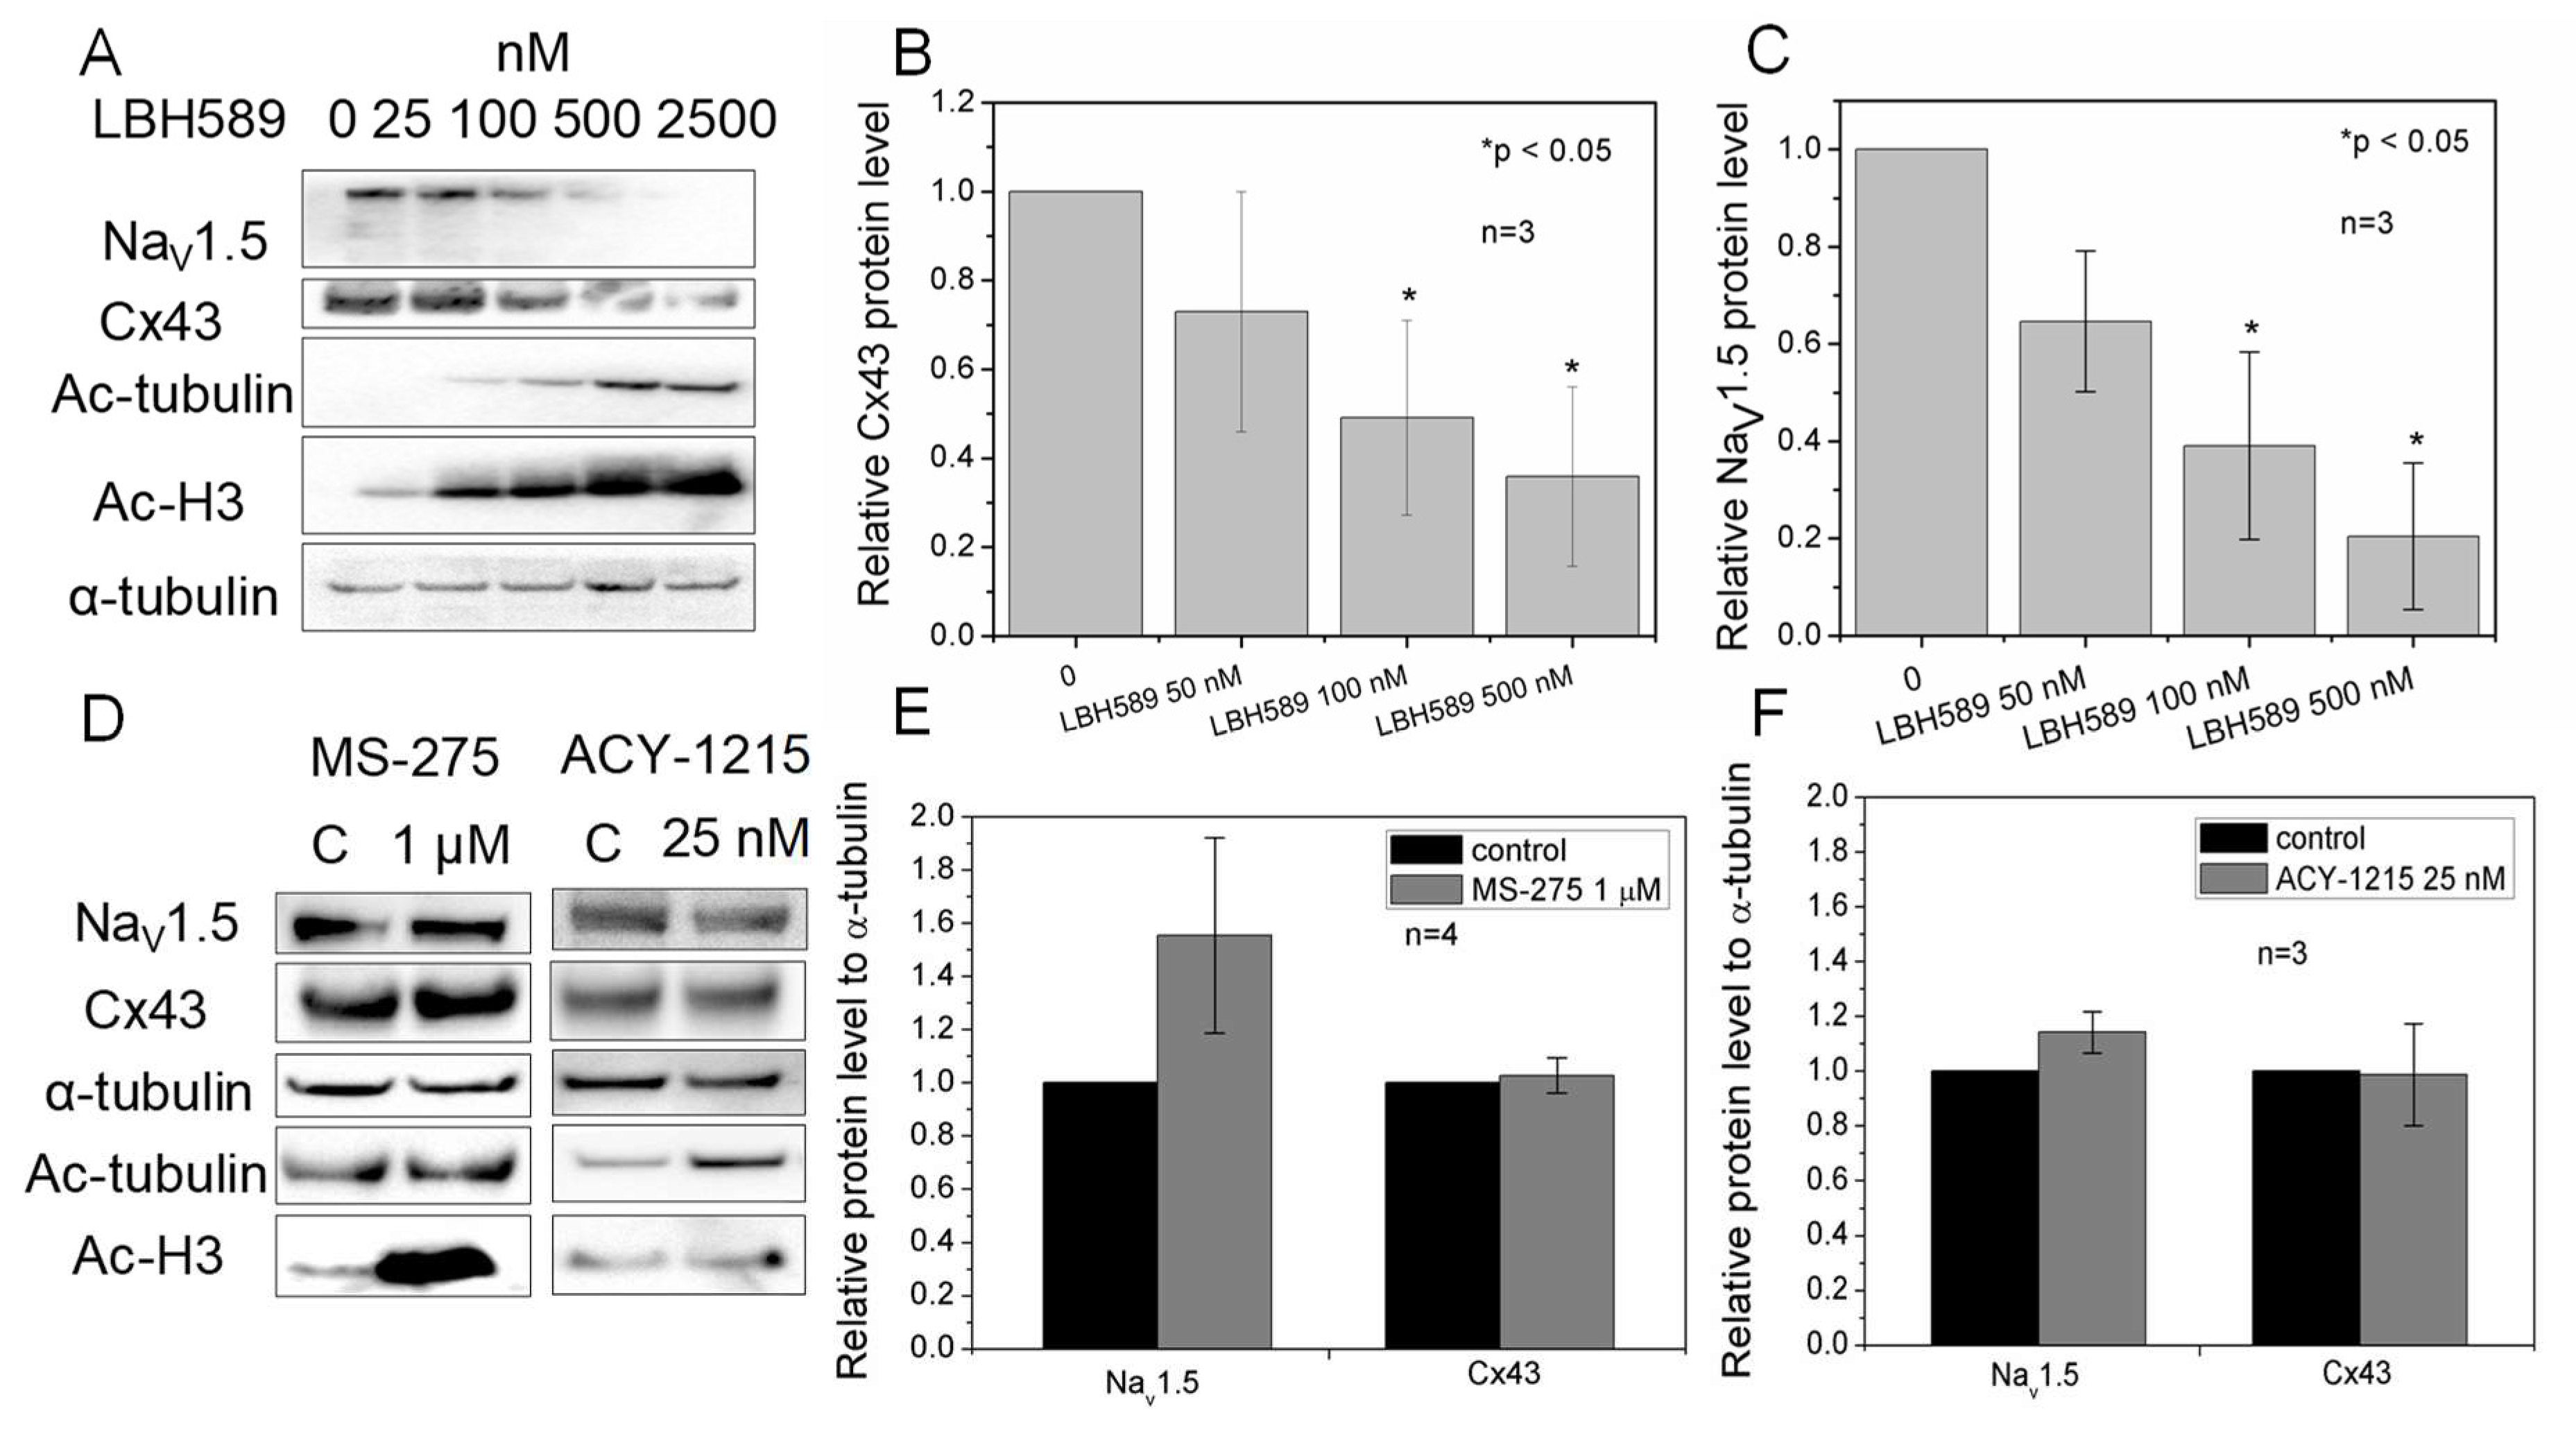
2.6. Cx43 and NaV1.5 Expression

Because panobinostat caused a concentration-dependent reduction in INa and gj, we performed Western blot analyses on NMVMs to determine if there were any alterations in cardiac NaV1.5 and Cx43 protein expression level induced by pan-HDAC inhibition. Protein expression analysis of cultured NMVMs revealed a concentration-dependent decrease of both NaV1.5 and Cx43 with panobinostat treatment (p < 0.05, n =3), whereas no changes were observed with entinostat and ricolinostat (Figure 6). Acetyl-α-tubulin and acetyl-histone 3 were used as cytoplasmic and nuclear acetylation markers respectively. α-tubulin was used as a loading control.

3. Discussion

The HDAC inhibitors have tremendous potential in the field of cancer pharmacology due to their involvement in key regulatory and gene expression pathways [29,30]. To date, four non-selective HDAC inhibitors, vorinostat (VOR, suberoylanilide hydroxamic acid (SAHA), Zolinza™, 2006), romidepsin (FK228, depsipeptide, Istodax™, 2009), belinostat (PXD101, Beleodaq™, 2014) and panobinostat (LBH589, Farydak™, 2015), have been approved by FDA for chemotherapy of cutaneous/peripheral T-cell lymphoma or multiple myeloma. Furthermore, hundreds of HDAC inhibitors are undergoing clinical trials (www.clinicaltrials.gov). However, HDAC inhibitor-related severe cardiotoxic side effects, especially QT interval prolongation, ventricular arrhythmia and unexpected sudden cardiac death, necessitated clinical trial termination or dose readjustments of numerous promising non-selective HDAC inhibitors [4,5,6,7]. In addition, panobinostat, the most potent pan-HDAC inhibitor, carries a black box warning for severe cardiac abnormalities on its prescription label [31]. Notably, currently approved HDAC inhibitors can non-selectively inhibit all 11 zinc-dependent isoforms in this family [32]. Based on their sequence homology to Saccharomyces cerevisiae HDACs and their cellular location, those targeted HDACs can be divided into four classes. Class I HDACs (HDAC1, 2, 3 and 8) are homologous proteins of yeast that reduce potassium-dependent 3 (Rpd3). These HDACs are mainly present in the nucleus and are ubiquitously expressed. Class II HDACs share sequence homology to yeast histone deacetylase 1 (Hda1). They are further divided into two groups based on their subcellular localization, with class IIa (HDAC4, 5, 7 and 9) shuttle between the nucleus and cytoplasm, while class IIb (HDAC6 and 10) is located in the cytoplasm. HDAC11 is the only class IV HDAC that shares sequence similarity with Rpd3 and Hda1 and has not been well studied.
HDACs are tissue specific. For example, class I HDACs are ubiquitous, while class II HDACs are only expressed in specific tissues such as heart, kidney, and brain. Furthermore, different HDACs are overexpressed in different cancers. It is worth noting that the different classes of HDAC have distinct regulatory mechanisms and play distinct roles on cardiac activities. For example, class IIa HDACs are regulated by the calcium/calmodulin-dependent protein kinase II (CaMKII) pathway and inhibits MEF (myoblast-enhancing factor)-associated cardiac hypertrophy and is therefore used as a protective agent for cardiac hypertrophy [33]. Class I HDACs play a “pro-hypertrophic” role in heart and inhibition of this HDAC class attenuates cardiac hypertrophy through tuberous sclerosis complex 2-dependent mTOR repression [34]. Based on these facts, it has been hypothesized that class-selective HDACs present a new strategy for the treatment of cancer, with the goal of minimizing cardiotoxicity [8,35]. Encouragingly, the development of the Class I HDAC inhibitor entinostat has enabled this goal. Entinostat combined with exemestane increased overall survival and progression-free survival in patients with advanced hormone receptor (HR)-positive breast cancer without adverse cardiac toxicity events [7,11]. But the mechanisms for the reduced arrhythmogenic cardiotoxicities observed with pan-HDAC inhibitors remains essentially unknown.
Blockade of human ether-a-go-go (hERG) channels and the subsequent inhibition of the rapidly activating delayed rectifier potassium current (IKr) is responsible for more than 95% of acquired or drug-induced Long QT syndromes and led to withdrawal of multiple drugs including terfenadine (Seldane) [36]. Therefore, hERG-dependent assays were required for screening new therapeutic drugs according to the preclinical testing recommendations of the ICH S7A guidelines. All four FDA approved HDAC inhibitors, with the possible exception of panobinostat, failed to show significant hERG blockade activity, implying that other mechanisms are involved in HDAC inhibitor-related cardiotoxicities [18,37,38]. In addition, the three HDAC inhibitors in this study showed insignificant effects on steady state and transient outward K+ currents of NMVM cells (Supplementary Figures S1 and S2). Thus, we hypothesize that hERG is not responsible for cardiac side effects of HDAC inhibitors and, hence, we focused our studies on other major cardiac ionic currents which can be altered by HDAC inhibition.
After examining four pan-HDAC inhibitors including panobinostat, we have consistently observed concomitant reductions in gap junction coupling and peak INa, without alterations in INa,Late and a slight shift of 2–3 mV during activation with no change in inactivation of INa [13,14]. With the phase 3 clinical trial class I HDAC inhibitor, entinostat, we observed no change in ventricular gj, peak INa density, or the V½ for Vm-dependent activation and inactivation at the class-selective concentration of 1 μM. The lack of these effects may help explain the safer record of entinostat pertaining to cardiotoxicity, especially considering that this concentration is still more than three times the therapeutic dose used in clinical trials [7,18]. The phase 1–2 clinical trial class IIb HDAC inhibitor, ricolinostat, also had minor effects on ventricular gj and INa electrophysiological properties. A 1 × IC50 dose of ricolinostat produced a modest increase in gj while a 2.5 × IC50 dose produced a similar decrease in gj. This trend (induction at lower concentration and reduction at higher concentration) was also observed with the prototype HDAC6 inhibitor, tubacin, although none of the gj changes were significant. It is worth noting that 1 × IC50 dose of ricolinostat is still four times higher than the maximum dose used in clinical trials. Thus, we conclude that therapeutic doses of ricolinostat are unlikely to cause any significant changes in gap junction coupling. In addition, the differential effects of pan-, class 1-selective, and class IIb-selective HDAC inhibitors implies that different classes of HDACs likely have different effects on Cx43 expression and function. Furthermore, the combined effects of sodium butyrate and tubacin suggest that inhibiting multiple classes of HDACs accounts for some of the adverse cardiac side effects attributable to pan-HDAC inhibitors.
HDAC6 is preferentially inhibited by ricolinostat at concentrations applied. One of its deacetylated substrates is Hsp90, the 90 kDa heat shock protein [39,40]. Hsp90 is an ATP-dependent chaperone that helps stabilize many proteins. Hsp90 has been shown to serve two distinct roles relevant to Cx43 expression and function. Hsp90 mediates the mitochondrial translocation of Cx43 and increases the mitochondrial membrane expression of Cx43 at the expense of cell surface expression of Cx43 [41]. Hsp90 is also part of a Cx43 promotor P2 region protein complex and is involved in Ras-mediated Cx43 upregulation [42]. Thus, partial or complete inhibition of HDAC6 deacetylase activity by ricolinostat will result in increased acetylation of Hsp90 and promote the disparate actions of Hsp90 on Cx43 expression and localization. In addition, microtubules are responsible for Cx43 forward trafficking and consist of α-tubulin and β-tubulin [43]. α-tubulin is another known substrate for HDAC6. siRNA mediated knockdown of HDAC6 or non-selective HDAC inhibition induces tubulin hyper-acetylation, which was accompanied by aggregate formation in cardiomyopathy mice hearts [44]. However, a recent structural analysis revealed that the lysine residue K40 of α-tubulin targeted by HDAC6 deacetylation resides on the inner face of microtubules, and that K40 acetylation status had no effect on the ultrastructure of microtubules [45].
Entinostat preferentially inhibits HDAC1 by two-fold over HDAC3 and 10–100-fold over other HDACs. Two laboratories, including ours, have demonstrated that HDAC1 is bound to the Cx43 promoter region [14,46]. Loss of HDAC1 drastically increases gene silencing, including GJA1, resulting in decreased Cx43 mRNA levels [47]. Therefore, HDAC inhibitors capable of HDAC1 inhibition, e.g., pan-HDAC and class I-selective HDAC inhibitors, should cause a reduction of Cx43 expression. We did not observe any change in Cx43 protein level with 1 μM entinostat, which may result from the compensatory deacetylase effects of class IIa HDACs. HDAC4 and HDAC5 colocalize with Cx43 and a class IIa HDAC inhibitor MC1568 produced Cx43 hyperacetylation and dissociation from intercalated disk gap junctions in ventricular cardiomyocytes [48]. This may also explain the observation that non-selective inhibition of class I and II HDACs by pan-HDAC inhibitors significantly reduces Cx43 expression, but not by a class I HDAC inhibitor.
Finally, we observed a moderate, but not significant, increase in peak INa at twice the HDAC6 IC50 concentration of ricolinostat. The cardiac sodium channel NaV1.5 protein is acetylated and acetylation of K on the III-IV linker reduces its forward trafficking to the cell surface, thus reducing cardiac Na+ current density [13,49]. The HDACs associated with NaV1.5 are not yet identified, but our results suggest that HDAC6 activity may influence the surface expression and stability of the NaV1.5 protein complex either by directly modulating the acetylation of NaV1.5 or indirectly by modulating the acetylation, phosphorylation, or ubiquitination of NaV1.5 interacting proteins. Mutations and expression of key NaV1.5 interacting proteins like α1-syntrophin, calveolin-3, plakophilin-2, and others are known to influence the expression and function of the NaV1.5 channel and are linked to increased risk for cardiac arrhythmias and sudden cardiac death [16]. Overall, the class-selective HDAC inhibitors exhibit no or moderate effects on Cx43-mediated gap junction communication and cardiac sodium current density, unlike pan-HDAC inhibitors, which may help explain their lack of cardiotoxicity and improved safety profile.

4. Material and Methods

4.1. Cell Culture

Neonatal mice born from an inbred C57BL/6 mouse colony were anesthetized using isoflurane and the hearts were excised in accordance with procedures approved by the SUNY Upstate Medical University Institutional Animal Care and Use Committee (IACUC) # 263 on 15 March 2017. The excised hearts were separated into atria and ventricles and exposed to collagenase solution for digestion. The dissociated cells were pre-plated for 30 min to reduce fibroblast content by differential adhesion and the supernatant was collected, centrifuged and re-suspended in 1 mL/heart of M199/10% FBS culture media. The primary cells were plated into 96-well plates for HDAC activity assays, 35 mm culture dishes for patch clamp electrophysiology, or 60 mm culture dishes and homogenized after 3 days for Western blots.

4.2. HDAC Inhibitors

Panobinostat (LBH589), entinostat (MS275) and ricolinostat (ACY-1215) were purchased from Selleck Chemicals (Houston, TX, USA), dissolved in DMSO, and stored at −20 °C. The 100-mM DMSO solutions of LBH589, MS-275 and ACY-1215 were diluted to the desired experimental test concentrations in M199 and applied to NMVM overnight for 18–24 h before experimental procedures. Final DMSO levels were <0.005% (vol/vol).

4.3. HDAC Activity Assay

Aliquots of 2 × 10⁵ ventricular myocytes per well (96-well plate) were grown in 200 μL of 200 μM bromodeoxyuridine (BrDU)/M199, exchanged daily. Cell densities were counted with a hemocytometer and seeded into the wells. Wells were incubated with 2000 pmoles of the acetylated Fluor-de-Lys® substrate for 8 h during HDAC inhibition [13,14]. Cells were incubated with varying doses of HDAC inhibitor, panobinostat, for 24 h. Protocols for HDAC activity assay were developed according to manufacturer’s directions (Cat. # BML-AK500, Enzo Life Sciences, Farmingdale, NY, USA) and background subtracted relative fluorescence unit (RFU) counts were acquired with a BIO-TEK Synergy 2 plate reader (360 nm excitation, 460 nm emission).

4.4. Dual Whole Cell Patch Clamping

Gap junction currents (Ij) were recorded in the dual whole cell configuration according to previously published methods [50]. Upon establishing a dual whole cell patch, Ij was recorded using a 30 s, 20 mV trans-junctional voltage protocol. All dual whole cell current recordings were low-pass filtered at 500 Hz and digitized at 2 KHz using pClamp 8.2 and graphical analysis performed using Origin 7.5 or 8.6 software as previously described [14].

4.5. Whole Cell Patch Clamping

Single whole cell patch electrode voltage clamp experiments were performed on neonatal mouse ventricular myocytes (NMVMs) using conventional procedures with an Axon Instruments Axopatch 1D or 200B patch clamp amplifier, Digidata 1320A or 1440 A/D converter, and pClamp8.2 or 10.1 software (Molecular Devices, San Jose, CA, USA). Transient (peak) and steady state outward potassium (IK,to and IK,ss) currents were recorded during 1 sec voltage steps from a holding potential (Vh) of −100 to +60 mV in 10 mV increments. Voltage-gated sodium currents (INa) were elicited from a Vh of −120 mV during voltage steps from −90 to +50 mV in 5 mV increments for 150 ms using reduced NaCl solutions. For the INa inactivation protocol, V was −120 mV and the prepulse voltage increased from −130 to −30 mV in +5-mV increments for 150 ms followed by a 30-ms activation step to −40 mV [13]. Late INa protocol was measured as the average current from 100 to 150 ms of the activating voltage steps or were recorded during a ramp from −80 to +10 mV in 0.1 mV/4 ms steps from a Vh of −60 mV [13,28].

4.6. Western Blot

Ventricular myocytes were cultured at high density in 35 mm culture dishes for four days in 3 mL of BrDU/M199 media, harvested, and lysed with 1% Triton X-100 extraction buffer (50 mM Tris pH 8.0, 150 mM NaCl, 0.02% Sodium azide, 1.0 mM PMSF, 1 μg/mL Aprotinin, 1% Triton X-100, 1 mM Na3VO4, 50 mM NaF) with protease inhibitors (Roche Life Sciences, Branford, CT, USA). One dish from each primary culture served as a control sample and a second dish was treated with panobinostat or entinostat for 24 h prior to harvesting. Sonicated samples (three 30 sec pulses) were incubated on ice for 30 min, centrifuged at 14,000 rpm (10 min at 4 °C), transferred to new tubes, and protein concentrations were measured using the coomassie blue protein assay (Bio-Rad, Hercules, CA, USA). Total protein/sample was heated (55 °C) and loaded onto an SDS-PAGE gel and electrophoresed for 90 min at 110 V in 4× Nupage sampling buffer and 10× Nupage reducing buffer (Bio-Rad). The protein gels were transferred onto polyvinylidine difluoride (PVDF) membranes for 90 min at 4 °C (110 V), blocked with 5% nonfat milk for 1 h at room temperature, and incubated overnight at 4 °C with primary antibodies against Cx43, NaV1.5 or α-tubulin in PBS-T with 5% nonfat milk. Acetylated α-tubulin and acetylated H3 were used as cytoplasmic and nuclear markers for acetylation. The membranes were washed 5 min × 4 with PBS-T, incubated with HRP labeled secondary antibody (1:5000) at room temperature in PBS-T with 5% nonfat milk for 30 min, washed again 5 min × 4 with PBS-T, and developed using the ECL™ Western Blot Detection Reagents (Bio-Rad). The image was detected using the Biorad imager. The density of the bands was quantified using ImageJ.
Primary antibodies used in this study include rabbit anti-Cx43 (AB1728, Merck Millipore, Billerica, MA, USA), mouse anti-Cx43 (AB1727, Merck Millipore), mouse anti-α-tubulin (# T5168, Sigma-Aldrich, St. Louis, MO, USA), rabbit anti-acetylated H3 (# 06-599, Merck Millipore), rabbit anti-acetylated-α-tubulin (BML-SA452-0100, Enzo Life Sciences, Farmingdale, NY, USA) and rabbit anti-NaV1.5 (# ACC-001, Alomone Labs, Jerusalem, Israel).

4.7. Statistics

Averaged values are presented as the Mean ± SEM. Statistical analyses were performed with the Normality and one-way ANOVA tests using the Bonferroni method in Origin 8.6. Data with p < 0.05 were considered significant.

5. Conclusions

This study demonstrates for the first time that class-selective HDAC inhibitors, entinostat and ricolinostat, produce no or moderate effects on functional electrical coupling and cardiac sodium currents in normal mammalian ventricular myocardium, which distinguished from pan-HDAC inhibitors. Therefore, class-selective HDAC inhibitors are likely to benefit broad patients with improved cardiac profile in clinical practice.

Supplementary Materials

Supplementary materials can be found at https://www.mdpi.com/1422-0067/19/8/2288/s1.

Author Contributions

Conceptualization and research design, D.P., X.Z., and R.V.; Experiments, D.P., Q.X. and X.Z.; Data Analysis, X.Z., D.P., Q.X., and R.V.; Interpretation, X.Z., D.P., and R.V.; Figure preparation; X.Z, D.P., and R.V.; Writing–Original draft preparation, X.Z. and R.V; Manuscript Editing and Revising, X.Z, D.P., and R.V., Manuscript Approval–final version, X.Z., D.P., Q.X., and R.V.

Funding

This project was supported by National Institutes of Health grant HL-042220, National American Heart Association Grant-in-Aid 17GRNT33710031, and Central New York Community Joseph C Georg Fund grant to R.V.

Conflicts of Interest

The authors have no conflict of interest to declare.

References

  1. Peng, L.; Seto, E. Deacetylation of nonhistone proteins by HDACs and the implications in cancer. Handb. Exp. Pharmacol. 2011, 206, 39–56. [Google Scholar] [PubMed]
  2. Gryder, B.E.; Sodji, Q.H.; Oyelere, A.K. Targeted cancer therapy: Giving histone deacetylase inhibitors all they need to succeed. Future Med. Chem. 2012, 4, 505–524. [Google Scholar] [CrossRef] [PubMed]
  3. Ito, A.; Kawaguchi, Y.; Lai, C.H.; Kovacs, J.J.; Higashimoto, Y.; Appella, E.; Yao, T.P. MDM2-HDAC1-mediated deacetylation of p53 is required for its degradation. EMBO J. 2002, 21, 6236–6245. [Google Scholar] [CrossRef] [PubMed]
  4. Lynch, D.R., Jr.; Washam, J.B.; Newby, L.K. QT interval prolongation and torsades de pointes in a patient undergoing treatment with vorinostat: A case report and review of the literature. Cardiol. J. 2012, 19, 434–438. [Google Scholar] [CrossRef] [PubMed]
  5. Kelly, W.K.; Richon, V.M.; O’Connor, O.; Curley, T.; MacGregor-Curtelli, B.; Tong, W.; Klang, M.; Schwartz, L.; Richardson, S.; Rosa, E.; et al. Phase I clinical trial of histone deacetylase inhibitor: Suberoylanilide hydroxamic acid administered intravenously. Clin. Cancer Res. 2003, 9, 3578–3588. [Google Scholar] [PubMed]
  6. Shah, M.H.; Binkley, P.; Chan, K.; Xiao, J.; Arbogast, D.; Collamore, M.; Farra, Y.; Young, D.; Grever, M. Cardiotoxicity of histone deacetylase inhibitor depsipeptide in patients with metastatic neuroendocrine tumors. Clin. Cancer Res. 2006, 12, 3997–4003. [Google Scholar] [CrossRef] [PubMed]
  7. Schiattarella, G.G.; Sannino, A.; Toscano, E.; Cattaneo, F.; Trimarco, B.; Esposito, G.; Perrino, C. Cardiovascular effects of histone deacetylase inhibitors epigenetic therapies: Systematic review of 62 studies and new hypotheses for future research. Int. J. Cardiol. 2016, 219, 396–403. [Google Scholar] [CrossRef] [PubMed]
  8. Micelli, C.; Rastelli, G. Histone deacetylases: Structural determinants of inhibitor selectivity. Drug Disc. Today 2015, 20, 718–735. [Google Scholar] [CrossRef] [PubMed]
  9. Ryan, Q.C.; Headlee, D.; Acharya, M.; Sparreboom, A.; Trepel, J.B.; Ye, J.; Figg, W.D.; Hwang, K.; Chung, E.J.; Murgo, A.; et al. Phase I and pharmacokinetic study of MS-275, a histone deacetylase inhibitor, in patients with advanced and refractory solid tumors or lymphoma. J. Clin. Oncol. 2005, 23, 3912–3922. [Google Scholar] [CrossRef] [PubMed]
  10. Vogl, D.T.; Raje, N.; Jagannath, S.; Richardson, P.; Hari, P.; Orlowski, R.; Supko, J.G.; Tamang, D.; Yang, M.; Jones, S.S.; et al. Ricolinostat, the first selective histone deacetylase 6 inhibitor, in combination with bortezomib and dexamethasone for relapsed or refractory multiple myeloma. Clin. Cancer Res. 2017, 23, 3307–3315. [Google Scholar] [CrossRef] [PubMed]
  11. Yardley, D.A.; Ismail-Khan, R.R.; Klein, P.M. PD01–04: Entinostat, a novel histone deacetylase inhibitor, added to exemestane improves PFS in advanced breast cancer in a randomized, phase II, double-blind study. Cancer Res. 2011, 71, PD01–PD04. [Google Scholar] [CrossRef]
  12. Ruiz, R.; Raez, L.E.; Rolfo, C. Entinostat (SNDX-275) for the treatment of non-small cell lung cancer. Expert. Opin. Investig. Drugs 2015, 24, 1101–1109. [Google Scholar] [CrossRef] [PubMed]
  13. Xu, Q.; Patel, D.; Zhang, X.; Veenstra, R.D. Changes in cardiac Nav 1.5 expression, function, and acetylation by pan-histone deacetylase inhibitors. Am. J. Physiol. Hear. Circ. Physiol. 2016, 311, H1139–H1149. [Google Scholar] [CrossRef] [PubMed]
  14. Xu, Q.; Lin, X.; Andrews, L.; Patel, D.; Lampe, P.D.; Veenstra, R.D. Histone deacetylase inhibition reduces cardiac connexin43 expression and gap junction communication. Front. Pharmacol. 2013, 4, 44. [Google Scholar] [CrossRef] [PubMed]
  15. Fontes, M.S.C.; van Veen, T.A.B.; de Bakker, J.M.T.; van Rijen, H.V.M. Functional consequences of abnormal Cx43 expression in the heart. Biochim. Biophys. Acta Biomembr. 2012, 1818, 2020–2029. [Google Scholar] [CrossRef] [PubMed]
  16. Abriel, H.; Rougier, J.S.; Jalife, J. Ion channel macromolecular complexes in cardiomyocytes: Roles in sudden cardiac death. Circ. Res. 2015, 116, 1971–1988. [Google Scholar] [CrossRef] [PubMed]
  17. Ortiz-Bonnin, B.; Rinné, S.; Moss, R.; Streit, A.K.; Scharf, M.; Richter, K.; Stöber, A.; Pfeufer, A.; Seemann, G.; Kääb, S.; et al. Electrophysiological characterization of a large set of novel variants in the SCN5A-gene: Identification of novel LQTS3 and BrS mutations. Pflügers. Arch Eur. J. Physiol. 2016, 468, 1375–1387. [Google Scholar] [CrossRef] [PubMed]
  18. Kopljar, I.; Gallacher, D.J.; de Bondt, A.; Cougnaud, L.; Vlaminckx, E.; van den Wyngaert, I.; Lu, H.R. Functional and Transcriptional Characterization of Histone Deacetylase Inhibitor-Mediated Cardiac Adverse Effects in Human Induced Pluripotent Stem Cell-Derived Cardiomyocytes. Stem Cells Transl. Med. 2016, 5, 602–612. [Google Scholar] [CrossRef] [PubMed] [Green Version]
  19. Beckers, T.; Burkhardt, C.; Wieland, H.; Gimmnich, P.; Ciossek, T.; Maier, T.; Sanders, K. Distinct pharmacological properties of second generation HDAC inhibitors with the benzamide or hydroxamate head group. Int. J. Cancer 2007, 121, 1138–1148. [Google Scholar] [CrossRef] [PubMed] [Green Version]
  20. Santo, L.; Hideshima, T.; Kung, A.L.; Tseng, J.C.; Tamang, D.; Yang, M.; Jarpe, M.; van Duzer, J.H.; Mazitschek, R.; Ogier, W.C.; et al. Preclinical activity, pharmacodynamic, and pharmacokinetic properties of a selective HDAC6 inhibitor, ACY-1215, in combination with bortezomib in multiple myeloma. Blood 2012, 119, 2579–2589. [Google Scholar] [CrossRef] [PubMed] [Green Version]
  21. Haggarty, S.J.; Koeller, K.M.; Wong, J.C.; Grozinger, C.M.; Schreiber, S.L. Domain-selective small-molecule inhibitor of histone deacetylase 6 (HDAC6)-mediated tubulin deacetylation. Proc. Natl. Acad. Sci. USA 2003, 100, 4389–4394. [Google Scholar] [CrossRef] [PubMed] [Green Version]
  22. Rasheed, W.K.; Johnstone, R.W.; Prince, H.M. Histone deacetylase inhibitors in cancer therapy. Expert. Opin. Investig. Drugs 2007, 16, 659–678. [Google Scholar] [CrossRef] [PubMed]
  23. Khan, N.; Jeffers, M.; Kumar, S.; Hackett, C.; Boldog, F.; Khramtsov, N.; Qian, X.; Mills, E.; Berghs, S.C.; Carey, N.; et al. Determination of the class and isoform selectivity of small-molecule histone deacetylase inhibitors. Biochem. J. 2008, 409, 581–589. [Google Scholar] [CrossRef] [PubMed]
  24. Asklund, T.; Appelskog, I.B.; Ammerpohl, O.; Ekström, T.J.; Almqvist, P.M. Histone deacetylase inhibitor 4-phenylbutyrate modulates glial fibrillary acidic protein and connexin 43 expression, and enhances gap-junction communication, in human glioblastoma cells. Eur. J. Cancer 2004, 40, 1073–1081. [Google Scholar] [CrossRef] [PubMed]
  25. Kaufman, J.; Gordon, C.; Bergamaschi, R.; Wang, H.Z.; Cohen, I.S.; Valiunas, V.; Brink, P.R. The effects of the histone deacetylase inhibitor 4-phenylbutyrate on gap junction conductance and permeability. Front. Pharmacol. 2013, 4, 111. [Google Scholar] [CrossRef] [PubMed]
  26. Bradner, J.E.; West, N.; Grachan, M.L.; Greenberg, E.F.; Haggarty, S.J.; Warnow, T.; Mazitschek, R. Chemical phylogenetics of histone deacetylases. Nat. Chem. Biol. 2010, 6, 238–243. [Google Scholar] [CrossRef] [PubMed] [Green Version]
  27. Makielski, J.C. Late sodium current: A mechanism for angina, heart failure, and arrhythmia. Trends Cardiovasc. Med. 2016, 26, 115–122. [Google Scholar] [CrossRef] [PubMed] [Green Version]
  28. Xie, R.G.; Zheng, D.W.; Xing, J.L.; Zhang, X.J.; Song, Y.; Xie, Y.B.; Kuang, F.; Dong, H.; You, S.W.; Xu, H.; et al. Blockade of persistent sodium currents contributes to the riluzole-induced inhibition of spontaneous activity and oscillations in injured DRG neurons. PLoS ONE 2011, 6, e18681. [Google Scholar] [CrossRef] [PubMed]
  29. Bose, P.; Dai, Y.; Grant, S. Histone deacetylase inhibitor (HDACI) mechanisms of action: Emerging insights. Pharmacol. Ther. 2014, 143, 323–336. [Google Scholar] [CrossRef] [PubMed] [Green Version]
  30. Newbold, A.; Falkenberg, K.J.; Prince, H.M.; Johnstone, R.W. How do tumor cells respond to HDAC inhibition? FEBS J. 2016, 283, 4032–4046. [Google Scholar] [CrossRef] [PubMed]
  31. FDA Reference ID: 3699607. Available online: https://www.accessdata.fda.gov/drugsatfda_docs/label/2015/ 205353s000lbl.pdf (accessed on 3 August 2018).
  32. Hojayev, B.; Hill, J.A. HDACs and hypertrophy, kinases and cancer. Circulation 2011, 123, 2341–2343. [Google Scholar] [CrossRef] [PubMed]
  33. Backs, J.; Song, K.; Bezprozvannaya, S.; Chang, S.; Olson, E.N. CaM kinase II selectively signals to histone deacetylase 4 during cardiomyocyte hypertrophy. J. Clin. Investig. 2006, 116, 1853–1864. [Google Scholar] [CrossRef] [PubMed] [Green Version]
  34. Morales, C.R.; Li, D.L.; Pedrozo, Z.; May, H.I.; Jiang, N.; Kyrychenko, V.; Cho, G.W.; Kim, S.Y.; Wang, Z.V.; Rotter, D.; et al. Inhibition of class I histone deacetylases blunts cardiac hypertrophy through TSC2-dependent mTOR repression. Sci. Signal. 2016, 9. [Google Scholar] [CrossRef] [PubMed] [Green Version]
  35. Bieliauskas, A.V.; Pflum, M.K.H. Isoform-selective histone deacetylase inhibitors. Chem. Soc. Rev. 2008, 37, 1402–1413. [Google Scholar] [CrossRef] [PubMed]
  36. Bowlby, M.R.; Peri, R.; Zhang, H.; Dunlop, J. hERG (KCNH2 or Kv11.1) K+ channels: Screening for cardiac arrhythmia risk. Curr. Drug Med. 2008, 9, 965–970. [Google Scholar] [CrossRef]
  37. Kerr, J.; Galloway, S.; Lagrutta, A.; Armstrong, M.; Miller, T.; Richon, V.; Andrews, P. Nonclinical Safety Assessment of the Histone Deacetylase Inhibitor Vorinostat. Int. J. Toxicol. 2010, 29, 3–19. [Google Scholar] [CrossRef] [PubMed]
  38. Fukutomi, A.; Hatake, K.; Matsui, K.; Sakajiri, S.; Hirashima, T.; Tanii, H.; Kobayashi, K.; Yamamoto, N. A phase I study of oral panobinostat (LBH589) in Japanese patients with advanced solid tumors. Investig. New Drugs 2011, 30, 1096–1106. [Google Scholar] [CrossRef] [PubMed]
  39. Kovacs, J.J.; Murphy, P.J.M.; Gaillard, S.; Zhao, X.; Wu, J.T.; Nicchitta, C.V.; Yoshida, M.; Toft, D.O.; Pratt, W.B.; Yao, T.P. HDAC6 regulates Hsp90 acetylation and chaperone-dependent activation of glucocorticoid receptor. Mol. Cell 2005, 18, 601–607. [Google Scholar] [CrossRef] [PubMed]
  40. Bali, P.; Pranpat, M.; Bradner, J.; Balasis, M.; Fiskus, W.; Guo, F.; Rocha, K.; Kumaraswamy, S.; Boyapalle, S.; Atadja, P.; Seto, E.; Bhalla, K. Inhibition of histone deacetylase 6 acetylates and disrupts the chaperone function of heat shock protein 90: A novel basis for antileukemia activity of histone deacetylase inhibitors. J. Biol. Chem. 2005, 280, 26729–26734. [Google Scholar] [CrossRef] [PubMed]
  41. Zhong, G.-Q.; Tu, R.-H.; Zeng, Z.-Y.; Li, Q.-J.; He, Y.; Li, S.; Xiao, F. Novel functional role of heat shock protein 90 in protein kinase C-mediated ischemic postconditioning. J. Surg. Res. 2014, 189, 198–206. [Google Scholar] [CrossRef] [PubMed]
  42. Carystinos, G.D.; Kandouz, M.; Alaoui-Jamali, M.A.; Batist, G. Unexpected induction of the human connexin 43 promoter by the ras signaling pathway is mediated by a novel putative promoter sequence. Mol. Pharmacol. 2003, 63, 821–831. [Google Scholar] [CrossRef] [PubMed]
  43. Saidi Brikci-Nigassa, A.; Clement, M.J.; Ha-Duong, T.; Adjadj, E.; Ziani, L.; Pastre, D.; Curmi, P.A.; Savarin, P. Phosphorylation controls the interaction of the connexin43 C-terminal domain with tubulin and microtubules. Biochemistry 2012, 51, 4331–4342. [Google Scholar] [CrossRef] [PubMed]
  44. Lee, J.-Y.; Koga, H.; Kawaguchi, Y.; Tang, W.; Wong, E.; Gao, Y.-S.; Pandey, U.B.; Kaushik, S.; Tresse, E.; Lu, J.; et al. HDAC6 controls autophagosome maturation essential for ubiquitin-selective quality-control autophagy. EMBO J. 2010, 29, 969–980. [Google Scholar] [CrossRef] [PubMed] [Green Version]
  45. Howes, S.C.; Alushin, G.M.; Shida, T.; Nachury, M.V.; Nogales, E. Effects of tubulin acetylation and tubulin acetyltransferase binding on microtubule structure. Mol. Biol. Cell 2014, 25, 257–266. [Google Scholar] [CrossRef] [PubMed] [Green Version]
  46. Zupkovitz, G.; Tischler, J.; Posch, M.; Sadzak, I.; Ramsauer, K.; Egger, G.; Grausenburger, R.; Schweifer, N.; Chiocca, S.; Decker, T.; et al. Negative and positive regulation of gene expression by mouse histone deacetylase 1. Mol. Cell. Biol. 2006, 26, 7913–7928. [Google Scholar] [CrossRef] [PubMed]
  47. Greim, H.; Albertini, R.J. Cellular response to the genotoxic insult: The question of threshold for genotoxic carcinogens. Toxicol. Res. 2015, 4, 36–45. [Google Scholar] [CrossRef]
  48. Colussi, C.; Rosati, J.; Straino, S.; Spallotta, F.; Berni, R.; Stilli, D.; Rossi, S.; Musso, E.; Macchi, E.; Mai, A.; et al. Nε-lysine acetylation determines dissociation from GAP junctions and lateralization of connexin 43 in normal and dystrophic heart. Proc. Natl. Acad. Sci. USA 2011, 108, 2795–2800. [Google Scholar] [CrossRef] [PubMed]
  49. Vikram, A.; Lewarchik, C.M.; Yoon, J.-Y.; Naqvi, A.; Kumar, S.; Morgan, G.M.; Jacobs, J.S.; Li, Q.; Kim, Y.-R.; Kassan, M.; et al. Sirtuin 1 regulates cardiac electrical activity by deacetylating the cardiac sodium channel. Nat. Med. 2017, 23, 361–367. [Google Scholar] [CrossRef] [PubMed]
  50. Veenstra, R.D. Voltage clamp limitations of dual whole-cell gap junction current and voltage recordings. I. Conductance measurements. Biophys. J. 2001, 80, 2231–2247. [Google Scholar] [CrossRef]
Figure 1. Histone deacetylase (HDAC) activity assays for pan- and class-selective HDAC inhibitors. (A) The total HDAC inhibition curve for neonatal mouse ventricular cardiomyocytes treated for 18–24 h with increasing concentrations of panobinostat. Two IC50s of approximately 40 and 2000 nM are apparent. (B) The cardiomyocyte HDAC inhibition curve for the class I HDAC selective inhibitor entinostat. Again, the HDAC activity curve was best fit with a double exponential function. (C) The ventricular cardiomyocyte HDAC inhibition curve for the HDAC6 class IIb HDAC inhibitor ricolinostat exhibits two distinct IC50s for total HDAC activity. (D) The standard curve for the deacetylated fluorescent Fluor-de-Lys product showing a linear response. All Fluor-de-Lys HDAC activity assays were performed in triplicate and the average ± SEM values are shown. The parameters for the double exponential fits of the dose-response curves are listed in Table 1.
Ijms 19 02288 g001
Figure 2. Effects of pan- and class-selective HDAC inhibition on gap junction coupling. (A) The gap junction conductance (gj) was measured between neonatal mouse ventricular cardiomyocytes (NMVMs) treated with 0, 100, 500, or 1000 nM panobinostat for 18–24 h in culture. Pan-HDAC inhibition reduced gj in a concentration-dependent manner. (B) Class I HDAC selective inhibition with entinostat had no effect on ventricular gj except at the highest, and least selective, concentration tested. (C) Ricolinostat, a class IIb HDAC6-selective inhibitor produced a slight, but non-significant, increase and then decrease in ventricular gj as the concentration was increased from 10 to 25 nM. (D) The effect of a weak HDAC class I/IIb inhibitor, sodium butyrate (NaB), and the prototype HDAC6 inhibitor, tubacin, on gj were tested independently and in combination [21,22,23]. NaB non-significantly increased gj in a concentration-dependent manner while tubacin (tub) produced a non-significant increase and then decrease in gj with increasing concentration. When concentrations of NaB and tubacin that increased gj by 26% and 9% respectively were applied in combination, gj decreased by 26%, indicating an opposite and negative response when class I and IIb HDAC inhibition is combined.
Ijms 19 02288 g002
Figure 3. Peak cardiac INa effects of pan- and class-selective HDAC inhibition. (A) Families of ventricular cardiomyocyte INa current traces produced in response to depolarizing voltage clamp steps from a holding potential of −120 mV before and after treatment with 100 or 500 nM panobinostat (LBH589). (B) Average INa current–voltage (I–V) relationships from control (n = 8) and LBH589 treated cells (n = 8, 10) illustrating a concentration-dependent decrease in peak INa density (pA/pF) with pan-HDAC inhibition. (C) Average INa–Vm relationships for control (n = 9) and 1 μM entinostat (MS-275, n = 8) treated NMVMs indicates that class I HDAC inhibition does not affect the cardiac Na+ current density. (D) Representative INa current traces from control and ricolinostat (ACY-1215) treated NMVMs showing an increase in peak INa with 25 nM ACY-1215. (E) Average INa–Vm relationships for control (n = 17) and 10 and 25 nM ricolinostat (n = 8, 7) exhibit a concentration-dependent, but non-significant, increase in peak INa density with class IIb HDAC6 inhibition.
Ijms 19 02288 g003
Figure 4. Effect of HDAC inhibition on Vm-dependent INa activation and inactivation. (A) Vm-dependent steady state gNa activation curves for the experiments shown in Figure 3B illustrating a slight positive shift in the half activation voltage (V½) of +2.5–6.4 mV with pan-HDAC inhibition by panobinostat. (B) There was no shift in the gNa–Vm activation curve for class I selective HDAC inhibition by 1 μM entinostat. (C) HDAC6 inhibition by 25 nM ACY-1215 produced a −4 mV shift in the gNa–Vm activation curve. (D) Vm-dependent inactivation was examined using a prepulse protocol and 1 μM entinostat caused a −4 mV shift in the gNa steady state inactivation (n = 9 (control), 8). (E) Ricolinostat (25 nM, n = 7) did not produce a shift in the gNa V½ relative to control values (n = 6).
Ijms 19 02288 g004
Figure 5. HDAC inhibition does not increase late INa. (A) Whole cell late INa currents generated by a 90 mV, 3.6 s Vm ramp from −80 to +10 mV in a control NMVM and a NMVM treated with 1 μM entinostat for 18–24 h. (B) Late INa currents recorded from a control NMVM and a NMVM treated with 25 nM ricolinostat overnight. (C) Averaged late INa current density (pA)/pF) from 6–10 NMVMs treated with panobinostat, entinostat, or ricolinostat illustrating no increase in late INa relative to untreated NMVMs after 18–24 h exposure to pan- or class-selective HDAC inhibitors. Late INa was measured as the average steady state INa current from 100 to 150 msec in control and panobinostat treated NMVMs in response to activating Vm pulses (Figure 3A,B).
Ijms 19 02288 g005
Figure 6. Changes in cardiac Cx43 and NaV1.5 protein levels by panobinostat, entinostat and ricolinostat. (A) Representative Western blot of lysed NMVMs treated with 0, 25, 100, 500, and 2500 nM panobinostat for 24 h. Ac-tubulin is acetylated α-tubulin, Ac-H3 is acetylated histone 3, and α-tubulin was used as a loading control. (B) Densitometry scans of Cx43 Western blots (n = 3) to quantify the reduction in Cx43 protein levels with increasing concentrations of panobinostat (* p < 0.05). (C) Densitometry scans of NaV1.5 Western blots (n = 3) quantifying the statistically significant decrease in NaV1.5 protein levels with higher concentrations of panobinostat (* p < 0.05). (D) A representative Western blot of lysed ventricular myocytes treated with 1 μM entinostat (MS-275) or 25 nM ricolinostat for 24 h. Note that MS-275 only increased the Ac-H3 signal while ACY-1215 only increased the Ac-α-tubulin signal, consistent with their class I and HDAC6 inhibitory activities. (E) Densitometry scans of 1 μM entinostat Western blots (n = 4) illustrating no significant changes in Cx43 or NaV1.5 protein levels with entinostat, a class I HDAC-selective inhibitor. (F) Densitometry scans of 25 nM ricolinostat Western blots (n = 3) illustrating no significant changes in Cx43 or NaV1.5 protein levels with ricolinostat.
Ijms 19 02288 g006
Table 1. HDAC inhibitor Activity Assays.
HDACIA1C1 (nM)IC50(1) (nM)A2C2 (nM)IC50(2) (nM)BR2
TSA * (RFU)2829 ± 21910.6 ± 1.37.3 ± 0.9 298 ± 71258 ± 76 179 ± 5384 ± 70.98
VOR * (% RFU)48.8 ± 7.7140 ± 3097 ± 2144.1 ± 7.11086 ± 312753 ± 2166.1 ± 2.40.99
FK228 (% RFU)63.5 ± 5.37.9 ± 0.95.5 ± 0.627.7 ± 2.82524 ± 6781749 ± 4708.8 ± 1.40.99
LBH589 (RFU)8322 ± 71157.4 ± 22.239.8 ± 15.4927 ± 3572959 ± 8382050 ± 581374 ± 30.96
MS-275 (RFU)20,111 ± 3080629 ± 166436 ± 115 20,106 ± 215012,926 ± 36558958 ± 253315,408 ± 11380.97
ACY-1215 (RFU)14,914 ± 684016.9 ± 15.111.7 ± 10.532,744 ± 6835204 ± 52141 ± 363369 ± 2630.99
* Adjusted values from data published in [13]; adjusted values from data published in [14].
Table 2. Inhibitory constants for HDAC inhibitors used in this study.
HDACILBH589LBH589MS-275MS-275MS-275ACY-1215TubacinVPA
(nM) [23](nM) [26](nM) [19](nM) [23](nM) [26](nM) [20](nM) [26](nM) [23]
HDACIC50KIIC50IC50KIIC50KIIC50
HDAC13 ± 01.00 ± 0.1180 ± 70181 ± 6222 ± 25828 ± 41.584 × 10+6 ± 0.3
HDAC23 ± 00.65 ± 0.1---1155 ± 13465 ± 54842 ± 3.53.07 × 10+6 ± 0
HDAC34 ± 11.1 ± 0.15740 ± 2502311 ± 803360 ± 1551275 ± 3203.07× 10+6 ± 0
HDAC8248 ± 11105 ± 2044,900 ± 18,100>100,000---100170 ± 107.442 × 10+6 ± 2.74
HDAC661 ± 11.50 ± 0.5>100,000>100,000---4.716 ± 2>100,000
HDAC412 ± 5550 ± 50--->100,000---700017,000 ± 2500---
HDAC5---80 ± 10---------50001500 ± 250---
HDAC714 ± 74550 ± 315--->100,000---14008500 ± 1500>100,000
HDAC93 ± 23200 ± 200---505 ± 37--->10,000--->100,000
>100,000 = incomplete inhibition at 100 μM [HDACI] [23]; VPA = valproic acid, another short chain fatty acid low-affinity HDAC inhibitor.

