SeqSVM: A Sequence-Based Support Vector Machine Method for Identifying Antioxidant Proteins

1
School of Electronic and Communication Engineering, Shenzhen Polytechnic, Shenzhen 518060, China
2
Key Laboratory of Optoelectronic Devices and Systems of Ministry of Education and Guangdong Province, College of Optoelectronic Engineering, Shenzhen University, Shenzhen 518060, China
*
Author to whom correspondence should be addressed.
Int. J. Mol. Sci. 2018, 19(6), 1773; https://doi.org/10.3390/ijms19061773
Submission received: 21 May 2018
/
Revised: 10 June 2018
/
Accepted: 11 June 2018
/
Published: 15 June 2018
(This article belongs to the Special Issue Special Protein or RNA Molecules Computational Identification 2018)
Abstract
:Antioxidant proteins can be beneficial in disease prevention. More attention has been paid to the functionality of antioxidant proteins. Therefore, identifying antioxidant proteins is important for the study. In our work, we propose a computational method, called SeqSVM, for predicting antioxidant proteins based on their primary sequence features. The features are removed to reduce the redundancy by max relevance max distance method. Finally, the antioxidant proteins are identified by support vector machine (SVM). The experimental results demonstrated that our method performs better than existing methods, with the overall accuracy of 89.46%. Although a proposed computational method can attain an encouraging classification result, the experimental results are verified based on the biochemical approaches, such as wet biochemistry and molecular biology techniques.
1. Introduction
Permeability is an intrinsic nature of a normal cell membrane. Not only the water and oxygen are allowed to flow into the cell freely, but also the carbon dioxide and other waste products (uric acid, water, and etc.) can pass through the cell membrane. The free radicals exist in metabolic process, X-rays, air pollutants, cigarette smoking, etc. [1]. They are unstable before they find atoms for neutralization. Since the skin is damaged outside every day, the free radicals are harmful to the cells of the skin. They can create a chain with the beginning of oxidative damage, and then the cells are destroyed.
Antioxidant proteins can neutralize free radicals to make them stable. Research shows that antioxidant proteins play an important role in terminating cellular and DNA damage caused by free radicals [2]. The damage caused by free radicals is the source of aging and various diseases [3,4,5]. Thus, research on antioxidant proteins has been paid more attention recently.
Although some micronutrients (vitamins) have been recognized as antioxidant molecules, such as vitamin E, vitamin C, etc., it is still necessary to identify effective proteins with antioxidative characteristics. Unfortunately, it is time-consuming to predict the antioxidant proteins by biochemical experiments. The computational method for prediction has been paid more attention recently, such as SNPdryad, used for predicting deleterious non-synonymous human SNPs (Single Nucleotide Polymorphisms) [6,7]. The computational methods used for identifying antioxidant proteins are expected, especially for the cases with large amount of protein sequence data. A method based on star graph topological indices was proposed to handle the problem [4], and the results are encouraging. However, the sequences in [4] are reused in the experiments, which the results are likely to be overestimated. Furthermore, a naive Bayes model was proposed by Feng et al. [8] to predict antioxidant proteins. The model proposed in [8] is based on optimal dipeptides, and the accuracy is 66.88% evaluated by jackknife test. The accuracy of AodPred [9], based on g-gap dipeptide composition, is 74.79%. As we have known, the accuracy of antioxidant proteins can be improved.
The experimental results of previous work show that the performance of predicting antioxidant is related to the representation of proteins and the classifiers. The sequence information of proteins should be described precisely in the process of protein representation [10,11]. The study of protein representation has been paid more attention these years, such as the amino acid composition (AAC) model used in [12,13,14], g-gap dipeptide composition, proposed in [15], 400D [16], 188D [17], and others. The protein is represented by a simple vector in AAC model, whose elements represent the normalized occurrence frequency of the native amino acid in the peptide chain. As a result, the sequence information is lost in the AAC model. G-gap dipeptide composition [18] is a sequence-based feature extraction method for protein representation, which has been used widely in the realm of bioinformatics [2,9,17,19,20,21,22,23,24]. 400D is a method that represents the occurrence frequency of two consecutive amino acids, which is used in [16] to identify anticancer peptides. 188D [17] contains 188 features, including the physicochemical property attributes, the occurrence frequency of amino acid information, and others. The features can be combined together for keeping more information, as in [25,26]. In our work, the protein is described based on the physicochemical properties [17], and there are, totally, 188 dimensions used for protein representation. However, the results of experiments show that there may be redundancy between the features, so it is necessary to reduce the dimensionality of the features [27]. The redundancy is also considered in our work by maximizing the relevance and the distance between the features [28], and number of features is reduced to 132. The problem of imbalance class is considered in our work, and the dataset is processed by SMOTE (synthetic minority oversampling technique) method. The experimental results demonstrate that the reduced features attain higher accuracy than 188D. In other words, the accuracy of SeqSVM using 188D is 88.68%, while the accuracy of SeqSVM is improved to 89.46% using the method of MRMD (maximum relevance maximum distance) to select the features. Compared with AodPred [9], the accuracy of our method is better than that of AodPred, whose accuracy is 74.79%.
Above all, the contributions of our work include as follows:
- (1)
- A computational method called (SeqSVM) is proposed to predict antioxidant proteins, which is based on the primary sequence features proposed in [17]. The features are described by the physicochemical properties and sequence information of the protein, the dimensionality of the extracted features is 188, so the feature used here is called 188D.
- (2)
- There is redundancy in the 188D feature. In the manuscript, the features are selected by maximum relevance maximum distance method [28]. The features will be kept which can maximize the Pearson’s correlation coefficient and the distance between attributes. The experimental results show that the performance of the method using selected features is competitive, or even better than that of the method using 188D.
- (3)
- The proposed method uses support vector machine for antioxidant protein prediction. The experiments demonstrated that our proposed method performs better than existing methods with the accuracy of 89.46%. The best result of existing work is 74.79% proposed by Lin et al. [9].
The rest of the paper is organized as follows. The experimental results are discussed and analyzed in Section 2. Section 3 introduces the dataset used in the proposed work, the classification method, SMOTE processing, sequence representation, and performance evaluation. Finally, a conclusion is given in Section 4.
2. Results and Discussion
2.1. Comparison with Existing Methods
Our proposed method (SeqSVM) is compared with existing methods. Table 1 shows the comparison of our method with the existing method, on accuracy. The dataset is processed by SMOTE method to make a balance between the antioxidant samples and non-antioxidant samples in SeqSVM. For the purpose of removing the feature redundancy, the features are selected by max relevance max distance principle. In Table 1, the accuracy of our method with SMOTE processing and MRMD is 89.46%. Naive Bayes method is proposed to predict antioxidant proteins, and the accuracy of the method is 66.88% in jackknife test [8]. AodPred [9] is a method based on SVM classifier by using g-gap dipeptide features. The accuracy of AodPred based on g-gap dipeptides is 74.79% in jackknife test. Thus, the experimental results demonstrate that our method can attain high accuracy and classify antioxidant and non-antioxidant proteins efficiently. The time complexity of computation method depends on the classification method SVM, which is related to the number of training samples and the feature dimension.
2.2. The Comparison of Performance Evaluation on Feature Selection Methods
To further demonstrate the performance of our sequence-based method and the selected 132D features, the features are compared with g-gap dipeptides by using other classifiers provided by WEKA [29]. The feature set of 188D is reduced by MRMD method to 132D. MRMD method is a feature method, which is mentioned in Section 3.6. The performance of the features on different classifiers on sensitivity (Sn), specificity (Sp), and accuracy (Acc) are compared in Figure 1, Figure 2 and Figure 3. In Figure 1, Figure 2 and Figure 3, “Logistic” is short for logistic regression. J48 tree is a decision tree method based on C4.5. RF and SVM are short for random forest and support vector machine.
The Sn on 132D used Bayes net performs better than other methods. In the experiments, we can see that our method (188D and 132D using SVM) performs better than other classifiers using g-gap dipeptides, except SVM. However, Bayes net using 188D attains the highest Sn with 81.6%. The Sn of reduced 132D on Bayes net also performs better than that of AodPred. Figure 1 also shows that 188D and 132D perform better than g-gap dipeptides on most classifiers, which means that 188D and 132D are more robust than g-gap dipeptides. The figure also shows that the reduced 132D removes the redundancy, and can attain comparably high sensitivity on Bayes net and J48 tree. The sensitivity of 132D reduced features is higher than that of 188D on the other three classifiers. Thus, it is necessary to select features by max relevance max distance method.
The comparison of specificity with the features on different classifiers is shown in Figure 2. Our method (188D with SVM) performs better than that of AodPred (g-gap dipeptides) on specificity. The value of Sp of the reduced SeqSVM is higher than that of AodPred (g-gap dipeptides). G-gap dipeptides performs on Bayes net than 188D and 132D. The values of Sp using different features are comparable on Logistic, J48 tree, and RF classifiers.
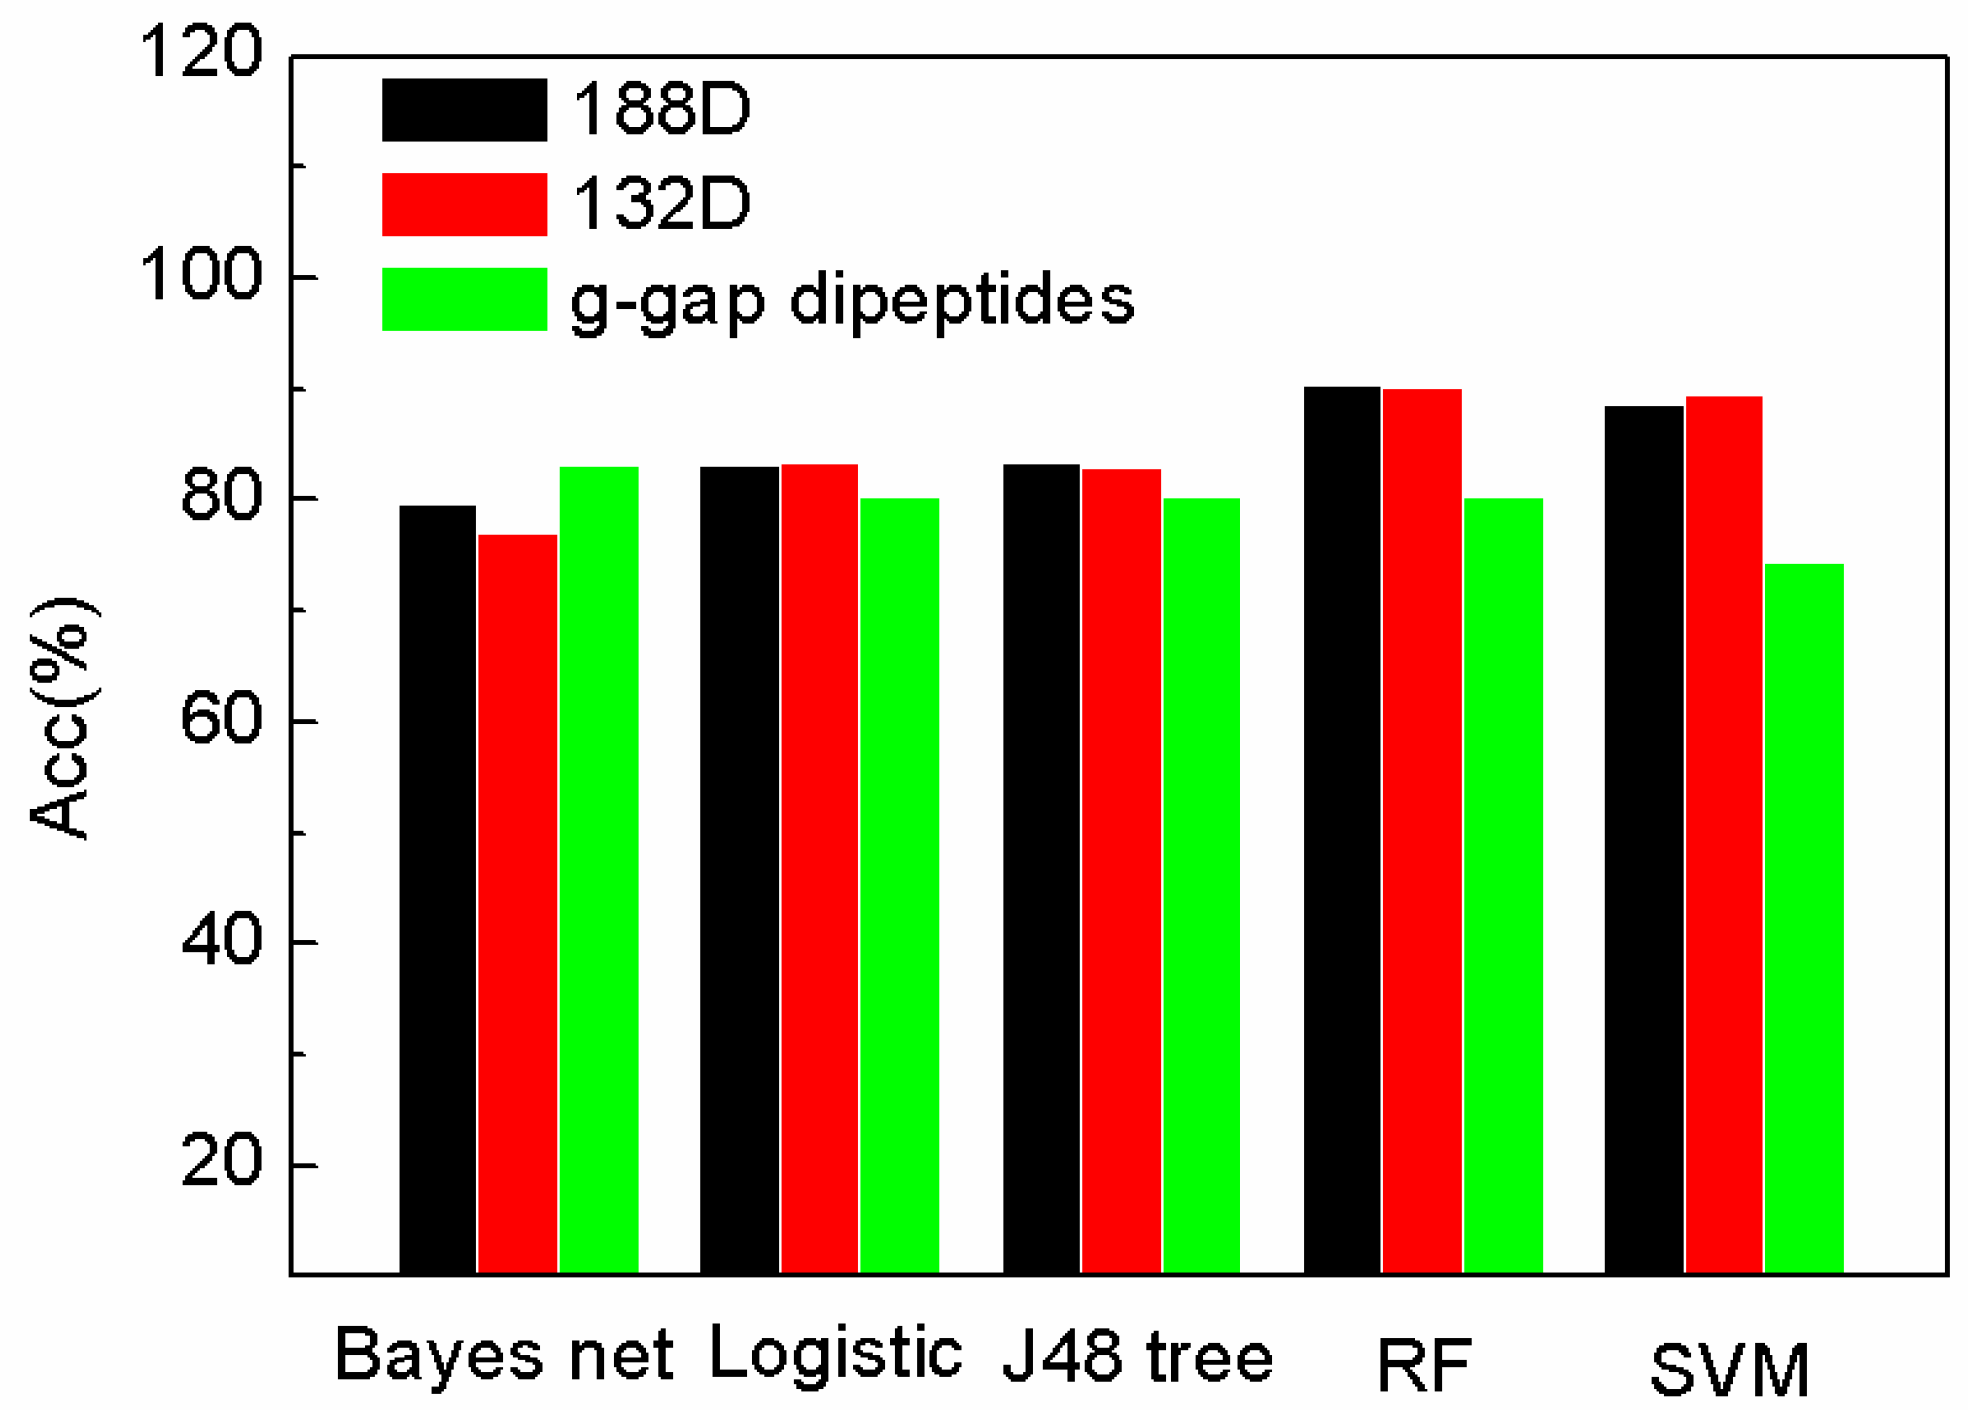
In Figure 3, the accuracy of SeqSVM with 188D and 132D is better than that of AodPred (g-gap dipeptides SVM).
2.3. The Comparison of SeqSVM
The method of SeqSVM with SMOTE is compared to SeqSVM without SMOTE. The comparison of SeqSVM methods is shown in Table 2. The accuracy of SeqSVM before SMOTE is 85.98%, while the accuracy of SeqSVM is 88.68% after SMOTE processing. The accuracy of SeqSVM is improved by 3.1% after using SMOTE processing compared with SeqSVM without SMOTE processing. The accuracy of SeqSVM with SMOTE and MRMD is 89.46%, which the accuracy is improved by 4% compared with SeqSVM. The experimental results demonstrate that the performance of classifier can be improved by using SMOTE processing, when the number of class sample is imbalance. Although the computational methods can attain an encouraging classification result, the experimental results are verified based on the biochemical approaches, such as wet biochemistry and molecular biology techniques.
3. Materials and Methods
3.1. Benchmark Dataset
The dataset used in our work is generated and used by Feng et al. [8,30,31], and the data are selected from the UniProt database. For the purpose of selecting valid data, only the proteins that have been confirmed with antioxidative activities are selected, and the proteins with ambiguous meanings (such as “B”, “X”, “Z”) are excluded. The benchmark dataset (S) is represented by positive subset (S+) and negative subset (S−), formulated as Equation (1).
where the symbol “” means the union in the set theory. There are 710 antioxidant proteins and 1567 non-antioxidant proteins left after the selection process. Furthermore, the selected sequences contain redundancy with high similarity. To avoid the overestimation of the methods, the homologous sequences with more than 60% similarity are removed by CD-HIT program [32] from the dataset. Finally, a benchmark dataset with 253 antioxidant proteins and 1552 non-antioxidant proteins is used for the prediction model. As a result, the positive subset (S+) contains 253 samples, while there are 1552 samples in the negative subset (S−).
3.2. Support Vector Machine
Support vector machine (SVM) is a supervised classification model. As we have known, SVM has been widely used in bioinformatics [9,33,34,35,36,37,38,39,40,41,42,43,44,45,46], so here, we introduce it briefly. In linearly separable cases, the key idea of SVM is that a hyperplane is built to separate the two groups with a maximum margin. If the samples are non-linearly separated, the input variables are mapped into a high dimensional feature space by a kernel function. The principle of SVM is introduced in [47,48], and more details are provided in [49]. The SVM used in our work is the package named LIBSVM written by Chang and Lin [50]. Radial kernel function (RBF) is selected because of its effectiveness and efficiency. The regularization parameter, C, and the kernel width parameter, γ, are optimized by the grid search approach.
3.3. SMOTE Processing
There are 253 antioxidant proteins and 1552 non-antioxidant proteins in the dataset. The dataset is quite imbalanced for the reason that the positive samples and negative samples are not equally represented. SMOTE [51] is an approach to achieve a better result by oversampling the minority class and undersampling the majority class. The key idea of SMOTE is that a synthetic sample is created by oversampling method, instead of replacement. The minority class is composed of the minority class samples and the synthetic samples. The synthetic samples are generated along the line segments joining any or all of the K minority class nearest neighbors. If 200% samples should be oversampled, two out of K nearest samples will be chosen, and samples are generated on each direction of the chosen neighbors. The data are standardized after SMOTE processing.
3.4. Sequence Representation
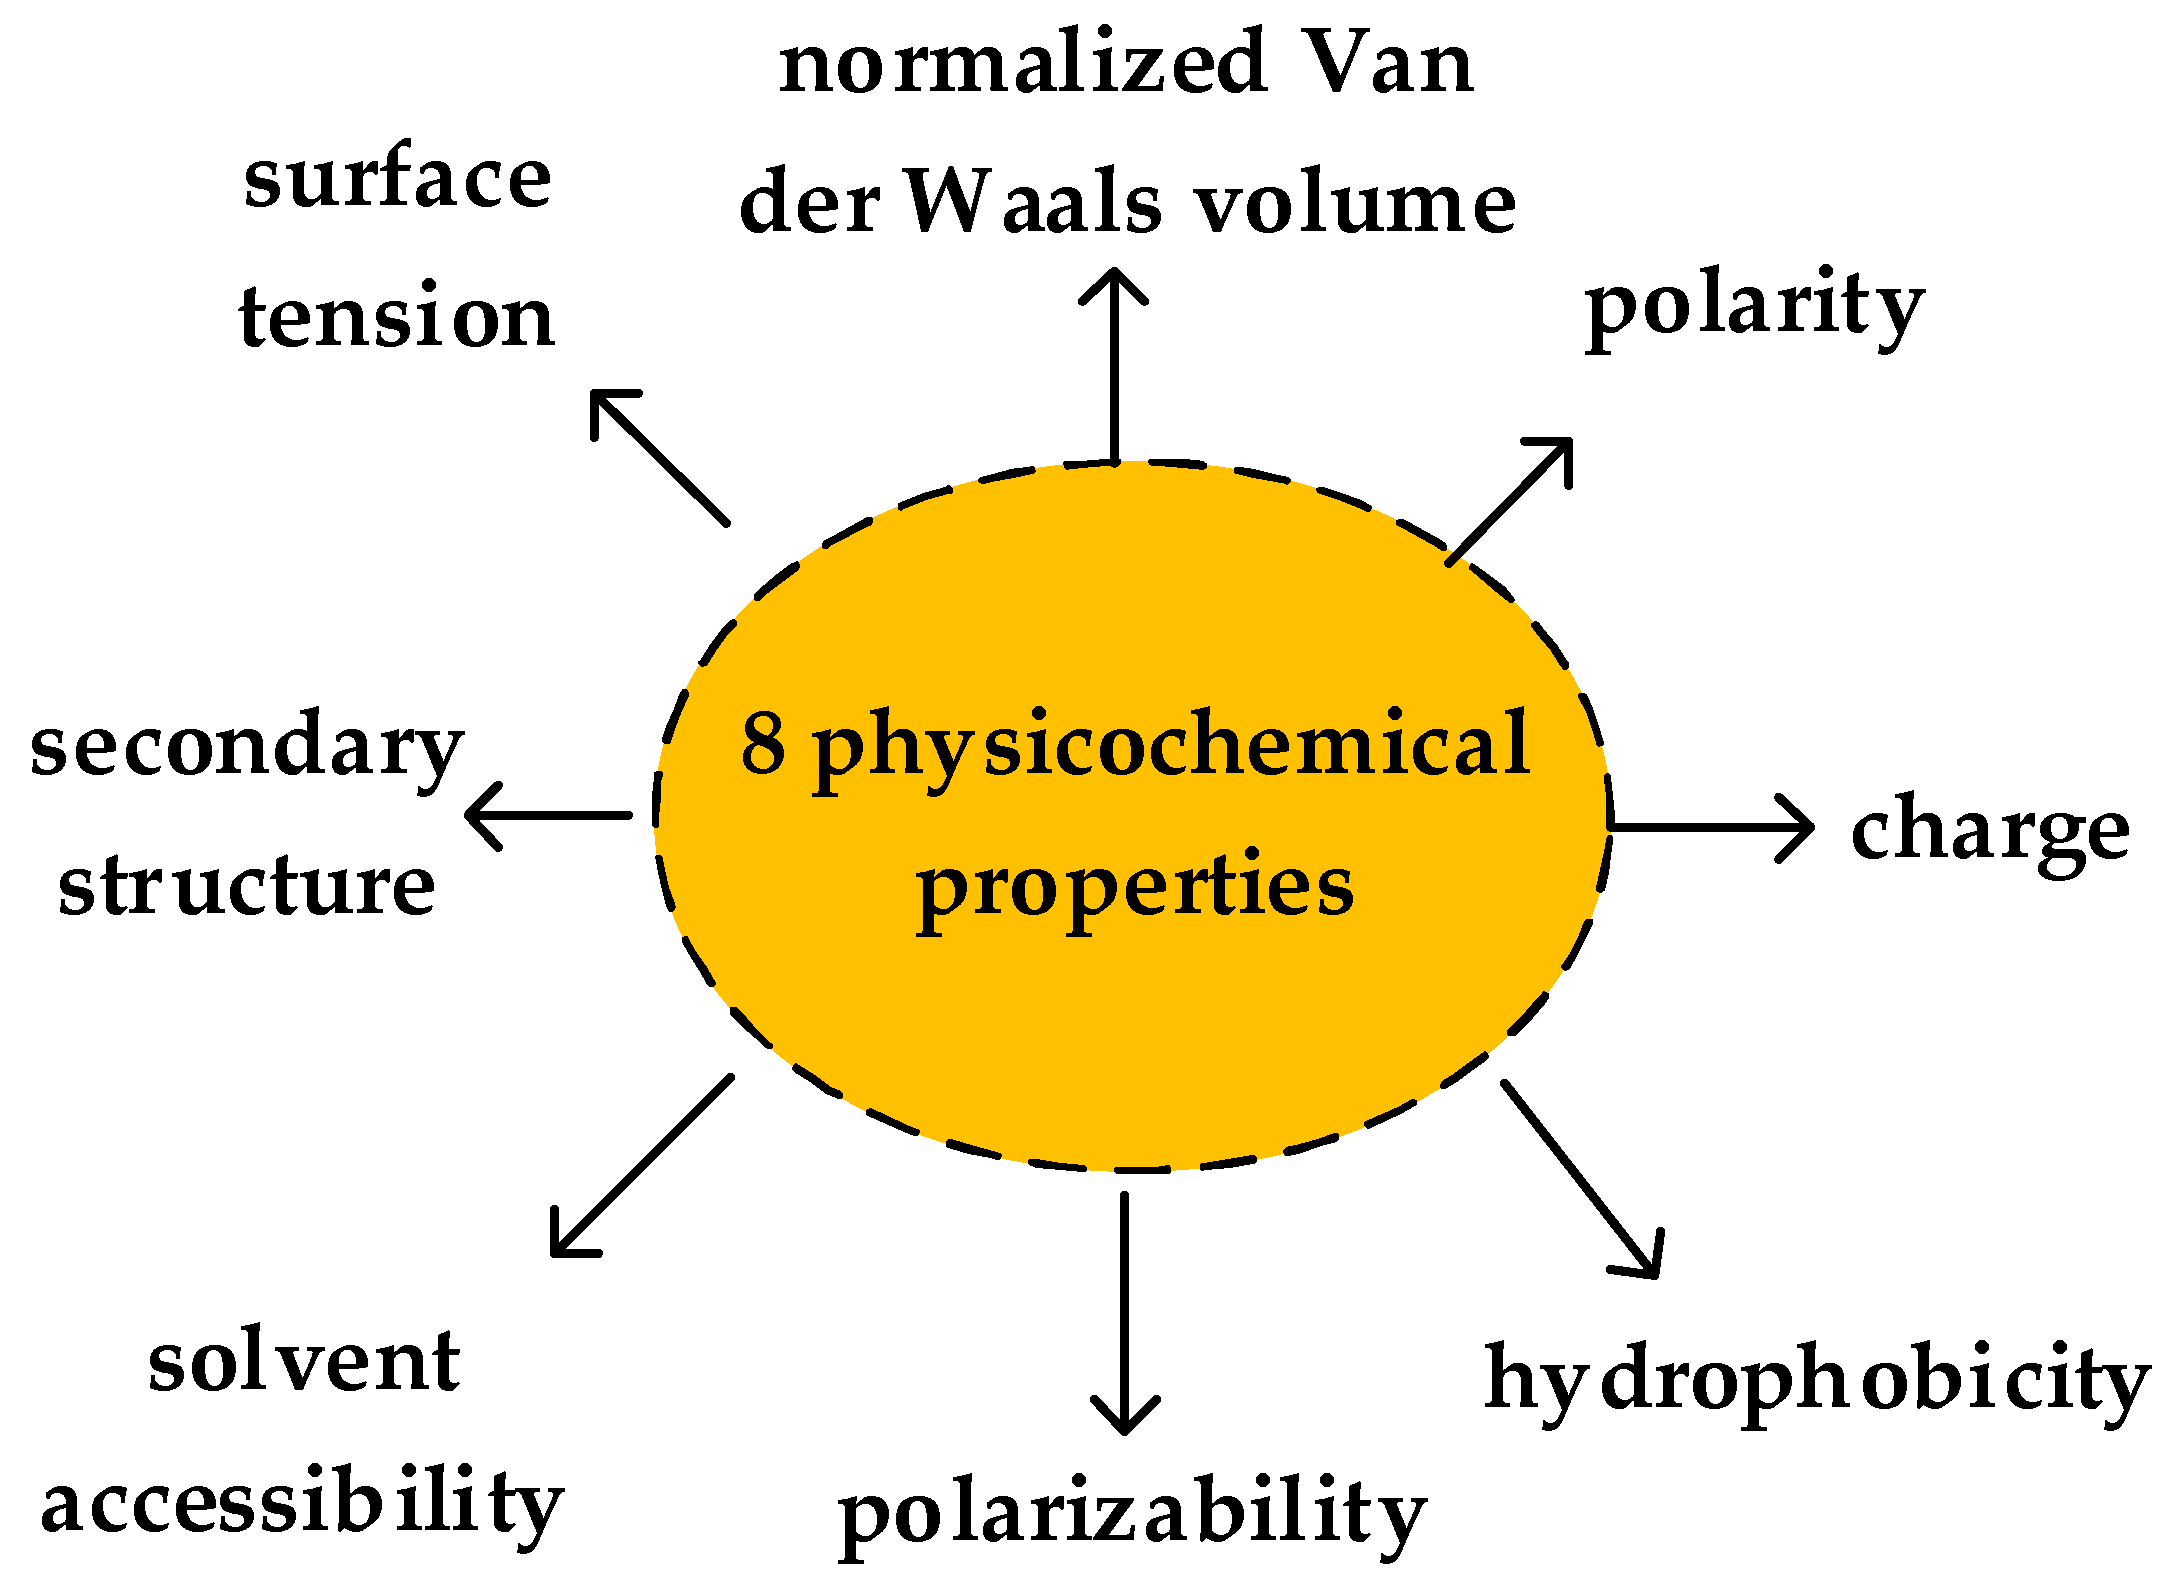
188D vector was used to extract features of proteins by Cai et al. in 2003 [17]. The property of 188D includes the amino acid composition, distribution and physicochemical property. Due to the diversity of the amino acid, to extract the features clearly, the mentioned properties are divided into four classes. C1 means the percentage of amino acid (based on the amino acid class), C2 represents the percentage of amino acid (based on physicochemical property). There are 20 amino acids, so the dimension number of frequency of each amino acid is 20. The physicochemical property is represented by eight attributes, which are secondary structure, solvent accessibility, normalized Van der Waals volume, hydrophobicity, charge, polarity, polarizability, and surface tension. There are three values for each attribute, for example, the attribute of secondary structure can be described by EALMQKRH, VIYCWFT, or GNPSD, denoted by Rij (). The physicochemical property of proteins is shown as Figure 4. Thus, 24 attributes are used for describing the physicochemical properties. B describes the percent frequency of bivalent. There are three types of bivalent used for each property, denoted by . Thus, there are 24 dimensions on the eight physicochemical property attributes.
Given a protein sequence with length L, the percent of the amino acids of a particular property located at the first, 25%, 50%, 75%, 100% is measured as the distribution of the protein. There are 24 attributes used to describe the physicochemical properties. The distributions of amino acids are represented by 120 attributes, by the reason that there are five values on each attribute. Above all, the total number of attributes for protein representation is 188. In fact, it is obvious that not all of the 188 features will be used for prediction. There is redundancy between the features. Thus, the features are selected by max relevance max distance method proposed by Zou [28].
3.5. Performance Evaluation
Sensitivity (Sn), specificity (Sp), and accuracy (Acc) are used to measure the classification quality. Sensitivity is used in Chou’s work [52,53,54,55], and represents the sensitivity, which is calculated by Equation (2). Specificity is the specificity of the algorithm, which is measured by the rate of misclassification of the antioxidant proteins. The calculation of Sp is shown as Equation (3). Assessments of Sp or Sn, individually, are not sufficient to evaluate the performance of a method. The overall accuracy is calculated by Equation (4).
where TP is the number of true positive samples, TN represents the number of true negative samples, FN represents the number of false negative samples, and FP represents the number of false positive samples.
Assume N+ is the number of antioxidant proteins labeled by the classification method, and N− is the number of non-antioxidant proteins labeled by the classification method. is the number of antioxidant proteins which are misclassified by non-antioxidant proteins. is the number of non-antioxidant proteins which are mislabeled by antioxidant proteins. Thus, there are
If , this means that all antioxidant proteins are recognized, and the sensitivity Sn = 1. Similarly, if , this means that none of the non-antioxidant proteins are misclassified as antioxidant proteins, and the value of specificity Sp = 1. Equations (9)–(11) can be rewritten as
From Equations (9)–(11), it is obvious that if , which means that none of the antioxidant peptides or the non-antioxidant peptides are misclassified. Thus, there is Sn = Sp = Acc = 1. The values of Sn, Sp, and Acc are larger, and the performance of the method is better.
In the experiments, the predictors are evaluated by the jackknife cross-validation [56]. There are three cross-validation test methods used in the literature, which are independent dataset test, K-fold cross-validation (i.e., 5-fold cross-validation or 10-fold cross-validation) and jackknife cross-validation test [56]. Jackknife test is considered as the least arbitrary and most objective [57]. The advantage of jackknife test has been demonstrated in that it can give a unique output for a given benchmark dataset.
3.6. Feature Selection
Feature selection techniques have been widely applied to problems in bioinformatics [57,58,59,60,61]. In this work, we use maximum relevance maximum distance (MRMD) [28] to remove the redundancy of features. The objective function of MRMD is shown as Equation (12). If m−1 features have been selected, the m-th feature will be selected if the i-th feature maximizes Equation (12).
where MRi is the relevance between the features. The relevance is measured by the Pearson’s correlation coefficient, shown as Equation (13).
where N is the number of vectors, and is the average value on the k-th dimension. MDi is used to measure the level of similarity between two feature vectors. In our experiments, the maximum distance is calculated as the mean of the Euclidean distance (ED), cosine distance (COS), and Tanimoto coefficient (TC) (shown as Equation (16)). The distances used are defined as follows.
where M is the number of features. The distance is calculated on each dimension, and the feature will be selected with the maximum distance by satisfying the condition of Equation (17).
4. Conclusions
Antioxidant proteins can terminate the cellular and DNA damage caused by external sources, such as exposures to X-rays, ozone, cigarette smoking, and others. The study of antioxidant proteins has drawn attention in recent years. The computational methods have been proposed to identify the antioxidant proteins, and the results are encouraging. In our work, a method based on primary sequence information, using SVM, is proposed to predict antioxidant proteins, and the experimental results show that our method performs better than existing methods. The contribution of our work is that a computational method is proposed to predict antioxidant proteins, and the classification accuracy of the method is better than some existing methods. Since there are publicly accessible web servers provided for practical models [62,63,64,65,66], the web server for identifying antioxidant proteins based on our method will be developed later to help the researchers identify the antioxidant proteins. We will also extend our work to other organism in our future work, such as E. coli/S. cerevisiae/D. radiodurans in UniProt database.
Author Contributions
L.X. initially drafted the manuscript and did most of the codes work and the experiments. C.R.L. collected the features and analyzed the experiments. S.S. and G.L. revised to draft the manuscript. All authors read and approved the final manuscript.
Acknowledgments
This work was supported by the Science and Technology Innovation Commission of Shenzhen (grant no. JCYJ20160523113602609), the Grant of Shenzhen Polytechnic (grant no. 601822K19011) and National Nature Science Foundation of China (grant nos. 61575128, 61771331).
Conflicts of Interest
The authors declare no conflicts of interest.
References
- Lobo, V.; Patil, A.; Phatak, A.; Chandra, N. Free radicals, antioxidants and functional foods: Impact on human health. Pharmacogn. Rev. 2010, 4, 118–126. [Google Scholar] [CrossRef] [PubMed]
- Barbusinki, K. Fenton reaction-controversy concerning the chemistry. Ecol. Chem. Eng. 2009, 16, 347–358. [Google Scholar]
- Phamhuy, L.A.; He, H.; Phamhuy, C. Free radicals, antioxidants in disease and health. Int. J. Biomed. Sci. IJBS 2008, 4, 89–96. [Google Scholar]
- Fernández-Blanco, E.; Aguiar-Pulido, V.; Munteanu, C.R.; Dorado, J. Random forest classification based on star graph topological indices for antioxidant proteins. J. Theor. Biol. 2013, 317, 331–337. [Google Scholar] [CrossRef] [PubMed]
- Shah, A.M.; Channon, K.M. Free radicals and redox signalling in cardiovascular disease. Heart 2004, 90, 486–487. [Google Scholar] [CrossRef] [PubMed] [Green Version]
- Wong, K.-C.; Zhang, Z. SNPdryad: Predicting deleterious non-synonymous human SNPs using only orthologous protein sequences. Bioinformatics 2014, 30, 1112–1119. [Google Scholar] [CrossRef] [PubMed]
- Schwarz, J.M.; Cooper, D.N.; Schuelke, M.; Seelow, D. MutationTaster2: Mutation prediction for the deep-sequencing age. Nat. Methods 2014, 11, 361–362. [Google Scholar] [CrossRef] [PubMed]
- Feng, P.M.; Lin, H.; Chen, W. Identification of antioxidants from sequence information using naïve bayes. Comput. Math. Methods Med. 2013, 2013, 567529. [Google Scholar] [CrossRef] [PubMed]
- Feng, P.; Chen, W.; Lin, H. Identifying antioxidant proteins by using optimal dipeptide compositions. Interdiscip. Sci. Comput. Life Sci. 2016, 8, 186–191. [Google Scholar] [CrossRef] [PubMed]
- Liu, B. BioSeq-Analysis: A platform for DNA, RNA, and protein sequence analysis based on machine learning approaches. Brief. Bioinform. 2017. [Google Scholar] [CrossRef] [PubMed]
- Liu, B.; Liu, F.; Wang, X.; Chen, J.; Fang, L.; Chou, K.-C. Pse-in-One: A web server for generating various modes of pseudo components of DNA, RNA, and protein sequences. Nucleic Acids Res. 2015, 43, W65–W71. [Google Scholar] [CrossRef] [PubMed]
- Zhang, C.T.; Chou, K.C. An optimization approach to predicting protein structural class from amino acid composition. Protein Sci. 1992, 1, 401–408. [Google Scholar] [CrossRef] [PubMed]
- Nakashima, H.; Nishikawa, K.; Ooi, T. The folding type of a protein is relevant to the amino acid composition. J. Biochem. 1986, 99, 153–162. [Google Scholar] [CrossRef] [PubMed]
- Zhou, G.P. An intriguing controversy over protein structural class prediction. J. Protein Chem. 1998, 17, 729–738. [Google Scholar] [CrossRef] [PubMed]
- Chen, W.; Feng, P.M.; Lin, H.; Chou, K.C. iRSpot-PseDNC: Identify recombination spots with pseudo dinucleotide composition. Nucleic Acids Res. 2013, 41, e68. [Google Scholar] [CrossRef] [PubMed]
- Xu, L.; Liang, G.; Wang, L.; Liao, C. A novel hybrid sequence-based model for identifying anticancer peptides. Genes 2018, 9, 158. [Google Scholar] [CrossRef] [PubMed]
- Cai, C.Z.; Han, L.Y.; Ji, Z.L.; Chen, X.; Chen, Y.Z. SVM-Prot: Web-based support vector machine software for functional classification of a protein from its primary sequence. Nucleic Acids Res. 2003, 31, 3692–3697. [Google Scholar] [CrossRef] [PubMed]
- Chou, K.C. Prediction of protein cellular attributes using pseudo-amino acid composition. Proteins Struct. Funct. Bioinform. 2001, 44, 246–255. [Google Scholar] [CrossRef] [PubMed]
- Chen, W.; Ding, H.; Feng, P.; Lin, H.; Kuo-Chen, C. iACP: A sequence-based tool for identifying anticancer peptides. Oncotarget 2016, 7, 16895–16909. [Google Scholar] [CrossRef] [PubMed]
- Nanni, L.; Lumini, A.; Gupta, D.; Garg, A. Identifying bacterial virulent proteins by fusing a set of classifiers based on variants of Chou’s pseudo amino acid composition and on evolutionary information. IEEE/ACM Trans. Comput. Biol. Bioinform. 2012, 9, 467–475. [Google Scholar] [CrossRef] [PubMed]
- Wang, X.; Zhang, W.; Zhang, Q.; Li, G.Z. MultiP-SChlo: Multi-label protein subchloroplast localization prediction with Chou’s pseudo amino acid composition and a novel multi-label classifier. Bioinformatics 2015, 31, 2639–2645. [Google Scholar] [CrossRef] [PubMed]
- Zhou, X.B.; Chen, C.; Li, Z.C.; Zou, X.Y. Using Chou’s amphiphilic pseudo-amino acid composition and support vector machine for prediction of enzyme subfamily classes. J. Theor. Biol. 2007, 248, 546–551. [Google Scholar] [CrossRef] [PubMed]
- Mandal, M.; Mukhopadhyay, A.; Maulik, U. Prediction of protein subcellular localization by incorporating multiobjective PSO-based feature subset selection into the general form of Chou’s PseAAC. Med. Biol. Eng. Comput. 2015, 53, 331–344. [Google Scholar] [CrossRef] [PubMed]
- Esmaeili, M.; Mohabatkar, H.; Mohsenzadeh, S. Using the concept of Chou’s pseudo amino acid composition for risk type prediction of human papillomaviruses. J. Theor. Biol. 2010, 263, 203–209. [Google Scholar] [CrossRef] [PubMed]
- He, W.; Jia, C.; Duan, Y.; Zou, Q. 70ProPred: A predictor for discovering sigma70 promoters based on combining multiple features. BMC Syst. Biol. 2018, 12, 44. [Google Scholar] [CrossRef] [PubMed]
- Liu, B.; Zhang, D.; Xu, R.; Xu, J.; Wang, X.; Chen, Q.; Dong, Q.; Chou, K.C. Combining evolutionary information extracted from frequency profiles with sequence-based kernels for protein remote homology detection. Bioinformatics 2014, 30, 472–479. [Google Scholar] [CrossRef] [PubMed]
- Zou, Q.; Wan, S.; Ju, Y.; Tang, J.; Zeng, X. Pretata: Predicting TATA binding proteins with novel features and dimensionality reduction strategy. BMC Syst. Biol. 2016, 10, 114. [Google Scholar] [CrossRef] [PubMed]
- Zou, Q.; Zeng, J.; Cao, L.; Ji, R. A novel features ranking metric with application to scalable visual and bioinformatics data classification. Neurocomputing 2016, 173, 346–354. [Google Scholar] [CrossRef]
- Frank, E.; Hall, M.; Trigg, L.; Holmes, G.; Witten, I.H. Data mining in bioinformatics using WEKA. Bioinformatics 2004, 20, 2479–2481. [Google Scholar] [CrossRef] [PubMed]
- Feng, P.; Hui, D.; Hao, L.; Wei, C. AOD: The antioxidant protein database. Sci. Rep. 2017, 7, 7449. [Google Scholar] [CrossRef] [PubMed]
- Dreher, D.; Junod, A.F. Role of oxygen free radicals in cancer development. Eur. J. Cancer 1996, 32A, 30–38. [Google Scholar] [CrossRef]
- Fu, L.; Niu, B.; Zhu, Z.; Wu, S.; Li, W. CD-HIT: Accelerated for clustering the next-generation sequencing data. Bioinformatics 2012, 28, 3150–3152. [Google Scholar] [CrossRef] [PubMed]
- Guo, S.H.; Deng, E.Z.; Xu, L.Q.; Ding, H.; Lin, H.; Chen, W.; Chou, K.C. iNuc-PseKNC: A sequence-based predictor for predicting nucleosome positioning in genomes with pseudo k-tuple nucleotide composition. Bioinformatics 2014, 30, 1522–1529. [Google Scholar] [CrossRef] [PubMed]
- Qiu, W.R.; Xiao, X.; Lin, W.Z.; Chou, K.C. iUbiq-Lys: Prediction of lysine ubiquitination sites in proteins by extracting sequence evolution information via a gray system model. J. Biomol. Struct. Dyn. 2015, 33, 1731–1742. [Google Scholar] [CrossRef] [PubMed]
- Liu, B.; Fang, L.; Liu, F.; Wang, X.; Chen, J.; Chou, K.C. Identification of real microRNA precursors with a pseudo structure status composition approach. PLoS ONE 2015, 10, e0121501. [Google Scholar] [CrossRef] [PubMed]
- Lin, H.; Deng, E.Z.; Ding, H.; Chen, W.; Chou, K.C. iPro54-PseKNC: A sequence-based predictor for identifying sigma-54 promoters in prokaryote with pseudo K-tuple nucleotide composition. Nucleic Acids Res. 2014, 42, 12961–12972. [Google Scholar] [CrossRef] [PubMed]
- Feng, P.M.; Chen, W.; Lin, H.; Chou, K.C. iHSP-PseRAAAC: Identifying the heat shock protein families using pseudo reduced amino acid alphabet composition. Anal. Biochem. 2013, 442, 118–125. [Google Scholar] [CrossRef] [PubMed]
- Chen, W.; Feng, P.-M.; Lin, H.; Chou, K.-C. iSS-PseDNC: Identifying Splicing Sites Using Pseudo Dinucleotide Composition. BioMed Res. Int. 2014. [Google Scholar] [CrossRef] [PubMed]
- Yang, H.; Tang, H.; Chen, X.X.; Zhang, C.J.; Zhu, P.P.; Ding, H.; Chen, W.; Lin, H. Identification of secretory proteins in mycobacterium tuberculosis using pseudo amino acid composition. BioMed Res. Int. 2016, 2016, 5413903. [Google Scholar] [CrossRef] [PubMed]
- Chen, X.X.; Tang, H.; Li, W.C.; Wu, H.; Chen, W.; Ding, H.; Lin, H. Identification of bacterial cell wall lyases via pseudo amino acid composition. BioMed Res. Int. 2016, 2016, 1654623. [Google Scholar] [CrossRef] [PubMed]
- Lin, H.; Ding, C.; Song, Q.; Yang, P.; Ding, H.; Deng, K.J.; Chen, W. The prediction of protein structural class using averaged chemical shifts. J. Biomol. Struct. Dyn. 2012, 29, 643–649. [Google Scholar] [CrossRef] [PubMed]
- Liu, B.; Xu, J.; Lan, X.; Xu, R.; Zhou, J.; Wang, X.; Chou, K.-C. iDNA-Prot|dis: Identifying DNA-binding proteins by incorporating amino acid distance-pairs and reduced alphabet profile into the general pseudo amino acid composition. PLoS ONE 2014, 9, e106691. [Google Scholar] [CrossRef] [PubMed]
- Xiao, Y.; Zhang, J.; Deng, L. Prediction of lncRNA-protein interactions using HeteSim scores based on heterogeneous networks. Sci. Rep. 2017, 7, 3664. [Google Scholar] [CrossRef] [PubMed]
- Gao, J.; Tao, X.W.; Zhao, J.; Feng, Y.M.; Cai, Y.D.; Zhang, N. Computational prediction of protein epsilon lysine acetylation sites based on a feature selection method. Comb. Chem. High Throughput Screen. 2017, 20, 629–637. [Google Scholar] [CrossRef] [PubMed]
- Zhang, N.; Yu, S.; Guo, Y.; Wang, L.; Wang, P.; Feng, Y. Discriminating ramos and jurkat cells with image textures from diffraction imaging flow cytometry based on a support vector machine. Curr. Bioinform. 2017, 11, 1. [Google Scholar] [CrossRef]
- Zhang, N.; Duan, G.; Gao, S.; Ruan, J.; Zhang, T. Prediction of the parallel/antiparallel orientation of beta-strands using amino acid pairing preferences and support vector machines. J. Theor. Biol. 2010, 263, 360–368. [Google Scholar] [CrossRef] [PubMed]
- Chou, K.C.; Cai, Y.D. Using functional domain composition and support vector machines for prediction of protein subcellular location. J. Biol. Chem. 2002, 277, 45765–45769. [Google Scholar] [CrossRef] [PubMed]
- Cai, Y.D.; Zhou, G.P.; Chou, K.C. Support vector machines for predicting membrane protein types by using functional domain composition. Biophys. J. 2003, 84, 3257–3263. [Google Scholar] [CrossRef]
- Cristianini, N.; Shawe-Taylor, J. An Introduction to Support Vector Machines: And Other Kernel-Based Learning Methods; Cambridge University Press: Cambridge, UK, 2000; pp. 1–28. [Google Scholar]
- Chang, C.C.; Lin, C.J. LIBSVM: A Library for Support Vector Machines; ACM: New York, NY, USA, 2011; pp. 1–27. [Google Scholar]
- Chawla, N.V.; Bowyer, K.W.; Hall, L.O.; Kegelmeyer, W.P. SMOTE: Synthetic minority over-sampling technique. J. Artif. Intell. Res. 2002, 16, 321–357. [Google Scholar]
- Chou, K.C. Using subsite coupling to predict signal peptides. Protein Eng. 2001, 14, 75–79. [Google Scholar] [CrossRef] [PubMed] [Green Version]
- Chou, K.C. Some remarks on protein attribute prediction and pseudo amino acid composition. J. Theor. Biol. 2011, 273, 236–247. [Google Scholar] [CrossRef] [PubMed]
- Lai, H.Y.; Chen, X.X.; Chen, W.; Tang, H.; Lin, H. Sequence-based predictive modeling to identify cancerlectins. Oncotarget 2017, 8, 28169–28175. [Google Scholar] [CrossRef] [PubMed]
- Liu, B.; Yang, F.; Chou, K.-C. 2L-piRNA: A two-layer ensemble classifier for identifying PIWI-interacting RNAs and their function. Mol. Ther. Nucleic Acids 2017, 7, 267–277. [Google Scholar] [CrossRef] [PubMed]
- Chou, K.C.; Zhang, C.T. Review: Prediction of protein structral classes. Crit. Rev. Biochem. Mol. Biol. 1995, 30, 275–349. [Google Scholar] [CrossRef] [PubMed]
- Zhang, N.; Li, B.Q.; Gao, S.; Ruan, J.S.; Cai, Y.D. Computational prediction and analysis of protein γ-carboxylation sites based on a random forest method. Mol. Biosyst. 2012, 8, 2946–2955. [Google Scholar] [CrossRef] [PubMed]
- Deng, L.; Zhang, Q.C.; Chen, Z.; Meng, Y.; Guan, J.; Zhou, S. PredHS: A web server for predicting protein–protein interaction hot spots by using structural neighborhood properties. Nucleic Acids Res. 2014, 42, W290–W295. [Google Scholar] [CrossRef] [PubMed]
- Pan, Y.; Wang, Z.; Zhan, W.; Deng, L. Computational identification of binding energy hot spots in protein-RNA complexes using an ensemble approach. Bioinformatics 2017, 34, 1473–1480. [Google Scholar] [CrossRef] [PubMed]
- Tang, Y.; Liu, D.; Wang, Z.; Wen, T.; Deng, L. A boosting approach for prediction of protein-RNA binding residues. BMC Bioinform. 2017, 18, 465. [Google Scholar] [CrossRef] [PubMed] [Green Version]
- Ning, Z.; Meng, W.; Zhang, P.; Tao, H. Classification of cancers based on copy number variation landscapes. Biochim. Biophys. Acta 2016, 1860, 2750–2755. [Google Scholar]
- Tang, W.; Wan, S.; Yang, Z.; Teschendorff, A.E.; Zou, Q. Tumor Origin Detection with Tissue-Specific miRNA and DNA methylation Markers. Bioinformatics 2017, 34, 398–406. [Google Scholar] [CrossRef] [PubMed]
- Chen, W.; Tang, H.; Lin, H. MethyRNA: A web-server for identification of N6-methyladenosine sites. J. Biomol. Struct. Dyn. 2017, 35, 683–687. [Google Scholar] [CrossRef] [PubMed]
- Chen, W.; Tang, H.; Ye, J.; Lin, H.; Chou, K.C. iRNA-PseU: Identifying RNA pseudouridine sites. Mol. Ther. Nucleic Acids 2016, 5, e332. [Google Scholar] [CrossRef] [PubMed]
- Chen, W.; Yang, H.; Feng, P.; Ding, H.; Lin, H. iDNA4mC: Identifying DNA N4-methylcytosine sites based on nucleotide chemical properties. Bioinformatics 2017, 33, 3518–3523. [Google Scholar] [CrossRef] [PubMed]
- Feng, P.; Ding, H.; Yang, H.; Chen, W.; Lin, H.; Chou, K.C. iRNA-PseColl: Identifying the occurrence sites of different RNA modifications by incorporating collective effects of nucleotides into PseKNC. Mol. Ther. Nucleic Acids 2017, 7, 155–163. [Google Scholar] [CrossRef] [PubMed]
Figure 1.
Comparison of our features with g-gap using different classifiers on Sn.
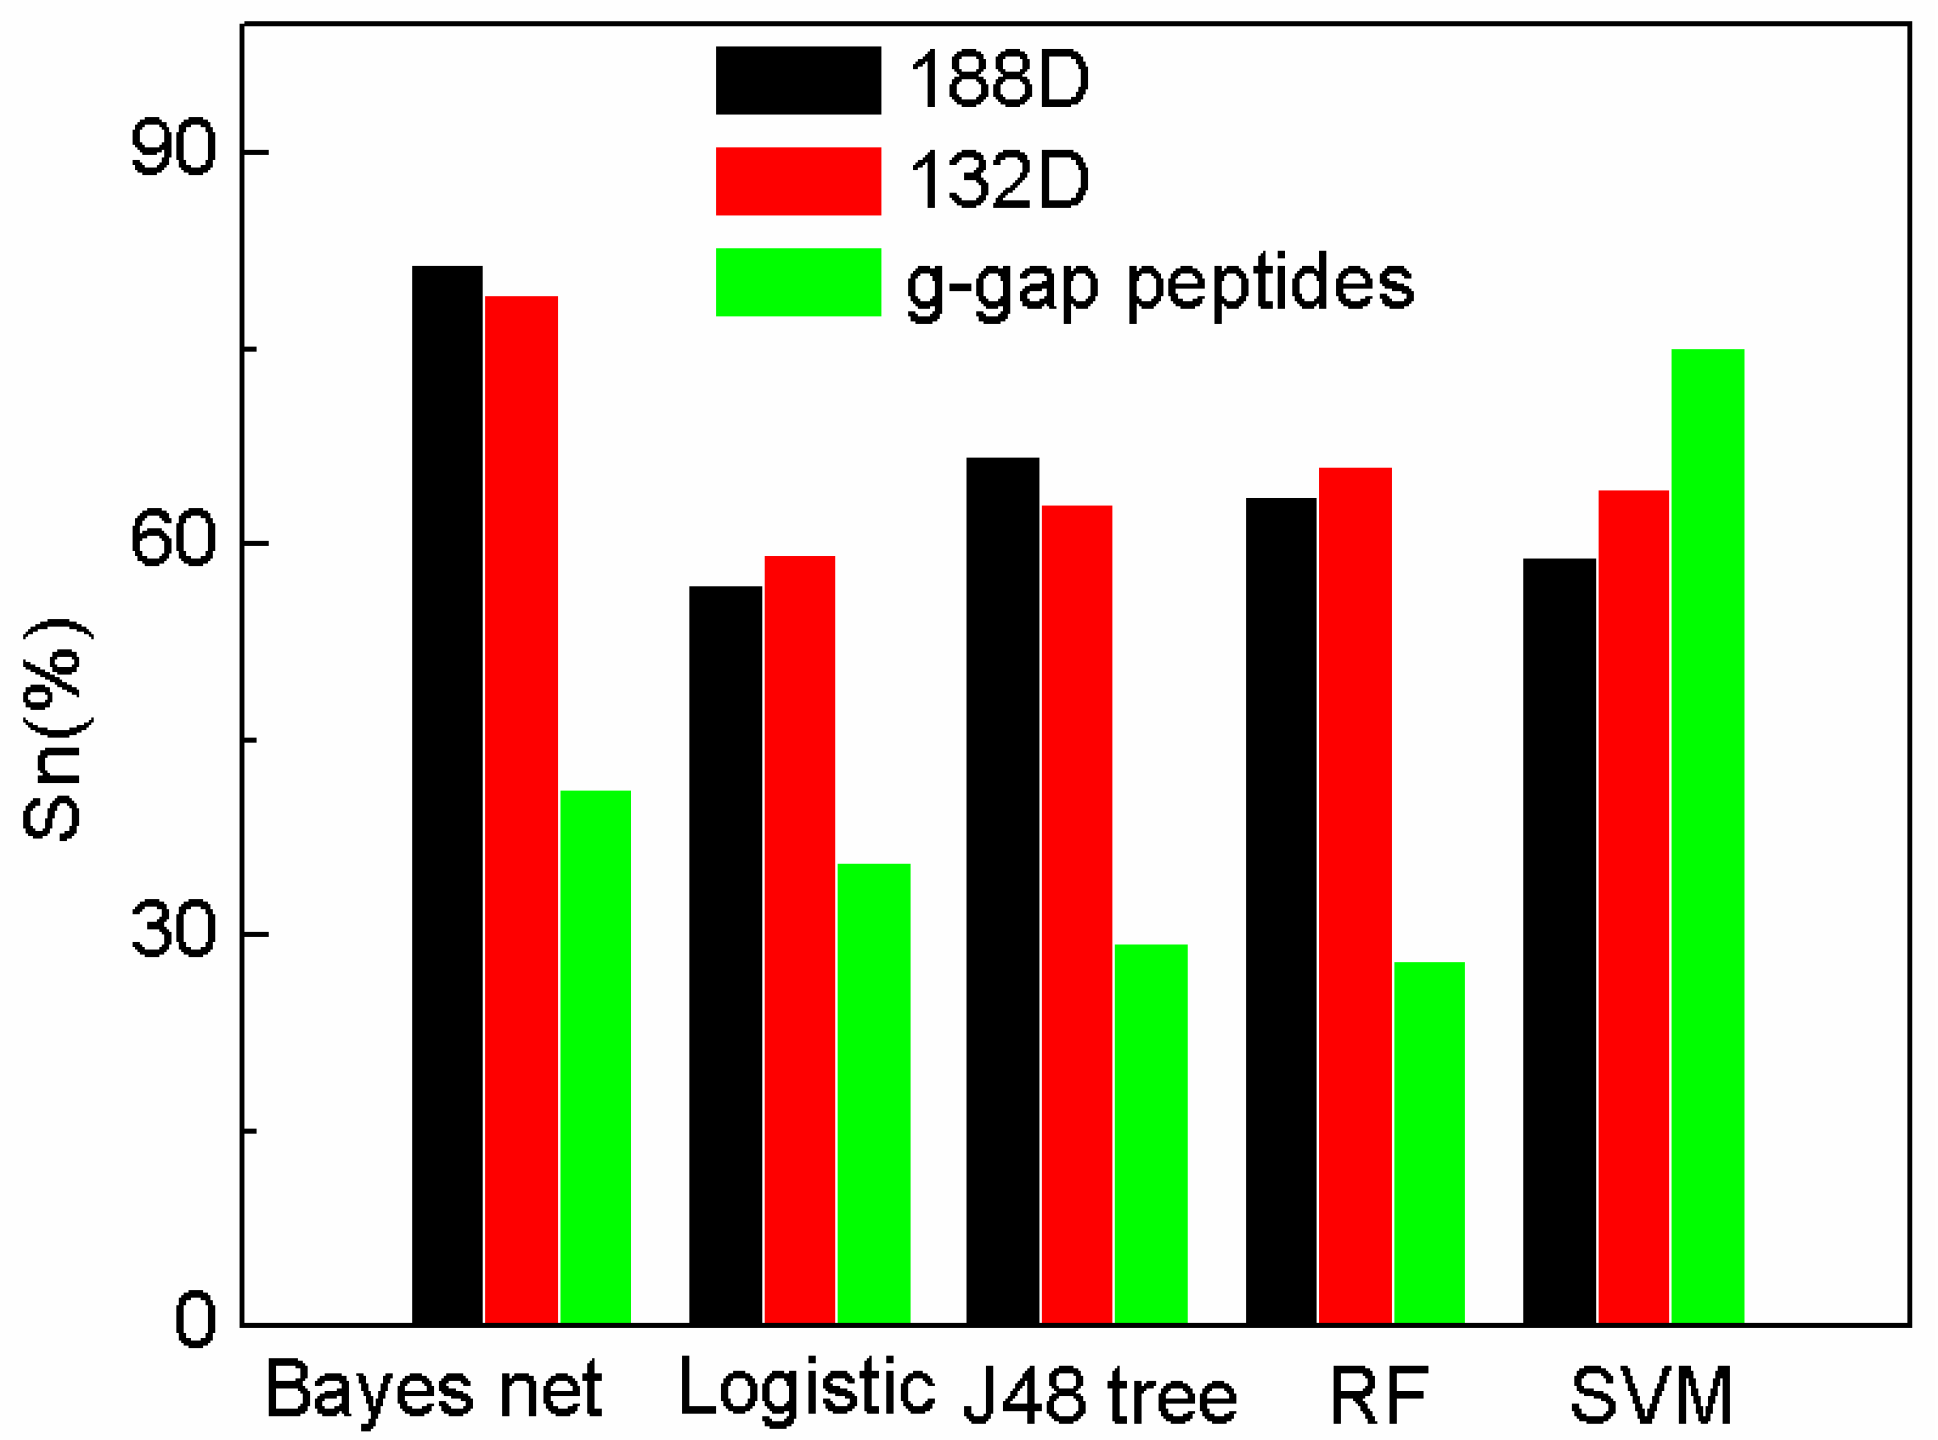
Figure 2.
Comparison of our features with g-gap using different classifiers on Sp.
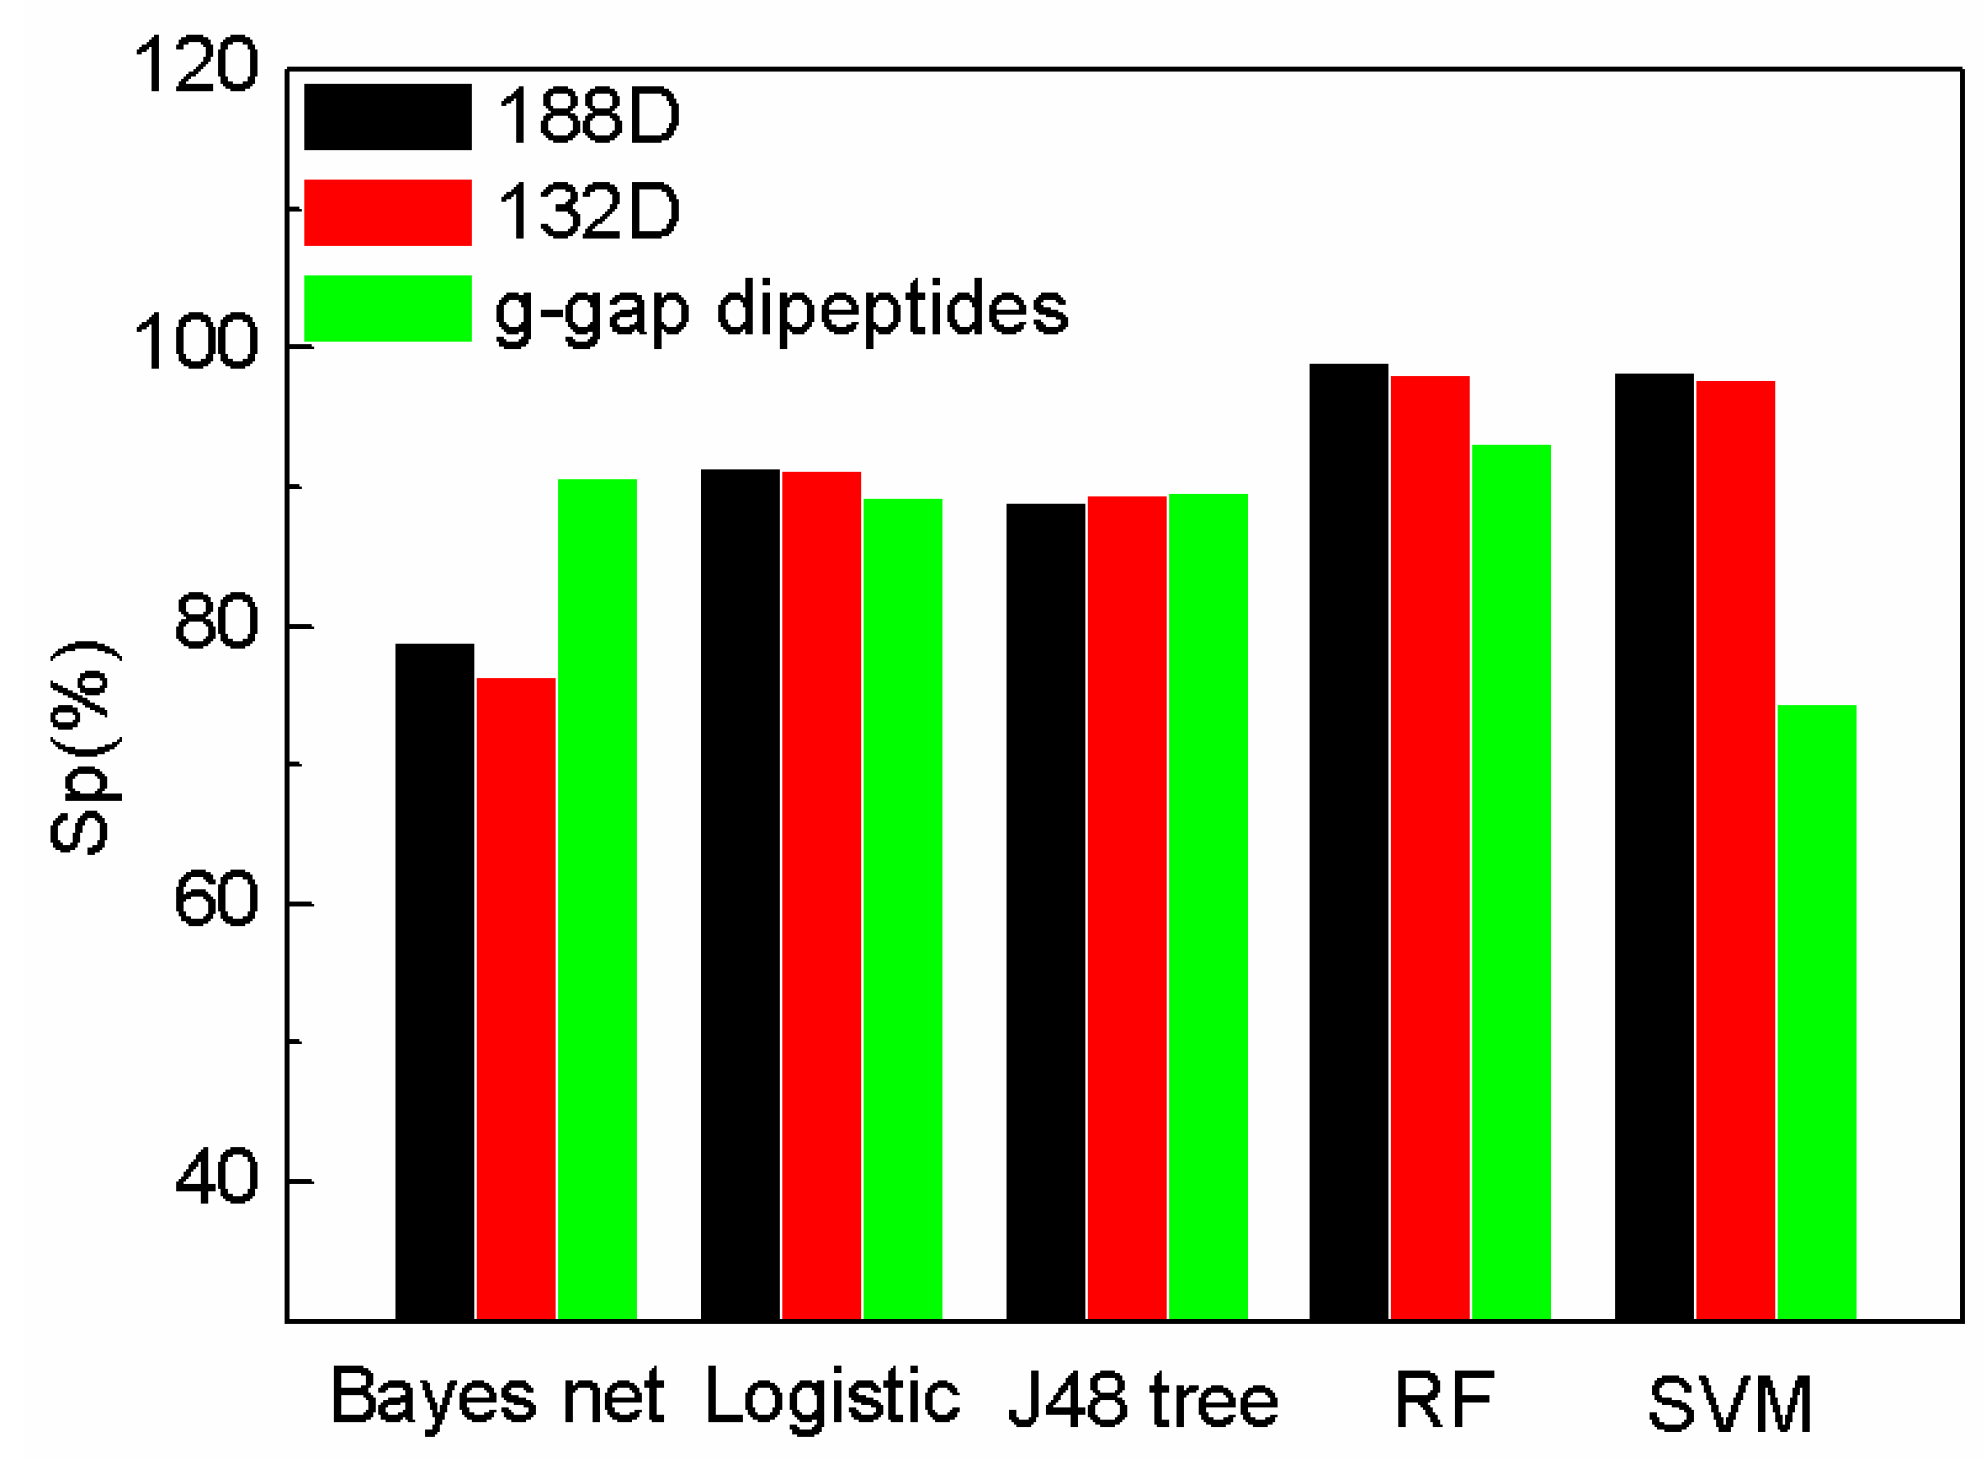
Figure 3.
Comparison of our features with g-gap using different classifiers on Acc.

Figure 4.
Eight physicochemical property attributes.

Table 1.
The comparison of accuracy with existing methods.
| Performance Evaluation | SeqSVM (132D) | AodPred | Nave Bayes |
|---|---|---|---|
| Accuracy | 89.46% | 74.49% | 66.88% |
Table 2.
The comparison of accuracy on SeqSVM methods.
| Performance Evaluation | SeqSVM (Non-SMOTE) | SeqSVM (SMOTE) | SeqSVM (SMOTE + MRMD) |
|---|---|---|---|
| Accuracy | 85.98% | 88.68% | 89.46% |
© 2018 by the authors. Licensee MDPI, Basel, Switzerland. This article is an open access article distributed under the terms and conditions of the Creative Commons Attribution (CC BY) license (http://creativecommons.org/licenses/by/4.0/).
Share and Cite
MDPI and ACS Style
Xu, L.; Liang, G.; Shi, S.; Liao, C. SeqSVM: A Sequence-Based Support Vector Machine Method for Identifying Antioxidant Proteins. Int. J. Mol. Sci. 2018, 19, 1773. https://doi.org/10.3390/ijms19061773
AMA Style
Xu L, Liang G, Shi S, Liao C. SeqSVM: A Sequence-Based Support Vector Machine Method for Identifying Antioxidant Proteins. International Journal of Molecular Sciences. 2018; 19(6):1773. https://doi.org/10.3390/ijms19061773
Chicago/Turabian StyleXu, Lei, Guangmin Liang, Shuhua Shi, and Changrui Liao. 2018. "SeqSVM: A Sequence-Based Support Vector Machine Method for Identifying Antioxidant Proteins" International Journal of Molecular Sciences 19, no. 6: 1773. https://doi.org/10.3390/ijms19061773
Note that from the first issue of 2016, this journal uses article numbers instead of page numbers. See further details here.