Non-Metastatic Cutaneous Melanoma Induces Chronodisruption in Central and Peripheral Circadian Clocks

 ,
,  ,
,
Abstract
:1. Introduction
2. Results and Discussion
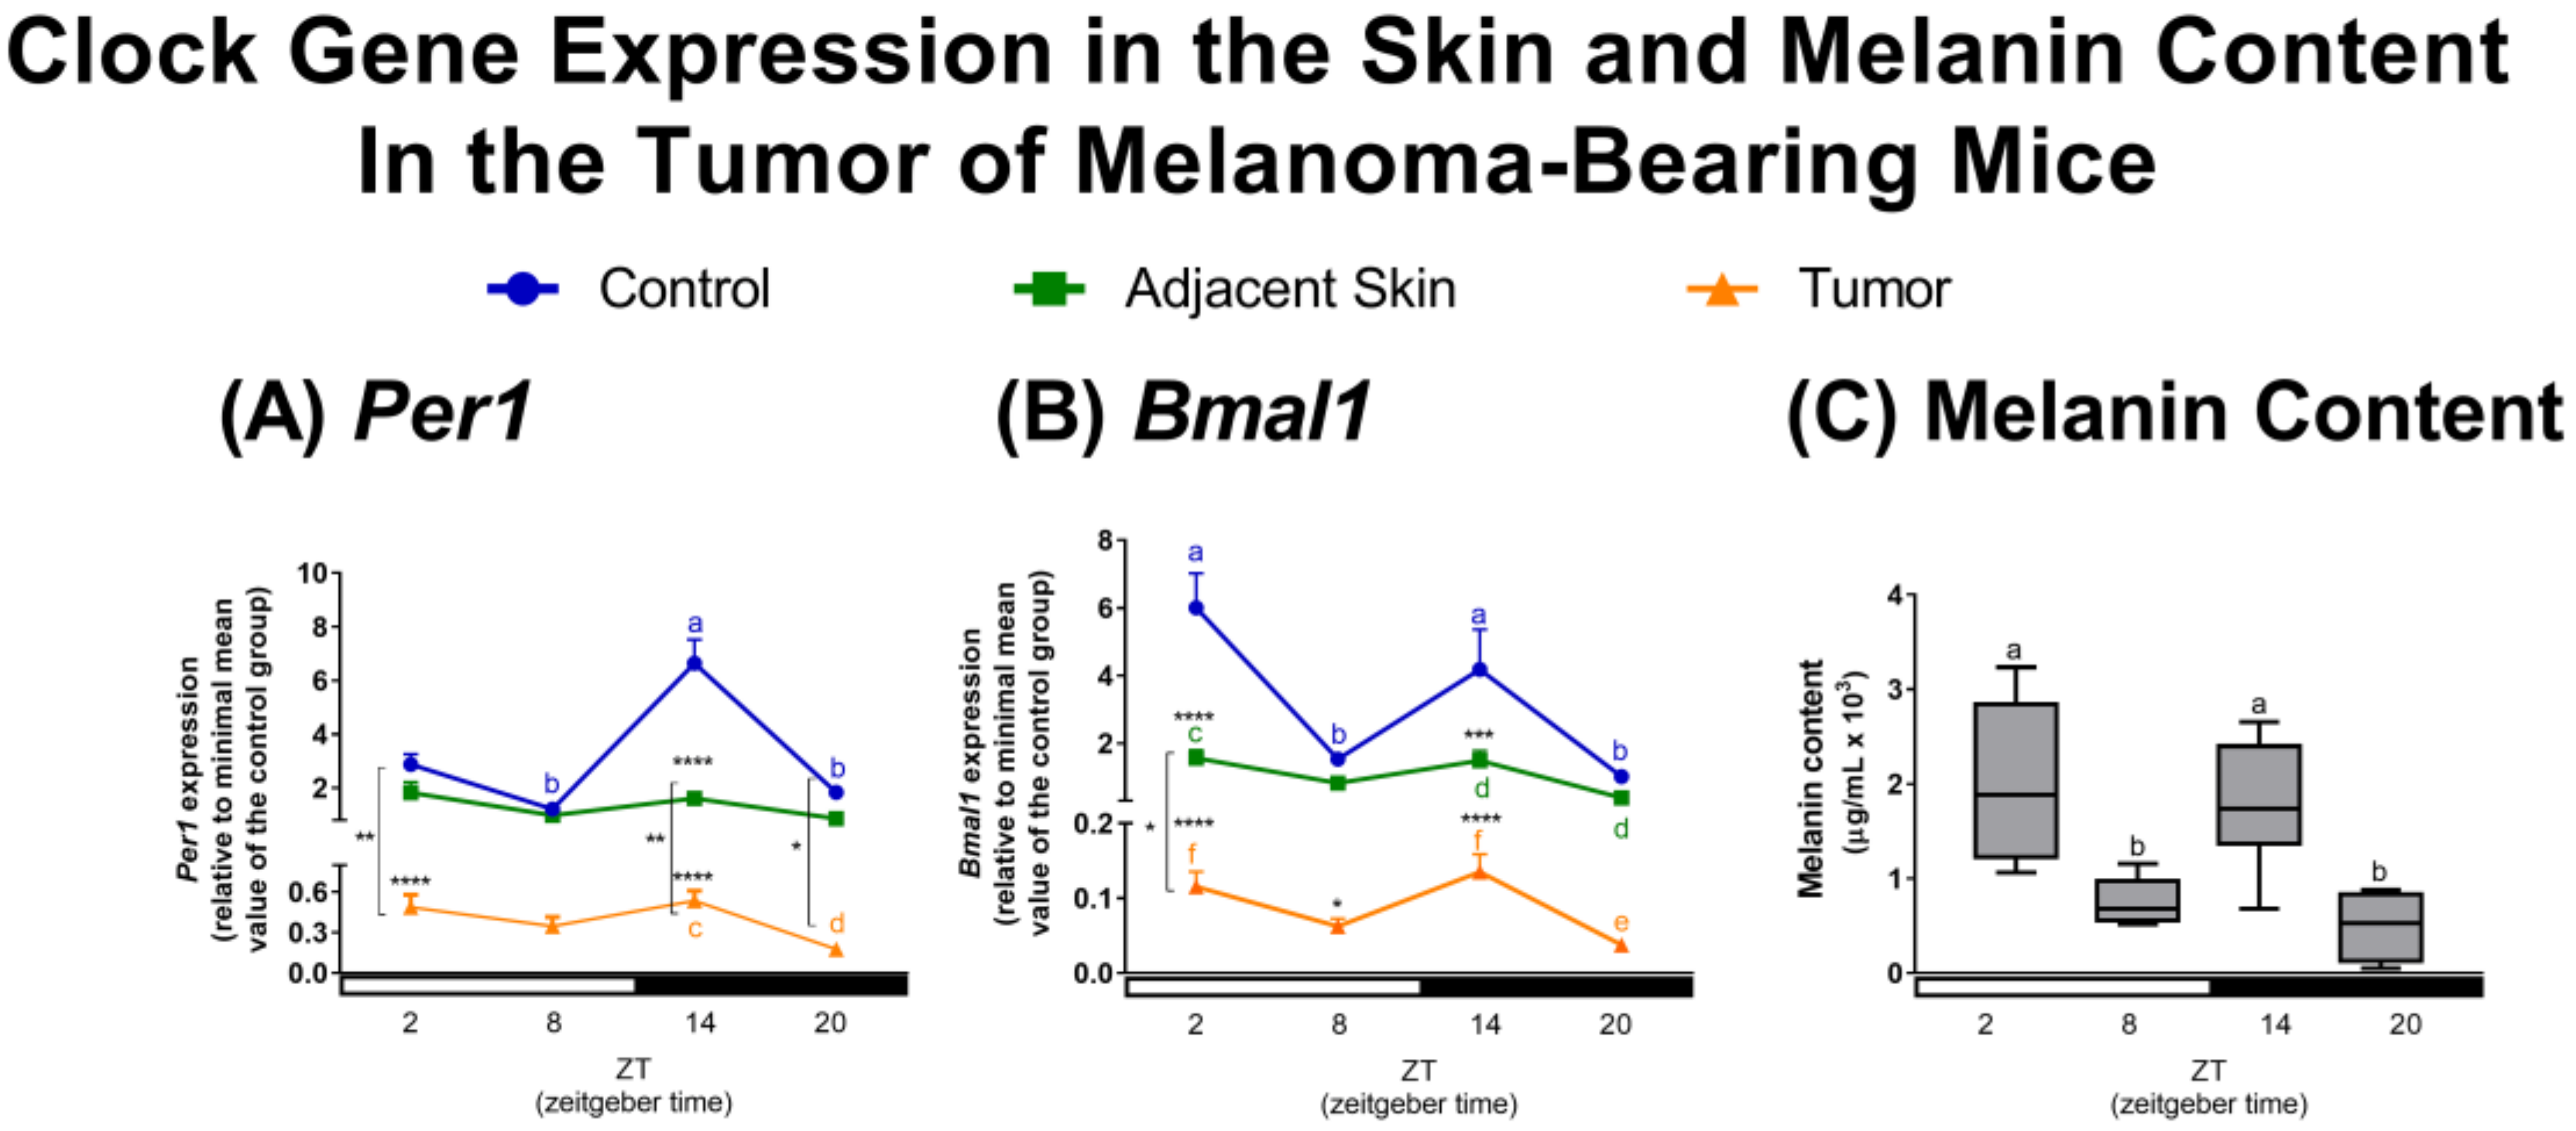
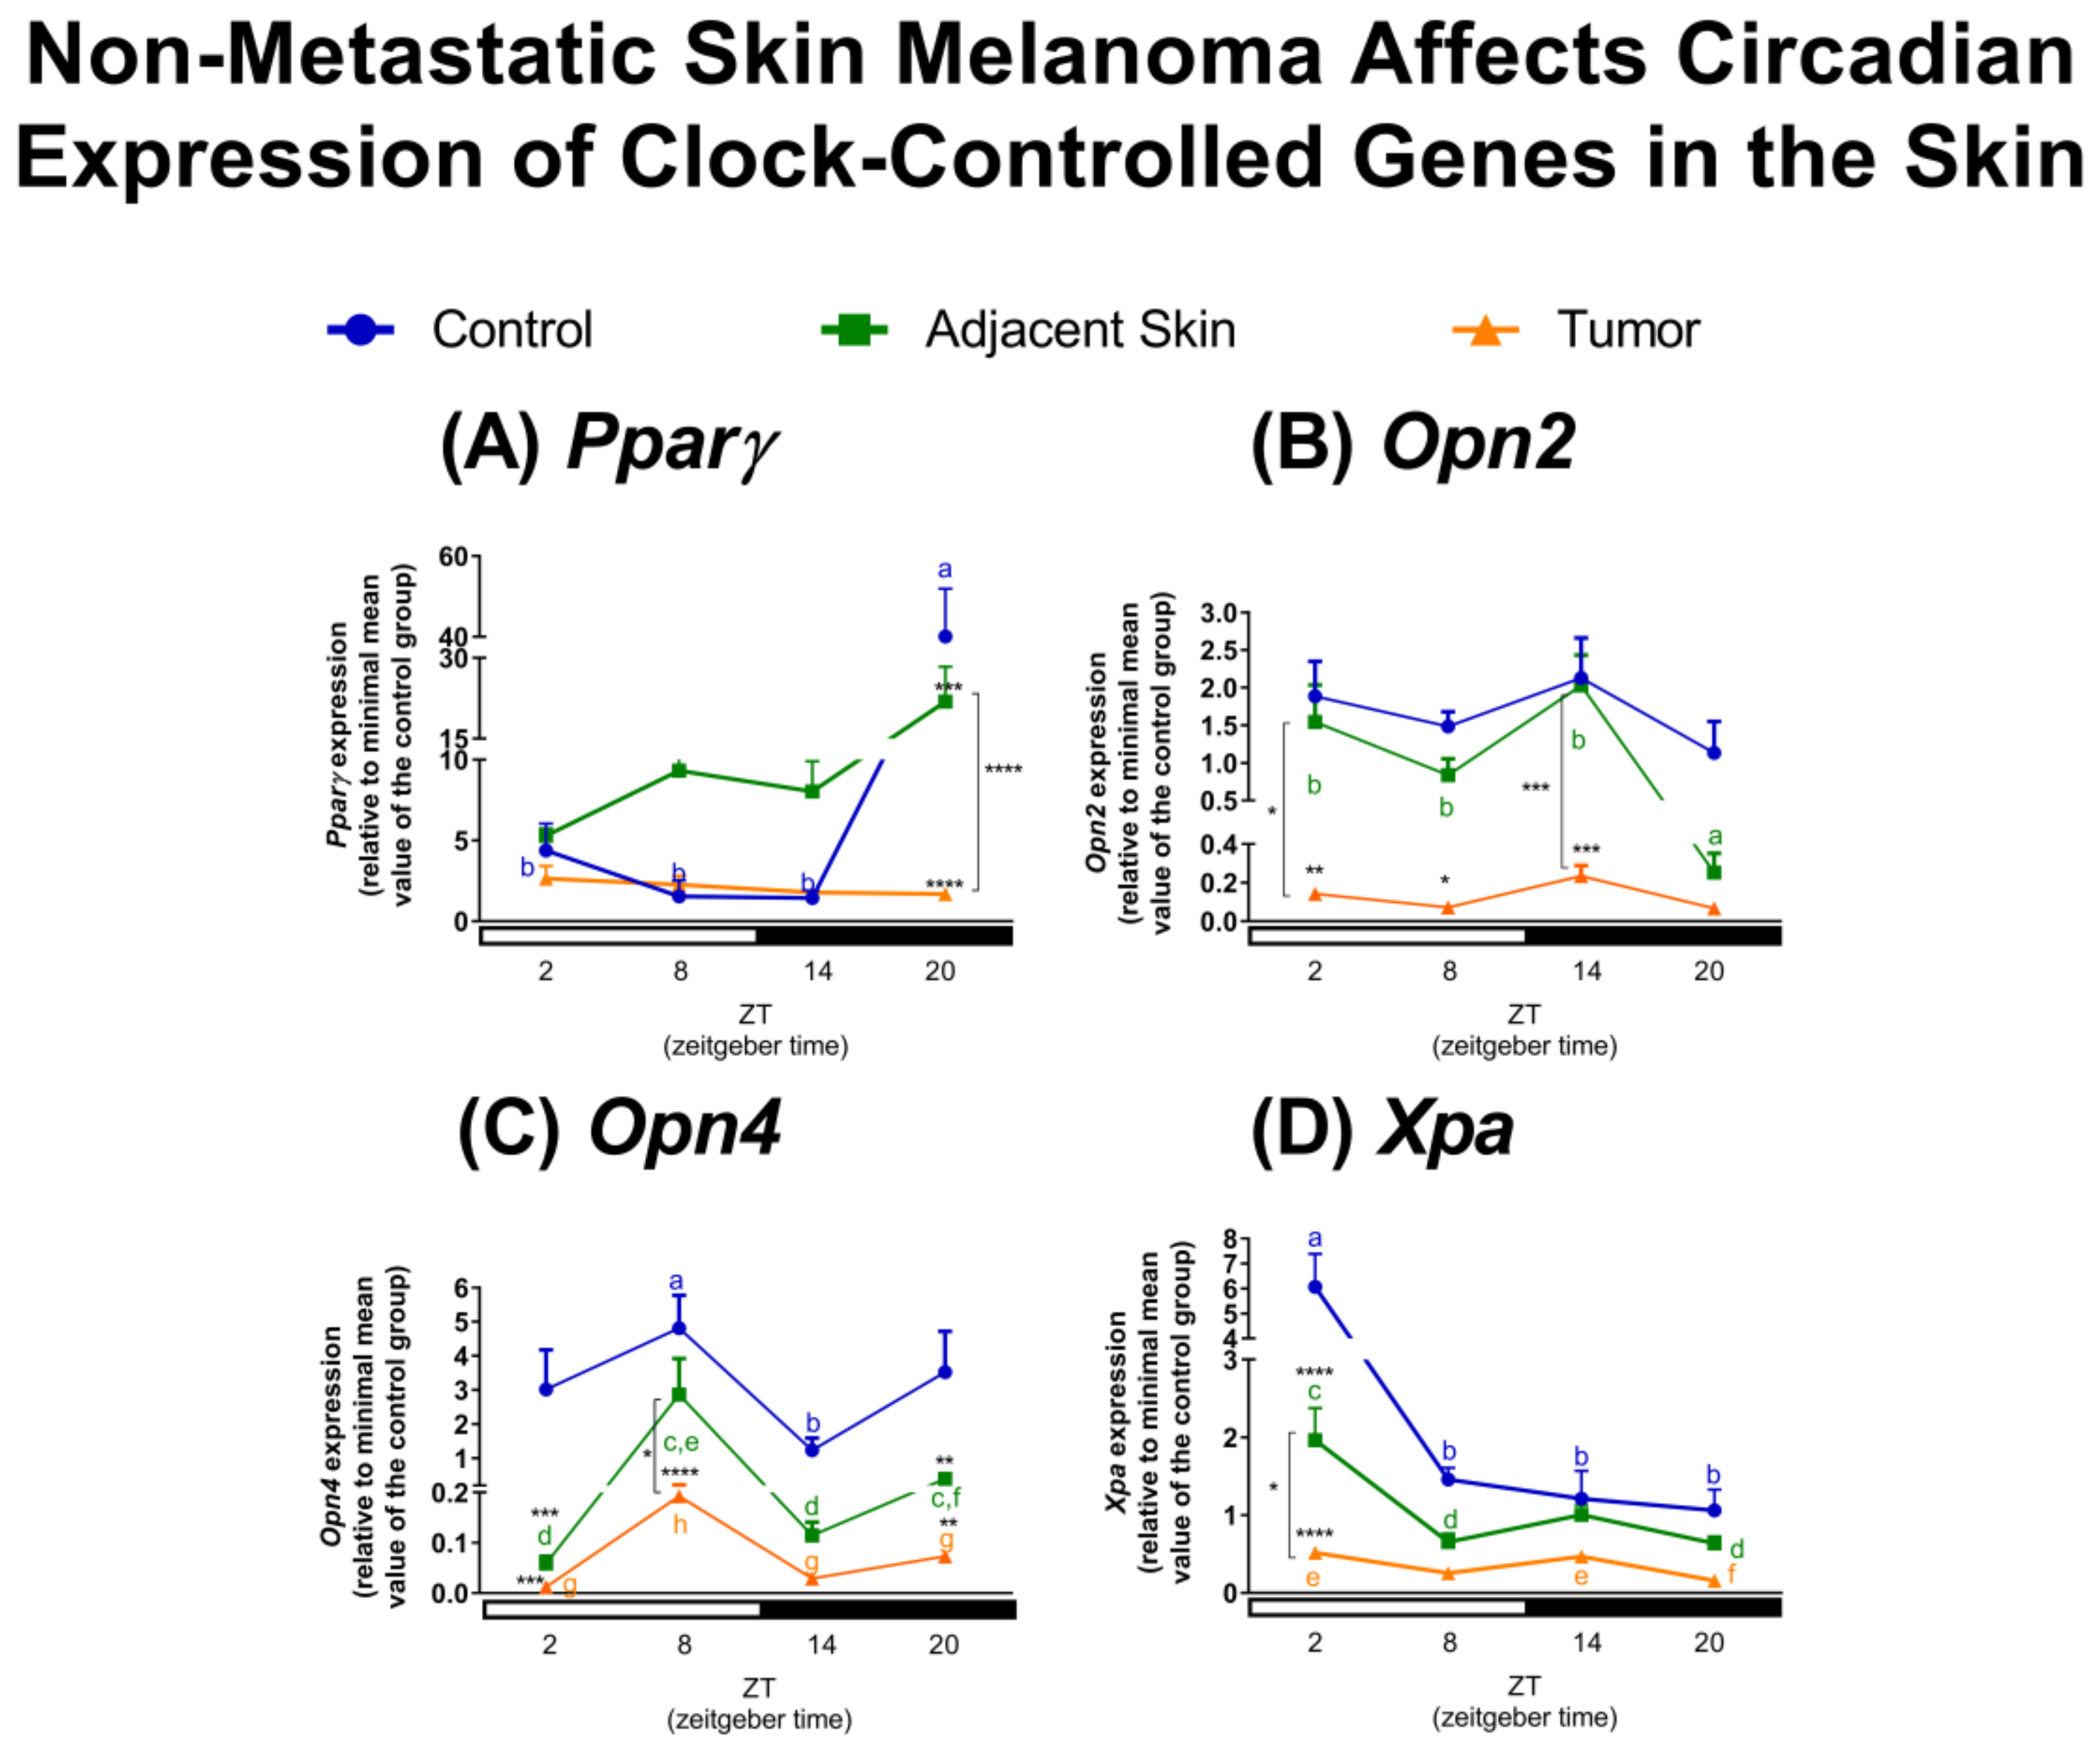
2.1. Effects of Tumor Microenvironment (TME) on Clock and Clock-Controlled Genes of Tumor-Adjacent Skin and Melanoma
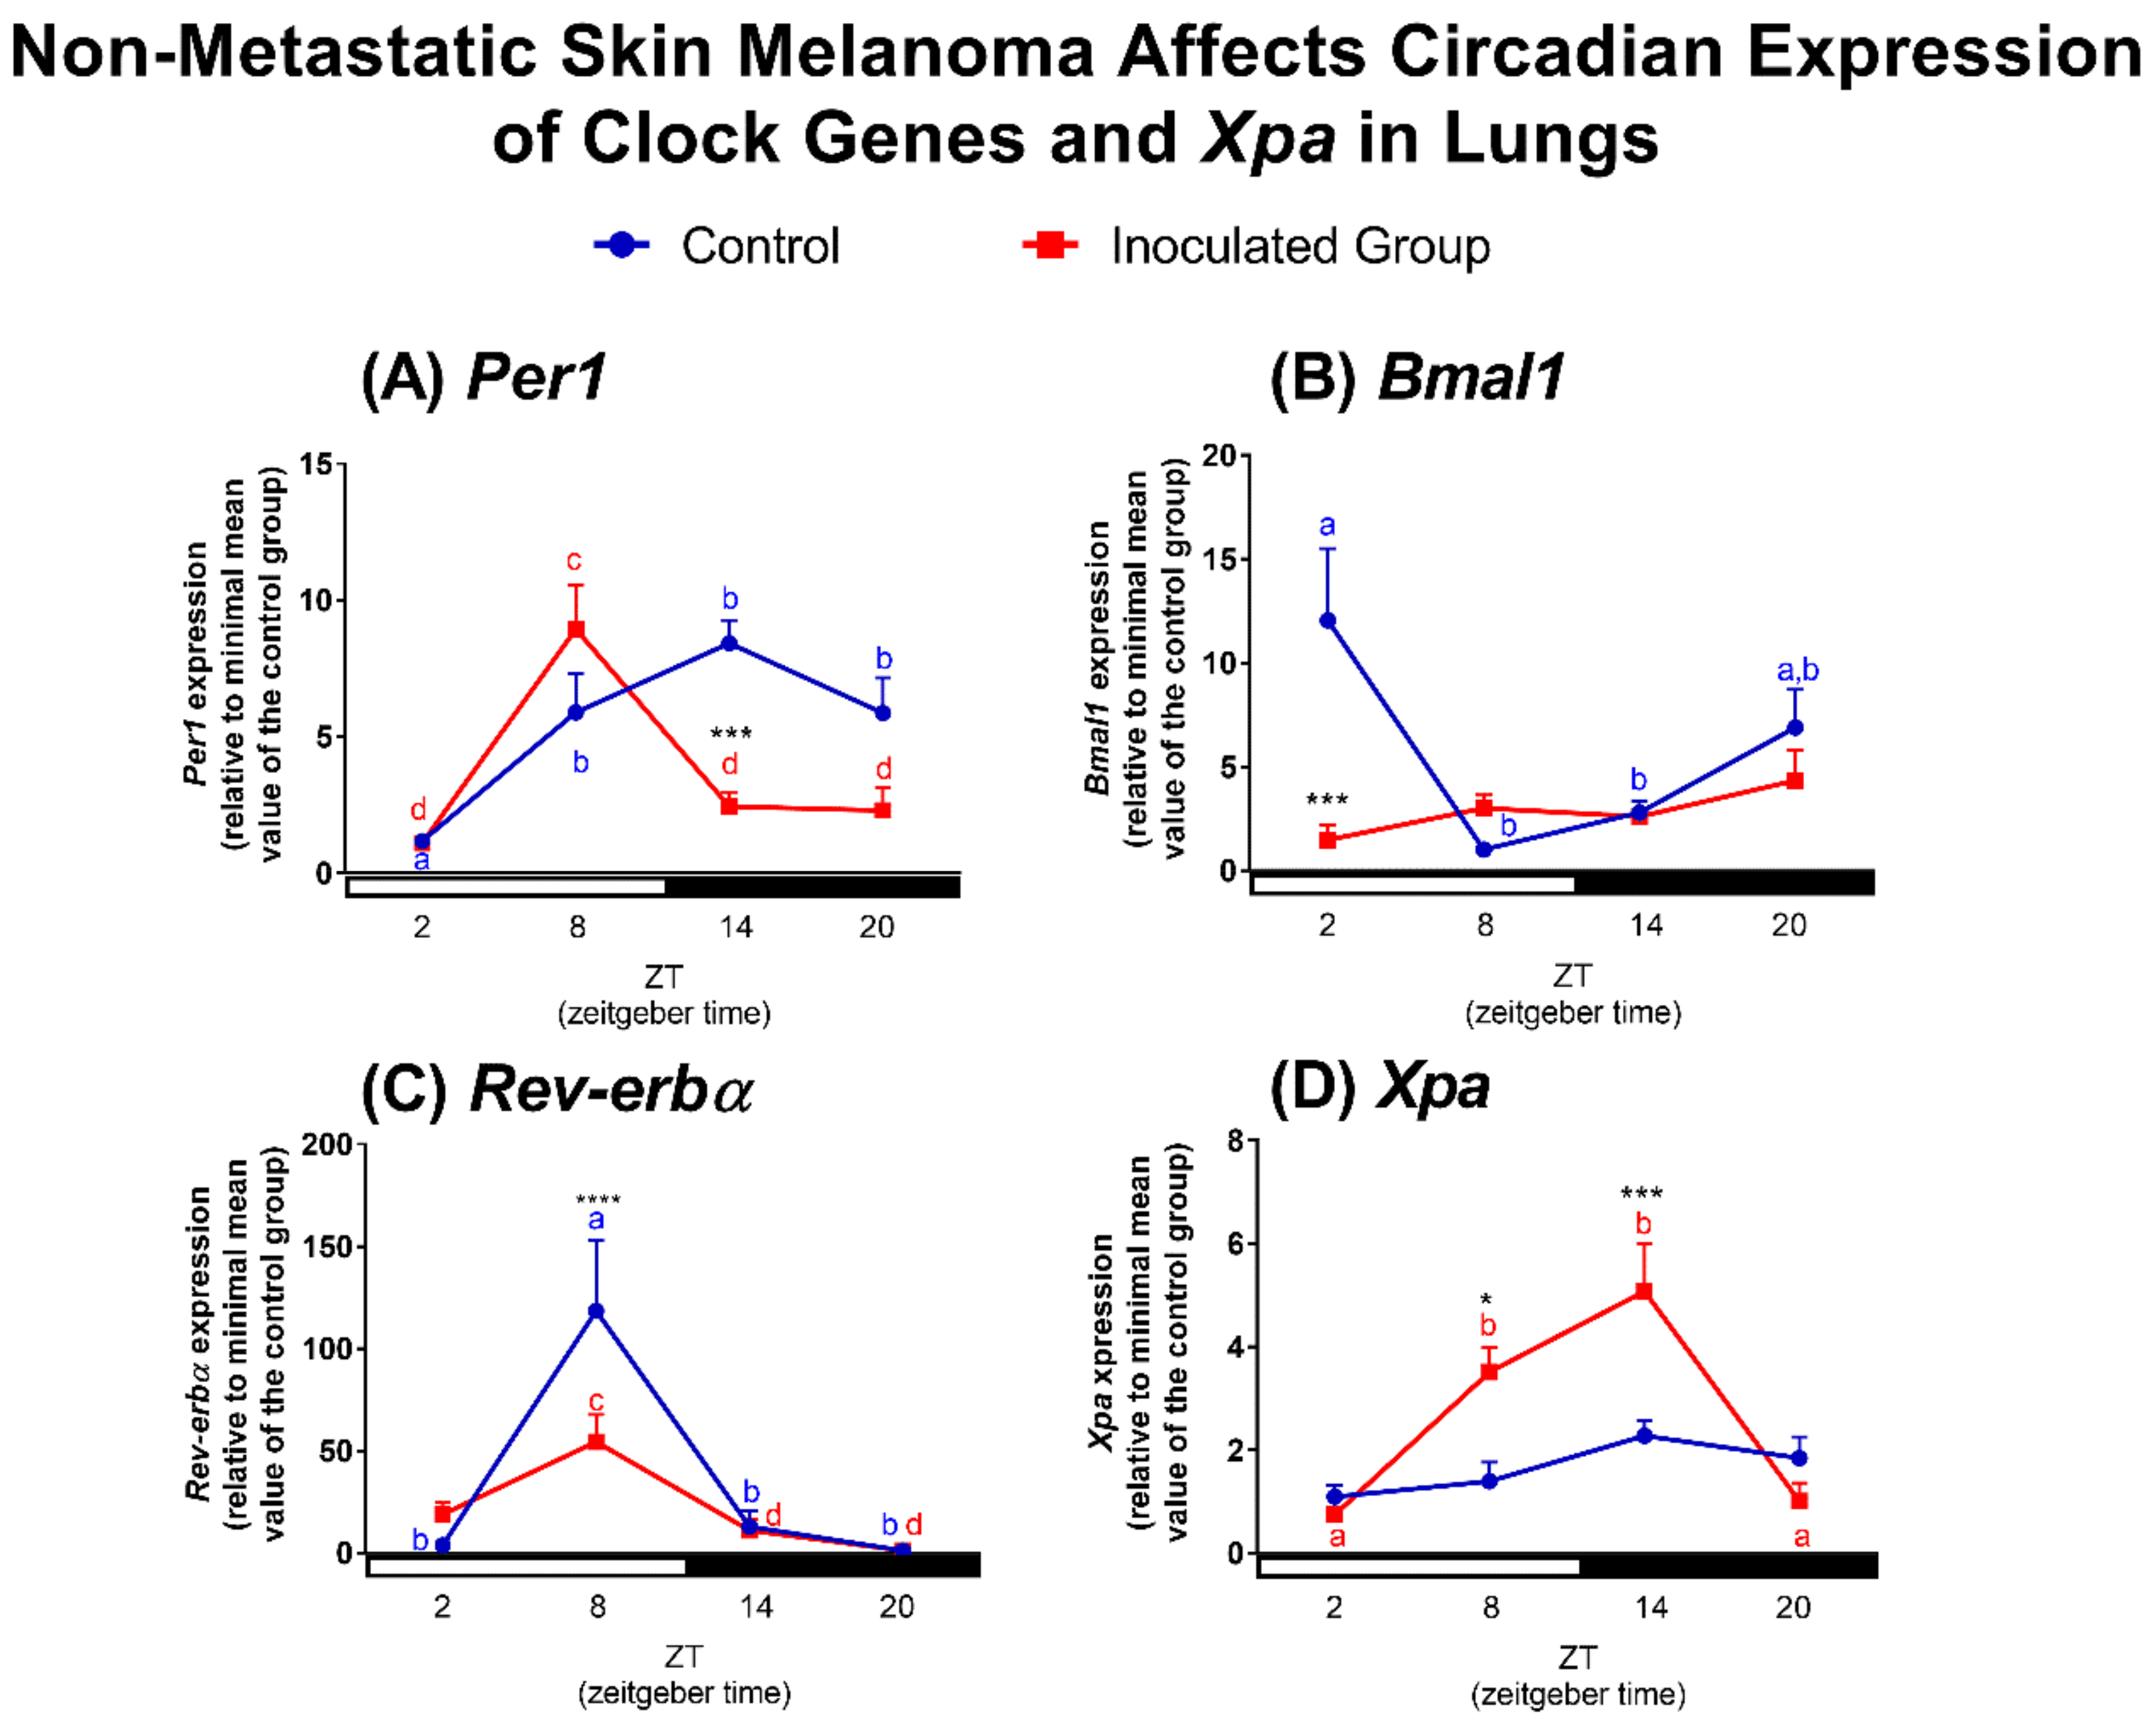
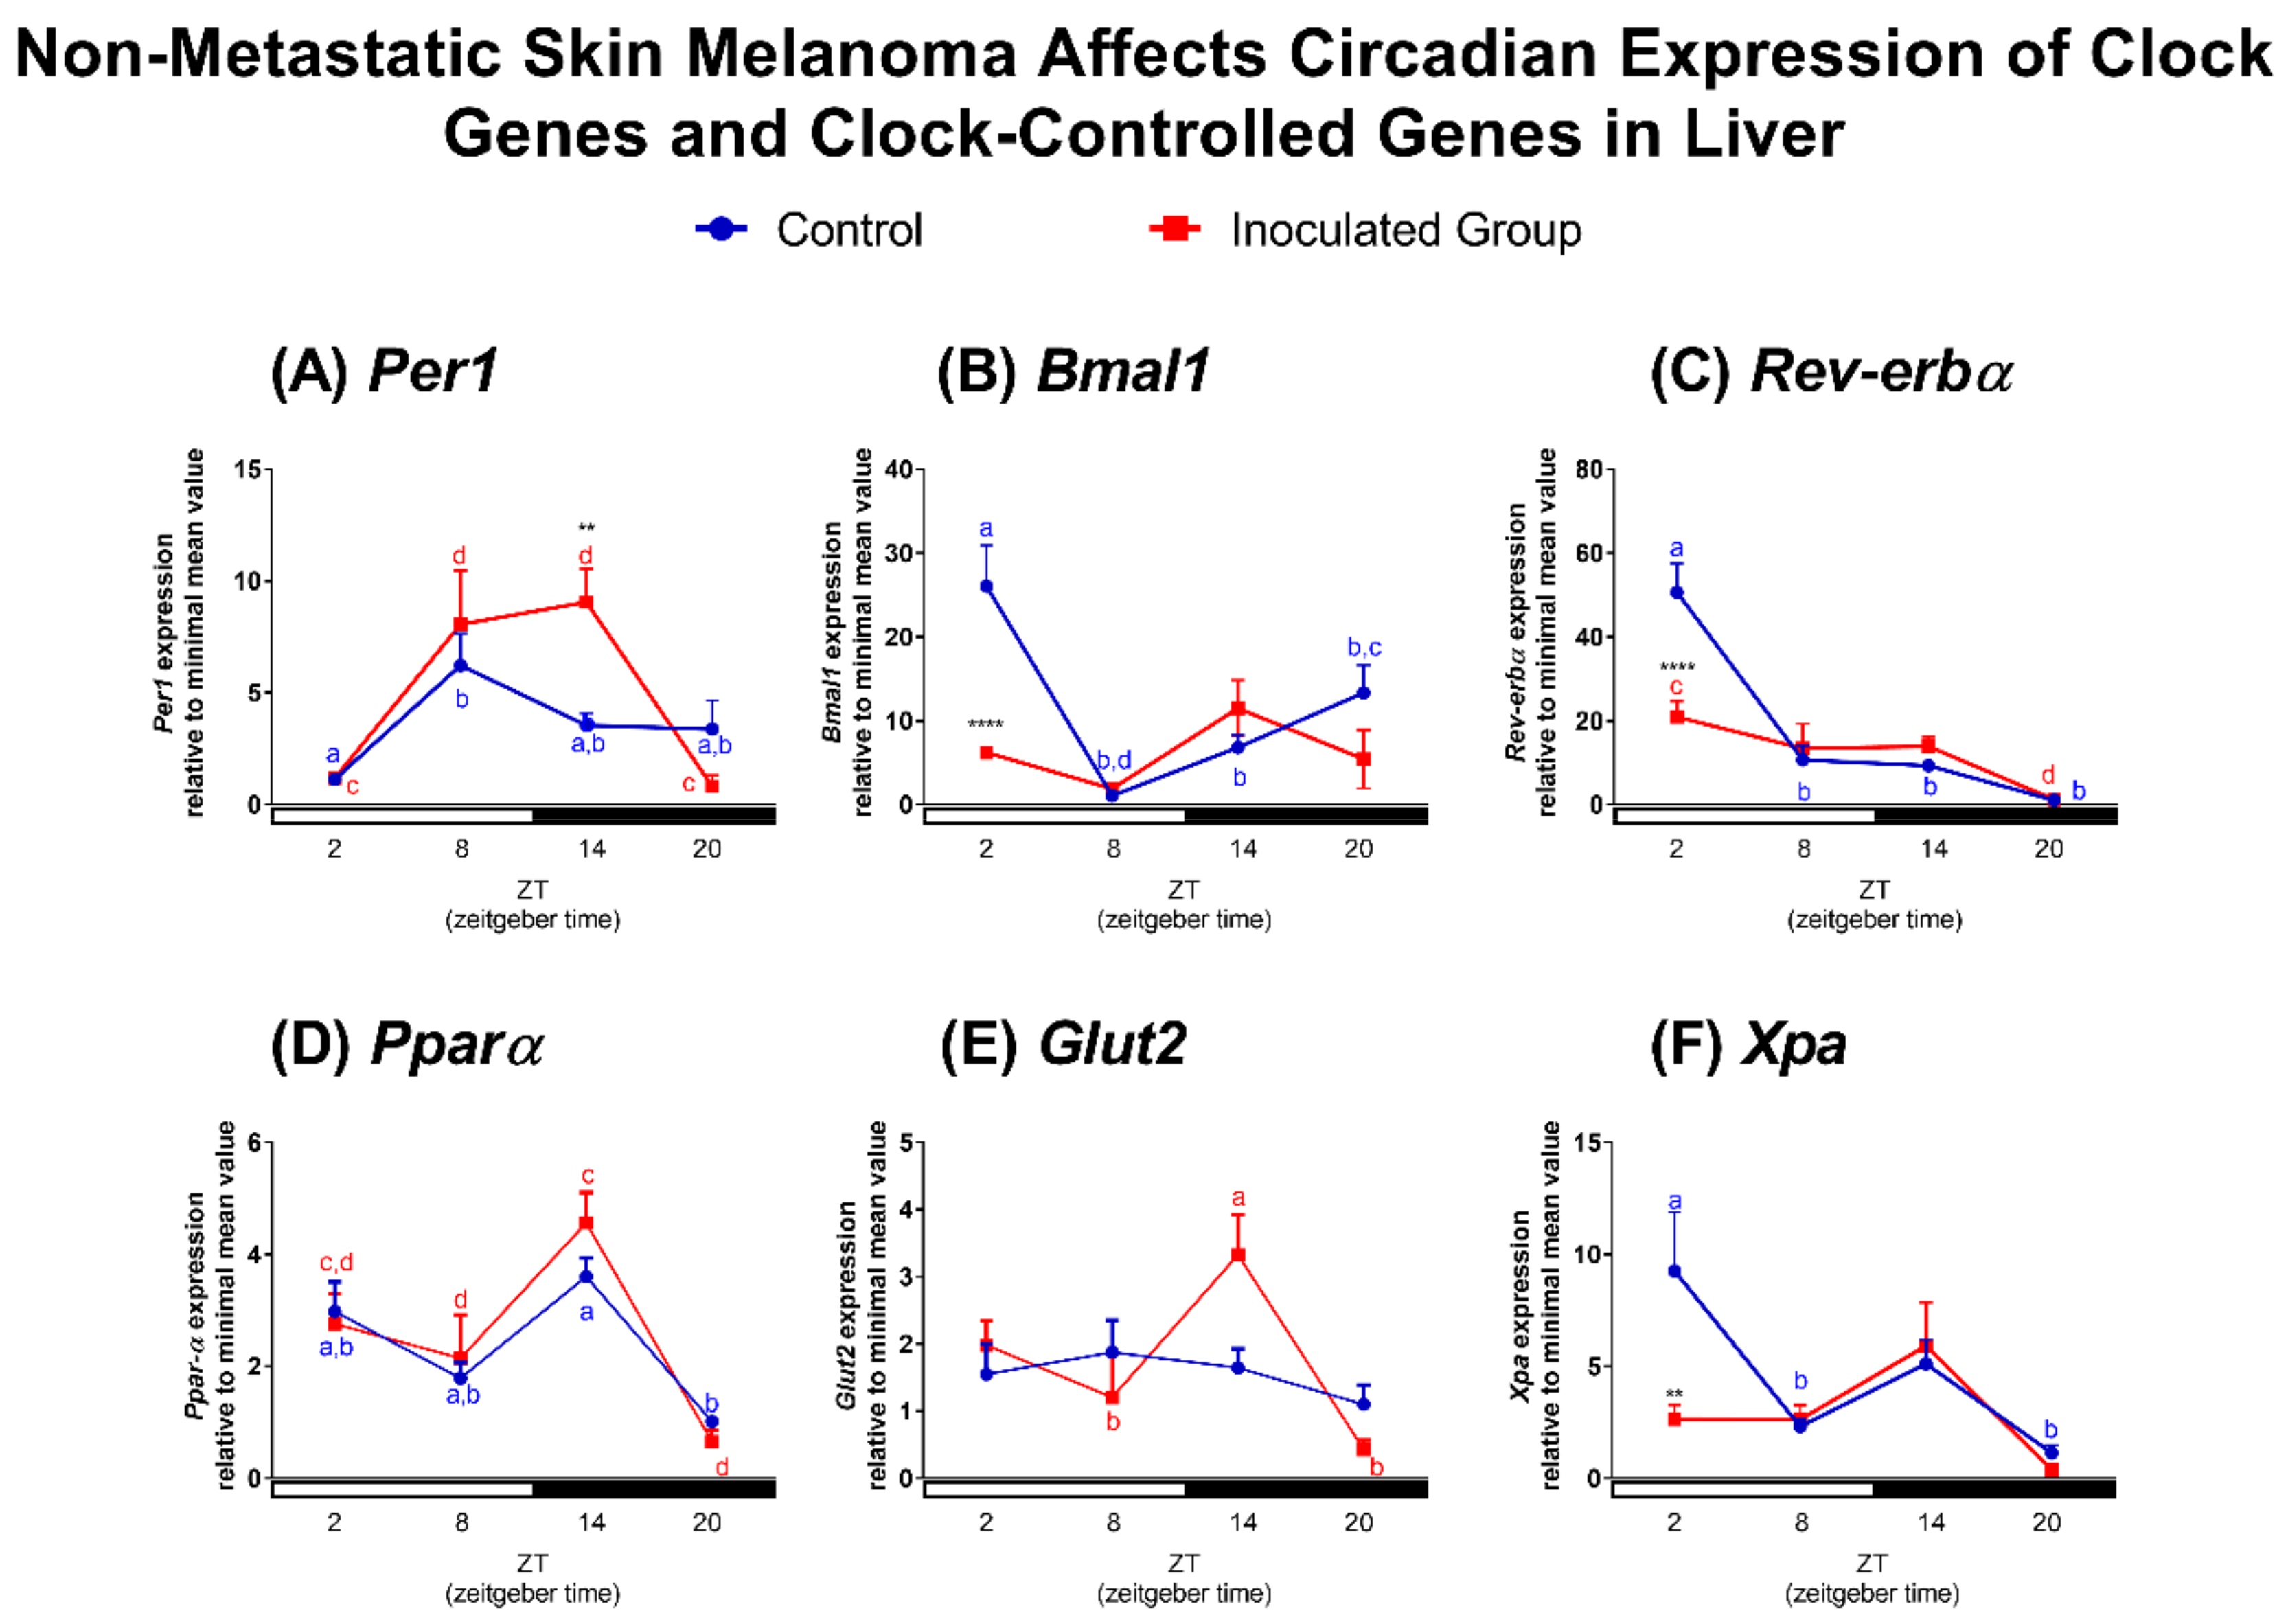
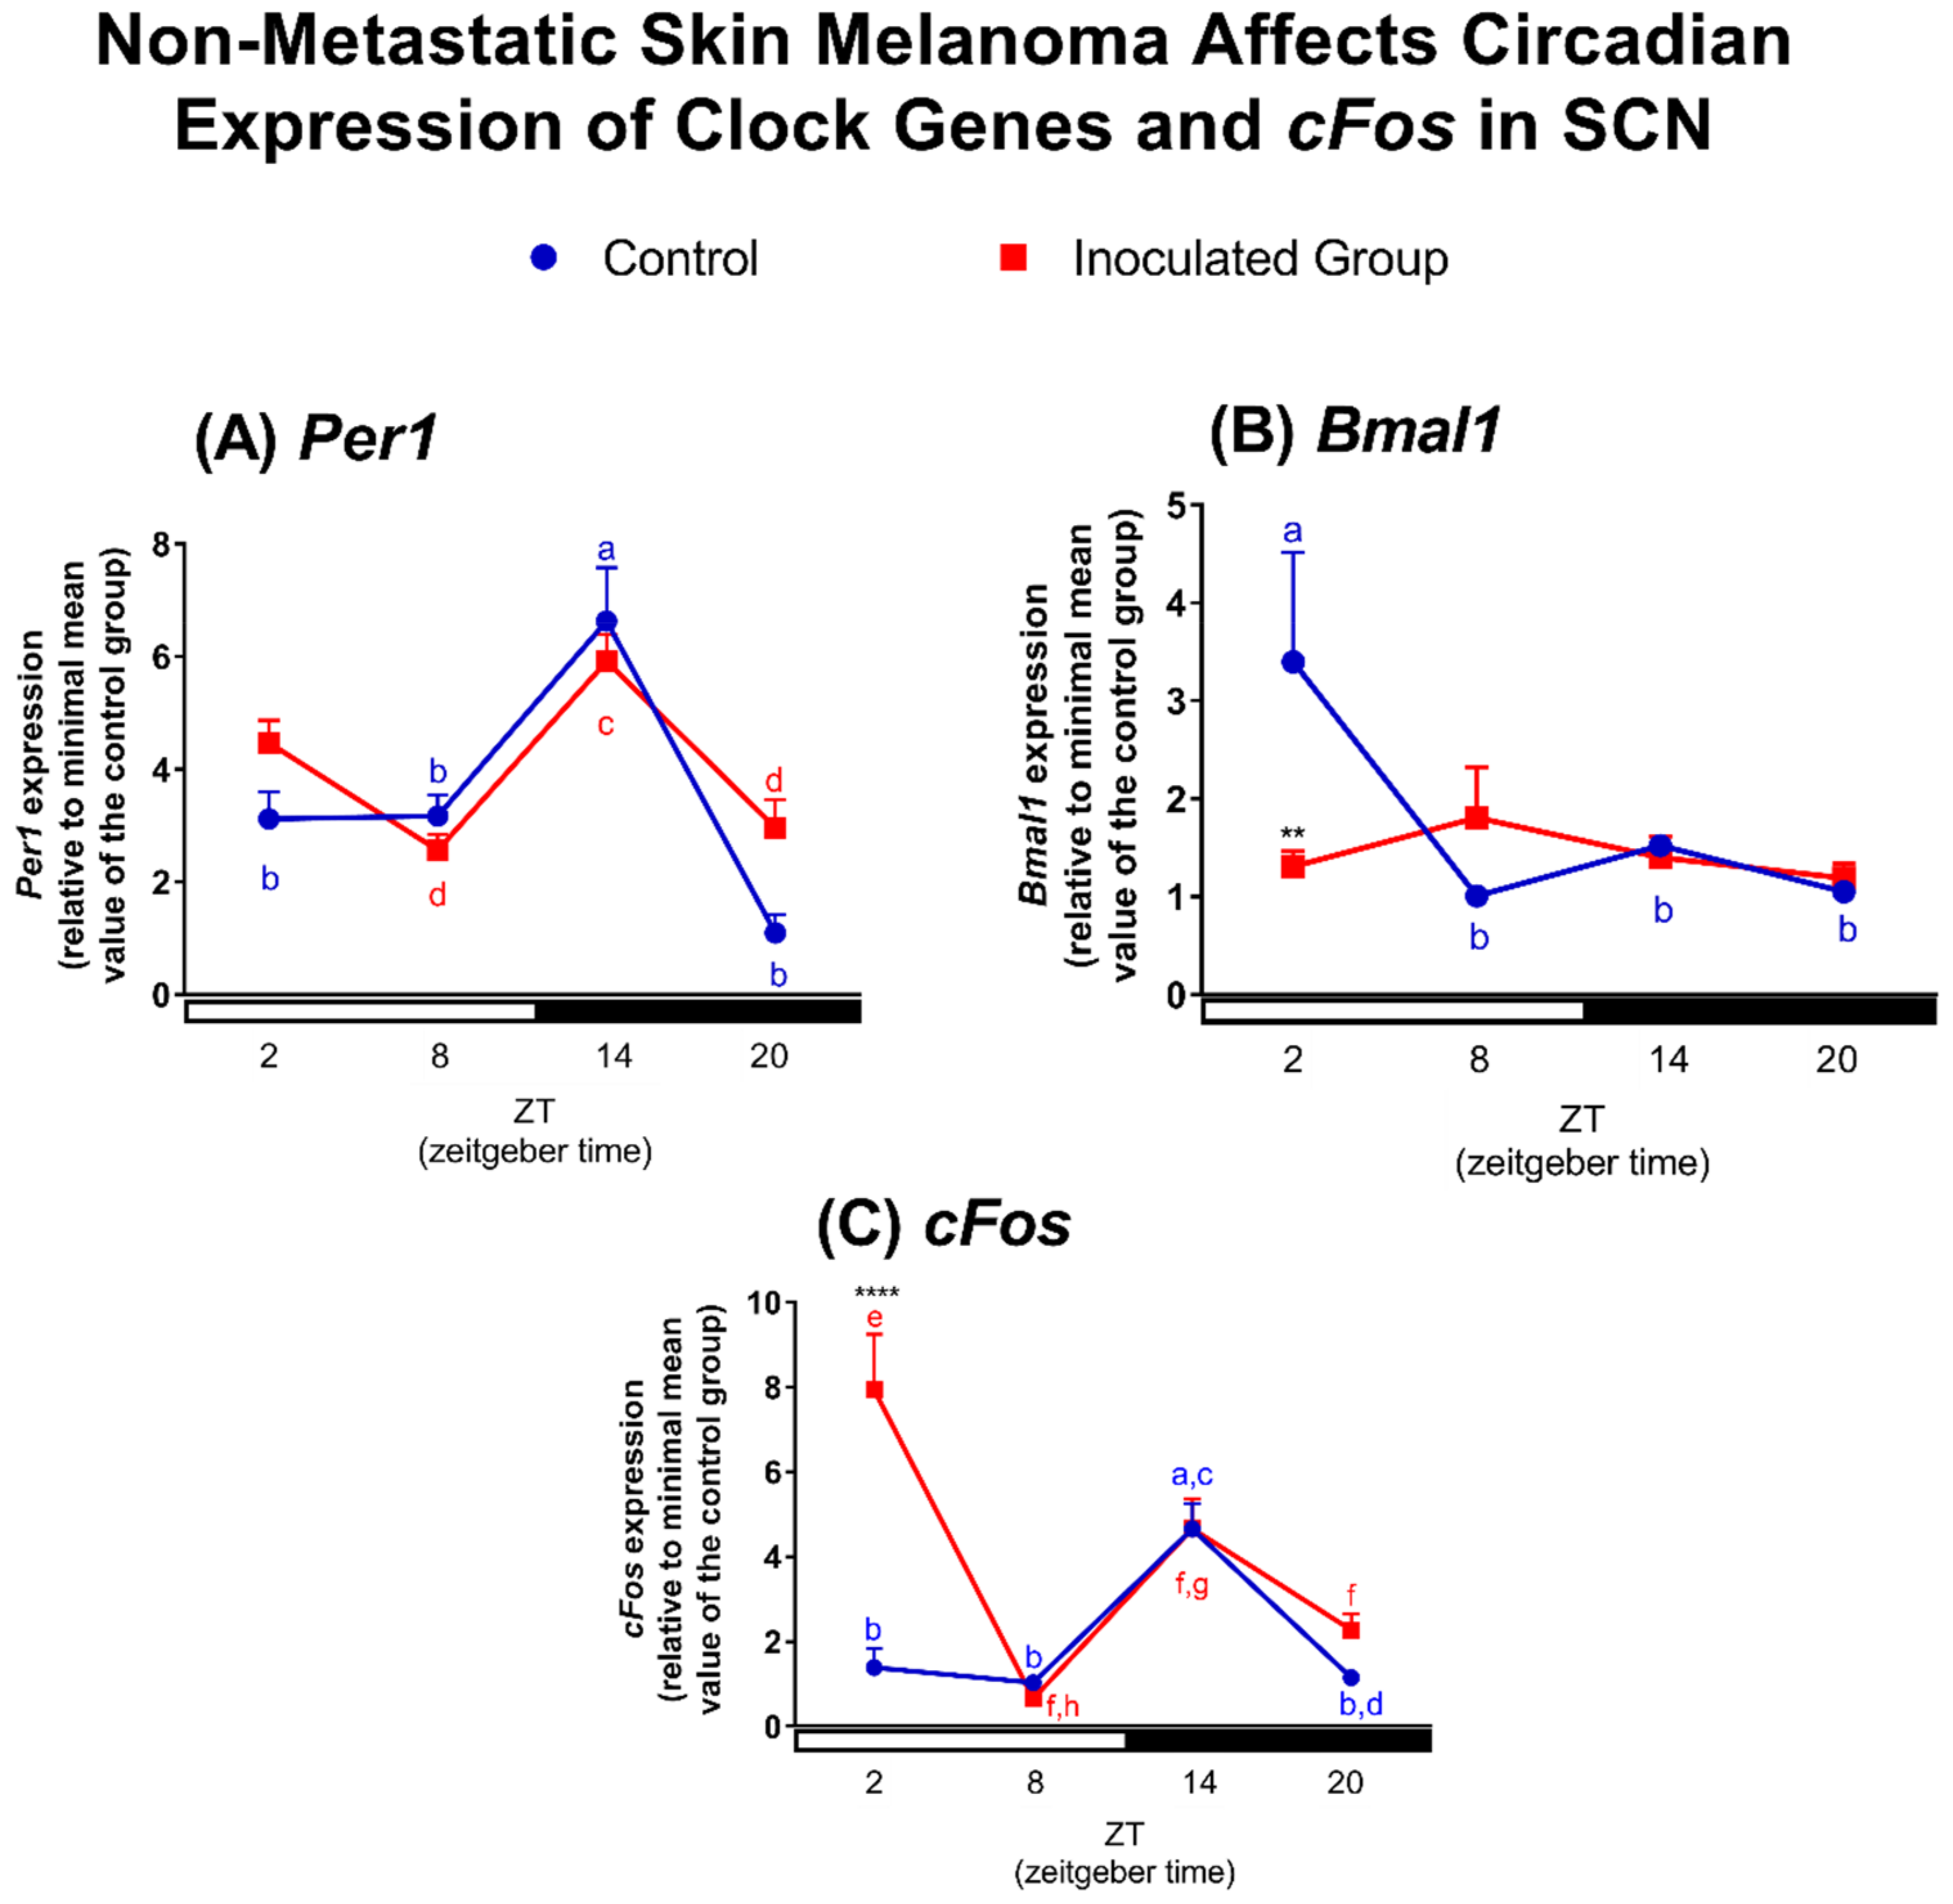
2.2. Effects of Tumor Macroenvironment (TMaE) on Clock and Clock-Controlled Genes of Lung, Liver and SCN
3. Material and Methods
3.1. In Vivo Procedures
3.2. TME and TMaE Effects in the Organism
3.3. Total RNA Extraction and Reverse Transcriptase-Polymerase Chain Reaction (RT-PCR)
3.4. Quantitative PCR (qPCR)
3.5. Melanin Quantification
3.6. RNAseq Datasets
3.7. Experimental Data Analyses
Supplementary Materials
Acknowledgements
Author Contributions
Conflicts of Interest
References
- Panda, S.; Sato, T.K.; Castrucci, A.M.; Rollag, M.D.; DeGrip, W.J.; Hogenesch, J.B.; Provencio, I.; Kay, S.A. Melanopsin (Opn4) requirement for normal light-induced circadian phase shifting. Science 2002, 298, 2213–2236. [Google Scholar] [CrossRef] [PubMed]
- Provencio, I.; Rollag, M.D.; Castrucci, A.M. Photoreceptive net in the mammalian retina. This mesh of cells may explain how some blind mice can still tell day from night. Nature 2002, 415, 493. [Google Scholar] [CrossRef] [PubMed]
- Reppert, S.M.; Weaver, D.R. Coordination of circadian timing in mammals. Nature 2002, 418, 935–941. [Google Scholar] [CrossRef] [PubMed]
- Potter, G.D.; Skene, D.J.; Arendt, J.; Cade, J.E.; Grant, P.J.; Hardie, L.J. Circadian rhythm and sleep disruption: Causes, metabolic consequences, and countermeasures. Endocr. Rev. 2016, 37, 584–608. [Google Scholar] [CrossRef] [PubMed]
- Roenneberg, T.; Merrow, M. The circadian clock and human health. Curr. Biol. 2016, 26, R432–R443. [Google Scholar] [CrossRef] [PubMed]
- West, A.C.; Bechtold, D.A. The cost of circadian desynchrony: Evidence, insights and open questions. Bioessays 2015, 37, 777–788. [Google Scholar] [CrossRef] [PubMed]
- Husse, J.; Eichele, G.; Oster, H. Synchronization of the mammalian circadian timing system: Light can control peripheral clocks independently of the SCN clock: Alternate routes of entrainment optimize the alignment of the body’s circadian clock network with external time. Bioessays 2015, 37, 1119–1128. [Google Scholar] [CrossRef] [PubMed]
- Takahashi, J.S. Transcriptional architecture of the mammalian circadian clock. Nat. Rev. Genet. 2017, 18, 164–179. [Google Scholar] [CrossRef] [PubMed]
- Brown, S.A.; Azzi, A. Peripheral circadian oscillators in mammals. Handb. Exp. Pharmacol. 2013, 217, 45–66. [Google Scholar] [CrossRef]
- Buhr, E.D.; Takahashi, J.S. Molecular components of the Mammalian circadian clock. Handb. Exp. Pharmacol. 2013, 217, 3–27. [Google Scholar] [CrossRef]
- Dibner, C.; Schibler, U.; Albrecht, U. The mammalian circadian timing system: Organization and coordination of central and peripheral clocks. Annu. Rev. Physiol. 2010, 72, 517–549. [Google Scholar] [CrossRef] [PubMed]
- Husse, J.; Leliavski, A.; Tsang, A.H.; Oster, H.; Eichele, G. The light-dark cycle controls peripheral rhythmicity in mice with a genetically ablated suprachiasmatic nucleus clock. FASEB J. 2014, 28, 4950–4960. [Google Scholar] [CrossRef] [PubMed]
- Shostak, A. Circadian clock, cell division, and cancer: From molecules to organism. Int. J. Mol. Sci. 2017, 18, 873. [Google Scholar] [CrossRef] [PubMed]
- Padmanabhan, K.; Billaud, M. Desynchronization of circadian clocks in cancer: A metabolic and epigenetic connection. Front. Endocrinol. 2017, 8, 136. [Google Scholar] [CrossRef] [PubMed]
- Yang, S.L.; Ren, Q.G.; Wen, L.; Hu, J.L.; Wang, H.Y. Research progress on circadian clock genes in common abdominal malignant tumors. Oncol. Lett. 2017, 14, 5091–5098. [Google Scholar] [CrossRef] [PubMed]
- De Assis, L.V.; Moraes, M.N.; da Silveira Cruz-Machado, S.; Castrucci, A.M. The effect of white light on normal and malignant murine melanocytes: A link between opsins, clock genes, and melanogenesis. Biochim. Biophys. Acta 2016, 1863, 1119–1133. [Google Scholar] [CrossRef] [PubMed]
- Kettner, N.M.; Voicu, H.; Finegold, M.J.; Coarfa, C.; Sreekumar, A.; Putluri, N.; Katchy, C.A.; Lee, C.; Moore, D.D.; Fu, L. Circadian homeostasis of liver metabolism suppresses hepatocarcinogenesis. Cancer Cell 2016, 30, 909–924. [Google Scholar] [CrossRef] [PubMed]
- Masri, S.; Kinouchi, K.; Sassone-Corsi, P. Circadian clocks, epigenetics, and cancer. Curr. Opin. Oncol. 2015, 27, 50–56. [Google Scholar] [CrossRef] [PubMed]
- Fu, L.; Kettner, N.M. The circadian clock in cancer development and therapy. Prog. Mol. Biol. Transl. Sci. 2013, 119, 221–282. [Google Scholar] [CrossRef] [PubMed]
- Bass, J.; Lazar, M.A. Circadian time signatures of fitness and disease. Science 2016, 354, 994–999. [Google Scholar] [CrossRef] [PubMed]
- Johansson, A.S.; Owe-Larsson, B.; Hetta, J.; Lundkvist, G.B. Altered circadian clock gene expression in patients with schizophrenia. Schizophr. Res. 2016, 174, 17–23. [Google Scholar] [CrossRef] [PubMed]
- Baron, K.G.; Reid, K.J. Circadian misalignment and health. Int. Rev. Psychiatry 2014, 26, 139–154. [Google Scholar] [CrossRef] [PubMed]
- Rastrelli, M.; Tropea, S.; Rossi, C.R.; Alaibac, M. Melanoma: Epidemiology, risk factors, pathogenesis, diagnosis and classification. In Vivo 2014, 28, 1005–1011. [Google Scholar] [PubMed]
- MacKie, R.M.; Hauschild, A.; Eggermont, A.M. Epidemiology of invasive cutaneous melanoma. Ann. Oncol. 2009, 20 (Suppl. 6), vi1–vi7. [Google Scholar] [CrossRef] [PubMed]
- Jemal, A.; Siegel, R.; Ward, E.; Hao, Y.; Xu, J.; Murray, T.; Thun, M.J. Cancer statistics, 2008. CA Cancer J. Clin. 2008, 58, 71–96. [Google Scholar] [CrossRef] [PubMed]
- Duncan, L.M. The classification of cutaneous melanoma. Hematol. Oncol. Clin. N. Am. 2009, 23, 501–513. [Google Scholar] [CrossRef] [PubMed]
- Song, X.; Zhao, Z.; Barber, B.; Farr, A.M.; Ivanov, B.; Novich, M. Overall survival in patients with metastatic melanoma. Curr. Med. Res. Opin. 2015, 31, 987–991. [Google Scholar] [CrossRef] [PubMed]
- Hardeland, R. Chronobiology of melatonin beyond the feedback to the suprachiasmatic nucleus-Consequences to melatonin dysfunction. Int. J. Mol. Sci. 2013, 14, 5817–5841. [Google Scholar] [CrossRef] [PubMed]
- Slominski, A.T.; Zmijewski, M.A.; Skobowiat, C.; Zbytek, B.; Slominski, R.M.; Steketee, J.D. Sensing the environment: Regulation of local and global homeostasis by the skin’s neuroendocrine system. Adv. Anat. Embryol. Cell Biol. 2012, 212, 1–115. [Google Scholar] [CrossRef]
- Slominski, A.T.; Kleszczynski, K.; Semak, I.; Janjetovic, Z.; Zmijewski, M.A.; Kim, T.K.; Slominski, R.M.; Reiter, R.J.; Fischer, T.W. Local melatoninergic system as the protector of skin integrity. Int. J. Mol. Sci. 2014, 15, 17705–17732. [Google Scholar] [CrossRef] [PubMed]
- Shain, A.H.; Bastian, B.C. From melanocytes to melanomas. Nat. Rev. Cancer 2016, 16, 345–358. [Google Scholar] [CrossRef] [PubMed]
- Redman, J.M.; Gibney, G.T.; Atkins, M.B. Advances in immunotherapy for melanoma. BMC Med. 2016, 14, 20. [Google Scholar] [CrossRef] [PubMed]
- Long, G.V.; Stroyakovskiy, D.; Gogas, H.; Levchenko, E.; de Braud, F.; Larkin, J.; Garbe, C.; Jouary, T.; Hauschild, A.; Grob, J.J.; et al. Combined BRAF and MEK inhibition versus BRAF inhibition alone in melanoma. N. Engl. J. Med. 2014, 371, 1877–1888. [Google Scholar] [CrossRef] [PubMed]
- Grimaldi, A.M.; Simeone, E.; Ascierto, P.A. The role of MEK inhibitors in the treatment of metastatic melanoma. Curr. Opin. Oncol. 2014, 26, 196–203. [Google Scholar] [CrossRef] [PubMed]
- Chapman, P.B.; Hauschild, A.; Robert, C.; Haanen, J.B.; Ascierto, P.; Larkin, J.; Dummer, R.; Garbe, C.; Testori, A.; Maio, M.; et al. Improved survival with vemurafenib in melanoma with BRAF V600E mutation. N. Engl. J. Med. 2011, 364, 2507–2516. [Google Scholar] [CrossRef] [PubMed]
- Poletini, M.O.; de Assis, L.V.; Moraes, M.N.; Castrucci, A.M. Estradiol differently affects melanin synthesis of malignant and normal melanocytes: A relationship with clock and clock-controlled genes. Mol. Cell. Biochem. 2016, 421, 29–39. [Google Scholar] [CrossRef] [PubMed]
- De Assis, L.V.M.; Moraes, M.N.; Castrucci, A.M.L. Heat shock antagonizes UVA-induced responses in murine melanocytes and melanoma cells: An unexpected interaction. Photochem. Photobiol. Sci. 2017, 16, 633–648. [Google Scholar] [CrossRef] [PubMed]
- Lengyel, Z.; Lovig, C.; Kommedal, S.; Keszthelyi, R.; Szekeres, G.; Battyani, Z.; Csernus, V.; Nagy, A.D. Altered expression patterns of clock gene mRNAs and clock proteins in human skin tumors. Tumour Biol. 2013, 34, 811–819. [Google Scholar] [CrossRef] [PubMed]
- Kiessling, S.; Beaulieu-Laroche, L.; Blum, I.D.; Landgraf, D.; Welsh, D.K.; Storch, K.F.; Labrecque, N.; Cermakian, N. Enhancing circadian clock function in cancer cells inhibits tumor growth. BMC Biol. 2017, 15, 13. [Google Scholar] [CrossRef] [PubMed]
- Spill, F.; Reynolds, D.S.; Kamm, R.D.; Zaman, M.H. Impact of the physical microenvironment on tumor progression and metastasis. Curr. Opin. Biotechnol. 2016, 40, 41–48. [Google Scholar] [CrossRef] [PubMed]
- Balkwill, F.R.; Capasso, M.; Hagemann, T. The tumor microenvironment at a glance. J. Cell Sci. 2012, 125, 5591–5596. [Google Scholar] [CrossRef] [PubMed]
- Wu, T.; Dai, Y. Tumor microenvironment and therapeutic response. Cancer Lett. 2017, 387, 61–68. [Google Scholar] [CrossRef] [PubMed]
- Sun, Y. Tumor microenvironment and cancer therapy resistance. Cancer Lett. 2016, 380, 205–215. [Google Scholar] [CrossRef] [PubMed]
- Fang, H.; Declerck, Y.A. Targeting the tumor microenvironment: From understanding pathways to effective clinical trials. Cancer Res. 2013, 73, 4965–4977. [Google Scholar] [CrossRef] [PubMed]
- Alves, M.J.; Figueredo, R.G.; Azevedo, F.F.; Cavallaro, D.A.; Neto, N.I.; Lima, J.D.; Matos-Neto, E.; Radloff, K.; Riccardi, D.M.; Camargo, R.G.; et al. Adipose tissue fibrosis in human cancer cachexia: The role of TGFbeta pathway. BMC Cancer 2017, 17, 190. [Google Scholar] [CrossRef] [PubMed]
- Silverio, R.; Lira, F.S.; Oyama, L.M.; Oller do Nascimento, C.M.; Otoch, J.P.; Alcantara, P.S.M.; Batista, M.L., Jr.; Seelaender, M. Lipases and lipid droplet-associated protein expression in subcutaneous white adipose tissue of cachectic patients with cancer. Lipids Health Dis. 2017, 16, 159. [Google Scholar] [CrossRef] [PubMed]
- Al-Zoughbi, W.; Huang, J.; Paramasivan, G.S.; Till, H.; Pichler, M.; Guertl-Lackner, B.; Hoefler, G. Tumor macroenvironment and metabolism. Semin. Oncol. 2014, 41, 281–295. [Google Scholar] [CrossRef] [PubMed]
- Egeblad, M.; Nakasone, E.S.; Werb, Z. Tumors as organs: Complex tissues that interface with the entire organism. Dev. Cell 2010, 18, 884–901. [Google Scholar] [CrossRef] [PubMed]
- Masri, S.; Papagiannakopoulos, T.; Kinouchi, K.; Liu, Y.; Cervantes, M.; Baldi, P.; Jacks, T.; Sassone-Corsi, P. Lung adenocarcinoma distally rewires hepatic circadian homeostasis. Cell 2016, 165, 896–909. [Google Scholar] [CrossRef] [PubMed]
- Hojo, H.; Enya, S.; Arai, M.; Suzuki, Y.; Nojiri, T.; Kangawa, K.; Koyama, S.; Kawaoka, S. Remote reprogramming of hepatic circadian transcriptome by breast cancer. Oncotarget 2017, 8, 34128–34140. [Google Scholar] [CrossRef] [PubMed]
- Aran, D.; Camarda, R.; Odegaard, J.; Paik, H.; Oskotsky, B.; Krings, G.; Goga, A.; Sirota, M.; Butte, A.J. Comprehensive analysis of normal adjacent to tumor transcriptomes. Nat. Commun. 2017, 8, 1077. [Google Scholar] [CrossRef] [PubMed]
- Slominski, A.T.; Hardeland, R.; Reiter, R.J. When the circadian clock meets the melanin pigmentarys system. J. Investig. Dermatol. 2015, 135, 943–945. [Google Scholar] [CrossRef] [PubMed]
- Hardman, J.A.; Tobin, D.J.; Haslam, I.S.; Farjo, N.; Farjo, B.; Al-Nuaimi, Y.; Grimaldi, B.; Paus, R. The peripheral clock regulates human pigmentation. J. Investig. Dermatol. 2015, 135, 1053–1064. [Google Scholar] [CrossRef] [PubMed]
- McLafferty, E.; Hendry, C.; Alistair, F. The integumentary system: Anatomy, physiology and function of skin. Nurs. Stand. 2012, 27, 35–42. [Google Scholar] [CrossRef] [PubMed]
- Brozyna, A.A.; Jozwicki, W.; Roszkowski, K.; Filipiak, J.; Slominski, A.T. Melanin content in melanoma metastases affects the outcome of radiotherapy. Oncotarget 2016, 7, 17844–17853. [Google Scholar] [CrossRef] [PubMed]
- Brozyna, A.A.; VanMiddlesworth, L.; Slominski, A.T. Inhibition of melanogenesis as a radiation sensitizer for melanoma therapy. Int. J. Cancer 2008, 123, 1448–1456. [Google Scholar] [CrossRef] [PubMed]
- Freudlsperger, C.; Schumacher, U.; Reinert, S.; Hoffmann, J. The critical role of PPARgamma in human malignant melanoma. PPAR Res. 2008, 2008, 503797. [Google Scholar] [CrossRef] [PubMed]
- Lee, J.S.; Choi, Y.M.; Kang, H.Y. PPAR-gamma agonist, ciglitazone, increases pigmentation and migration of human melanocytes. Exp. Dermatol. 2007, 16, 118–123. [Google Scholar] [CrossRef] [PubMed]
- Moraes, M.N.; de Assis, L.V.M.; Magalhaes-Marques, K.K.; Poletini, M.O.; de Lima, L.; Castrucci, A.M.L. Melanopsin, a canonical light receptor, mediates thermal activation of clock genes. Sci. Rep. 2017, 7, 13977. [Google Scholar] [CrossRef] [PubMed]
- Gaddameedhi, S.; Selby, C.P.; Kaufmann, W.K.; Smart, R.C.; Sancar, A. Control of skin cancer by the circadian rhythm. Proc. Natl. Acad. Sci. USA 2011, 108, 18790–18795. [Google Scholar] [CrossRef] [PubMed]
- Oishi, K.; Amagai, N.; Shirai, H.; Kadota, K.; Ohkura, N.; Ishida, N. Genome-wide expression analysis reveals 100 adrenal gland-dependent circadian genes in the mouse liver. DNA Res. 2005, 12, 191–202. [Google Scholar] [CrossRef] [PubMed]
- Hanahan, D.; Weinberg, R.A. Hallmarks of cancer: The next generation. Cell 2011, 144, 646–674. [Google Scholar] [CrossRef] [PubMed]
- De Assis, L.V.; Moraes, M.N.; Magalhaes-Marques, K.K.; Castrucci, A.M. Melanopsin and rhodopsin mediate UVA-induced immediate pigment darkening: Unrevealing the photosensitive system of the skin. Eur. J. Cell Biol. 2018, in press. [Google Scholar] [CrossRef] [PubMed]
- Regazzetti, C.; Sormani, L.; Debayle, D.; Bernerd, F.; Tulic, M.K.; De Donatis, G.M.; Chignon-Sicard, B.; Rocchi, S.; Passeron, T. Melanocytes sense blue light and regulate pigmentation through opsin-3. J. Investig. Dermatol. 2018, 138, 171–178. [Google Scholar] [CrossRef] [PubMed]
- Buscone, S.; Mardaryev, A.N.; Raafs, B.; Bikker, J.W.; Sticht, C.; Gretz, N.; Farjo, N.; Uzunbajakava, N.E.; Botchkareva, N.V. A new path in defining light parameters for hair growth: Discovery and modulation of photoreceptors in human hair follicle. Lasers Surg. Med. 2017, 49, 705–718. [Google Scholar] [CrossRef] [PubMed]
- Wicks, N.L.; Chan, J.W.; Najera, J.A.; Ciriello, J.M.; Oancea, E. UVA phototransduction drives early melanin synthesis in human melanocytes. Curr. Biol. 2011, 21, 1906–1911. [Google Scholar] [CrossRef] [PubMed]
- Kim, H.J.; Son, E.D.; Jung, J.Y.; Choi, H.; Lee, T.R.; Shin, D.W. Violet light down-regulates the expression of specific differentiation markers through Rhodopsin in normal human epidermal keratinocytes. PLoS ONE 2013, 8, e73678. [Google Scholar] [CrossRef] [PubMed]
- Hughes, S.; Hankins, M.W.; Foster, R.G.; Peirson, S.N. Melanopsin phototransduction: Slowly emerging from the dark. Prog. Brain Res. 2012, 199, 19–40. [Google Scholar] [CrossRef] [PubMed]
- Jiao, J.; Hong, S.; Zhang, J.; Ma, L.; Sun, Y.; Zhang, D.; Shen, B.; Zhu, C. Opsin3 sensitizes hepatocellular carcinoma cells to 5-fluorouracil treatment by regulating the apoptotic pathway. Cancer Lett. 2012, 320, 96–103. [Google Scholar] [CrossRef] [PubMed]
- Yoshimoto, T.; Morine, Y.; Takasu, C.; Feng, R.; Ikemoto, T.; Yoshikawa, K.; Iwahashi, S.; Saito, Y.; Kashihara, H.; Akutagawa, M.; et al. Blue light-emitting diodes induce autophagy in colon cancer cells by Opsin 3. Ann. Gastroenterol. Surg. 2018. [Google Scholar] [CrossRef]
- Dakup, P.P.; Porter, K.I.; Little, A.A.; Gajula, R.P.; Zhang, H.; Skornyakov, E.; Kemp, M.G.; van Dongen, H.P.A.; Gaddameedhi, S. The circadian clock regulates cisplatin-induced toxicity and tumor regression in melanoma mouse and human models. Oncotarget 2018, 1–15. [Google Scholar] [CrossRef] [PubMed]
- Brozyna, A.A.; Jozwicki, W.; Carlson, J.A.; Slominski, A.T. Melanogenesis affects overall and disease-free survival in patients with stage III and IV melanoma. Hum. Pathol. 2013, 44, 2071–2074. [Google Scholar] [CrossRef] [PubMed]
- Consortium, G.T. Human genomics. The Genotype-Tissue Expression (GTEx) pilot analysis: Multitissue gene regulation in humans. Science 2015, 348, 648–660. [Google Scholar] [CrossRef] [PubMed]
- Akbani, R.; Akdemir, K.C.; Aksoy, B.A.; Albert, M.; Ally, A.; Amin, S.B.; Arachchi, H.; Arora, A.; Auman, J.T.; Ayala, B.; et al. Genomic classification of cutaneous melanoma. Cell 2015, 161, 1681–1696. [Google Scholar] [CrossRef] [PubMed]
- Bland, C.L.; Byrne-Hoffman, C.N.; Fernandez, A.; Rellick, S.L.; Deng, W.; Klinke, D.J. Exosomes derived from B16F0 melanoma cells alter the transcriptome of cytotoxic T cells that impacts mitochondrial respiration. FEBS J. 2018. [Google Scholar] [CrossRef] [PubMed]
- Damsky, W.E.; Rosenbaum, L.E.; Bosenberg, M. Decoding melanoma metastasis. Cancers 2010, 3, 126–163. [Google Scholar] [CrossRef] [PubMed]
- Yang, G.; Wright, C.J.; Hinson, M.D.; Fernando, A.P.; Sengupta, S.; Biswas, C.; La, P.; Dennery, P.A. Oxidative stress and inflammation modulate Rev-erbalpha signaling in the neonatal lung and affect circadian rhythmicity. Antioxid. Redox Signal. 2014, 21, 17–32. [Google Scholar] [CrossRef] [PubMed]
- Yamazaki, S.; Numano, R.; Abe, M.; Hida, A.; Takahashi, R.; Ueda, M.; Block, G.D.; Sakaki, Y.; Menaker, M.; Tei, H. Resetting central and peripheral circadian oscillators in transgenic rats. Science 2000, 288, 682–685. [Google Scholar] [CrossRef] [PubMed]
- Oishi, K.; Sakamoto, K.; Okada, T.; Nagase, T.; Ishida, N. Humoral signals mediate the circadian expression of rat period homologue (rPer2) mRNA in peripheral tissues. Neurosci. Lett. 1998, 256, 117–119. [Google Scholar] [CrossRef]
- Oishi, K.; Sakamoto, K.; Okada, T.; Nagase, T.; Ishida, N. Antiphase circadian expression between BMAL1 and period homologue mRNA in the suprachiasmatic nucleus and peripheral tissues of rats. Biochem. Biophys. Res. Commun. 1998, 253, 199–203. [Google Scholar] [CrossRef] [PubMed]
- Sundar, I.K.; Sellix, M.T.; Rahman, I. Redox regulation of circadian molecular clock in chronic airway diseases. Free Radic. Biol. Med. 2017. [Google Scholar] [CrossRef] [PubMed]
- Buchanan, G.F. Timing, sleep, and respiration in health and disease. Prog. Mol. Biol. Transl. Sci. 2013, 119, 191–219. [Google Scholar] [CrossRef] [PubMed]
- Pekovic-Vaughan, V.; Gibbs, J.; Yoshitane, H.; Yang, N.; Pathiranage, D.; Guo, B.; Sagami, A.; Taguchi, K.; Bechtold, D.; Loudon, A.; et al. The circadian clock regulates rhythmic activation of the NRF2/glutathione-mediated antioxidant defense pathway to modulate pulmonary fibrosis. Genes Dev. 2014, 28, 548–560. [Google Scholar] [CrossRef] [PubMed] [Green Version]
- Papagiannakopoulos, T.; Bauer, M.R.; Davidson, S.M.; Heimann, M.; Subbaraj, L.; Bhutkar, A.; Bartlebaugh, J.; Vander Heiden, M.G.; Jacks, T. Circadian rhythm disruption promotes lung tumorigenesis. Cell Metab. 2016, 24, 324–331. [Google Scholar] [CrossRef] [PubMed]
- Panda, S.; Antoch, M.P.; Miller, B.H.; Su, A.I.; Schook, A.B.; Straume, M.; Schultz, P.G.; Kay, S.A.; Takahashi, J.S.; Hogenesch, J.B. Coordinated transcription of key pathways in the mouse by the circadian clock. Cell 2002, 109, 307–320. [Google Scholar] [CrossRef]
- Hussain, M.M.; Pan, X. Clock genes, intestinal transport and plasma lipid homeostasis. Trends Endocrinol. Metab. 2009, 20, 177–185. [Google Scholar] [CrossRef] [PubMed]
- Bugge, A.; Feng, D.; Everett, L.J.; Briggs, E.R.; Mullican, S.E.; Wang, F.; Jager, J.; Lazar, M.A. Rev-erbalpha and Rev-erbbeta coordinately protect the circadian clock and normal metabolic function. Genes Dev. 2012, 26, 657–667. [Google Scholar] [CrossRef] [PubMed]
- Shimba, S.; Ogawa, T.; Hitosugi, S.; Ichihashi, Y.; Nakadaira, Y.; Kobayashi, M.; Tezuka, M.; Kosuge, Y.; Ishige, K.; Ito, Y.; et al. Deficient of a clock gene, brain and muscle Arnt-like protein-1 (BMAL1), induces dyslipidemia and ectopic fat formation. PLoS ONE 2011, 6, e25231. [Google Scholar] [CrossRef] [PubMed]
- Grimaldi, B.; Bellet, M.M.; Katada, S.; Astarita, G.; Hirayama, J.; Amin, R.H.; Granneman, J.G.; Piomelli, D.; Leff, T.; Sassone-Corsi, P. PER2 controls lipid metabolism by direct regulation of PPARgamma. Cell Metab. 2010, 12, 509–520. [Google Scholar] [CrossRef] [PubMed]
- Turek, F.W.; Joshu, C.; Kohsaka, A.; Lin, E.; Ivanova, G.; McDearmon, E.; Laposky, A.; Losee-Olson, S.; Easton, A.; Jensen, D.R.; et al. Obesity and metabolic syndrome in circadian Clock mutant mice. Science 2005, 308, 1043–1045. [Google Scholar] [CrossRef] [PubMed]
- Ando, H.; Ushijima, K.; Shimba, S.; Fujimura, A. Daily fasting blood glucose rhythm in male mice: A role of the circadian clock in the liver. Endocrinology 2016, 157, 463–469. [Google Scholar] [CrossRef] [PubMed]
- McGinnis, G.R.; Young, M.E. Circadian regulation of metabolic homeostasis: Causes and consequences. Nat. Sci. Sleep 2016, 8, 163–180. [Google Scholar] [CrossRef] [PubMed]
- Moraes, M.N.; de Assis, L.V.M.; Henriques, F.D.S.; Batista, M.L., Jr.; Guler, A.D.; Castrucci, A.M.L. Cold-sensing TRPM8 channel participates in circadian control of the brown adipose tissue. Biochim. Biophys. Acta 2017, 1864, 2415–2427. [Google Scholar] [CrossRef] [PubMed]
- Cho, H.; Zhao, X.; Hatori, M.; Yu, R.T.; Barish, G.D.; Lam, M.T.; Chong, L.W.; DiTacchio, L.; Atkins, A.R.; Glass, C.K.; et al. Regulation of circadian behaviour and metabolism by REV-ERB-alpha and REV-ERB-beta. Nature 2012, 485, 123–127. [Google Scholar] [CrossRef] [PubMed]
- Pawlak, M.; Lefebvre, P.; Staels, B. Molecular mechanism of PPARalpha action and its impact on lipid metabolism, inflammation and fibrosis in non-alcoholic fatty liver disease. J. Hepatol. 2015, 62, 720–733. [Google Scholar] [CrossRef] [PubMed]
- Tsytkin-Kirschenzweig, S.; Cohen, M.; Nahmias, Y. Tracking GLUT2 translocation by live-cell imaging. In Glucose Transport: Methods and Protocols; Lindkvist-Petersson, K., Hansen, J.S., Eds.; Springer: New York, NY, USA, 2018; pp. 241–254. [Google Scholar]
- Leturque, A.; Brot-Laroche, E.; Le Gall, M. GLUT2 mutations, translocation, and receptor function in diet sugar managing. Am. J. Physiol. Endocrinol. Metab. 2009, 296, E985–E992. [Google Scholar] [CrossRef] [PubMed]
- Chiang, J.Y. Bile acids: Regulation of synthesis. J. Lipid Res. 2009, 50, 1955–1966. [Google Scholar] [CrossRef] [PubMed]
- Miyake, J.H.; Wang, S.L.; Davis, R.A. Bile acid induction of cytokine expression by macrophages correlates with repression of hepatic cholesterol 7alpha-hydroxylase. J. Biol. Chem. 2000, 275, 21805–21808. [Google Scholar] [CrossRef] [PubMed]
- Zhang, T.; Zhao, M.; Lu, D.; Wang, S.; Yu, F.; Guo, L.; Wen, S.; Wu, B. REV-ERBa regulates CYP7A1 through repression of liver receptor homolog-1. Drug Metab. Dispos. 2017. [Google Scholar] [CrossRef]
- Golombek, D.A.; Rosenstein, R.E. Physiology of circadian entrainment. Physiol. Rev. 2010, 90, 1063–1102. [Google Scholar] [CrossRef] [PubMed]
- Liu, A.C.; Welsh, D.K.; Ko, C.H.; Tran, H.G.; Zhang, E.E.; Priest, A.A.; Buhr, E.D.; Singer, O.; Meeker, K.; Verma, I.M.; et al. Intercellular coupling confers robustness against mutations in the SCN circadian clock network. Cell 2007, 129, 605–616. [Google Scholar] [CrossRef] [PubMed]
- Labrecque, N.; Cermakian, N. Circadian clocks in the immune system. J. Biol. Rhythm. 2015, 30, 277–290. [Google Scholar] [CrossRef] [PubMed]
- Scheiermann, C.; Kunisaki, Y.; Frenette, P.S. Circadian control of the immune system. Nat. Rev. Immunol. 2013, 13, 190–198. [Google Scholar] [CrossRef] [PubMed]
- Brown, S.A. Circadian metabolism: From mechanisms to metabolomics and medicine. Trends Endocrinol. Metab. 2016, 27, 415–426. [Google Scholar] [CrossRef] [PubMed]
- Albrecht, U. The circadian clock, metabolism and obesity. Obes. Rev. 2017, 18 (Suppl. 1), 25–33. [Google Scholar] [CrossRef] [PubMed]
- Gerhart-Hines, Z.; Lazar, M.A. Circadian metabolism in the light of evolution. Endocr. Rev. 2015, 36, 289–304. [Google Scholar] [CrossRef] [PubMed]
- Tsang, A.H.; Astiz, M.; Friedrichs, M.; Oster, H. Endocrine regulation of circadian physiology. J. Endocrinol. 2016, 230, R1–R11. [Google Scholar] [CrossRef] [PubMed]
- Gamble, K.L.; Berry, R.; Frank, S.J.; Young, M.E. Circadian clock control of endocrine factors. Nat. Rev. Endocrinol. 2014, 10, 466–475. [Google Scholar] [CrossRef] [PubMed]
- Dakup, P.; Gaddameedhi, S. Impact of the circadian clock on UV-induced DNA damage response and photocarcinogenesis. Photochem. Photobiol. 2017, 93, 296–303. [Google Scholar] [CrossRef] [PubMed]
- Izumo, M.; Pejchal, M.; Schook, A.C.; Lange, R.P.; Walisser, J.A.; Sato, T.R.; Wang, X.; Bradfield, C.A.; Takahashi, J.S. Differential effects of light and feeding on circadian organization of peripheral clocks in a forebrain Bmal1 mutant. Elife 2014, 3. [Google Scholar] [CrossRef] [PubMed]
- Husse, J.; Zhou, X.; Shostak, A.; Oster, H.; Eichele, G. Synaptotagmin10-Cre, a driver to disrupt clock genes in the SCN. J. Biol. Rhythm. 2011, 26, 379–389. [Google Scholar] [CrossRef] [PubMed]
- Tamaru, T.; Takamatsu, K. Circadian modification network of a core clock driver BMAL1 to harmonize physiology from brain to peripheral tissues. Neurochem. Int. 2018. [Google Scholar] [CrossRef] [PubMed]
- Kiessling, S.; Cermakian, N. The tumor circadian clock: A new target for cancer therapy? Futur. Oncol. 2017, 13, 2607–2610. [Google Scholar] [CrossRef] [PubMed]
- Eberting, C.L.; Shrayer, D.P.; Butmarc, J.; Falanga, V. Histologic progression of B16 F10 metastatic melanoma in C57BL/6 mice over a six week time period: Distant metastases before local growth. J. Dermatol. 2004, 31, 299–304. [Google Scholar] [CrossRef] [PubMed]
- Welsh, D.K.; Takahashi, J.S.; Kay, S.A. Suprachiasmatic nucleus: Cell autonomy and network properties. Annu. Rev. Physiol. 2010, 72, 551–577. [Google Scholar] [CrossRef] [PubMed]
- Oancea, E.; Vriens, J.; Brauchi, S.; Jun, J.; Splawski, I.; Clapham, D.E. TRPM1 forms ion channels associated with melanin content in melanocytes. Sci. Signal. 2009, 2, ra21. [Google Scholar] [CrossRef] [PubMed]
- Livak, K.J.; Schmittgen, T.D. Analysis of relative gene expression data using real-time quantitative PCR and the 2(-Delta Delta C(T)) Method. Methods 2001, 25, 402–408. [Google Scholar] [CrossRef] [PubMed]
- Moraes, M.N.; Mezzalira, N.; de Assis, L.V.; Menaker, M.; Guler, A.; Castrucci, A.M. TRPV1 participates in the activation of clock molecular machinery in the brown adipose tissue in response to light-dark cycle. Biochim. Biophys. Acta 2017, 1864, 324–335. [Google Scholar] [CrossRef] [PubMed]


| Tissue | Gene Expression vs. Melanin Content | r Value | R2 | p Value |
|---|---|---|---|---|
| Tumor-Adjacent Skin | Per1 | 0.4761 | 0.2266 | 0.0394 |
| Bmal1 | 0.6469 | 0.285 | 0.0021 | |
| Opn2 | 0.7513 | 0.5644 | 0.0003 | |
| Opn4 | −0.7837 | 0.09481 | 0.0001 | |
| Xpa | 0.5037 | 0.1475 | 0.0199 | |
| Pparγ | −0.5956 | 0.3751 | 0.0133 | |
| Tumor | Per1 | 0.5805 | 0.337 | 0.0073 |
| Bmal1 | 0.5651 | 0.3194 | 0.0076 | |
| Opn2 | 0.5368 | 0.2159 | 0.0147 | |
| Opn4 | −0.6067 | 0.368 | 0.0098 | |
| Xpa | −0.5817 | 0.3383 | 0.0071 | |
| Lungs | Bmal1 | −0.5015 | 0.2515 | 0.0403 |
| Liver | Per1 | −0.5327 | 0.1618 | 0.0356 |
| SCN | Per1 | 0.5543 | 0.3072 | 0.0112 |
| Bmal1 | −0.5933 | 0.352 | 0.0046 | |
| cFos | 0.6481 | 0.42 | 0.002 |
| Genes | Expression Mean ± (SEM) | Mann—Whitney Test | |
|---|---|---|---|
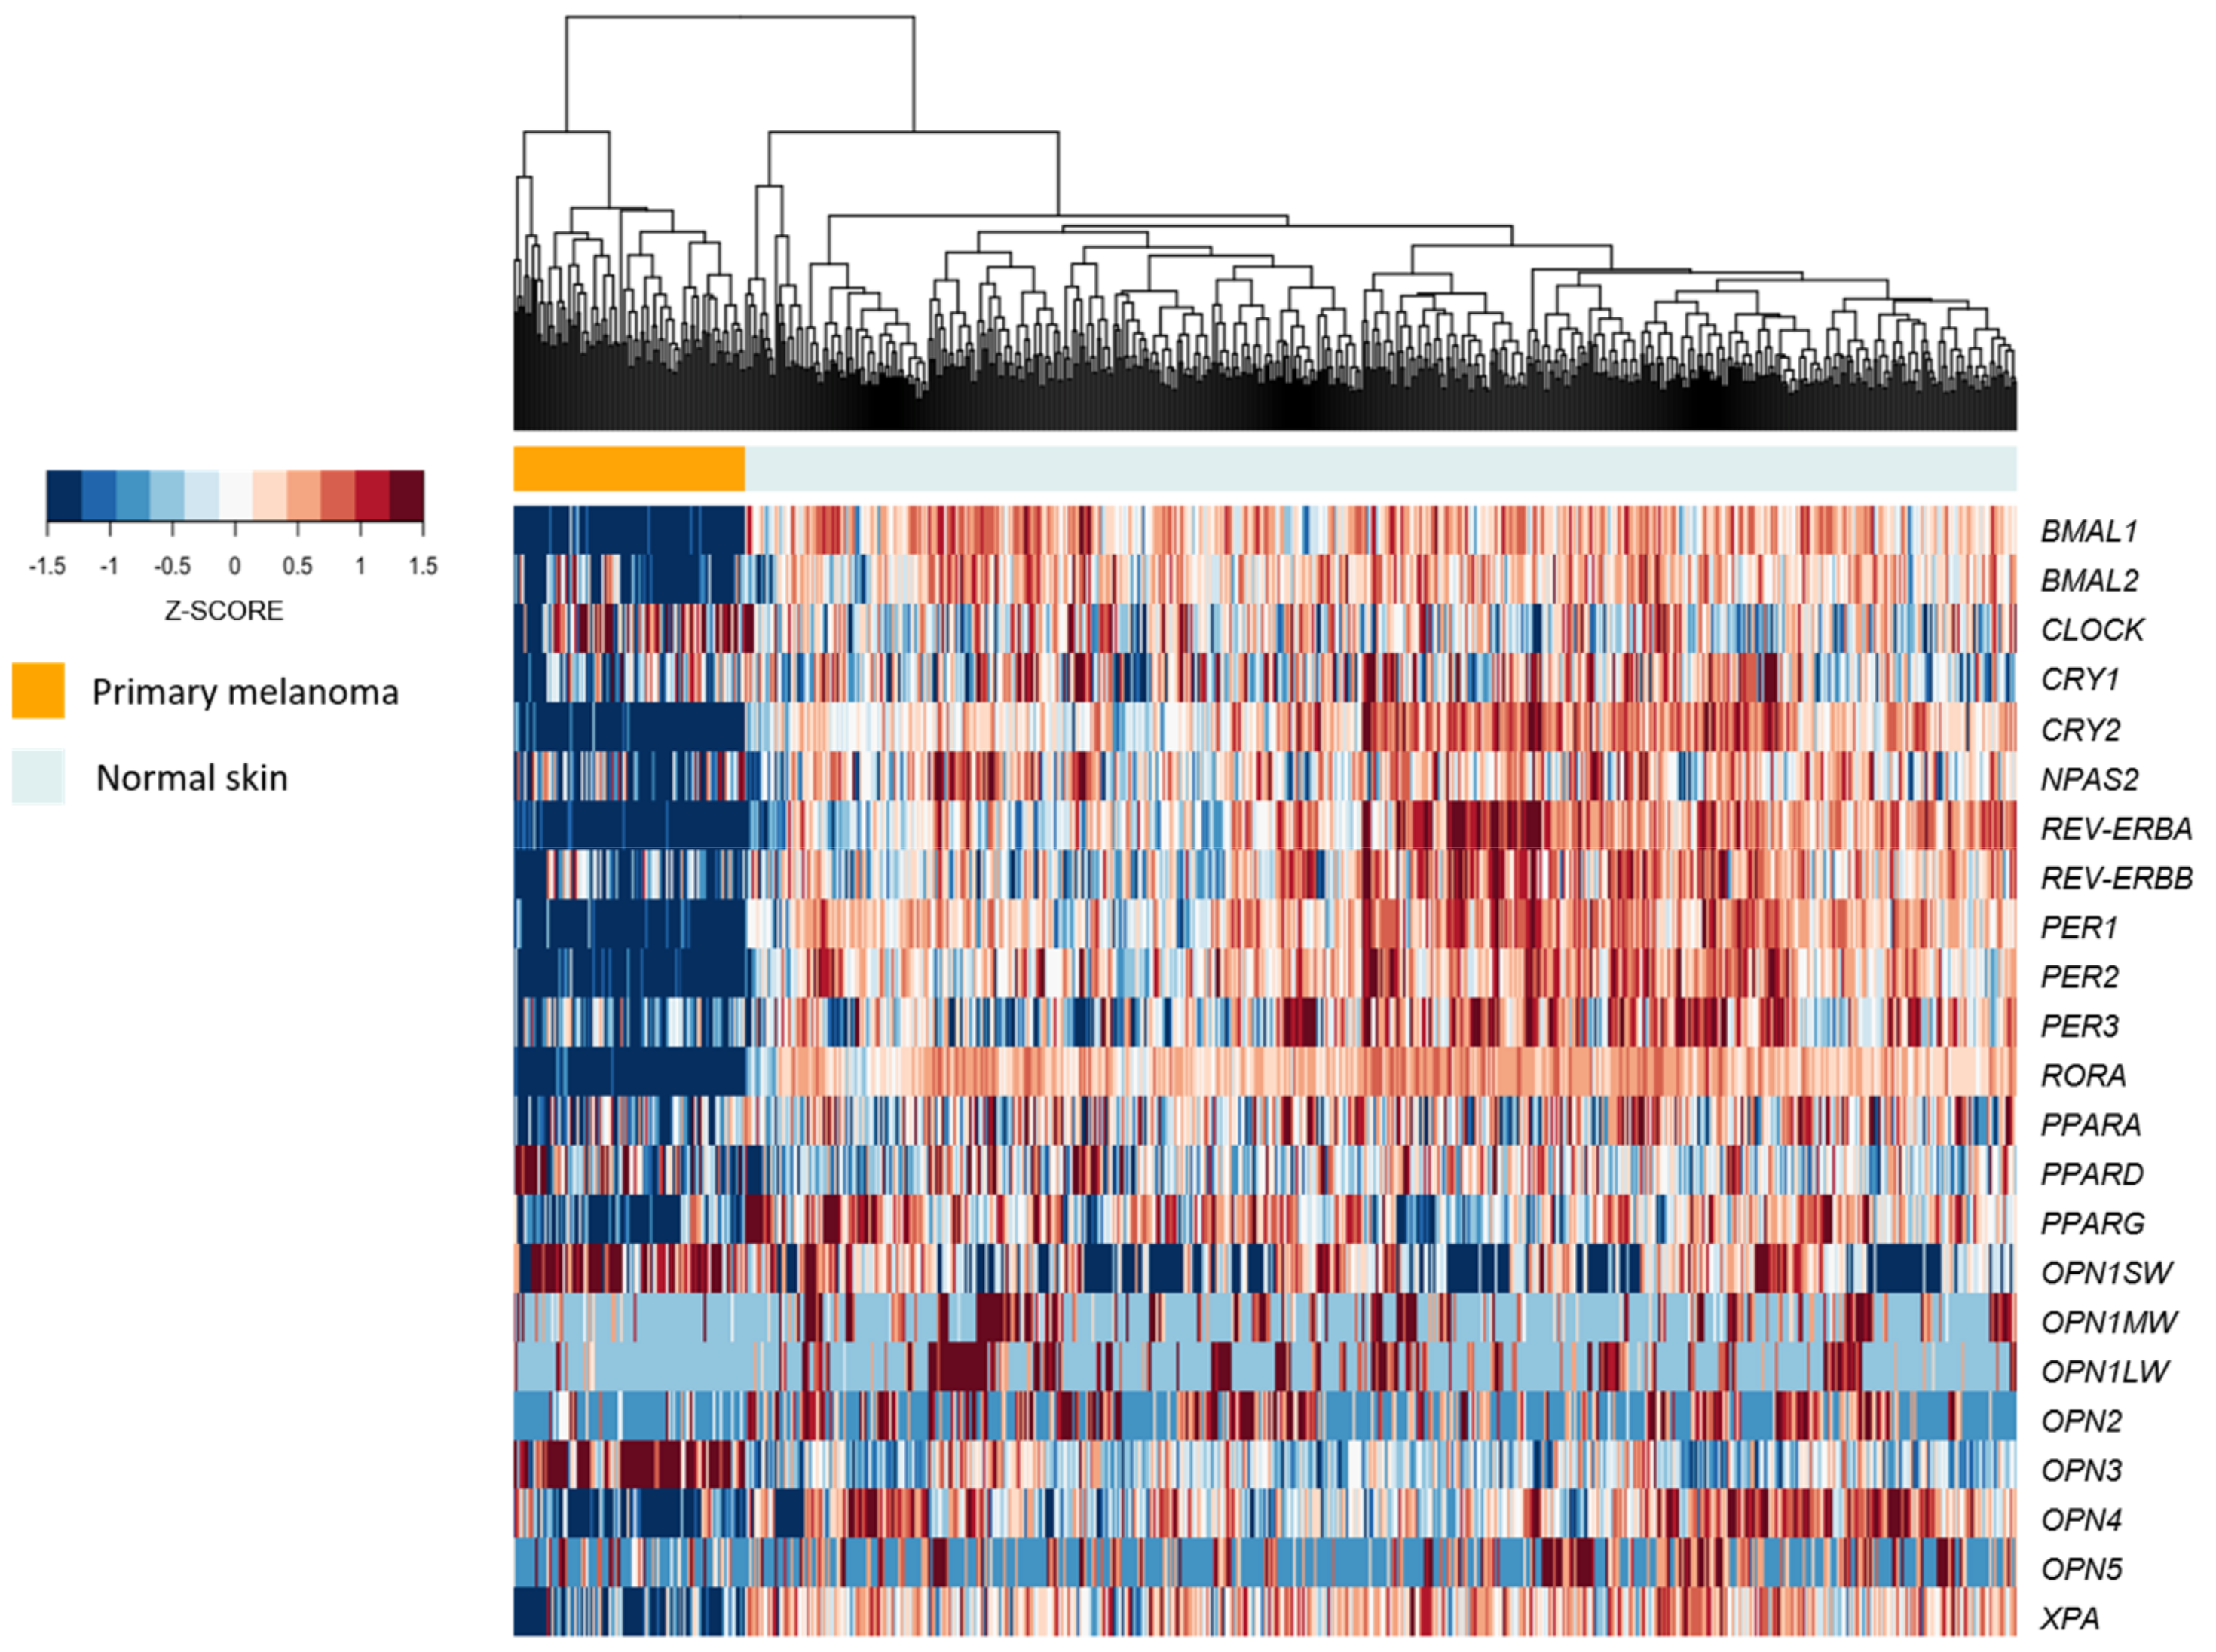
| GTEx Normal Skin (n = 557) | TCGA Primary Melanoma (n = 104) | p Value | |
| BMAL1 | 10.525 (0.023) | 7.553 (0.08) | <0.0001 |
| BMAL2 | 9.45 (0.024) | 7.19 (0.183) | <0.0001 |
| CLOCK | 9.975 (0.015) | 10.028 (0.079) | 0.019 |
| CRY1 | 9.623 (0.024) | 9.073 (0.089) | <0.0001 |
| CRY2 | 12.301 (0.023) | 9.737 (0.062) | <0.0001 |
| NPAS2 | 11.251 (0.022) | 10.346 (0.125) | <0.0001 |
| REV-ERBA | 13.968 (0.051) | 10.057 (0.08) | <0.0001 |
| REV-ERBB | 10.826 (0.025) | 9.625 (0.111) | <0.0001 |
| PER1 | 14.388 (0.033) | 10.801 (0.087) | <0.0001 |
| PER2 | 11.217 (0.03) | 8.404 (0.073) | <0.0001 |
| PER3 | 10.842 (0.036) | 9.816 (0.089) | <0.0001 |
| RORA | 13.75 (0.031) | 7.351 (0.141) | <0.0001 |
| PPARA | 10.24 (0.022) | 9.696 (0.079) | <0.0001 |
| PPARD | 11.419 (0.014) | 11.525 (0.077) | 0.921 |
| PPARG | 8.08 (0.047) | 6.029 (0.135) | <0.0001 |
| OPN1SW | 1.358 (0.047) | 2.873 (0.135) | <0.0001 |
| OPN1MW | 0.624 (0.039) | 0.219 (0.058) | <0.0001 |
| OPN1LW | 0.628 (0.04) | 0.113 (0.039) | <0.0001 |
| OPN2 | 0.898 (0.04) | 0.29 (0.056) | <0.0001 |
| OPN3 | 8.452 (0.027) | 10.357 (0.129) | <0.0001 |
| OPN4 | 4.709 (0.056) | 2.503 (0.149) | <0.0001 |
| OPN5 | 0.706 (0.039) | 0.554 (0.09) | 0.093 |
| XPA | 8.898 (0.012) | 8.002 (0.065) | <0.0001 |
| Templates (Access Number) | Primers and Probes | Final Concentration |
|---|---|---|
| Per1 (NM_0011065.3) | Forward: 5′-AGCAGGTTCAGGCTAACCAGGAAT-3′ Reverse: 5′-AGGTGTCCTGGTTTCGAAGTGTGT-3′ Probe: 5′-/6FAM/-AGCTTGTGCCATGGACATGTCTACT/BHQ_1/-3′ | 300 nM 300 nM 200 nM |
| Bmal1 (NM_001243048) | Forward: 5′-AGCTTCTGCACAATCCACAGCAC-3′ Reverse: 5′-TGTCTGGCTCATTGTCTTCGTCCA-3′ Probe: 5′-/5HEX/-AAAGCTGGCCACCCACGAAGATGGG/BHQ_1/-3′ | 300 nM 300 nM 200 nM |
| Pparγ (NM_001127330.2) | Forward: 5′-TGTGGGGATAAAGCATCAGGC-3′ Reverse: 5′-CCGGCAGTTAAGATCACACCTAT-3′ | 300 nM 300 nM |
| Pparα (NM_011144.6) | Forward: 5′-ACGTTTGTGGCTGGTCAAGT-3′ Reverse: 5′-TGGAGAGAGGGTGTCTGTGAT-3′ | 300 nM 300 nM |
| Reverb-α (NM_145434.4) | Forward: 5′-AAGACATGACGACCCTGGAC-3′ Reverse: 5′-CCATGCCATTCAGCTTGGTAAT-3′ | 300 nM 300 nM |
| Glut2 (NM_031197.2) | Forward: 5′-TGTTGGGGCCATCAACATGA-3′ Reverse: 5′-GGCGAATTTATCCAGCAGCAC-3′ | 300 nM 300 nM |
| Xpa (NM_011728.2) | Forward: 5′-GGCGATATGAAGCTCTACCTAAA-3′ Reverse: 5′-TTCCTGCCTCACTTCCTTTG-3′ | 300 nM 300 nM |
| cFos (NM_010234.2) | Forward: 5′-TACTACCATTCCCCAGCCGA-3′ Reverse: 5′-GCTGTCACCGTGGGGATAAA-3′ | 300 nM 300 nM |
| Opn2 (NM_145383.1) | Forward: 5′-TGCCACACTTGGAGGTGAAA-3′ Reverse: 5′-ACCACGTAGCGCTCAATGG-3′ | 300 nM 300 nM |
| Opn4 (NM_001128599.1) | Forward: 5′-ACATCTTCATCTTCAGGGCCA-3′ Reverse: 5′-ACTCACCGCAGCCCTCAC-3′ | 300 nM 300 nM |
| Rpl37a RNA (NM_009084.4) | Forward: 5′-GCATGAAAACAGTGGCCGGT-3′ Reverse: 5′-AGGGTCACACAGTATGTCTCAAAA-3′ | 300 nM 300 nM |
| 18S RNA | Forward: 5′-CGGCTACCACATCCAAGGAA-3′ Reverse: 5′-GCTGGAATTACCGCGGCT-3′ | 50 nM 50 nM |
© 2018 by the authors. Licensee MDPI, Basel, Switzerland. This article is an open access article distributed under the terms and conditions of the Creative Commons Attribution (CC BY) license (http://creativecommons.org/licenses/by/4.0/).
Share and Cite
De Assis, L.V.M.; Moraes, M.N.; Magalhães-Marques, K.K.; Kinker, G.S.; Da Silveira Cruz-Machado, S.; De Lauro Castrucci, A.M. Non-Metastatic Cutaneous Melanoma Induces Chronodisruption in Central and Peripheral Circadian Clocks. Int. J. Mol. Sci. 2018, 19, 1065. https://doi.org/10.3390/ijms19041065
De Assis LVM, Moraes MN, Magalhães-Marques KK, Kinker GS, Da Silveira Cruz-Machado S, De Lauro Castrucci AM. Non-Metastatic Cutaneous Melanoma Induces Chronodisruption in Central and Peripheral Circadian Clocks. International Journal of Molecular Sciences. 2018; 19(4):1065. https://doi.org/10.3390/ijms19041065
Chicago/Turabian StyleDe Assis, Leonardo Vinícius Monteiro, Maria Nathália Moraes, Keila Karoline Magalhães-Marques, Gabriela Sarti Kinker, Sanseray Da Silveira Cruz-Machado, and Ana Maria De Lauro Castrucci. 2018. "Non-Metastatic Cutaneous Melanoma Induces Chronodisruption in Central and Peripheral Circadian Clocks" International Journal of Molecular Sciences 19, no. 4: 1065. https://doi.org/10.3390/ijms19041065