Article

Comparative Genomics of the Balsaminaceae Sister Genera Hydrocera triflora and Impatiens pinfanensis

by
Zhi-Zhong Li
1,2,†,
Josphat K. Saina
1,2,3,†,
Andrew W. Gichira
1,2,3,
Cornelius M. Kyalo
1,2,3,
Qing-Feng Wang
1,3,* and
Jin-Ming Chen
1,3,*
1
Key Laboratory of Aquatic Botany and Watershed Ecology, Wuhan Botanical Garden, Chinese Academy of Sciences, Wuhan 430074, China
2
University of Chinese Academy of Sciences, Beijing 100049, China
3
Sino-African Joint Research Center, Chinese Academy of Sciences, Wuhan 430074, China
*
Authors to whom correspondence should be addressed.
These authors contributed equally to these work.
Int. J. Mol. Sci. 2018, 19(1), 319; https://doi.org/10.3390/ijms19010319
Submission received: 21 December 2017 / Revised: 13 January 2018 / Accepted: 15 January 2018 / Published: 23 January 2018
(This article belongs to the Special Issue Chloroplast)

Abstract

:
The family Balsaminaceae, which consists of the economically important genus Impatiens and the monotypic genus Hydrocera, lacks a reported or published complete chloroplast genome sequence. Therefore, chloroplast genome sequences of the two sister genera are significant to give insight into the phylogenetic position and understanding the evolution of the Balsaminaceae family among the Ericales. In this study, complete chloroplast (cp) genomes of Impatiens pinfanensis and Hydrocera triflora were characterized and assembled using a high-throughput sequencing method. The complete cp genomes were found to possess the typical quadripartite structure of land plants chloroplast genomes with double-stranded molecules of 154,189 bp (Impatiens pinfanensis) and 152,238 bp (Hydrocera triflora) in length. A total of 115 unique genes were identified in both genomes, of which 80 are protein-coding genes, 31 are distinct transfer RNA (tRNA) and four distinct ribosomal RNA (rRNA). Thirty codons, of which 29 had A/T ending codons, revealed relative synonymous codon usage values of >1, whereas those with G/C ending codons displayed values of <1. The simple sequence repeats comprise mostly the mononucleotide repeats A/T in all examined cp genomes. Phylogenetic analysis based on 51 common protein-coding genes indicated that the Balsaminaceae family formed a lineage with Ebenaceae together with all the other Ericales.

1. Introduction

The family Balsaminaceae of the order Ericales contains only two genera, Impatiens Linnaeus (1753:937) and Hydrocera Wight and Arnott (1834:140) and are predominantly perennial and annual herbs [1]. The monotypic genus Hydrocera, with a single species Hydrocera triflora, is characterized by actinomorphic flowers, a pentamerous calyx and corolla without any fusion between perianth parts, contrary to highly similar sister genus Impatiens whose flowers are highly zygomorphic [2]. Impatiens, one of the largest genera in angiosperms, consists of over 1000 species [3,4,5,6] primarily distributed in the Old World tropics, subtropics and temperate regions, but also in Europe, and central and North America [5,7]. In contrast, the sister Hydrocera, which is a semi-aquatic plant, is restricted to the lowlands of Indo-Malaysia [1]. Besides, the geographical regions, including south-east Asia, the eastern Himalayas, tropical Africa, Madagascar, southern India and Sri Lanka occupied by Impatiens, have been identified as diversity hotspots [7,8]. Recently, numerous new species have been recorded within these regions each year [9,10,11,12,13,14].
The controversial nature of classification of the genus Impatiens [1,15], for example different floral characters, its hybridization nature and species radiation, has made it under-studied. The species in prolific genus Impatiens are economically used as ornamentals, medicinal, as well as experimental research plant materials [16]. Additionally, previous studies have shown the genus Impatiens to possess potential anticancer compounds by decreasing patients’ cancer cell count and increasing their life span and body weight [17]. The glanduliferins A and B isolated from the stem act to inhibit the growth of human cancer cells for growth inhibitory activity of human cancer cells [18]. As well, some polyphenols from Impatiens stems have showed antioxidant and antimicrobial activities [19].
In angiosperms, the chloroplast genome (cp) typically has a quadripartite organization consisting of a small single copy (SSC, 16–27 kb) and one large single copy (LSC) of about 80–90 kb long separated by two identical copies of inverted repeats (IRs) of about 20–88 kb with the total complete chloroplast genome size ranging from 72 to 217 kb [20,21,22]. Most of the complete cp genomes contains 110–130 distinct genes, with approximately 80 genes coding for proteins, 30 tRNA and 4 rRNA genes [21]. In addition, due to the highly conserved gene order and gene content, they have been used in plant evolution and systematic studies [23], determining evolutionary patterns of the cp genomes [24], phylogenetic analysis [25,26], and comparisons of angiosperm, gymnosperm, and fern families [27]. Moreover, the cp genomes are useful in genetic engineering [28], phylogenetics and phylogeography of angiosperms [29], and estimation of the diversification pattern and ancestral state of the vegetation within the family [30].
The Ericales (Bercht and Presl) form a well-supported clade (Asterid) containing more than 20 families [31]. Up to now, complete cp genomes representing approximately half of the families in the order Ericales have been sequenced including: Actinidiaceae [32,33], Ericaceae [34,35], Ebenaceae [36], Sapotaceae [37], Primulaceae [38,39] Styracaceae [40], and Theaceae, Pentaphylacaceae, Sladeniaceae, Symplocaceae, Lecythidaceae [30]. In addition the Impatiens and Hydrocera intergeneric phylogenetic relationship has been done using chloroplast atpB-rbcL spacer sequences [4]. However, there are no reports of complete chloroplast genomes in the family Balsaminaceae to date. This limitation of genetic information has hindered the progress and understanding in taxonomy, phylogeny, evolution and genetic diversity of Balsaminaceae. Analyses of more cp genomes are needed to provide a robust picture of generic and familial relationships of families in order Ericales.
This study aims to determine the complete sequences of the chloroplast genomes of I. pinfanensis (Hook. f.) and H. triflora using a high-throughput sequencing method. Additionally, comparisons with other published cp genomes in the order Ericales will be made in order to determine phylogenetic relationships among the representatives of Ericales.

2. Results and Discussion

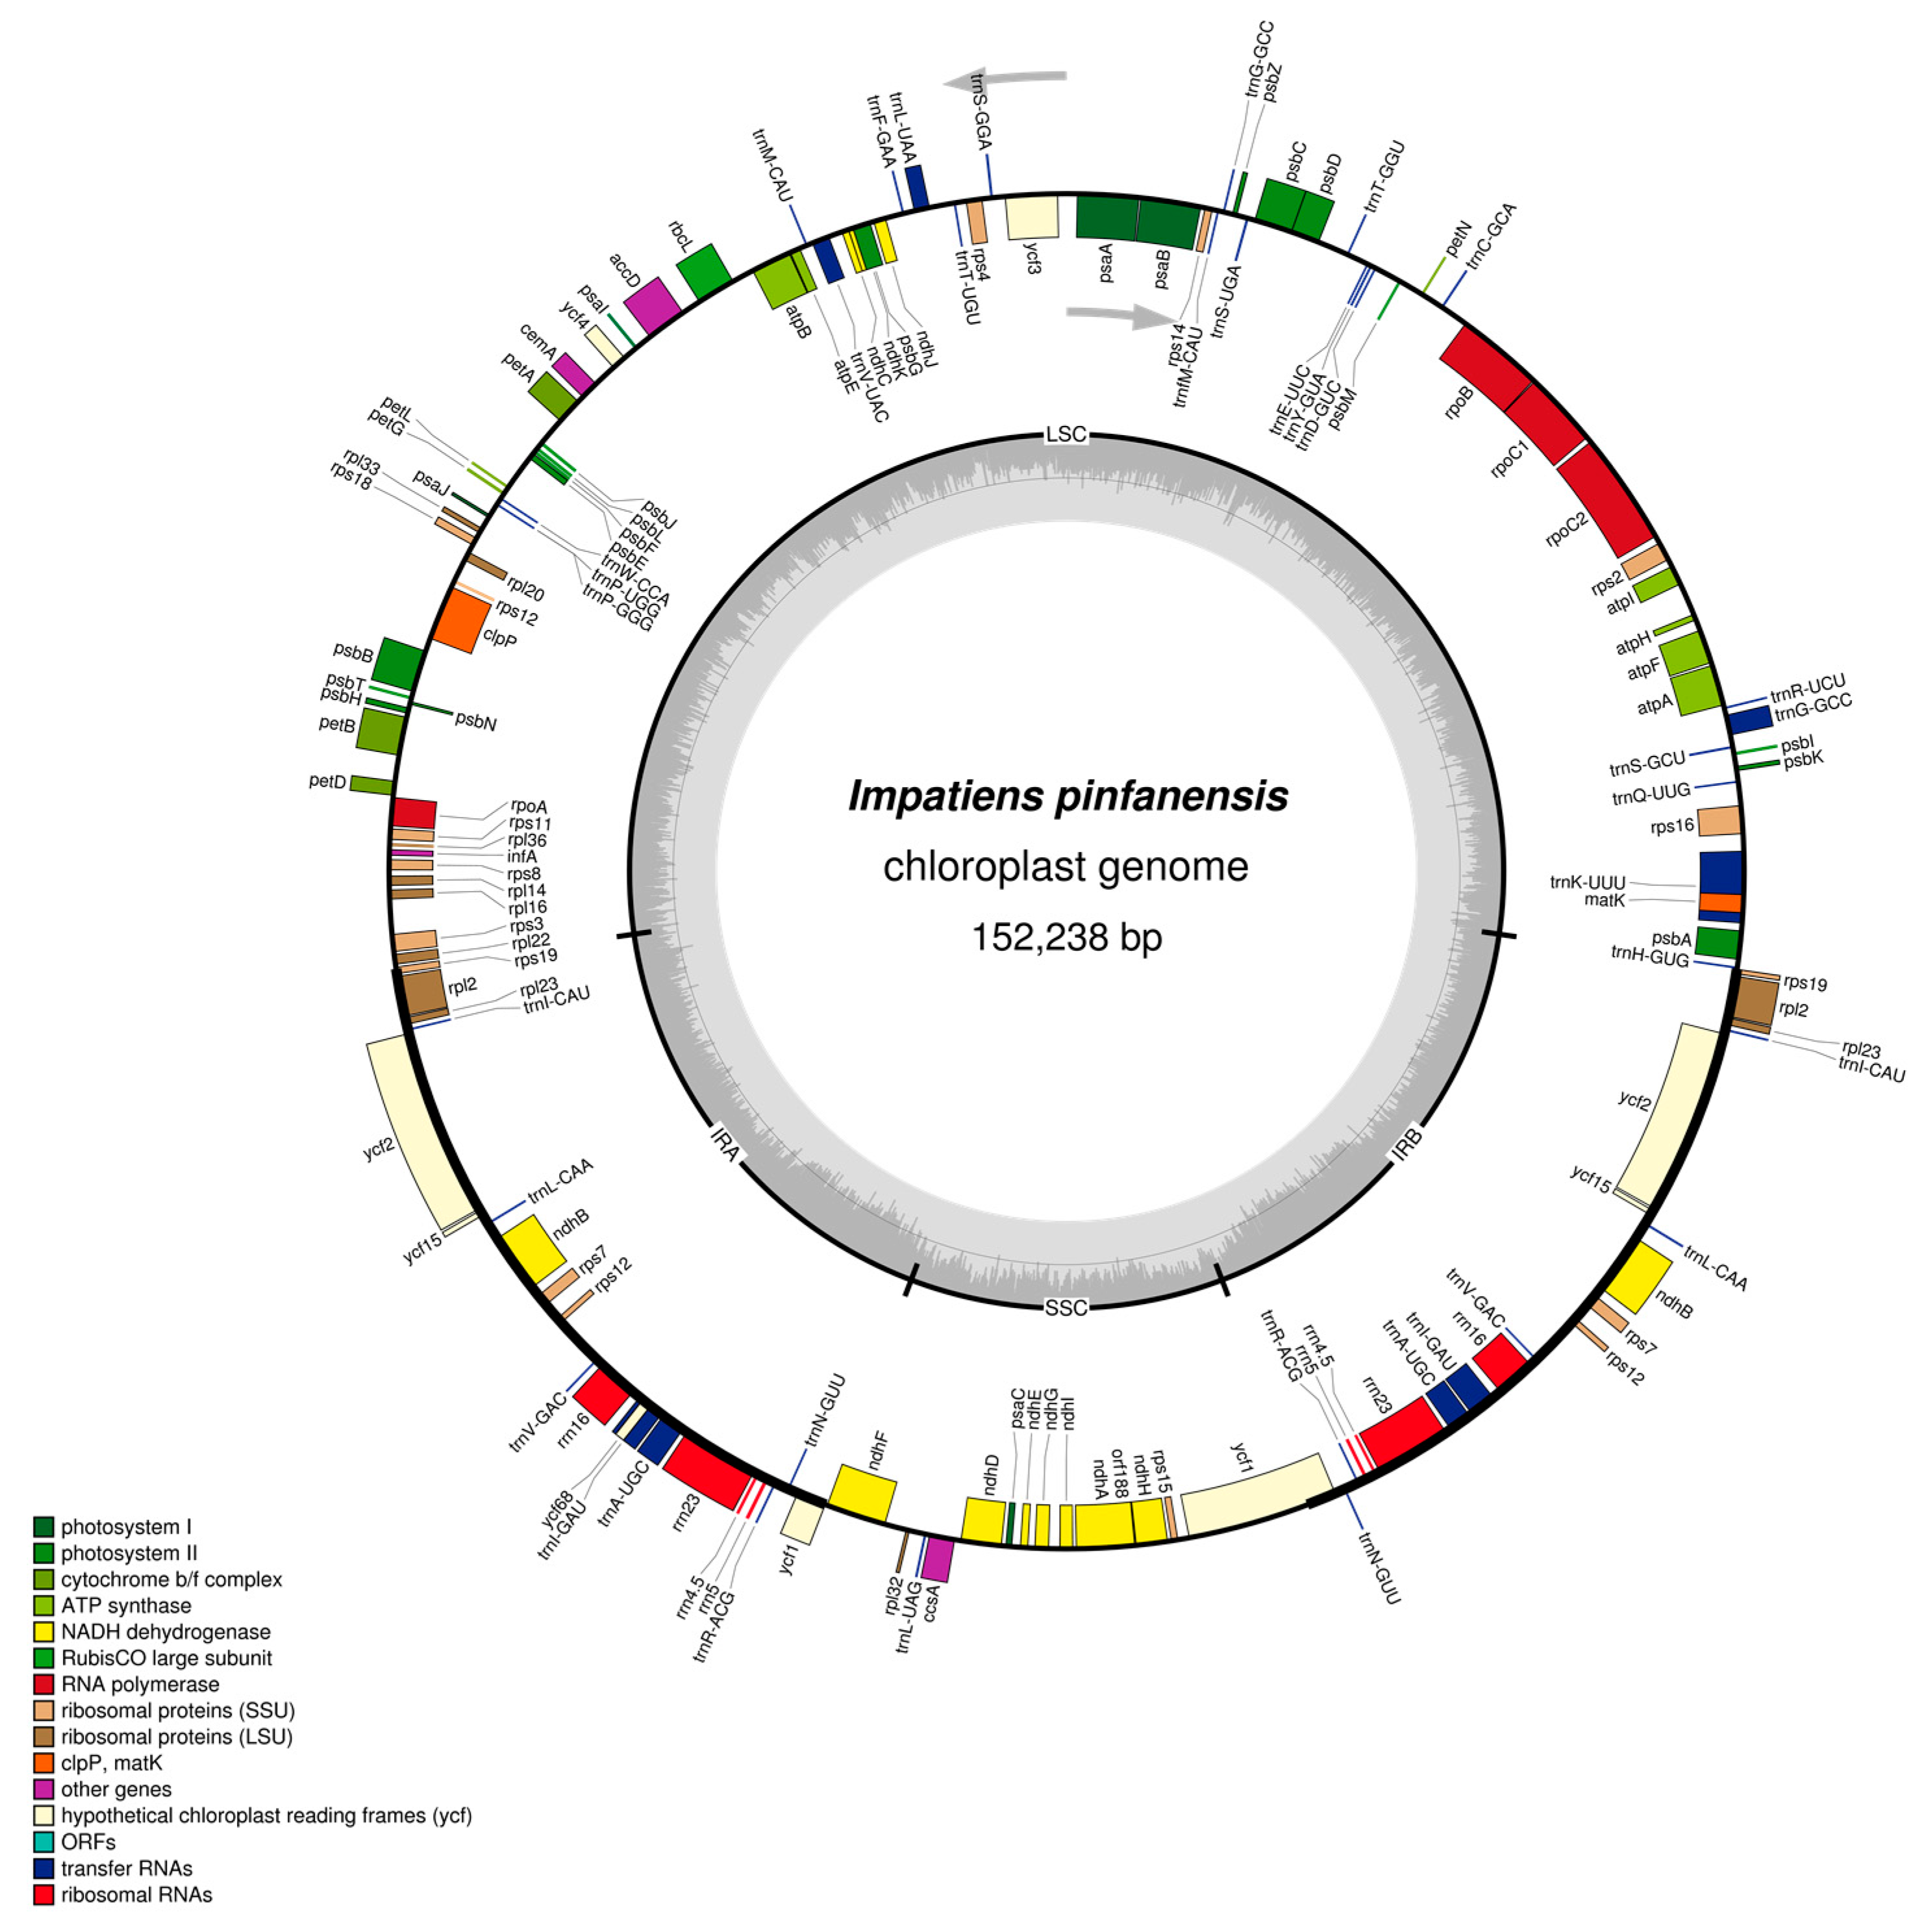
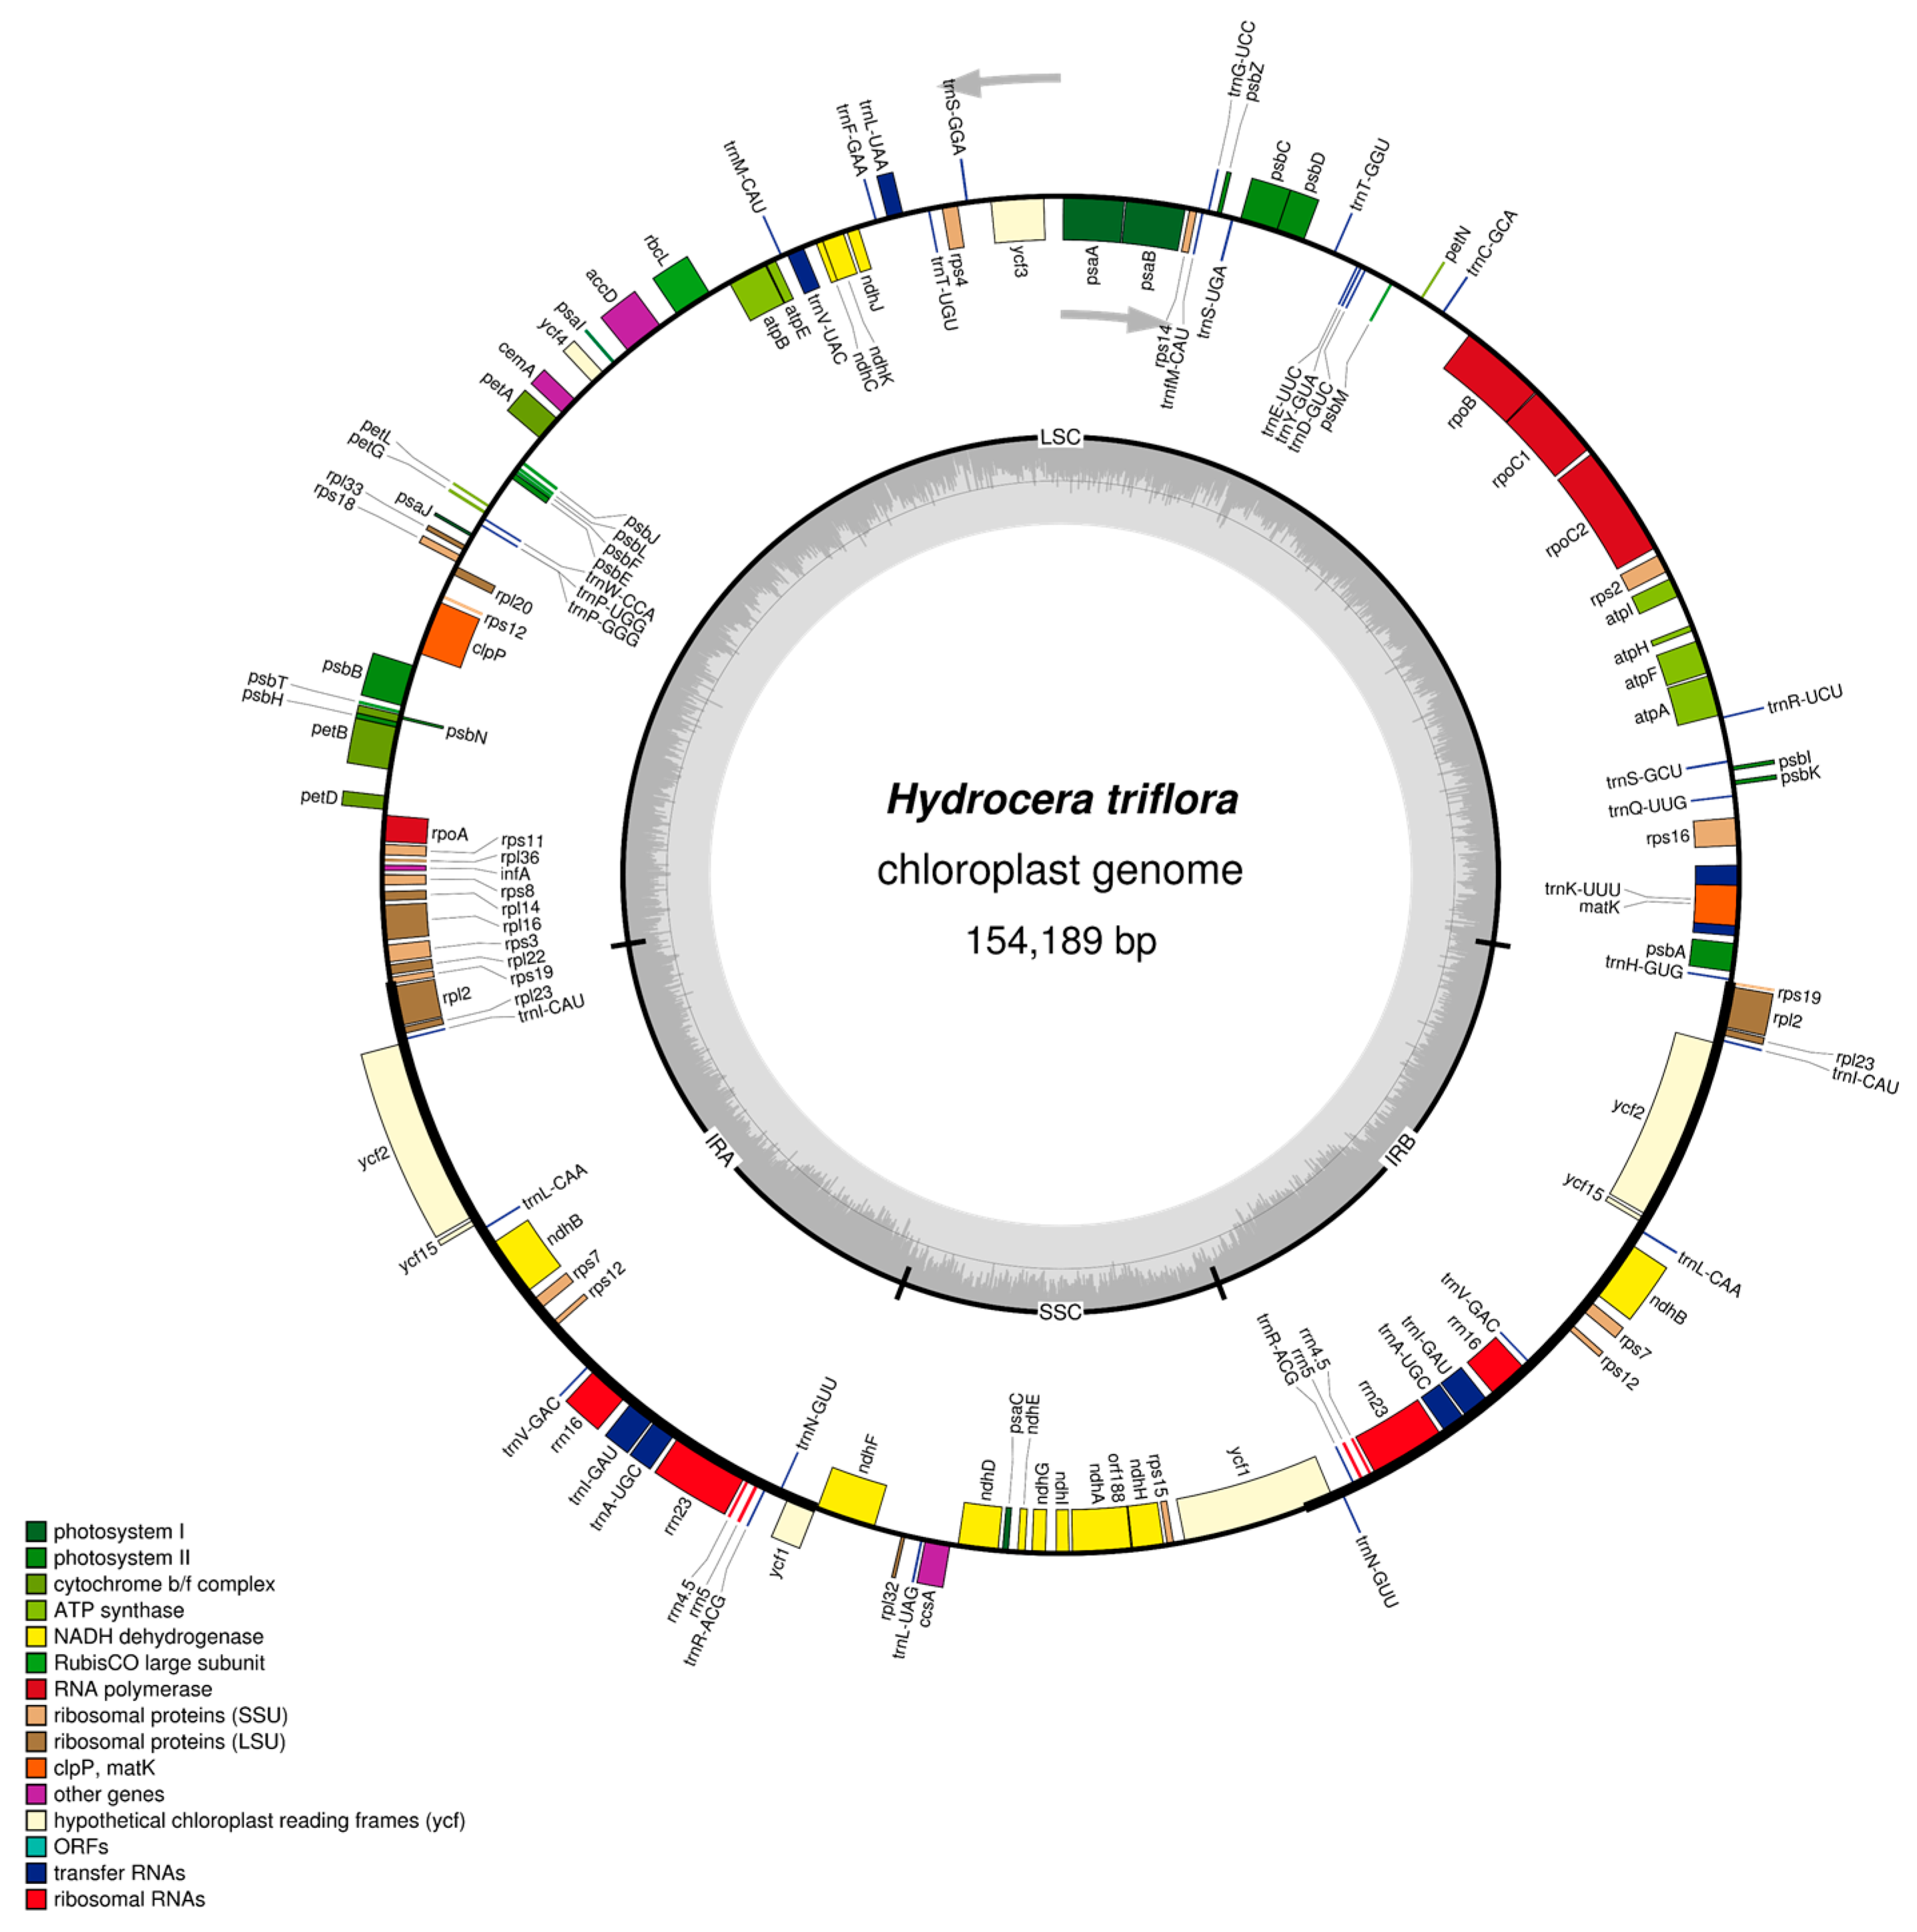
2.1. The I. pinfanensis and H. triflora Chloroplast Genome Structure and Gene Content

The complete chloroplast genomes of I. pinfanensis and H. triflora share the common feature of possessing a typical quadripartite structure composed of a pair of inverted repeats (IRs) separating a large single copy (LSC) and a small single copy (SSC), similar to other angiosperm cp genomes [23]. The cp genome size of I. pinfanensis is 154,189 bp, with a pair of inverted repeats (IRs) of 17,611 bp long that divide LSC of 83,117 bp long and SSC of 25,755 bp long (Table 1). On the other hand, the H. triflora complete cp genome is 152,238 bp in length comprising a LSC region of 84,865 bp in size, a SSC of 25,622 bp size, and a pair of IR region 18,082 bp each in size. The overall guanine-cytosine (GC) contents of I. pinfanensis and H. triflora genomes are 36.8% and 36.9% respectively. Meanwhile, the GC contents in the LSC, SSC, and IR regions are 34.5%/34.7%, 29.3%/29.9%, and 43.1%/43.1% respectively.
Like in typical angiosperms, both I. pinfanensis and H. triflora cp genomes encode 115 total distinct genes of which 80 are protein coding, 31 distinct tRNA and four distinct rRNA genes. Of these 62 genes coding for proteins and 23 tRNA genes were located in the LSC region, seven protein-coding genes, all the four rRNA genes and seven tRNA genes were replicated in the IR regions, while the SSC region was occupied by 11 protein-coding genes and one tRNA gene. The ycf1 gene was located at the IR and SSC boundary region (Figure 1 and Figure 2).
Among the 115 unique genes in I. pinfanensis and H. triflora cp genomes, 14 genes contain one intron, comprised of eight genes coding for proteins (atpF, rpoC1, rpl2, petB, rps16, ndhA, ndhB, ndhK) and six tRNAs (trnL-UAA, trnV-UAC, trnK-UUU, trnI-GAU, trnG-GCC and trnA-UGC) (Table 2), while ycf3, clpP and rps12 genes each contain two introns. These genes have maintained intron content in other angiosperms. The trans-splicing gene rps12 has its 5′exon located in LSC, whereas the 3′exon is located in the IRs, which is similar to that in Diospyros species (Ebenaceae) [36,41] and Actinidia chinensis (Actinidiaceae) [41]. Oddly, rps19 and ndhD genes in both species begin with uncommon start codons GTG and ACG respectively, which is consistent with previous reports in other plants [36]. However, the standard start codon can be restored through RNA editing process [42,43].
The complete cp genome of I. pinfanensis and H. triflora were found to be similar, although some slight variations such as genome size, gene loss and IR expansion and contraction factors were detected, despite the two species being from the same family Balsaminaceae. For instance, H. triflora cp genome is 1951 bp smaller than that of sister species I. pinfanensis. The SSC region of I. pinfanensis is shorter (17,611 bp) compared to that of H. triflora, which is 18,082 bp long. The GC content of H. triflora is slightly higher (36.9%) than that of I. pinfanensis (36.8%). Both species possess highest GC values in the IR regions (43.1%) compared to LSC and SSC region showing the lowest values (34.5%/34.7% and 29.3%/29.9%) respectively. The IR region is more conserved than the single copy region (SSC) in both species, due to presence of conserved rRNA genes in the IR region, which is also the reason for its high GC content. Both cp genomes are AT-rich with the genome organization and content of the two species almost the same and highly conserved, these results are similar to those of other recently published Ericales chloroplast genomes [34,36].

2.2. Codon Usage

The relative synonymous codon usage (RSCU) has been divided into four models, i.e., RSCU value of less than 1.0 (lack of bias), RSCU value between 1.0 and 1.2 (low bias), RSCU value between 1.2 and 1.3 (moderately bias) and RSCU value greater than 1.3 (highly bias) [44,45]. To determine codon usage, we selected 52 shared protein-coding genes between I. pinfanensis and H. triflora with length of >300 bp for calculating the effective number of codons. As shown in (Table 3), the relative synonymous codon usage (RSCU) and codon usage revealed biased codon usage in both species with values of 30 codons showing preferences (<1) except tryptophan and methionine, with 29 having A/T ending codons. The TAA stop codon was found to be preferred. All the protein-coding genes contained 22,900 and 22,995 codons in I. pinfanensis and H. triflora cp genomes respectively. In addition, our results indicated that 2408 and 2439 codons encode leucine while 253 and 259 encode cysteine in I. pinfanensis and H. triflora cp genomes as the most and least frequently universal amino acids respectively. The Number of codons (Nc) of the individual PCGs varied from petD (37.10) to ycf3 (54.84) and rps18 (32.11) to rpl2 (54.24) in I. pinfanensis and H. triflora respectively (Table S1). Like recently reported in cp genomes of higher plants, our study showed that there was bias in the usage of synonymous codons except tryptophan and methionine. Our result is in line with previous findings of codon usage preference for A/T ending in other land plants [46,47].

2.3. SSR Analysis Results

Analysis of SSR occurrence using the microsatellite identification tool (MISA) detected Mono-, di-, tri-, tetra-, penta- and hexa-nucleotides categories of SSRs in the cp genomes of eight Ericales. A total of 197 and 159 SSRs were found in the I. pinfanensis and H. triflora cp genomes respectively. Not all the SSR types were identified in all the species, Penta and hexanucleotide repeats were not found in I. pinfanensis, Diospyros lotus, and Pouteria campechiana, while only hexanucleotides were not identified in Ardisia polysticta and Barringtonia fusicarpa (Table 4). Among the SSR types discovered mononucleotide repeat units were highly represented, which were found 180 and 141 times in I. pinfanensis and H. triflora respectively. Most of the mononucleotide repeats consisting of A or T were most common (117–176 times), whereas C/G were less in number (1–8 times), and all the dinucleotide repeat sequences in all the species were AT repeats. This result is consistent with previous reports, which showed most angiosperm cp genome to be AT-rich [36,38,48].

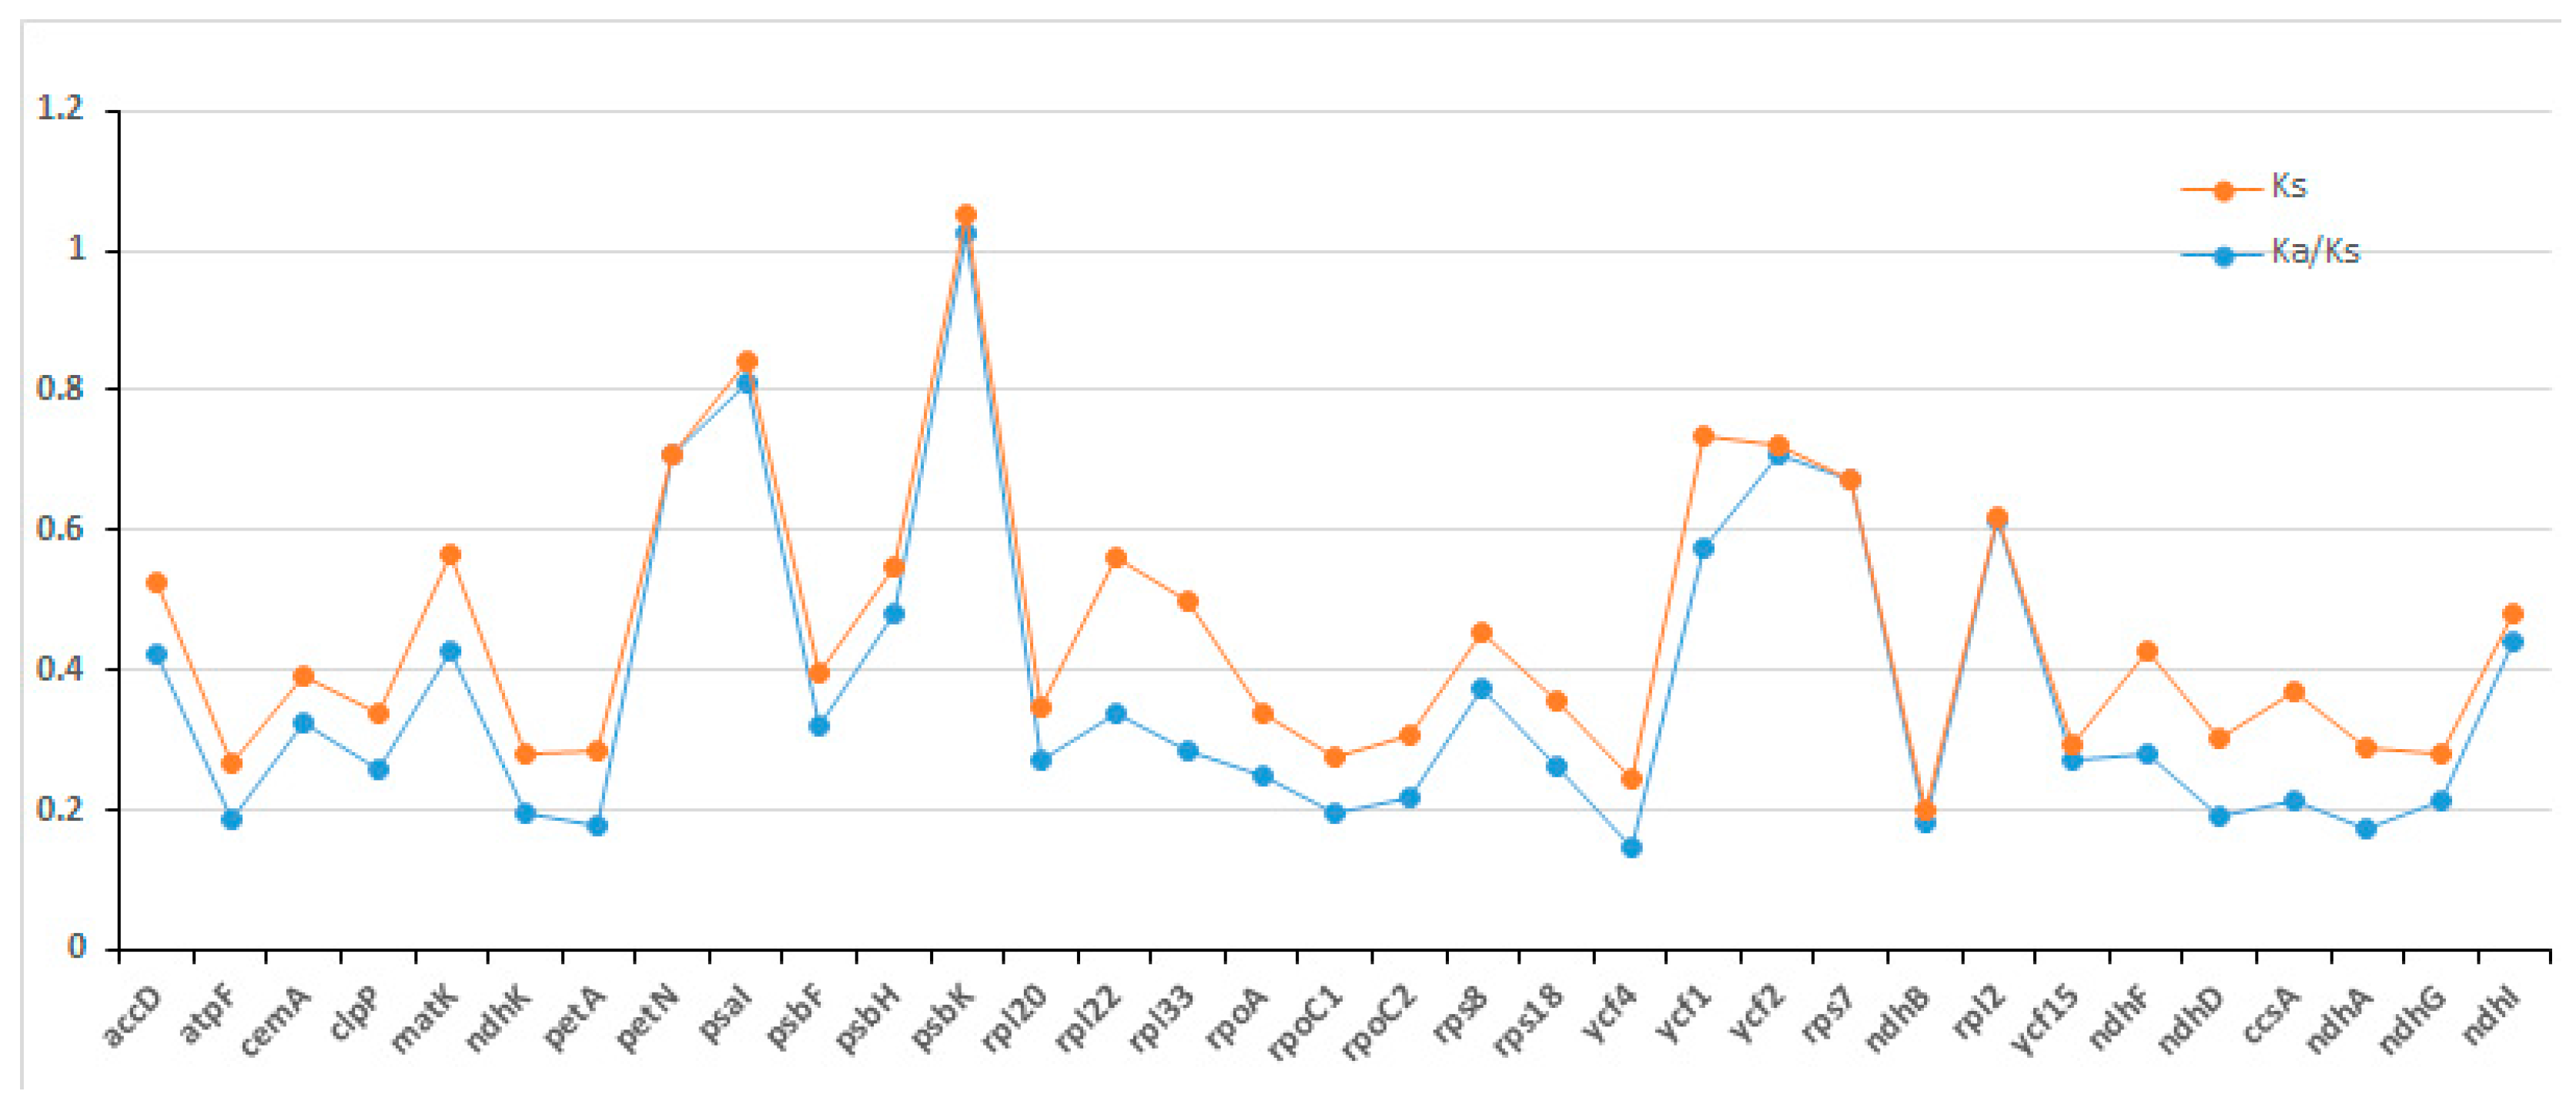
2.4. Selection Pressure Analysis of Evolution

The ratio of Synonymous (Ks) and non-synonymous (Ka) Substitution can determine whether the selection pressure has acted on a particular protein-coding sequence. Eighty common protein-coding genes shared by I. pinfanensis and H. triflora genomes were used. As suggested by Makałowski and Boguski [49] the Ka/Ks values are less than one in protein-coding genes as a result of less frequent non-synonymous (Ka) nucleotide Substitutions than the Synonymous (Ks) substitutions (Table S2). We found that the Ka/Ks values of the two species were low (<1) approaching zero, except for one gene psbK found in the LSC region, which has a ratio of 1.0259 (Figure 3). This indicates a negative selection all genes except psbK gene and shows that the protein-coding genes in both species are quite highly conserved (Table S2). The LSC, SSC, and IR regions average Ks values between the two species were 0.0995, 0.0314, and 0.1334 respectively. Based on Ka/Ks comparison among the regions, only ycf1 gene in IR region and most of the genes in the LSC and SSC regions revealed higher Ks values. The higher Ks values signaled that on average more genes found in the SSC region have experienced higher selection pressures in contrast to other cp genome regions (LSC and IR). The non-synonymous (Ka) value varied from 0.005 (psbE) to 0.0927 (ycf1) while Ks ranged from 0.058 (psbN) to 0.2944 (ndhE). Based on sequence similarity among the IR, SSC and LSC regions, the IR region was more conserved. This is in agreement with previous reports that found out that IR region diverged at a slower rate than the LSC and SSC regions as a result of frequent recombinant events taking place in IR region leading to selective constraints on sequence homogeneity [50,51].

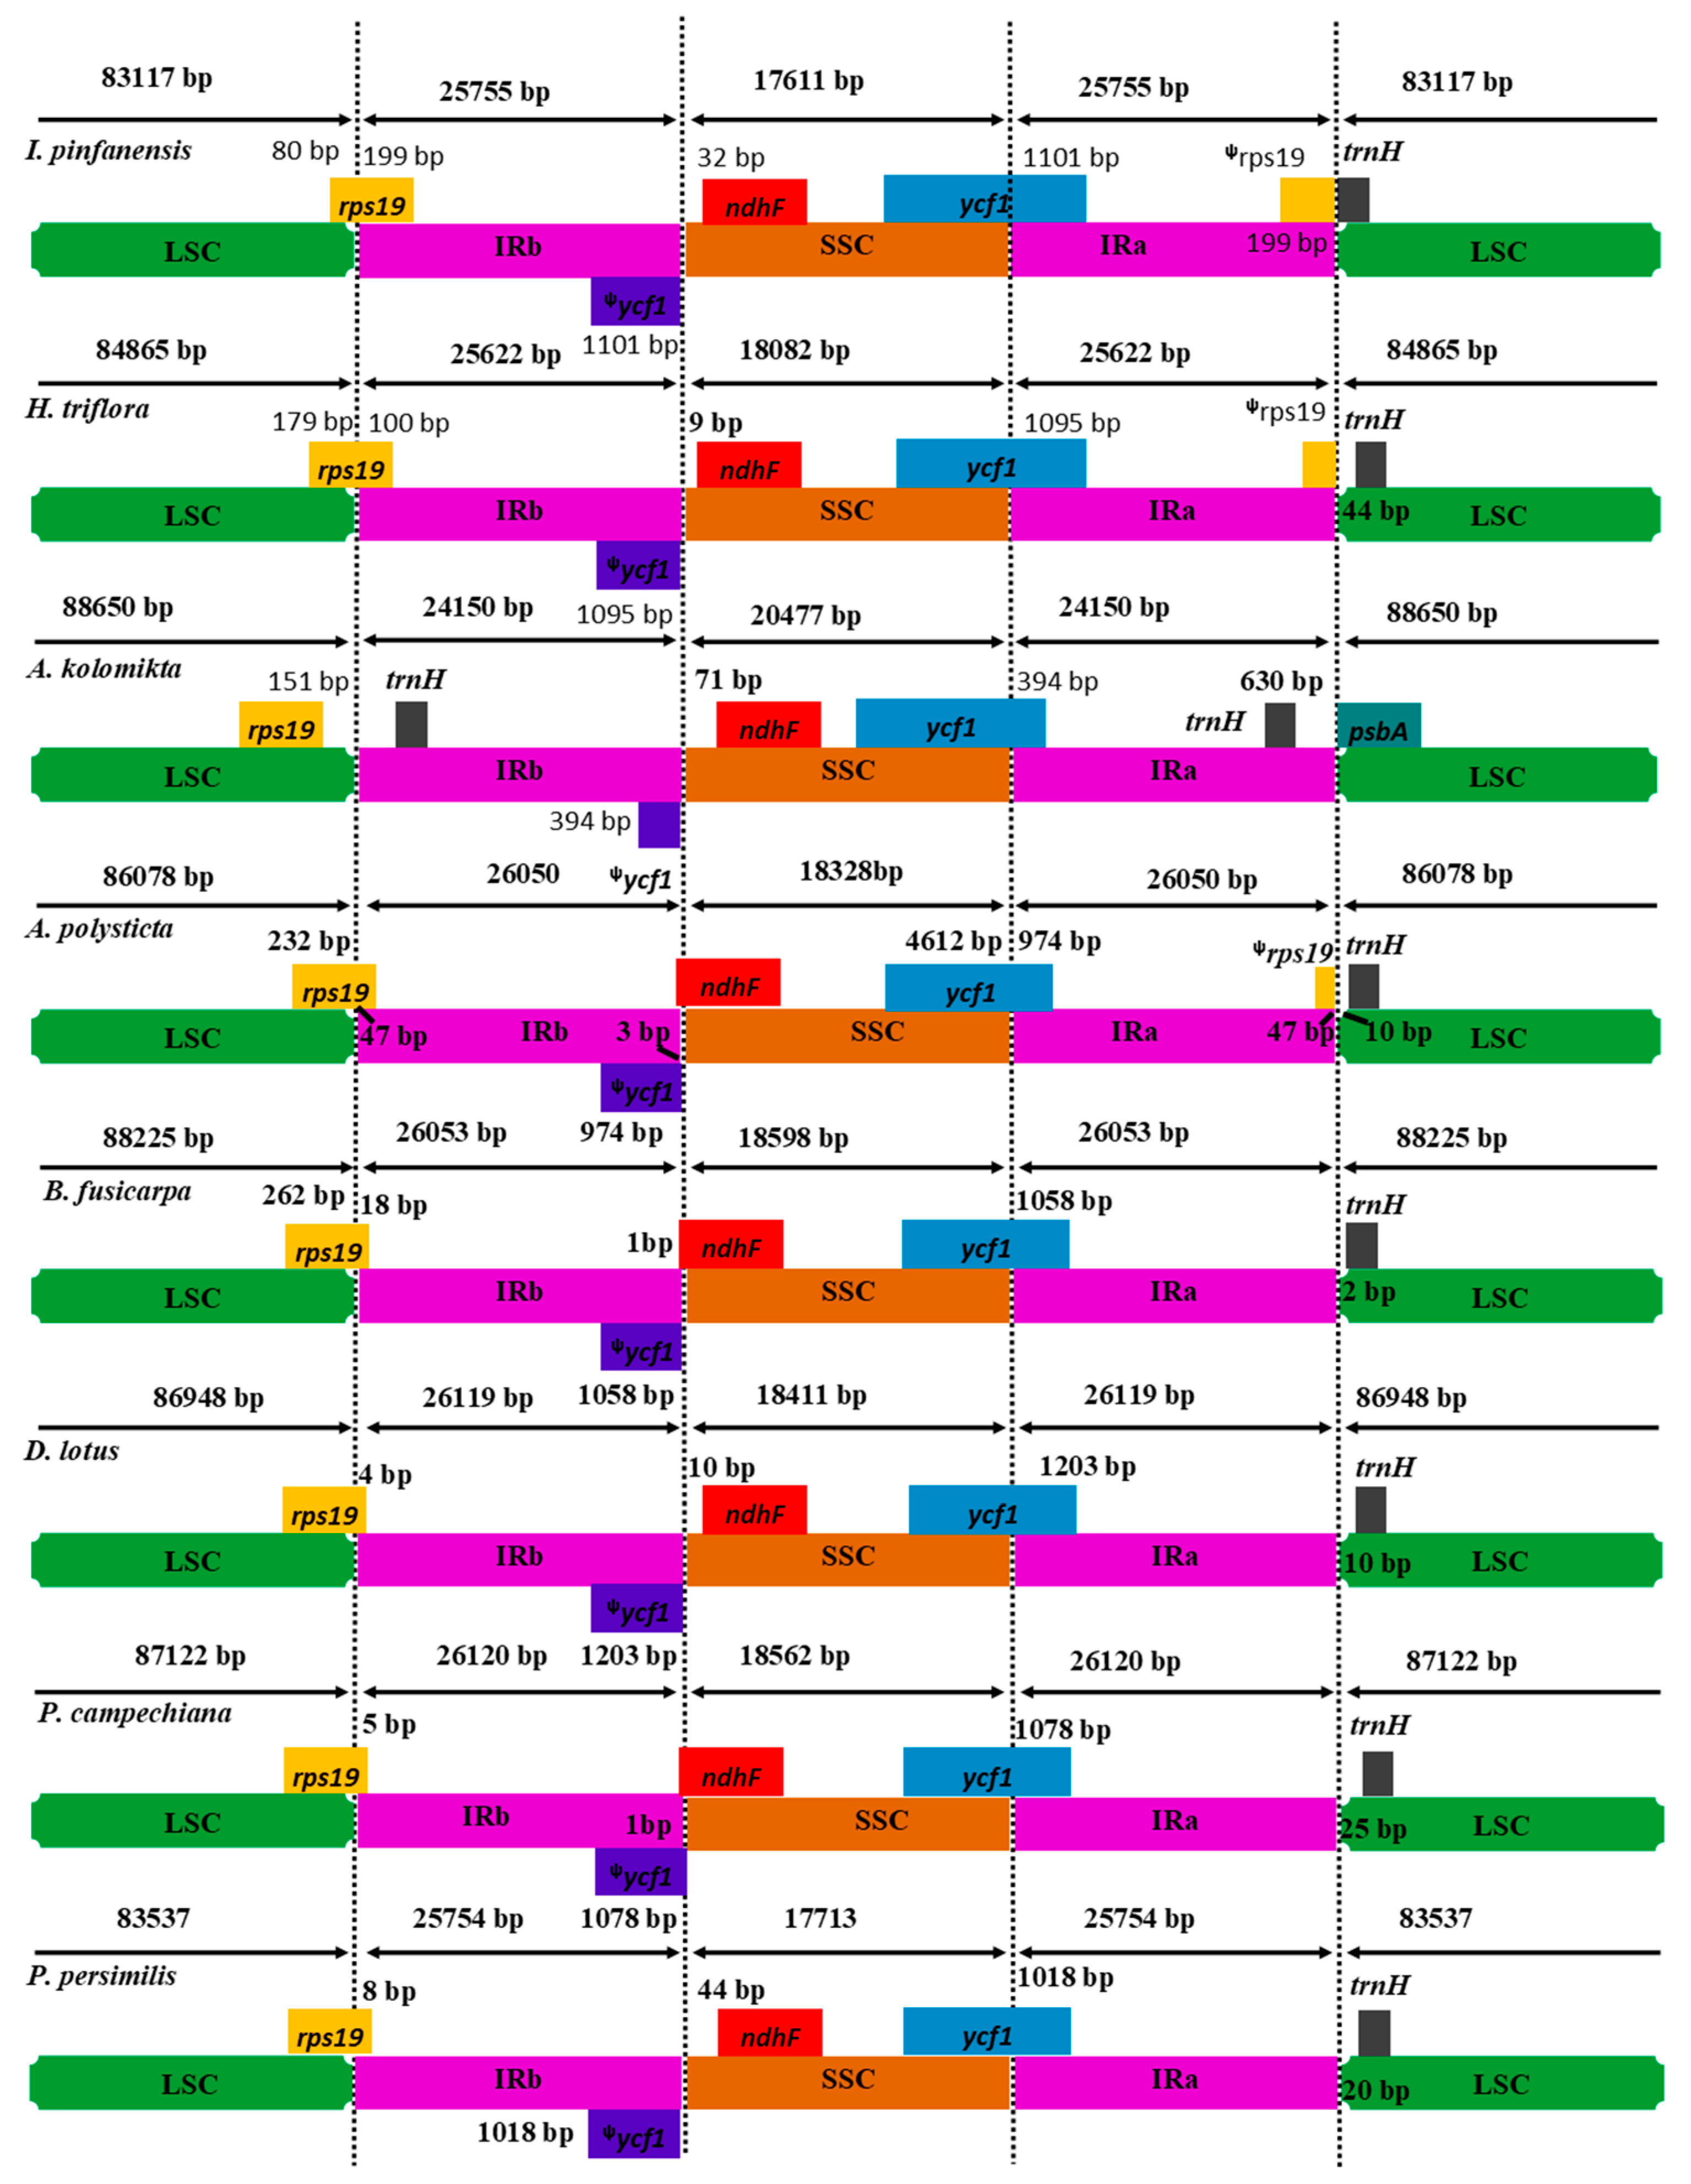
2.5. IR Expansion and Contraction

Despite of the highly conserved nature of the angiosperms inverted repeat (IRa/b) regions, the contraction or expansion at the IR junction are the usual evolutionary events resulting in varying cp genome sizes [52,53]. In our study, the IR/SSC and IR/LSC borders of I. pinfanensis and H. triflora were compared to those of the other six Ericales representatives (P. persimilis, P. campechiana, D. lotus, B. fusicarpa, A. kolomikta and A. polysticta) to identify the IR expansion or contraction (Figure 4). The IRb/SSC boundary expansions in all the eight species extended into the ycf1 genes creating long ᵠycf1 pseudogene fragments with varying length. The ycf1 pseudogene length in I. pinfanensis is 1101 bp, 1095 bp in H. triflora, 394 bp in A. kolomikta, 974 bp in A. polysticta, 1058 bp in B. fusicarpa, 1203 bp in D. lotus, 1078 bp in P. campechiana and 1018 bp in P. persimilis. Additionally, the ndhF gene is situated in the SSC region in I. pinfanensis, H. triflora, A. kolomikta, D. lotus, and P. persimilis, and it ranges from 32 bp, 9 bp, 71 bp, 10 bp and 44 bp away from the IRb/SSC boundary region respectively, but this gene formed an overlap with the ycf1 pseudogene in A. polystica, B. fusicarpa and P. campechiana cp genomes sharing some nucleotides of 3 bp, 1 bp and 1 bp in that order. The rps19 gene is located at the /IRb/LSC junction, of I. pinfanensis, H. triflora and of the other five cp genomes, apart from A. kolomikta in which this gene is found in the LSC region, 151 bp gap from the LSC/IRb junction. Moreover, the occurrence of rps19 gene at the LSC/IRb junction resulted in partial duplication of this gene at the corresponding region (IRa/LSC border) in I. pinfanensis, H. triflora, and A. polysticta cp genomes. The trnH gene is detected in the LSC region in I. pinfanensis and H. triflora. However, complete gene rearrangement of this trnH gene was observed resulting in complete duplication in the IR in the A. kolomikta chloroplast genome, 630 bp apart from the IR/LSC junction with psbA gene extending towards LSC/IRa border, however this gene is found in the LSC regions of the other five chloroplast genomes.
The border regions of the Ericales revealed that the I. pinfanensis and H. triflora cp genomes varied a little compared to other analyzed cp genomes. As shown in Figure 4, our analyses confirmed the IR evolution as revealed by the incomplete rps19 gene, which was duplicated in the IR region in I. pinfanensis, H. triflora, and A. polysticta. Conversely, this rps19 gene was not duplicated among the remaining representatives of Ericales cp genomes. In a recent study [36,54] found that the trnH gene duplication occurs in Actinidiaceae, and Ericaceae. This duplication of genes in the LSC/IRb junction and the IRa/LSC junction would be of great importance in systematic studies. Furthermore, the rps19 gene at the LSC/IRb in I. pinfanensis and H. triflora is largely extended into the IRb region (199 bp and 100 bp) respectively. The SSC region of I. pinfanensis is 471 bp smaller than that of sister species H. triflora, but also smallest among the other species used in this study. Additionally, the I. pinfanensis LSC region is smaller than that of other species. Previous studies have shown that there is expansion of single copy (SC) and IR regions of angiosperms cp genomes during evolution [50,55], the I. pinfanensis and H. triflora cp genomes revealed that the border areas were highly conserved despite of slight genome size differences between the two species.

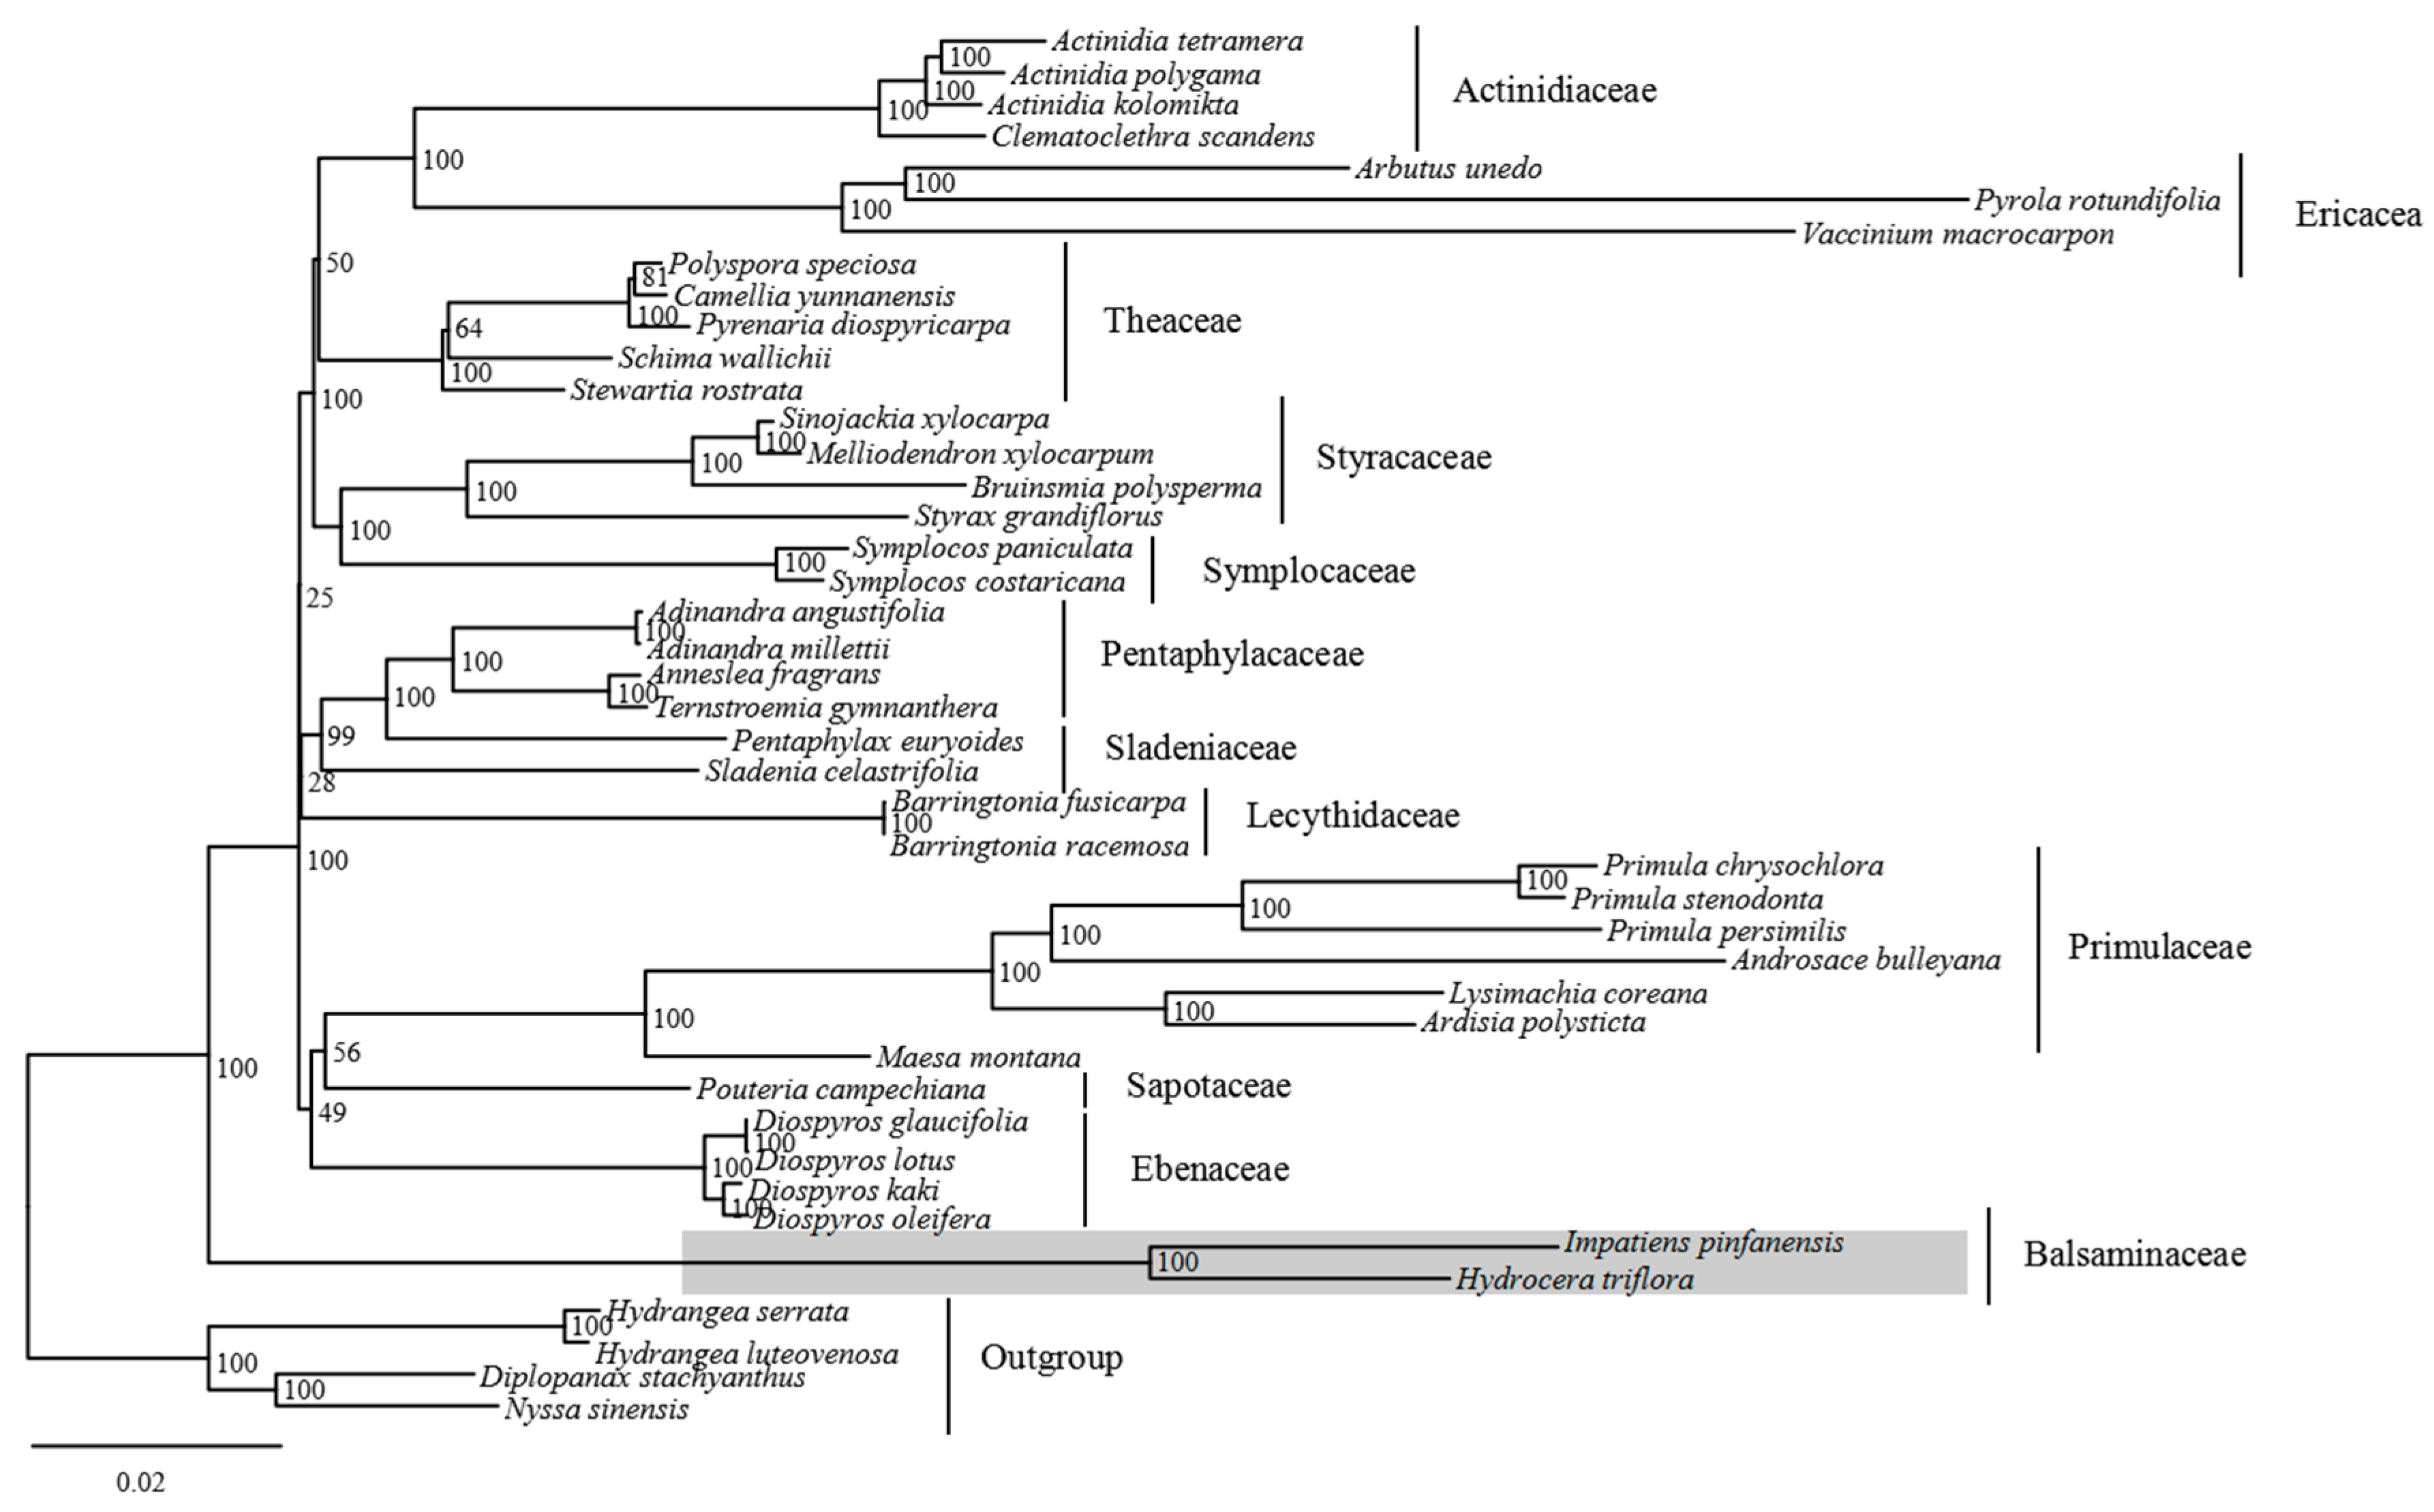
2.6. Phylogenetic Analysis

Phylogenetic relationships within the order Ericales have been resolved in recent published reports but the position of Balsaminaceae still remains controversial [33,35,36,37,38,39,40]. In our study, the phylogenetic relationship of I. pinfanensis, and H. triflora and 38 other species of Ericales downloaded from GenBank (Table S3) was determined, with four cp genomes sequences belonging to Cornales being used as Outgroup species. Fifty-one common protein-coding sequences in all the selected cp genomes employed a single alignment data matrix of a total 35,548 characters (Supplementary Materials File S4). Almost all the nodes in the phylogenetic tree showed a strong bootstrap support. Though, Sapotaceae and Ebenaceae had low support (bootstrap < 70), this could be as a result of fewer samples in these families (Figure 5). I. pinfanensis and H. triflora as sister taxa (Balsaminaceae) formed the basal family of Ericales with intensive support. In general, all the 38 species together with the two Balsaminaceae family species formed a lineage (Ericales) recognizably discrete from the four outgroup species (Cornales). All the species grouped together into 10 clades corresponding to the 10 families in order Ericales according to APGIV system [31]. This study will provide resources for species identification and resolution of deeper phylogenetic branches among Impatiens and Hydrocera genera.

3. Materials and Methods

3.1. Plant Materials and DNA Extraction

Total genomic DNA was extracted from fresh leaves of the I. pinfanensis and H. triflora collected from Hubei province (108°42′19′′ E, 30°12′33′′ N) and Hainan province (110°18′57′′ E, 19°23′10′′ N) in China using a modified cetyltrimethylammonium bromide (CTAB) method [56]. The DNA quality was checked using spectrophotometry and their integrity examined by electrophoresis in 2% agarose gel. The voucher specimens (HIB-lzz07, HIB-lzz18) were deposited at the Wuhan Botanical Garden herbarium (HIB).

3.2. Chloroplast Genome Sequence Assembly and Annotation

The pair-end libraries were constructed using the Illumina Hiseq 2500 platform at NOVOgene Company (Beijing, China) with an average insert size of approximately 150 bp for each genome. The high-quality reads were filtered from Illumina raw reads using the PRINSEQ lite v0.20.4 (San Diego State University, San Diego, CA, USA) [57] (phredQ ≥ 20, Length ≥ 50), then assembled with closely related species cp genome using a BLASTn (with E value of 10−6) with Primula chrysochlora (NC_034678) and Diospyros lotus (NC_030786) as reference species. In addition, the software Velvet v1.2.10 (Wellcome Trust Genome Campus, Hinxton, Cambridge, UK) [58] was used to assemble the obtained reads with K-mer length of 99–119. Then, consensus sequences with reference chloroplast genome was mapped using GENEIOUS 8.0.2 (Biomatters Ltd., Auckland, New Zealand) [59]. We used the online software local blast to verify the single copy (SC) and inverted repeat (IR) boundary regions of the assembled sequences.
The annotations of the complete cp genomes were performed using DOGMA (Dual Organellar GenoMe Annotator, University of Texas at Austin, Austin, TX, USA) [60]. The start and stop codons positions were further checked by local blast searches. Further, the tRNAs locations were confirmed with tRNAscan-SE v1.23 (http://lowelab.ucsc.edu/tRNAscan-SE/) [61]. The circular cp genome maps were generated using an online program (OGDrawV1.2, Max planck Institute of Molecular Plant Physiology, Potsdam, Germany) OrganellarGenomeDraw [62] with default settings plus manual corrections. Putative tRNAs, rRNAs and protein-coding genes were corrected by comparing them with the more similar reference species Primula chrysochlora (NC_034678) and Diospyros lotus (NC_030786) resulting from BLASTN and BLASTX searches against the nucleotide database NCBI (https://blast.ncbi.nlm.nih.gov/). The cp genome sequences were submitted to GenBank database, accession numbers I. pinfanensis (MG162586) and H. triflora (MG162585).

3.3. Genome Comparison and Structure Analyses

The IR and SC boundary regions of I. pinfanensis and H. triflora, and the other six Ericales species were compared and examined. For synonymous codon usage analysis, about 52 protein-coding genes of length > 300 bp were chosen. Online program CodonW1.4.2 (http://downloads.fyxm.net/CodonW-76666.html) was used to investigate the Nc and RSCU parameters. The simple sequence repeats (SSRs) of the two study species and other Ericales representatives were detected using MISA software [63] with SSR search parameters set same as Gichira et al. [48].

3.4. Substitution Rate Analysis—Synonymous (Ks) and Non-Synonymous (Ka)

We examined substitution rates synonymous (Ks) and non-synonymous (Ka) using Model Averaging in the KaKs_Cal-culator program (Institute of Genomics, Chinese Academy of Sciences, Beijing, China) [64]. Eighty common protein-coding genes shared by the I. pinfanensis and H. triflora were aligned separately using Geneious software v5.6.4 (Biomatters Ltd., Auckland, New Zealand) [59].

3.5. Phylogenetic Analyses

To locate the phylogenetic positions of I. pinfanensis and H. triflora (Balsaminaceae) within order Ericales, the chloroplast genome sequences of 38 species belonging to order Ericales and four Cornales species as outgroups, were used to reconstruct a phylogenetic relationships tree. The Phylogenetic tree was performed based on maximum likelihood (ML) analysis using RAxMLversion 8.0.20 (Scientific Computing Group, Heidelberg Institute for Theoretical Studies, Institute of Theoretical Informatics, Karlsruhe Institute of Technology, Karlsruhe, Germany) [65]. Consequently, based on the Akaike information criterion (AIC), the best-fitting substitution models (GTR + I + G) were selected (p-inv = 0.47, and gamma shape = 0.93) from jModelTest v2.1.7 [66]. The bootstrap test was performed in algorithm of RAxML with 1000 replicates.

4. Conclusions

The cp genomes of I. pinfanensis, and H. triflora from the family Balsaminaceae provide novel genome sequences and will be of benefit as a reference for further complete chloroplast genome sequencing within the family. The genome organization and gene content are well conserved typical of most angiosperms. Fifty protein-coding sequences, shared by selected species from Ericales as well as our study species, were used to construct the phylogenetic tree using the maximum likelihood (ML). Majority of the nodes showed strong bootstrap support values, and the few nodes with low support, should be solved using other methods (e.g., restriction-site-associated DNA sequencing). The two species (I. pinfanensis, and H. triflora) were placed close to each other. These findings strongly support Balsaminaceae as a basal family of the order Ericales. Lastly, the Balsaminaceae (I. pinfanensis, and H. triflora) has a relationship with the other 38 species, which are all grouped into one Clade (Ericales). This study will be of value in determining genome evolution and understanding phylogenomic relationships within Ericales and give precious resources for the evolutionary study of Balsaminaceae.

Supplementary Materials

Supplementary materials can be found at https://www.mdpi.com/1422-0067/19/1/319/s1.

Acknowledgments

This study was supported by the Special Funds for the Young Scholars of Taxonomy of Chinese Academy of Sciences grants to Liao Kuo (Grant number; ZSBR-013), the Special Foundation for State Basic Working Program of China (2013FY112300) and the National Natural Science Foundation of China (grant no. 31570220).

Author Contributions

Qing-Feng Wang and Jin-Ming Chen conceived and designed the experiment; Zhi-Zhong Li, Josphat K. Saina, Andrew W. Gichira and Cornelius M. Kyalo assembled sequences and revised the manuscript; Zhi-Zhong Li and Josphat K. Saina performed the experiments, analyzed the data and wrote the paper; Jin-Ming Chen and Zhi-Zhong Li collected the plant materials. All authors have read and approved the final version of the manuscript.

Conflicts of Interest

The authors declare no conflict of interest.

Abbreviations

IRInverted repeat
LSCLarge single copy
SSCSmall single copy
SSRSimple sequence repeats
RSCURelative synonymous codon usage

References

  1. Grey-Wilson, C. Impatiens of Africa; Morphology, Pollination and Pollinators, Ecology, Phytogeography, Hybridization, Keys and a Systematics of All African Species with a Note on Collecting and Cultivation; AA Balkema: Rotterdam, The Netherlands, 1980. [Google Scholar]
  2. Janssens, S.B.; Smets, E.F.; Vrijdaghs, A. Floral development of Hydrocera and Impatiens reveals evolutionary trends in the most early diverged lineages of the Balsaminaceae. Ann. Bot. 2012, 109, 1285–1296. [Google Scholar] [CrossRef] [PubMed]
  3. Fischer, E.; Rahelivololona, M.E. New taxa of Impatiens (Balsaminaceae) from Madagascar iii. Adansonia 2004, 26, 37–52. [Google Scholar]
  4. Janssens, S.; Geuten, K.; Yuan, Y.-M.; Song, Y.; Küpfer, P.; Smets, E. Phylogenetics of Impatiens and Hydrocera (Balsaminaceae) using chloroplast atpb-rbcl spacer sequences. Syst. Bot. 2006, 31, 171–180. [Google Scholar] [CrossRef]
  5. Janssens, S.B.; Knox, E.B.; Huysmans, S.; Smets, E.F.; Merckx, V.S. Rapid radiation of Impatiens (Balsaminaceae) during pliocene and pleistocene: Result of a global climate change. Mol. Phylogenet. Evol. 2009, 52, 806–824. [Google Scholar] [CrossRef] [PubMed]
  6. Janssens, S.B.; Viaene, T.; Huysmans, S.; Smets, E.F.; Geuten, K.P. Selection on length mutations after frameshift can explain the origin and retention of the AP3/DEF-like paralogues in Impatiens. J. Mol. Evol. 2008, 66, 424–435. [Google Scholar] [CrossRef] [PubMed]
  7. Yuan, Y.-M.; Song, Y.; Geuten, K.; Rahelivololona, E.; Wohlhauser, S.; Fischer, E.; Smets, E.; Küpfer, P. Phylogeny and biogeography of Balsaminaceae inferred from its sequences. Taxon 2004, 53, 391. [Google Scholar] [CrossRef]
  8. Song, Y.; Yuan, Y.-M.; Küpfer, P. Chromosomal evolution in Balsaminaceae, with cytological observations on 45 species from Southeast Asia. Caryologia 2003, 56, 463–481. [Google Scholar] [CrossRef]
  9. Tan, Y.-H.; Liu, Y.-N.; Jiang, H.; Zhu, X.-X.; Zhang, W.; Yu, S.-X. Impatiens pandurata (Balsaminaceae), a new species from Yunnan, China. Bot. Stud. 2015, 56, 29. [Google Scholar] [CrossRef] [PubMed]
  10. Zeng, L.; Liu, Y.-N.; Gogoi, R.; Zhang, L.-J.; Yu, S.-X. Impatiens tianlinensis (Balsaminaceae), a new species from Guangxi, China. Phytotaxa 2015, 227, 253–260. [Google Scholar] [CrossRef]
  11. Raju, R.; Dhanraj, F.I.; Arumugam, M.; Pandurangan, A. Impatiens matthewiana, a new scapigerous balsam from Western Ghats, India. Phytotaxa 2015, 227, 268–274. [Google Scholar] [CrossRef]
  12. Guo, H.; Wei, L.; Hao, J.-C.; Du, Y.-F.; Zhang, L.-J.; Yu, S.-X. Impatiens occultans (Balsaminaceae), a newly recorded species from Xizang, China, and its phylogenetic position. Phytotaxa 2016, 275, 62–68. [Google Scholar] [CrossRef]
  13. Cho, S.-H.; Kim, B.-Y.; Park, H.-S.; Phourin, C.; Kim, Y.-D. Impatiens bokorensis (Balsaminaceae), a new species from Cambodia. PhytoKeys 2017, 77, 33. [Google Scholar] [CrossRef] [PubMed]
  14. Yang, B.; Zhou, S.-S.; Maung, K.W.; Tan, Y.-H. Two new species of Impatiens (Balsaminaceae) from Putao, Kachin state, northern Myanmar. Phytotaxa 2017, 321, 103–113. [Google Scholar] [CrossRef]
  15. Hooker, J.D. Les Espèces du Genre “Impatiens” dans l’herbier du Museum de Paris. Nov. Arch. Mus. Nat. Hist. Paris Ser. 1908, 10, 233–272. [Google Scholar]
  16. Bhaskar, V. Taxonomic Monograph on ‘Impatiens’ (‘Balsaminaceae’) of Western Ghats, South India: The Key Genus for Endemism; Centre for Plant Taxonomic Studies: Bengaluru, India, 2012. [Google Scholar]
  17. Baskar, N.; Devi, B.P.; Jayakar, B. Anticancer studies on ethanol extract of Impatiens balsamina. Int. J. Res. Ayurveda Pharm. 2012, 3, 631–633. [Google Scholar]
  18. Cimmino, A.; Mathieu, V.; Evidente, M.; Ferderin, M.; Banuls, L.M.Y.; Masi, M.; De Carvalho, A.; Kiss, R.; Evidente, A. Glanduliferins A and B, two new glucosylated steroids from Impatiens glandulifera, with in vitro growth inhibitory activity in human cancer cells. Fitoterapia 2016, 109, 138–145. [Google Scholar] [CrossRef] [PubMed]
  19. Szewczyk, K.; Zidorn, C.; Biernasiuk, A.; Komsta, Ł.; Granica, S. Polyphenols from Impatiens (Balsaminaceae) and their antioxidant and antimicrobial activities. Ind. Crops Prod. 2016, 86, 262–272. [Google Scholar] [CrossRef]
  20. Sugiura, M. The chloroplast genome. In 10 Years Plant Molecular Biology; Springer: Berlin, Germany, 1992; pp. 149–168. [Google Scholar]
  21. Chumley, T.W.; Palmer, J.D.; Mower, J.P.; Fourcade, H.M.; Calie, P.J.; Boore, J.L.; Jansen, R.K. The complete chloroplast genome sequence of Pelargonium × hortorum: Organization and evolution of the largest and most highly rearranged chloroplast genome of land plants. Mol. Biol. Evol. 2006, 23, 2175–2190. [Google Scholar] [CrossRef] [PubMed]
  22. Tangphatsornruang, S.; Sangsrakru, D.; Chanprasert, J.; Uthaipaisanwong, P.; Yoocha, T.; Jomchai, N.; Tragoonrung, S. The chloroplast genome sequence of mungbean (Vigna radiata) determined by high-throughput pyrosequencing: Structural organization and phylogenetic relationships. DNA Res. 2009, 17, 11–22. [Google Scholar] [CrossRef] [PubMed]
  23. Wicke, S.; Schneeweiss, G.M.; Müller, K.F.; Quandt, D. The evolution of the plastid chromosome in land plants: Gene content, gene order, gene function. Plant Mol. Biol. 2011, 76, 273–297. [Google Scholar] [CrossRef] [PubMed]
  24. Jansen, R.K.; Cai, Z.; Raubeson, L.A.; Daniell, H.; Leebens-Mack, J.; Müller, K.F.; Guisinger-Bellian, M.; Haberle, R.C.; Hansen, A.K.; Chumley, T.W. Analysis of 81 genes from 64 plastid genomes resolves relationships in angiosperms and identifies genome-scale evolutionary patterns. Proc. Natl. Acad. Sci. USA 2007, 104, 19369–19374. [Google Scholar] [CrossRef] [PubMed]
  25. Parks, M.; Cronn, R.; Liston, A. Increasing phylogenetic resolution at low taxonomic levels using massively parallel sequencing of chloroplast genomes. BMC Biol. 2009, 7, 84. [Google Scholar] [CrossRef] [PubMed]
  26. Moore, M.J.; Soltis, P.S.; Bell, C.D.; Burleigh, J.G.; Soltis, D.E. Phylogenetic analysis of 83 plastid genes further resolves the early diversification of eudicots. Proc. Natl. Acad. Sci. USA 2010, 107, 4623–4628. [Google Scholar] [CrossRef] [PubMed]
  27. Zhu, A.; Guo, W.; Gupta, S.; Fan, W.; Mower, J.P. Evolutionary dynamics of the plastid inverted repeat: The effects of expansion, contraction, and loss on substitution rates. New Phytol. 2016, 209, 1747–1756. [Google Scholar] [CrossRef] [PubMed]
  28. Maliga, P. Engineering the plastid genome of higher plants. Curr. Opin. Plant Biol. 2002, 5, 164–172. [Google Scholar] [CrossRef]
  29. Shaw, J.; Shafer, H.L.; Leonard, O.R.; Kovach, M.J.; Schorr, M.; Morris, A.B. Chloroplast DNA sequence utility for the lowest phylogenetic and phylogeographic inferences in angiosperms: The tortoise and the hare iv. Am. J. Bot. 2014, 101, 1987–2004. [Google Scholar] [CrossRef] [PubMed]
  30. Yu, X.Q.; Gao, L.M.; Soltis, D.E.; Soltis, P.S.; Yang, J.B.; Fang, L.; Yang, S.X.; Li, D.Z. Insights into the historical assembly of East Asian subtropical evergreen broadleaved forests revealed by the temporal history of the tea family. New Phytol. 2017, 215, 1235–1248. [Google Scholar] [CrossRef] [PubMed]
  31. Allantospermum, A.; Apodanthaceae, A.; Boraginales, B.; Buxaceae, C.; Centrolepidaceae, C.; Cynomoriaceae, D.; Dilleniales, D.; Dipterocarpaceae, E.; Forchhammeria, F.; Gesneriaceae, H. An update of the angiosperm phylogeny group classification for the orders and families of flowering plants: APG IV. Bot. J. Linn. Soc. 2016, 181, 1–20. [Google Scholar] [CrossRef]
  32. Lan, Y.; Cheng, L.; Huang, W.; Cao, Q.; Zhou, Z.; Luo, A.; Hu, G. The complete chloroplast genome sequence of Actinidia kolomikta from north China. Conserv. Genet. Resour. 2017, 1–3. [Google Scholar] [CrossRef]
  33. Wang, W.-C.; Chen, S.-Y.; Zhang, X.-Z. Chloroplast genome evolution in Actinidiaceae: Clpp loss, heterogenous divergence and phylogenomic practice. PLoS ONE 2016, 11, e0162324. [Google Scholar] [CrossRef] [PubMed]
  34. Logacheva, M.D.; Schelkunov, M.I.; Shtratnikova, V.Y.; Matveeva, M.V.; Penin, A.A. Comparative analysis of plastid genomes of non-photosynthetic Ericaceae and their photosynthetic relatives. Sci. Rep. 2016, 6, 30042. [Google Scholar] [CrossRef] [PubMed]
  35. Fajardo, D.; Senalik, D.; Ames, M.; Zhu, H.; Steffan, S.A.; Harbut, R.; Polashock, J.; Vorsa, N.; Gillespie, E.; Kron, K. Complete plastid genome sequence of Vaccinium macrocarpon: Structure, gene content, and rearrangements revealed by next generation sequencing. Tree Genet. Genomes 2013, 9, 489–498. [Google Scholar] [CrossRef]
  36. Fu, J.; Liu, H.; Hu, J.; Liang, Y.; Liang, J.; Wuyun, T.; Tan, X. Five complete chloroplast genome sequences from Diospyros: Genome organization and comparative analysis. PLoS ONE 2016, 11, e0159566. [Google Scholar] [CrossRef] [PubMed]
  37. Jo, S.; Kim, H.-W.; Kim, Y.-K.; Cheon, S.-H.; Kim, K.-J. The first complete plastome sequence from the family Sapotaceae, Pouteria campechiana (kunth) baehni. Mitochondr. DNA Part B 2016, 1, 734–736. [Google Scholar] [CrossRef]
  38. Ku, C.; Hu, J.-M.; Kuo, C.-H. Complete plastid genome sequence of the basal Asterid Ardisia polysticta miq. and comparative analyses of Asterid plastid genomes. PLoS ONE 2013, 8, e62548. [Google Scholar] [CrossRef]
  39. Zhang, C.-Y.; Liu, T.-J.; Yan, H.-F.; Ge, X.-J.; Hao, G. The complete chloroplast genome of a rare candelabra primrose Primula stenodonta (Primulaceae). Conserv. Genet. Resour. 2017, 9, 123–125. [Google Scholar] [CrossRef]
  40. Wang, L.-L.; Zhang, Y.; Yang, Y.-C.; Du, X.-M.; Ren, X.-L.; Liu, W.-Z. The complete chloroplast genome of Sinojackia xylocarpa (Ericales: Styracaceae), an endangered plant species endemic to China. Conserv. Genet. Resour. 2017. [Google Scholar] [CrossRef]
  41. Yao, X.; Tang, P.; Li, Z.; Li, D.; Liu, Y.; Huang, H. The first complete chloroplast genome sequences in Actinidiaceae: Genome structure and comparative analysis. PLoS ONE 2015, 10, e0129347. [Google Scholar] [CrossRef] [PubMed]
  42. Kuroda, H.; Suzuki, H.; Kusumegi, T.; Hirose, T.; Yukawa, Y.; Sugiura, M. Translation of psbC mRNAs starts from the downstream GUG, not the upstream AUG, and requires the extended shine–dalgarno sequence in tobacco chloroplasts. Plant Cell Physiol. 2007, 48, 1374–1378. [Google Scholar] [CrossRef] [PubMed]
  43. Takenaka, M.; Zehrmann, A.; Verbitskiy, D.; Härtel, B.; Brennicke, A. RNA editing in plants and its evolution. Annu. Rev. Genet. 2013, 47, 335–352. [Google Scholar] [CrossRef] [PubMed]
  44. Zhao, J.; Qi, B.; Ding, L.; Tang, X. Based on RSCU and QRSCU research codon bias of F/10 and G/11 xylanase. J. Food Sci. Biotechnol. 2010, 29, 755–764. [Google Scholar]
  45. Zuo, L.-H.; Shang, A.-Q.; Zhang, S.; Yu, X.-Y.; Ren, Y.-C.; Yang, M.-S.; Wang, J.-M. The first complete chloroplast genome sequences of Ulmus species by de novo sequencing: Genome comparative and taxonomic position analysis. PLoS ONE 2017, 12, e0171264. [Google Scholar] [CrossRef] [PubMed]
  46. Zhou, J.; Chen, X.; Cui, Y.; Sun, W.; Li, Y.; Wang, Y.; Song, J.; Yao, H. Molecular structure and phylogenetic analyses of complete chloroplast genomes of two Aristolochia medicinal species. Int. J. Mol. Sci. 2017, 18, 1839. [Google Scholar] [CrossRef] [PubMed]
  47. Wang, W.; Yu, H.; Wang, J.; Lei, W.; Gao, J.; Qiu, X.; Wang, J. The complete chloroplast genome sequences of the medicinal plant Forsythia suspensa (Oleaceae). Int. J. Mol. Sci. 2017, 18, 2288. [Google Scholar] [CrossRef] [PubMed]
  48. Gichira, A.W.; Li, Z.; Saina, J.K.; Long, Z.; Hu, G.; Gituru, R.W.; Wang, Q.; Chen, J. The complete chloroplast genome sequence of an endemic monotypic genus Hagenia (Rosaceae): Structural comparative analysis, gene content and microsatellite detection. PeerJ 2017, 5, e2846. [Google Scholar] [CrossRef] [PubMed]
  49. Makałowski, W.; Boguski, M.S. Evolutionary parameters of the transcribed mammalian genome: An analysis of 2,820 orthologous rodent and human sequences. Proc. Natl. Acad. Sci. USA 1998, 95, 9407–9412. [Google Scholar] [CrossRef] [PubMed]
  50. Hong, S.-Y.; Cheon, K.-S.; Yoo, K.-O.; Lee, H.-O.; Cho, K.-S.; Suh, J.-T.; Kim, S.-J.; Nam, J.-H.; Sohn, H.-B.; Kim, Y.-H. Complete chloroplast genome sequences and comparative analysis of Chenopodium quinoa and C. album. Front. Plant Sci. 2017, 8, 1696. [Google Scholar] [CrossRef] [PubMed]
  51. Saina, J.K.; Gichira, A.W.; Li, Z.-Z.; Hu, G.-W.; Wang, Q.-F.; Liao, K. The complete chloroplast genome sequence of Dodonaea viscosa: Comparative and phylogenetic analyses. Genetica 2017, 1–13. [Google Scholar] [CrossRef] [PubMed]
  52. Raubeson, L.A.; Peery, R.; Chumley, T.W.; Dziubek, C.; Fourcade, H.M.; Boore, J.L.; Jansen, R.K. Comparative chloroplast genomics: Analyses including new sequences from the angiosperms Nuphar advena and Ranunculus macranthus. BMC Genom. 2007, 8, 174. [Google Scholar] [CrossRef] [PubMed]
  53. Wang, R.-J.; Cheng, C.-L.; Chang, C.-C.; Wu, C.-L.; Su, T.-M.; Chaw, S.-M. Dynamics and evolution of the inverted repeat-large single copy junctions in the chloroplast genomes of monocots. BMC Evol. Biol. 2008, 8, 36. [Google Scholar] [CrossRef] [PubMed]
  54. Huotari, T.; Korpelainen, H. Complete chloroplast genome sequence of Elodea canadensis and comparative analyses with other monocot plastid genomes. Gene 2012, 508, 96–105. [Google Scholar] [CrossRef] [PubMed]
  55. Choi, K.S.; Chung, M.G.; Park, S. The complete chloroplast genome sequences of three Veroniceae species (Plantaginaceae): Comparative analysis and highly divergent regions. Front. Plant Sci. 2016, 7, 355. [Google Scholar] [CrossRef] [PubMed]
  56. Doyle, J. DNA protocols for plants. In Molecular Techniques in Taxonomy; Springer: Berlin, Germany, 1991; pp. 283–293. [Google Scholar]
  57. Schmieder, R.; Edwards, R. Quality control and preprocessing of metagenomic datasets. Bioinformatics 2011, 27, 863–864. [Google Scholar] [CrossRef] [PubMed]
  58. Zerbino, D.R.; Birney, E. Velvet: Algorithms for de novo short read assembly using de bruijn graphs. Genome Res. 2008, 18, 821–829. [Google Scholar] [CrossRef] [PubMed]
  59. Kearse, M.; Moir, R.; Wilson, A.; Stones-Havas, S.; Cheung, M.; Sturrock, S.; Buxton, S.; Cooper, A.; Markowitz, S.; Duran, C. Geneious basic: An integrated and extendable desktop software platform for the organization and analysis of sequence data. Bioinformatics 2012, 28, 1647–1649. [Google Scholar] [CrossRef] [PubMed]
  60. Wyman, S.K.; Jansen, R.K.; Boore, J.L. Automatic annotation of organellar genomes with DOGMA. Bioinformatics 2004, 20, 3252–3255. [Google Scholar] [CrossRef] [PubMed]
  61. Schattner, P.; Brooks, A.N.; Lowe, T.M. The tRNAscan-SE, snoscan and snoGPS web servers for the detection of tRNAs and snoRNAs. Nucleic Acids Res. 2005, 33, W686–W689. [Google Scholar] [CrossRef] [PubMed]
  62. Lohse, M.; Drechsel, O.; Bock, R. OrganellarGenomeDRAW (OGDRAW): A tool for the easy generation of high-quality custom graphical maps of plastid and mitochondrial genomes. Curr. Genet. 2007, 52, 267–274. [Google Scholar] [CrossRef] [PubMed]
  63. Thiel, T.; Michalek, W.; Varshney, R.; Graner, A. Exploiting EST databases for the development and characterization of gene-derived SSR-markers in barley (Hordeum vulgare L.). TAG Theor. Appl. Genet. 2003, 106, 411–422. [Google Scholar] [CrossRef] [PubMed]
  64. Wang, D.; Liu, F.; Wang, L.; Huang, S.; Yu, J. Nonsynonymous substitution rate (Ka) is a relatively consistent parameter for defining fast-evolving and slow-evolving protein-coding genes. Biol. Direct 2011, 6, 13. [Google Scholar] [CrossRef] [PubMed]
  65. Stamatakis, A. RAxML version 8: A tool for phylogenetic analysis and post-analysis of large phylogenies. Bioinformatics 2014, 30, 1312–1313. [Google Scholar] [CrossRef] [PubMed]
  66. Posada, D. Jmodeltest: Phylogenetic model averaging. Mol. Biol. Evol. 2008, 25, 1253–1256. [Google Scholar] [CrossRef] [PubMed]
Figure 1. Gene map of the Impatiens pinfanensis chloroplast genome. Genes lying outside of the circle are transcribed clockwise, while genes inside the circle are transcribed counterclockwise. The colored bars indicate different functional groups. The dark gray area in the inner circle corresponds to GC content while the light gray corresponds to the adenine-thymine (AT) content of the genome.
Ijms 19 00319 g001
Figure 2. Gene map of the Hydrocera triflora chloroplast genome. Genes lying outside of the circle are transcribed clockwise, while genes inside the circle are transcribed counterclockwise. The colored bars indicate different functional groups. The dark gray area in the inner circle corresponds to (guanine cytosine) GC content while the light gray corresponds to the AT content of the genome.
Ijms 19 00319 g002
Figure 3. Non-synonymous (Ka) and synonymous (Ks) substitution rates and Ka/Ks ratio between I. pinfanensis and H. triflora. One gene psbK had Ka/Ks ratio greater than 1.0, whereas all the other genes were less than 1.0.
Ijms 19 00319 g003
Figure 4. Comparison of IR, LSC and SSC border regions among eight Ericales cp genomes. The IRb/SSC junction extended into the ycf1 genes creating various lengths of ycf1 pseudogenes among the eight cp genomes. The numbers above, below or adjacent to genes shows the distance between the ends of genes and the boundary sites. The figure features are not to scale. ᵠ indicates a pseudogene.
Ijms 19 00319 g004
Figure 5. Phylogenetic relationships based on 51 common protein-coding genes of 38 representative species from order Ericales and four Cornales as Outgroup species with maximum likelihood. The numbers associated with the nodes indicate bootstrap values tested with 1000 replicates.
Ijms 19 00319 g005
Table 1. Comparison of the chloroplast genomes of Impatiens pinfanensis and Hydrocera triflora.
SpeciesImpatiens pinfanensisHydrocera triflora
Total Genome length (bp)154,189152,238
Overall G/C content (%)36.836.9
Large single copy region83,11784,865
GC content (%)34.534.7
Short single copy region25,75525,622
GC content (%)29.329.9
Inverted repeat region17,61118,082
GC content (%)43.143.1
Protein-Coding Genes8080
tRNAs3131
rRNAs44
Genes with introns1717
Genes duplicated by IR1818
Table 2. Genes encoded in the Impatiens pinfanensis and Hydrocera triflora Chloroplast genomes.
Group of GenesGene Name
rRNA genesrrn16(×2), rrn23(×2), rrn4.5(×2), rrn5(×2),
tRNA genestrnA-UGC * (×2), trnC-GCA, trnD-GUC, trnE-UUC, trnF-GAA, trnG-GCC *, trnG-UCC, trnH-GUG, trnI-CAU(×2), trnI-GAU * (×2), trnK-UUU *, trnL-CAA(×2), trnL-UAA *, trnL-UAG, trnfM-CAU, trnM-CAU, trnN-GUU(×2), trnP-GGG trnP-UGG, trnQ-UUG, trnR-ACG(×2), trnR-UCU, trnS-GCU, trnS-GGA, trnS-UGA, trnT-GGU, trnT-UGU, trnV-GAC(×2), trnV-UAC *, trnW-CCA, trnY-GUA
Ribosomal small subunitrps2, rps3, rps4, rps7(×2), rps8, rps11, rps12_5’end, rps12_3’end * (×2), rps14, rps15, rps16 *, rps18, rps19
Ribosomal large subunitrpl2 * (×2), rpl14, rpl16, rpl20, rpl22, rpl23(×2), rpl32, rpl33, rpl36
DNA-dependent RNA polymeraserpoA, rpoB, rpoC1 *, rpoC2
Large subunit of rubiscorbcL
Photosystem IpsaA, psaB, psaC, psaI, psaJ, ycf3 **
Photosystem IIpsbA, psbB, psbC, psbD, psbE, psbF, psbH, psbI, psbJ, psbK, psbL, psbM, psbN, psbT, psbZ
NADH dehydrogenasendhA *, ndhB * (×2), ndhC, ndhD, ndhE, ndhF, ndhG, ndhH, ndhI, ndhJ, ndhK
Cytochrome b/f complexpetA, petB *, petD, petG, petL, petN
ATP synthaseatpA, atpB, atpE, atpF *, atpH, atpI
MaturasematK
Subunit of acetyl-CoA carboxylaseaccD
Envelope membrane proteincemA
ProteaseclpP **
Translational initiation factorinfA
c-type cytochrome synthesis ccsA
Conserved open reading frames (ycf)ycf1, ycf2(×2), ycf4, ycf15(×2)
Genes with one or two introns are indicated by one (*) or two asterisks (**), respectively. Genes in the IR regions are followed by the (×2) symbol.
Table 3. Codon usage in Impatiens pinfanensis and Hydrocera triflora chloroplast genomes.
Amino AcidCodonNumberRSCUAmino AcidCodonNumberRSCU
I. pinfanensisH. trifloraI. pinfanensisH. trifloraI. pinfanensisH. trifloraI. pinfanensisH. triflora
PheUUU9139081.401.38SerUCU4824821.691.67
UUC3874060.600.62UCC2522640.880.92
LeuUUA8548422.112.07UCA3603241.261.12
UUG4684861.161.20UCG1421810.500.63
CUU5175031.281.24ProCCU3763711.591.58
CUC1601620.400.40CCC1751670.740.71
CUA3103150.770.78CCA2942901.241.23
CUG1211280.300.32CCG1031120.430.48
IleAUU103510201.541.52ThrACU4935001.701.74
AUC3593760.530.56ACC1981800.680.63
AUA6246110.930.91ACA3583681.241.28
MetAUG5475481.001.00ACG1081040.370.36
ValGUU4824691.551.52AlaGCU5805931.861.85
GUC1341350.430.44GCC1831910.590.60
GUA4574571.471.48GCA3463531.111.10
GUG1671740.540.56GCG1411430.450.45
TyrUAU7046971.641.65CysUGU1911961.531.51
UAC1551460.360.35UGC58630.470.49
TERUAA41441.501.63TERUGA18180.660.67
UAG23190.840.70TrpUGG4124121.001.00
HisCAU4054211.541.57ArgAGA4064071.811.77
CAC1211140.460.43AGG1341430.600.62
GlnCAA6276261.541.53ArgCGU3022991.351.30
CAG1861920.460.47CGC88950.390.41
AsnAAU8858681.591.57CGA3173331.411.45
AAC2312380.410.43CGG981030.440.45
LysAAA9769781.551.54SerAGU363721.271.29
AAG2842890.450.46AGC1101080.390.37
AspGAU7207371.641.64GlyGGU5255251.331.35
GAC1591600.360.36GGC1601650.400.42
GluGAA9149291.551.55GGA6396251.621.61
GAG2642720.450.45GGG2582380.650.61
RSCU: Relative synonymous Codon Usage. RSCU > 1 are highlighted in bold.
Table 4. SSR types and amount in the Impatiens pinfanensis and Hydrocera triflora Chloroplast genomes.
SSR TypeRepeat UnitAmount
Impatiens pinfanensisHydrocera trifloraActinidia kolomiktaArdisia polystictaDiospyros lotusBarringtonia fusicarpaPouteria campechianaPrimula persimilis
MonoA/T176139117153146154161134
C/G42444814
DiAT/AT8985313116
TriAAG/CTT10000011
AAT/ATT33211240
AGC/CTG00001000
TetraAAAG/CTTT10321311
AAAT/ATTT23334362
AATG/ATTC10010000
AATT/AATT10100010
AGAT/ATCT10000000
AAGT/ACTT01000100
AACT/AGTT00010000
AATC/ATTG00201100
AAAC/GTTT00000010
AAGG/CCTT00000010
PentaAATAC/ATTGT01000000
AAAAT/ATTTT00100000
AAATT/AATTT00010000
AATGT/ACATT00000100
AATAT/ATATT00000001
HexaAATCCC/ATTGGG01000000
AGATAT/ATATCT00000001
AAGATG/ATCTTC00100000
Total 197159143171161187188150

