Mutation Analysis in Cultured Cells of Transgenic Rodents


1
Department of Preventive Medicine, University of Southern California Keck School of Medicine, University of Southern California, M/C 9603, Los Angeles, CA 90033, USA
2
Department of Cancer Biology, Beckman Research Institute of the City of Hope, Duarte, CA 91010, USA
*
Author to whom correspondence should be addressed.
Int. J. Mol. Sci. 2018, 19(1), 262; https://doi.org/10.3390/ijms19010262
Submission received: 20 December 2017
/
Revised: 10 January 2018
/
Accepted: 15 January 2018
/
Published: 16 January 2018
(This article belongs to the Section Biochemistry)
Abstract
:To comply with guiding principles for the ethical use of animals for experimental research, the field of mutation research has witnessed a shift of interest from large-scale in vivo animal experiments to small-sized in vitro studies. Mutation assays in cultured cells of transgenic rodents constitute, in many ways, viable alternatives to in vivo mutagenicity experiments in the corresponding animals. A variety of transgenic rodent cell culture models and mutation detection systems have been developed for mutagenicity testing of carcinogens. Of these, transgenic Big Blue® (Stratagene Corp., La Jolla, CA, USA, acquired by Agilent Technologies Inc., Santa Clara, CA, USA, BioReliance/Sigma-Aldrich Corp., Darmstadt, Germany) mouse embryonic fibroblasts and the λ Select cII Mutation Detection System have been used by many research groups to investigate the mutagenic effects of a wide range of chemical and/or physical carcinogens. Here, we review techniques and principles involved in preparation and culturing of Big Blue® mouse embryonic fibroblasts, treatment in vitro with chemical/physical agent(s) of interest, determination of the cII mutant frequency by the λ Select cII assay and establishment of the mutation spectrum by DNA sequencing. We describe various approaches for data analysis and interpretation of the results. Furthermore, we highlight representative studies in which the Big Blue® mouse cell culture model and the λ Select cII assay have been used for mutagenicity testing of diverse carcinogens. We delineate the advantages of this approach and discuss its limitations, while underscoring auxiliary methods, where applicable.
1. Introduction
The contemporary field of mutation research has witnessed a shift of interest from in vivo to in vitro mutagenicity testing to meet the requirements of “reducing” the number of animals used, “refining” procedures to alleviate animal pain, suffering or distress and “replacing” animal use with viable alternatives. These are the “3Rs” known as the guiding principles for ethical use of animals for experimental research [1]. Mutation assays in cultured cells of transgenic rodents constitute, in many ways, feasible “replacements” for in vivo mutagenicity experiments in the corresponding animals [2]. These in vitro models offer significant advantages over their counterparts in vivo animal models as they are much less costly and laborious, require far less time to be completed and, most importantly, do not involve direct use of the animals [3,4,5]. At the same time, the in vitro models have inherent shortcomings that may limit their representation of the in vivo events occurring in animal models (see the Discussion). Nevertheless, if used properly and in well-designed experiments, the in vitro models can provide an initial indication of the mutagenic potential of a given chemical/agent(s), and the results can be used as a guide to devise ‘refined’ in vivo experiments with a “reduced” number of animals [2,4].
The Big Blue® rodent cell culture model and the λ Select cII Mutation Detection System (Stratagene Corp., La Jolla, CA, USA, acquired by Agilent Technologies Inc., Santa Clara, CA, USA, BioReliance/Sigma-Aldrich Corp., Darmstadt, Germany) have been successfully employed for mutagenicity testing of carcinogens by many research groups throughout the world [2,4,6,7,8,9,10,11,12]. For the past 16 years, our laboratory has investigated the mutagenic effects of a wide range of chemical and/or physical carcinogens using cultures of the Big Blue® mouse embryonic fibroblasts and the λ Select cII assay [13,14,15,16,17,18,19,20,21,22,23,24,25,26,27]. The genome of transgenic Big Blue® mouse houses multiple copies of a λLIZ shuttle vector containing two mutational reporter genes, namely the cII and lacI transgenes, that are integrated, at a single locus, into chromosome 4 in a head-to-tail arrangement [2,4,6,28]. The λ Select cII assay is based on the retrieval of the λLIZ shuttle vectors from the genomic DNA of Big Blue® mouse cells treated in vitro with a test compound, followed by packaging of the rescued vectors into λ phage heads capable of infecting an indictor Escherichia coli (E. coli). The infected bacteria are then grown under selective conditions to allow for scoring and analysis of mutations in the cII transgene [2,6].
Here, we review techniques and principles involved in the preparation and culturing of transgenic Big Blue® mouse embryonic fibroblasts, treatment in vitro with chemical and/or physical agent(s) of interest, determination of the cII mutant frequency by the λ Select cII assay and establishment of the mutation spectrum by DNA sequencing. We outline various approaches for data analysis and interpretation of the results. We showcase representative studies in which the Big Blue® mouse cell culture model and the λ Select cII Mutation Detection System have been used for mutagenicity testing of various chemical and/or physical carcinogens. Lastly, we highlight the advantages of this approach and discuss its limitations, while outlining auxiliary methods, where applicable. We note that the focus of this review is the λ Select cII mutation assay and its applications in transgenic Big Blue® mouse embryonic fibroblasts for in vitro mutagenicity testing. Comparing and contrasting the wide variety of existing transgenic mutation assays are beyond the scope of the present review, and we refer interested readers to comprehensive and exhaustive reviews on this and other related topics (see, for example [4,29]).
2. Materials and Methods
2.1. Generation of Big Blue® Mouse Embryonic Fibroblasts and Preparation of Cell Cultures
Primary mouse embryonic fibroblasts are isolated from embryos derived from Big Blue® mouse on C57BL/6 or B6C3F1 genetic backgrounds, according to our published protocol with some modifications [30]. Briefly, mouse embryos are harvested in utero at 13.5 days of gestation. Following the removal of the head (for DNA genotyping) and internal organs, individual embryos are placed in a centrifuge tube and incubated with collagenase in a serum-free culture medium (e.g., Dulbecco’s Modified Eagle’s Medium (DMEM)) (0.1% v/v) for up to four hours at 37 °C. At hourly intervals, the embryo-collagenase solutions are gently centrifuged, and the pellet is washed with serum-free media and then re-incubated with the collagenase solution for another hour. Upon completion of digestion, the collected cells are transferred to 150-mm petri dishes containing DMEM, supplemented with 10% fetal calf serum (FBS) and non-essential amino acids, and subsequently cultured at 37 °C. Following 3–4 days of cultivation, confluent cultures are harvested, and cells are snap frozen (i.e., 2–3 × 10⁶ cells per vial). Upon thawing, early passage mouse embryonic fibroblast cultures (p < 3) can be established and used for experimental purposes. For mutagenicity experiments, monolayer cell cultures (~50–70% confluent) at a density of ~1 × 10⁶ cells per 150-mm petri dish are prepared in triplicate for each experimental and control condition.
We note that although not as inexpensive as trypsin, collagenase possesses several superior features for embryo digestion. It is not inactivated by divalent cations and can be used with culture medium, with the result that all dissociated cells are provided with nutrients during the digestion. Furthermore, the substrate of collagenase is collagen, an extracellular matrix protein, whereas trypsin is a nonspecific protease that can seriously damage cell membrane proteins, such as hormone and other receptors [31]. Collagenase digestion produces more viable cells, which are less stressed, and have an increased in vitro lifespan compared to their trypsin-digested counterparts.
2.2. Cytotoxicity Examination of Test Chemical/Agent
Prior to conducting a mutagenicity experiment, cytotoxicity examination of the test chemical/agent must be performed. This is to establish a biologically-relevant dose range in which the test compound may exert its (potential) genotoxic effects, without causing excessive cell death. The latter is of importance because induced DNA damage by a test compound can only be translated into mutation in viable and proliferative cells. Miscoding DNA lesions must evade repair and undergo translesion DNA synthesis during DNA replication, thereby potentially causing mutation [2]. For cytotoxicity examination, Big Blue® mouse embryonic fibroblasts (approximately 0.5–1 × 10⁴ cells) are seeded onto each well of a multi-well plate (12- or 24-wells). Following overnight incubation, the cells are washed thoroughly with a buffer solution (e.g., phosphate-buffered saline (PBS)) at least 3 times. The test compound, dissolved in an appropriate solvent (e.g., dimethylsulfoxide (DMSO)), is then mixed with cell culture medium at increasing concentrations in a series of screw-cap centrifuge tubes. Dilution mixtures of the test compound and culture medium are then added to each well of the multiwall plate in triplicate. The concentrations of the test compound in a serial dilution may range from mid-nanomolar to low millimolar, with the dilution factor being usually 5 or 10. As the negative control, cell culture medium containing the highest concentration of the used solvent is tested under the same experimental conditions. The duration of treatment varies, depending on test chemical/agent, but usually does not exceed 24 h, considering the finite proliferative capacity of the cells. On average, primary Big Blue® mouse embryonic fibroblasts undergo cell division every 28–30 h for up to 5–7 rounds. Following the treatment, cells are washed multiple times with an appropriate buffer solution and subsequently harvested for evaluation of cytotoxicity using cell proliferation assays, e.g., relative cell counts (RCC), relative increase in cell counts (RICC) and relative population doubling (RPD), or the trypan blue dye exclusion technique or colorimetric tests, such as the MTT assay [32]. The latter two assays, however, may underestimate cytotoxicity as the trypan blue dye exclusion assay detects only cells that die of necrosis, and the MTT assay does not detect cells that eventually die from apoptosis [33]. The cytotoxicity data are used to establish a dose-response survival curve from which biologically-relevant doses of the test compound can be inferred for mutagenicity experiments. For any given test chemical/agent, at least a “low” dose and a “high” dose, resulting in high and low cell survival, respectively, are chosen for mutagenicity testing. Additional “in-between” doses may also be included to establish the existence of dose-response mutagenic effects. For further information on the cytotoxicity examination and selection of concentrations for test compounds, readers are referred to the OECD Genetic Toxicology Guidelines [34,35,36].
2.3. In Vitro Treatment for Mutagenicity Testing
Early passage Big Blue® mouse embryonic fibroblasts are treated in vitro with chemical and/or physical agent(s) of interest in comparison to the control. Following the treatment, cells are washed multiple times with an appropriate buffer solution and subsequently grown in complete growth medium for 5–8 days, with cultures being passed when they reach ~80% confluency. Upon completion of the culturing period, cells are harvested, pelleted by centrifugation and stored at −80 °C until analysis. At the time of harvesting, cells are expected to have undergone 3–4 population doublings, a requisite for the fixation of mutations into the genome [2].
2.4. Genomic DNA Isolation
High molecular weight genomic DNA from treated cells and controls is isolated using standard phenol:chloroform extraction methods or various commercially available DNA isolation kits (e.g., DNeasy Blood & Tissue Kit, Qiagen, Valencia, CA, USA) [5]. The DNA is dissolved in TE buffer (10 mM Tris-HCl, 1 mM EDTA, pH 7.5) and kept at −80 °C until further analysis.
2.5. The λ Select cII Assay
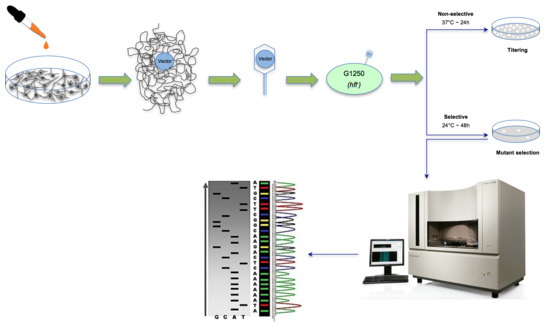
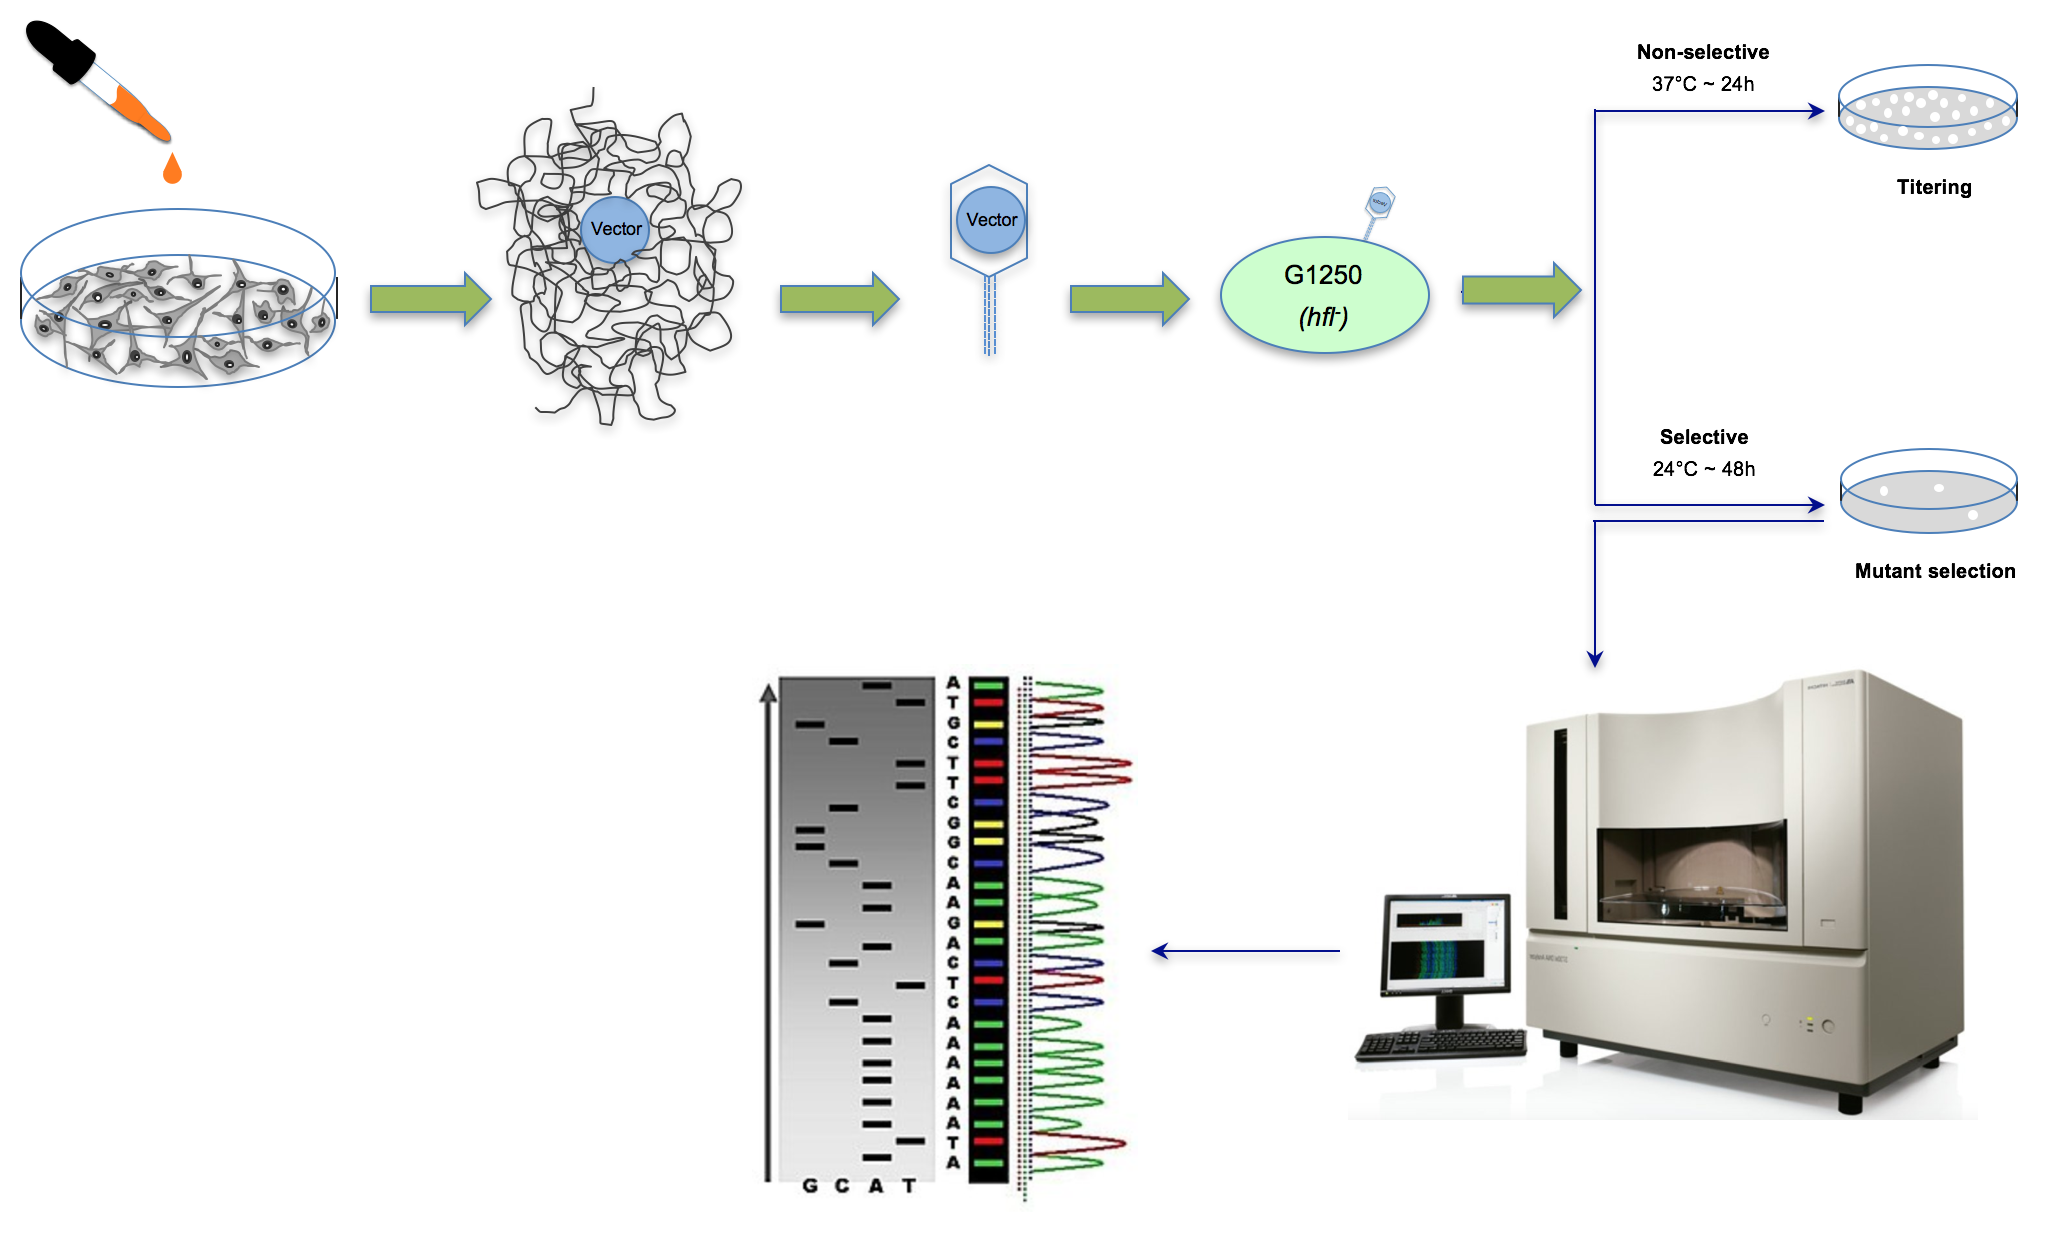
The λ Select cII assay is used for the detection of mutations in the cII transgene recovered from the genomic DNA of cells derived from Big Blue® rodents [2]. The genome of transgenic Big Blue® rodents contains multiple tandem copies of the chromosomally-integrated λLIZ shuttle vector, which carries the cII and lacI transgenes, as mutational reporter genes [4,6,28]. The λ Select cII assay is based on the retrieval of the coliphage vectors from genomic DNA, followed by phenotypic expression using a temperature-sensitive bacterial assay [6]. Briefly, the recovered vector is packaged into viable bacteriophages, and the infective λ phage particles are introduced into an appropriate strain of E. coli. Both in-house prepared or commercially-available λ packaging extracts can be used for packaging reactions. The commonly-used Transpack Packaging Extract kit (Stratagene Corp., La Jolla, CA, USA, acquired by Agilent Technologies Inc., Santa Clara, CA, USA, BioReliance/Sigma-Aldrich Corp., Darmstadt, Germany) [37] consists of red tubes containing the first packaging reaction mix (~10 μL), blue tubes containing the second packaging reaction mix (~70 μL for, at least, five reactions) and G1250 E. coli as the indictor bacteria. Detailed instructions for the recovery of the λ shuttle vectors, packaging into bacteriophages and infection of the host E. coli are provided in all commercial reagent kits [37]. The λ phages multiply lysogenically or lytically in the host E. coli, depending on the status of cII transcription [38]. The cII protein is required for activation of the cI repressor and lambda integrase, both of which are essential for lysogenization [38]. Whereas wildtype cII protein triggers lysogenic cycles in the host E. coli, mutated cII protein leads to lysis of the infected bacteria, which manifests as plaques formed on the bacterial lawn [5,6]. The λLIZ shuttle vector also harbors a cI857 temperature-sensitive (ts) mutation that makes the cI (ts) protein labile at temperatures exceeding 32 °C [6]. At temperatures greater than 32 °C, therefore, all vector-bearing phages, regardless of the cII mutation status, replicate through lytic cycles in the indicator E. coli [4,6]. This temperature sensitivity is the basis for the cII selection system in which incubation of the phage-infected bacteria under selective conditions (i.e., 24 °C for ~48 h) results in phenotypic expression of the cII mutants, thus forming plaques in a special agar plate [6]. Under non-selective incubation conditions (i.e., 37 °C for ~24 h), both wildtype and mutant cII are indiscriminately expressed, resulting in the formation of plaques in the agar plate [6]. The ratio of plaques formed under the selective conditions to those formed under the non-selective conditions is conventionally referred to as the “cII mutant frequency” [4,5]. A schematic presentation of the λ Select cII assay is shown in Figure 1.
2.6. The Induced and Spontaneous cII Mutant Frequencies and Mutation Spectra
Genomic DNA of Big Blue® mouse embryonic fibroblasts treated in vitro with test chemical/agent(s) and appropriate control is isolated, and retrieval of the λLIZ shuttle vectors and packaging into bacteriophages are achieved using in-house prepared or commercially available packaging extracts. As described in the preceding section (see Section 2.5), after pre-adsorption of the λ phages to G1250 E. coli, the bacterial culture is grown on TB1 agar plates under “selective conditions: incubation at 24 °C for ~48 h” (for screening of mutations in the cII transgene), as well as under “non-selective conditions: incubation at 37 °C for ~24 h/overnight” for titering (i.e., calculating the total number of mutant and non-mutant plaques screened in the genomic DNA). The cII mutant frequency is calculated by dividing the number of plaques formed under the selective conditions to the total number of plaques formed under the non-selective conditions (see Figure 1). For quality control, commercial packaging reaction kits provide standard phage solutions that contain a mixture of wildtype and mutant cII with known mutant frequency. The control phage solutions should be included in all assay runs [37]. Furthermore, it is recommended that a minimum of 3 × 10⁵ rescued phages be screened for each experimental and control condition [37]. Depending on the strength of the test compound to induce mutation, 50–150 verified cII-mutant plaques are usually sequenced for mutation spectra analysis, with the stronger mutagens requiring fewer numbers of plaque for DNA sequencing (see below).
For mutation spectra analysis, putative cII mutant plaques are selected at random and re-plated at low density under selective conditions to verify the mutant phenotype and isolate single plaques for DNA sequencing. The re-plating of putatively mutated plaques serves two purposes: (a) plating artifacts may sometimes be mistaken for small-size plaques; and (b) an agarose core taken from a screening plate may contain non-mutant phage(s) together with a mutant phage. Secondary plaques from a low-density re-plating will provide an uncontaminated mutant template for polymerase chain reaction (PCR) and subsequent DNA sequence analysis. Following the re-plating, individual well-isolated plaques are picked, transferred to a microcentrifuge tube containing 25 μL double-distilled water, boiled for 5 min and centrifuged at maximum speed for 3 min. Ten microliters of the supernatant are immediately transferred to a new microcentrifuge tube containing 40 μL of a PCR mastermix in which the final concentrations of the reagents are 1× Taq PCR buffer, 10 pmol each of the forward and reverse primers, 12.5 nmol of each dNTP and 2.5 U of Taq2000 DNA Polymerase (Qiagen, Valencia, CA, USA). The forward and reverse primers include 5′-CCACACCTATGGTGTATG-3′ (positions -68 – -50) and 5′-CCTCTGCCGAAGTTGAGTAT-3′ (positions -345 – -365), respectively. A 432-bp product containing the cII gene and flanking regions is amplified by PCR using the following cycling parameters: a 3-min denaturation at 95 °C, followed by 30 cycles of 30 s at 95 °C, 1 min at 60 °C and 1 min at 72 °C, with a final extension of 10 min at 72 °C. The PCR amplified product is purified using the QIAquick PCR purification kit (Qiagen, Chatsworth, CA, USA) and sequenced using various DNA sequencing platforms. The resulting DNA sequences are analyzed by alignment with the reference cII sequence using software programs, such as the web-based SeqWeb or T-Coffee sequence alignment servers.
3. Data Analysis
3.1. Determining the Mutagenic Potency of a Test Chemical/Agent and Analyzing the Sequence-Specificity of Mutations
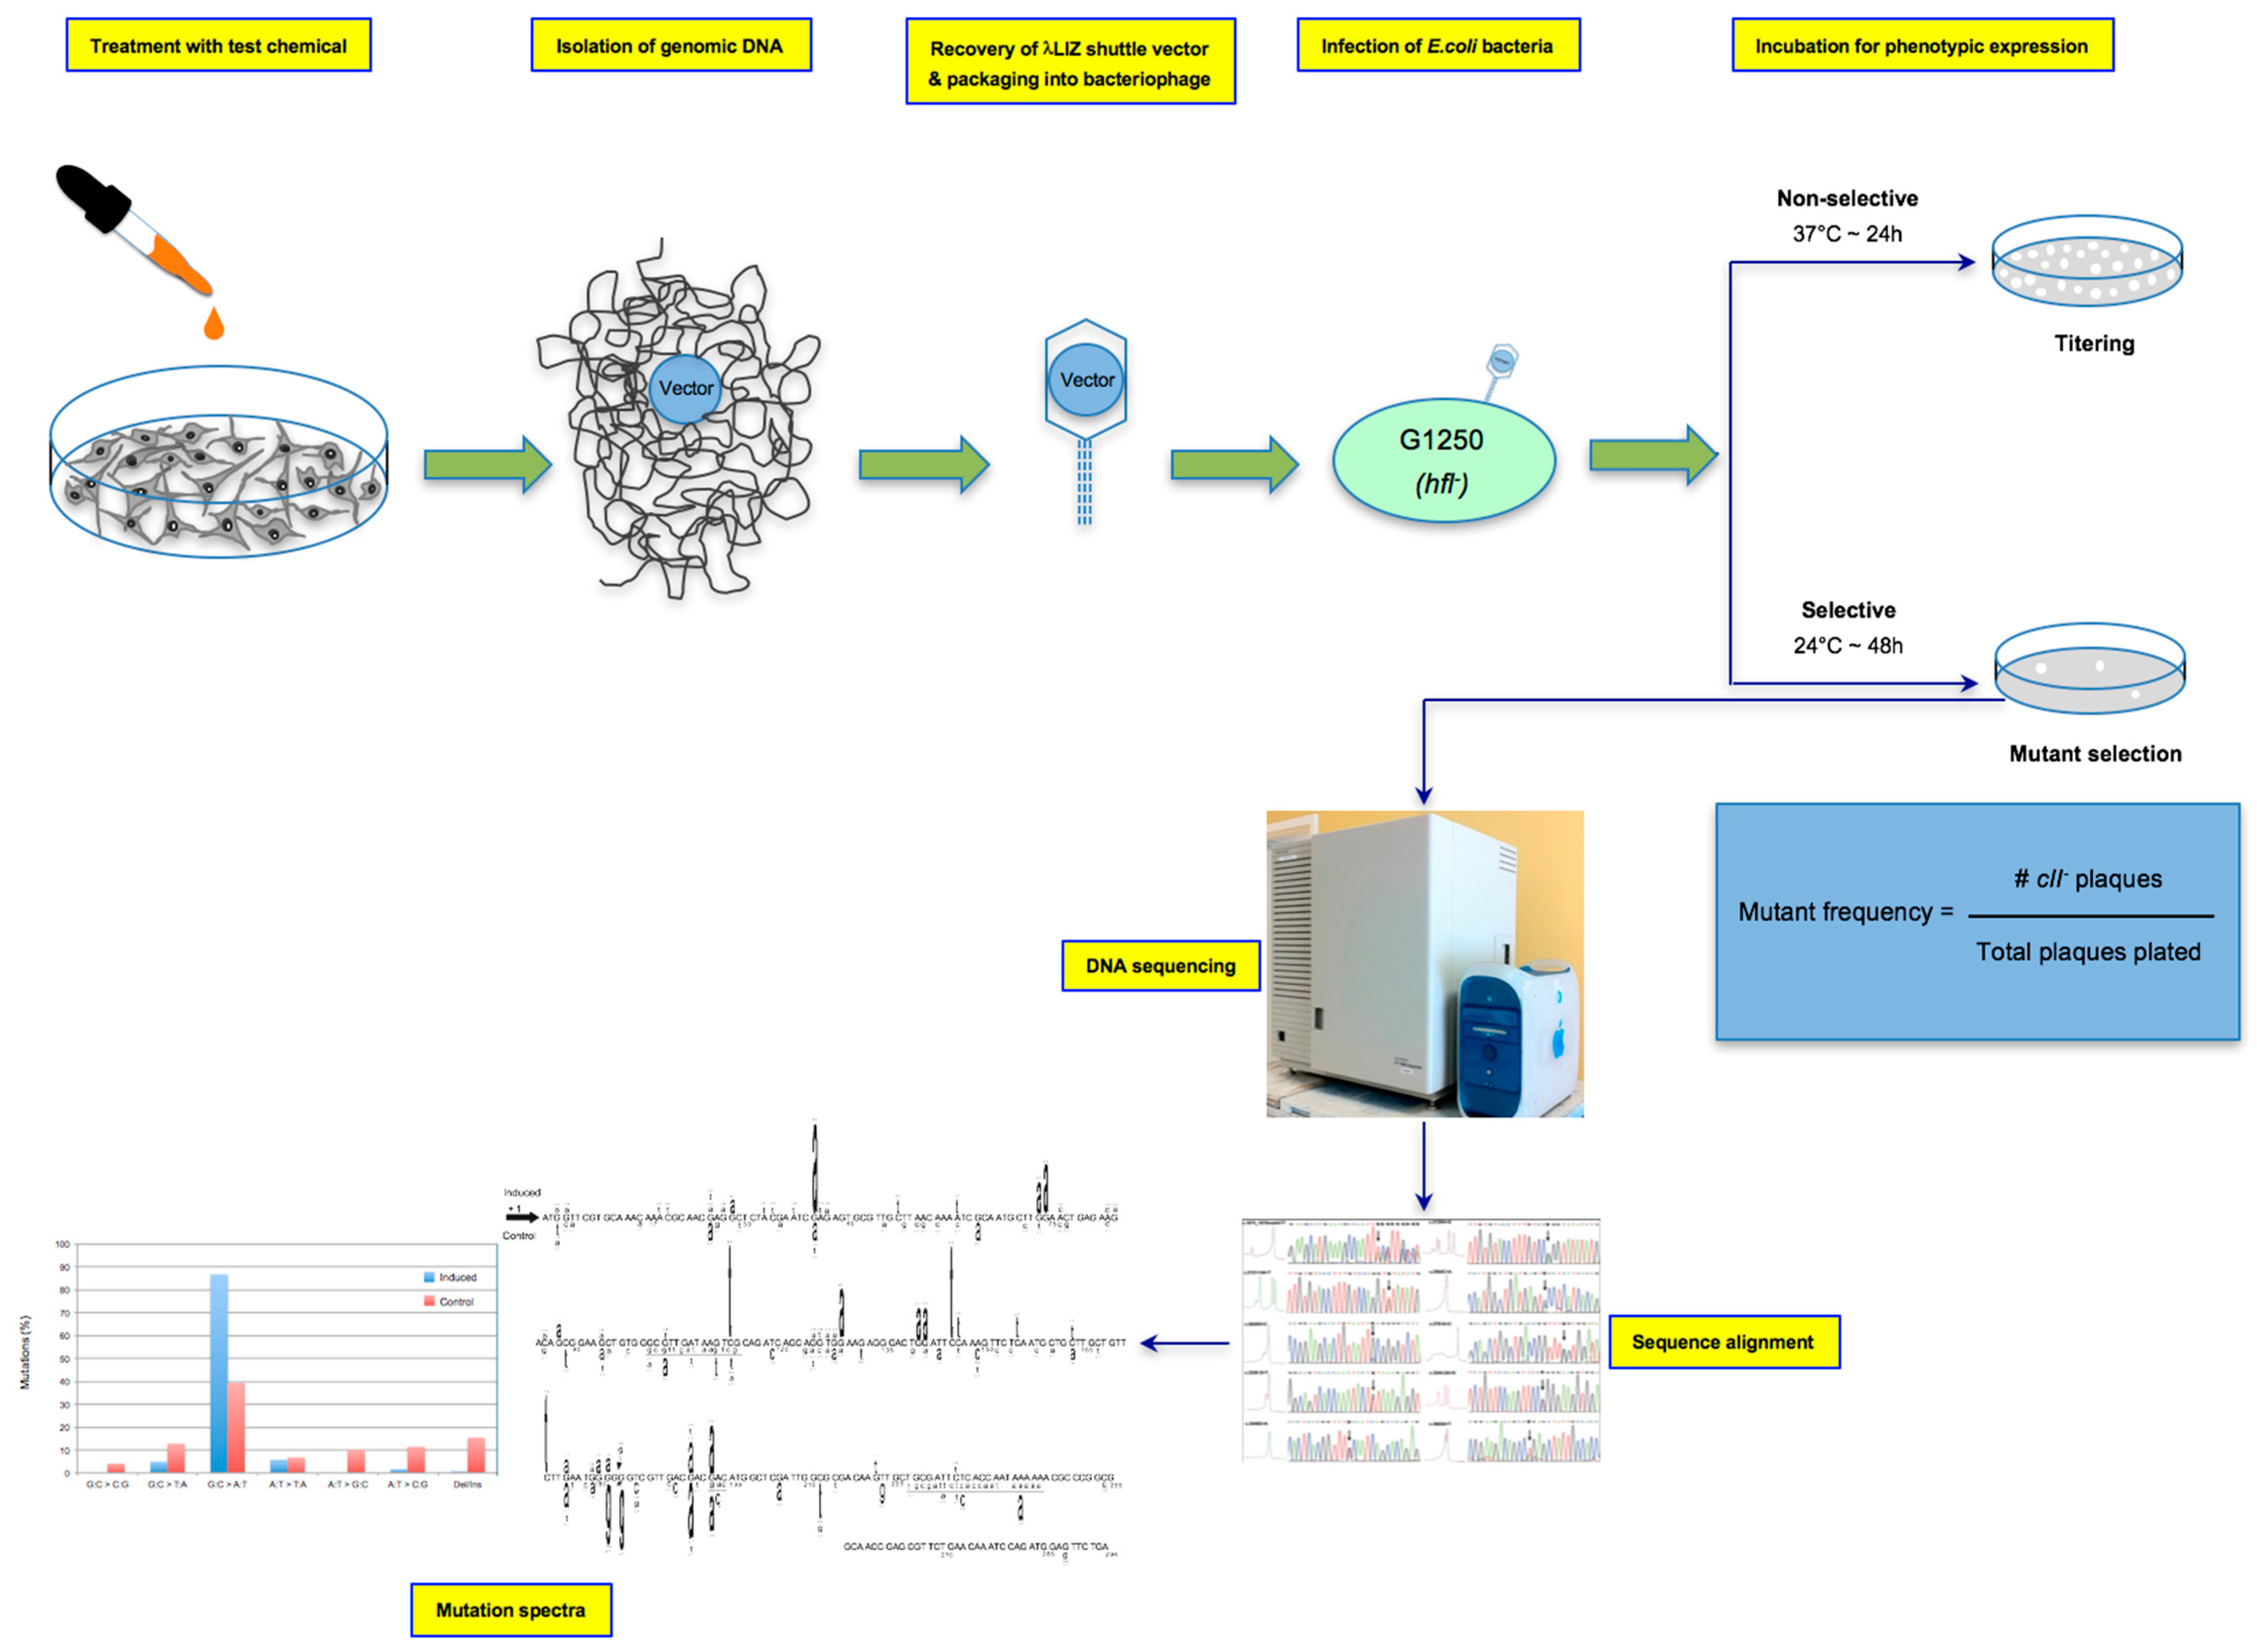
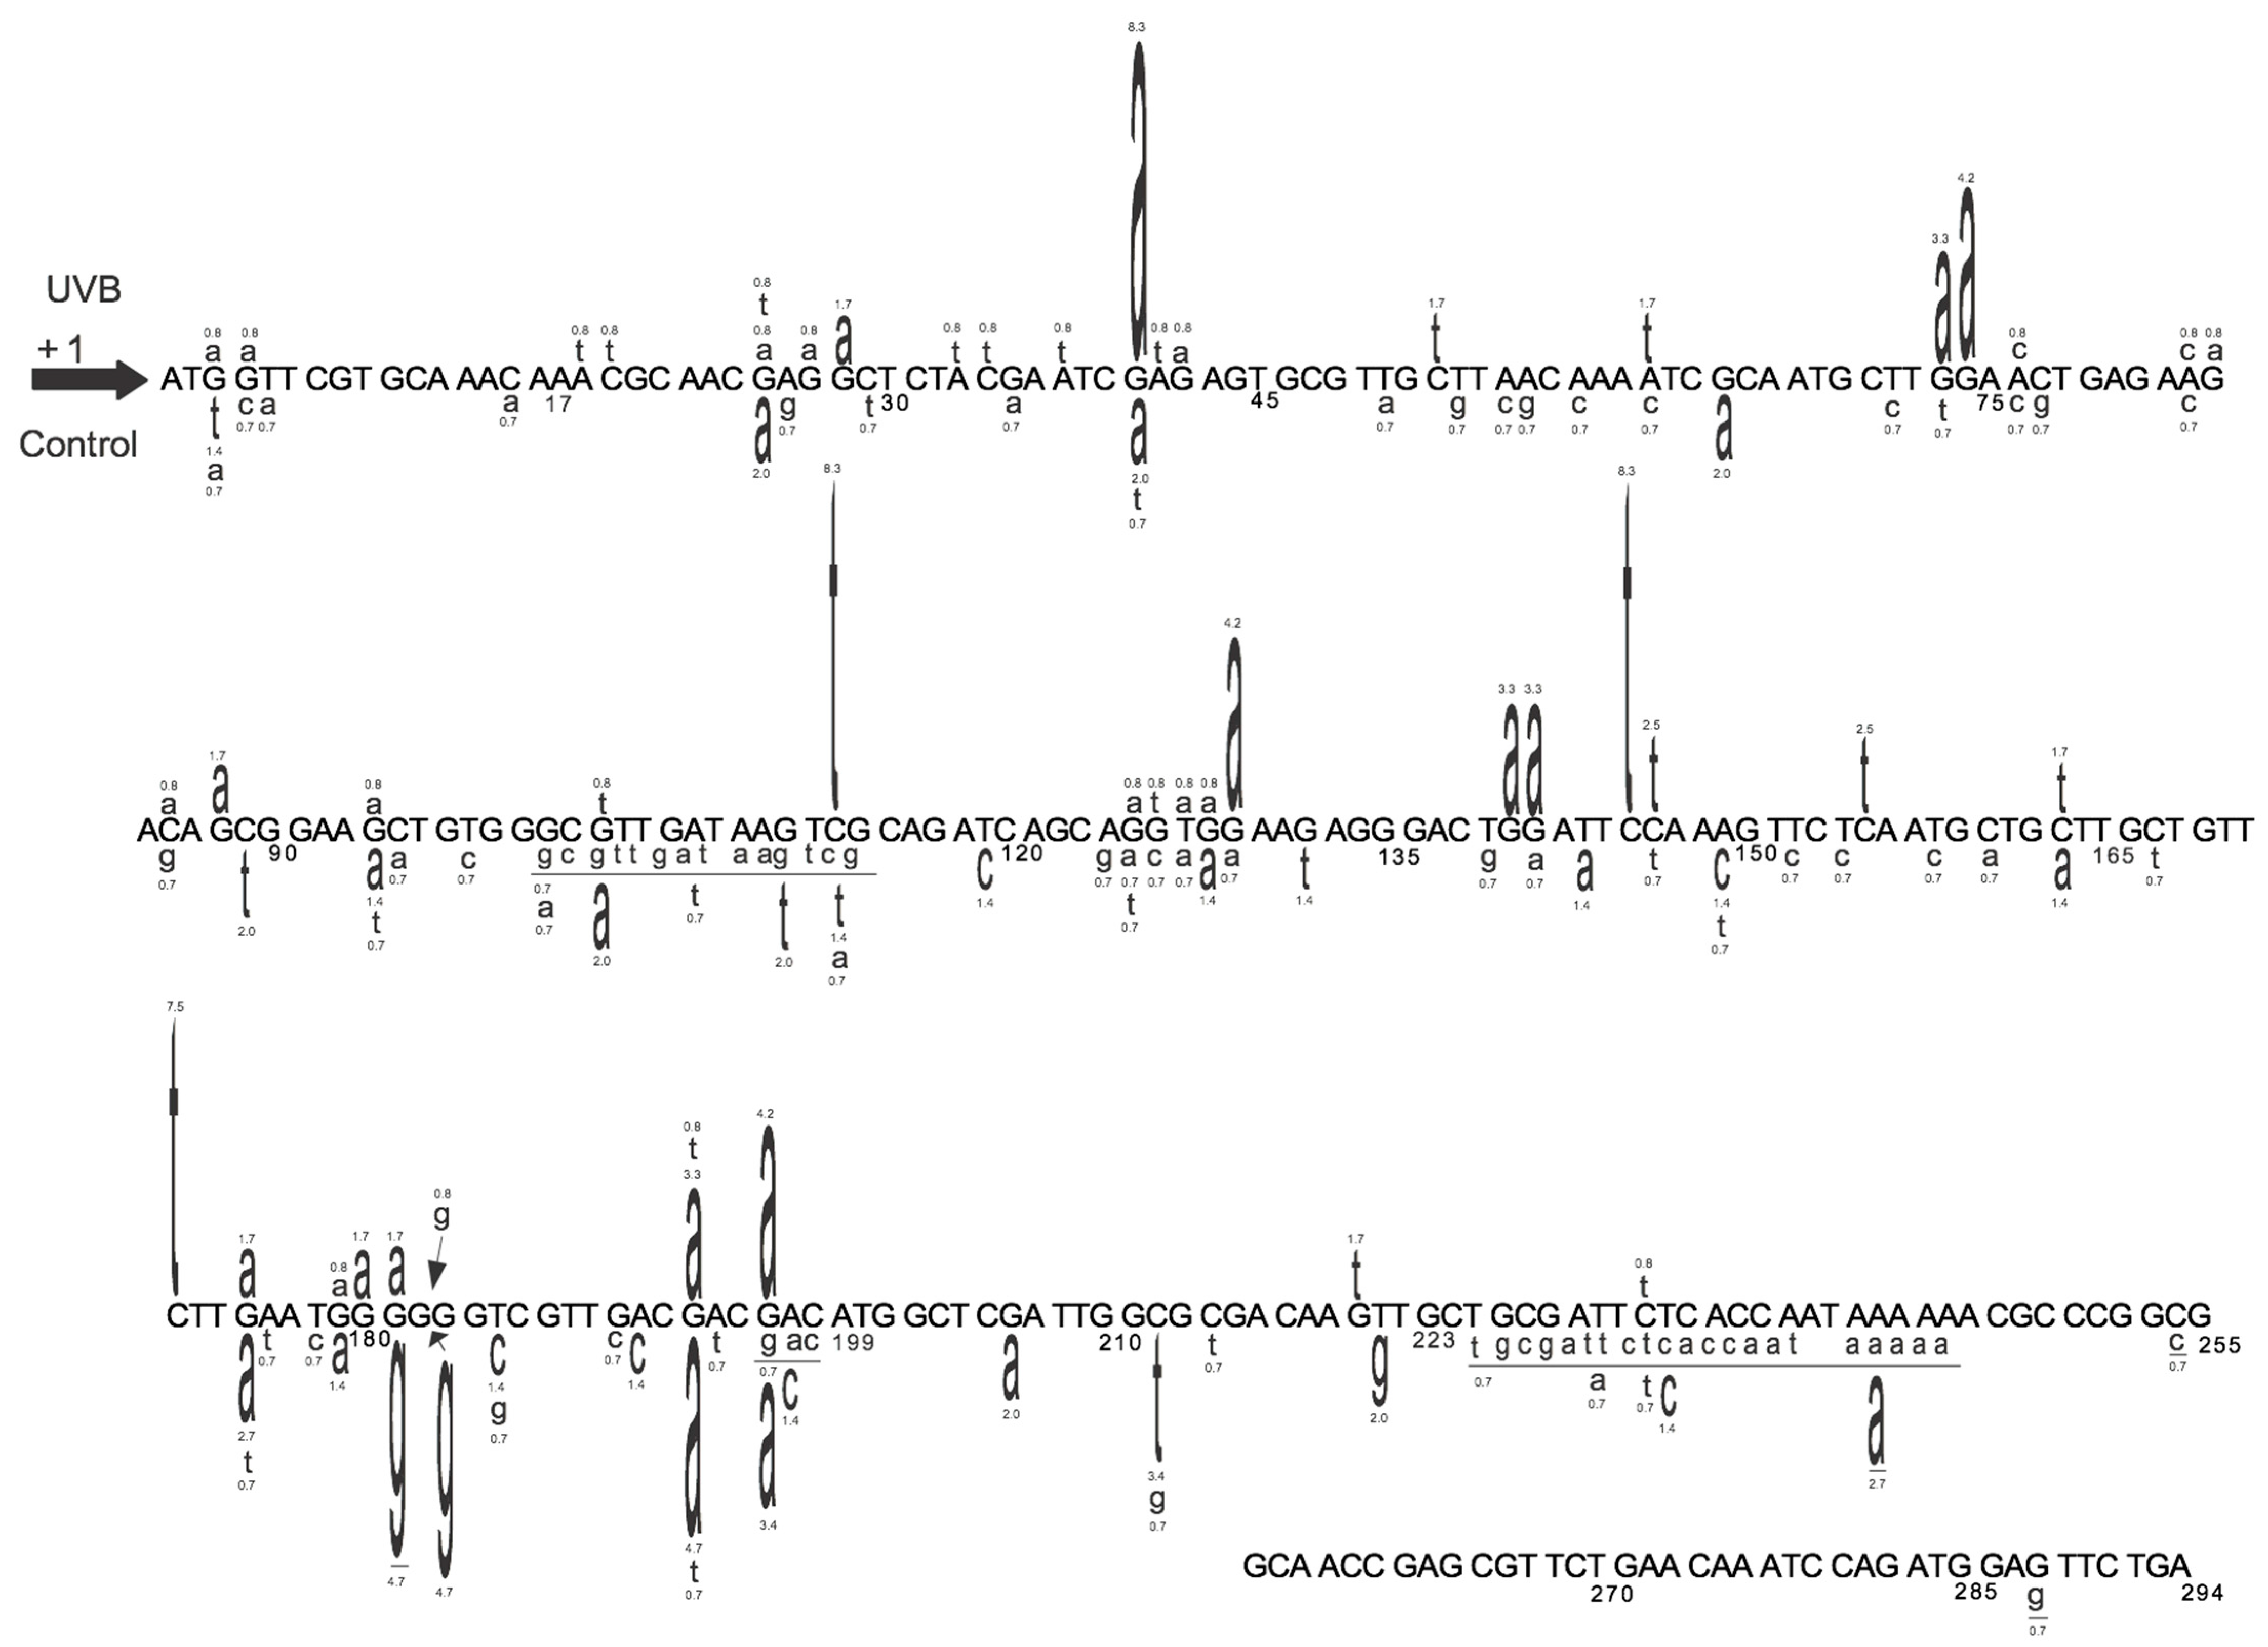
The extent of increase in relative cII mutant frequency, which is characterized by elevation of the cII mutant frequency in the genomic DNA of cells treated with a test compound relative to the control (e.g., solvent-treated cells), represents the strength of the tested compound to induce mutation. The fold-increase in cII mutant frequency may vary from a few to several hundred, depending on the test compound (see Figure 2). “Sequence-specificity” of mutations induced by the tested compound can be determined by DNA sequencing of the cII-mutant plaques recovered from the genomic DNA of cells treated with the examined chemical/agent as compared to the control. Graphical representations of the respective DNA sequencing data are commonly referred to as the “induced” and “spontaneous’ mutation spectra, respectively. The induced and spontaneous mutation spectra are visualized in different formats (see Figure 3, Figure 4 and Figure 5). All presentations are graphic forms of comparing and contrasting the distribution and frequency of various types of mutation (e.g., base substitution, insertion or deletion) in the cII transgene of mutant plaques recovered from the genomic DNA of treated cells versus control. For example, Figure 3 is a histogram presentation of the induced and control mutation spectra, showing the overall percentage of each type of mutation (e.g., G → A transition or G → T transversion) in the cII transgene in treated versus control samples. A bar chart display of the induced and control mutation spectra, highlighting the location and frequency distribution of mutations along the cII transgene in treated versus control samples, is shown in Figure 4. Figure 5 is a detailed map of the induced and control mutation spectra, in which the type, location and frequency distribution of mutations in the cII transgene in treated versus control samples are shown. Determination of the locations and site-specific frequency of mutations in the cII transgene induced by a test compound relative to the control is known as ‘mutation spectra analysis’. Comparative analysis of the induced and spontaneous (control) mutation spectra provides information on the sequence-specificity of mutations induced by the test compound.
3.2. Statistical Analysis and Interpretation of the Results
(I) Mutant frequency: Depending on the data distribution, parametric or non-parametric tests are used to determine the significance of difference in the cII mutant frequency between treatment and control groups (i.e., induced versus spontaneous mutant frequencies). Comparison of the induced cII mutant frequencies across different treatment groups is made by various (pairwise) statistical tests, as applicable. Examples of various statistical tests that can be used to compare differences in mutant frequency between a treatment and control group or across different treatment groups are provided in our published studies, in which acrylamide [15], glycidamide [17], aflatoxin B1 (AFB1) [25], tamoxifen [21], δ-aminolevulinic acid (δ-ALA) plus low dose ultraviolet light A (UVA: λ > 320–400 nm) [18], benzo(a)pyrene diol epoxide (B(a)PDE) [22] and equilethal doses of UVA, UVB (λ = 280–320 nm) and simulated sunlight UV (SSL) [24] were tested for mutagenicity (see Figure 2). For further information on the comparison of mutant frequencies, readers are referred to the OECD guidance regarding pairwise significance testing, trend test and comparison of the responses to the range of historical negative controls [34,35,36]. A positive has a significantly increased response, a positive trend and at least one response that exceeds the historical range of negative controls. If only one or two are true, the response is equivocal, and more testing may be called for [34,35,36].
(II) Mutation spectra: The hypergeometric test of Adams and Skopek is commonly used to compare the overall induced and spontaneous mutation spectra [39], although other tests, such as the χ2 test or analysis of variance (ANOVA), can also be used to compare the frequency of each specific type of mutation (e.g., transition, transversion, insertion or deletion) between the induced and control mutation spectra, or among various mutation spectra induced by different chemicals/agents or by various doses of the same chemical/agent. For example, in the corresponding study for Figure 3 [26], the χ2 test was used to compare the overall percentage of each type of mutation (e.g., transitions, transversions or insertion/deletion) in the cII transgene in UVB-irradiated versus control cells. Furthermore, the hypergeometric test of Adams and Skopek was employed to compare the location and frequency distribution of mutations along the cII transgene in the UVB-irradiated versus control cells, as shown in both Figure 4 and Figure 5 [26].
4. Discussion
Transgenic rodent cell culture models are invaluable supplements to the corresponding animal models for mutagenicity testing of carcinogens. In addition to circumventing the direct use of animals, these in vitro cell culture models enable mutation analysis at a fraction of the cost, time and labor as those required for the in vivo experiments in animal models [3,4,5]. The in vitro cell culture models, however, may not fully represent all aspects of mutagenesis in vivo. For instance, absent metabolic capacity or reduced proficiency of cultured cells to convert certain chemicals into DNA-reactive species might not reflect DNA-damage driven mutagenicity in animals exposed in vivo to genotoxic chemicals [2,4]. To offset this drawback, an external metabolic activation system (i.e., S9 mix) can be added to the in vitro cell culture models [40]. This axillary approach, however, may not be straightforward because exogenous metabolic activation mixtures prepared from different species may differently simulate mammalian metabolism (e.g., rat versus human-derived S9 mix). In addition, introduction of an external metabolic activation system to a cell culture model precludes tissue-specific or cell-type-dependent biotransformation, which is a determinant of the mutagenicity of many carcinogens [41,42].
Moreover, the route of exposure and delivery of carcinogens to animals, which are highly complex and often organ-specific, require modification to become compatible with the in vitro cell culture models [43,44]. For example, chemicals whose route of exposure is inhalation (e.g., tobacco smoke) are often made amenable to in vitro testing after they are converted from gaseous or vapor forms to liquid or condensate. This change in chemical properties is likely to complicate the pharmacokinetics and pharmacodynamics of the tested compound, however. Furthermore, the finite lifespan of normal cells in culture does not permit modeling of chronic exposure to carcinogens in vivo [2,4]. Both rat and mouse transgenic cell lines with virtually indefinite proliferative capacity are available for long-term experiments [8,10,11,45], although the extent to which immortalized cell lines accurately replicate primary cells remains a matter of debate [46]. Admittedly, mimicking real life human exposure to genotoxic chemicals/agents is more challenging in in vitro cell culture models than in experimental animals [47,48,49]. Nonetheless, mutagenicity testing in the former models can provide initial data that may prove instrumental in designing in vivo studies in appropriate animal models [2,4].
Elegant and comprehensive reviews have discussed the advantages and disadvantages of analyzing mutations in transgenes as compared to endogenous genes [4,29]. The weight of evidence suggests that transgenes and endogenous genes respond relatively similarly to genotoxic chemicals when direct comparisons have been made [24,25,50,51,52,53,54,55,56], although important differences may also exist [13,57,58,59,60]. For instance, spontaneous mutant frequency tends to be several-fold higher in transgenes than in endogenous genes; however, fold-increases in induced mutant frequency in transgenes are usually greater than those in endogenous genes (reviewed in [4]). For the most part, however, these two differences cancel each other out, resulting in similar (if not higher) “sensitivity” for mutation detection in transgenes relative to endogenous genes [4]. Furthermore, transgenes seem to be transcriptionally inactive, as evidenced by the absence of corresponding mRNA in various tissues of transgenic animals (reviewed in [4,29]). This is important because transcription-coupled repair (TCR), which preferentially removes DNA lesions from the transcribed strand of endogenous genes, is a significant determinant of mutagenesis in experimental animals and humans alike [61,62]. The reduced DNA repair capacity of transgenes due to the absence of TCR, however, may be advantageous for the detection of induced mutations. This is due to the fact that transgenes with diminished DNA repair proficiency are more likely to accumulate DNA lesions and mutations than endogenous genes. This together with the high copy number of transgenes relative to single copy endogenous genes may contribute to the high sensitivity of transgenes for mutation detection.
Transgenes have high CG content and are heavily methylated [4], which may impact DNA-damage formation, as many genotoxic chemicals/agents are known to preferentially bind to methylated CpG dinucleotides in the genome [63,64,65]. In addition, whereas selection plays an important role in mutagenesis in endogenous genes, transgenes appear to be neutral [50,66,67,68]. This is supported by the observation that induced mutant frequency in highly proliferating tissues of transgenic animals remains persistently elevated long after termination of exposure to carcinogens [29]. The induced mutant frequency in tissues from which mutagenized cells transit as part of their development (e.g., bone marrow), however, may not remain as persistent [29].
There are constraints on types of recoverable mutation in transgenes. For example, the overwhelming majority of mutations recovered from analysis of the cII transgene in the Big Blue® system are point mutations, involving base substitutions and less frequently small frameshifts (insertion/deletion) [4,69]. Large deletions that extend into or through sequences necessary for λ phage propagation would not be detected as they will not be recoverable [6,69]. Furthermore, there are size limitations for in vitro packaging, requiring λ vectors to have cos sites separated by 38–51 kb. Therefore, insertions and deletions that produce vectors outside this size range will not be recovered in the Big Blue® system [50,69,70,71]. The gpt delta (Spi−) and LacZ plasmid-based mouse systems are available for the detection and characterization of such large deletion mutations, however [4,72].
In the Big Blue® system, the λ Select cII assay serves as a positive selection test since cells containing the wildtype phages are selected against before the mutations arise [6]. As such, ex vivo mutations occurring in the bacteria infected with lesion-bearing phages or in vitro mutations arising spontaneously during growth of the phages in bacteria are unlikely to be recognized/detected in this assay [4,6,73]. This is a significant “specificity” advantage for the assay because the above artefactual mutations are not of mammalian origin and do not represent a response to the DNA damage induced by the test chemical/agent(s). Likewise, the “sensitivity” of the assay for the detection of mutations induced by various test chemicals/agents has proven to be reproducibly high. Of relevance for transgenic cell culture models, prolonged in vitro culturing of cells may lead to accumulation of oxidative stress-induced DNA damage [74,75,76,77], which manifests as elevation of spontaneous mutant frequency a few-fold higher than that found in vivo in tissues/organs of the corresponding transgenic animals [4]. Altogether, although for a select number of chemicals or agents that have been tested both in cultured cells of transgenic mice/rats and the corresponding animals treated with the test compound, mostly consistent results have been observed, disparate findings have also been reported [4,29].
5. Conclusions
In summary, the Big Blue® rodent cell culture model and the λ Select cII assay constitute a versatile approach for mutagenicity testing of carcinogens. The possibility of preparing primary cell cultures from various tissues/organs of transgenic Big Blue® animals, the feasibility of treating cultured cells in vitro with virtually any test chemical/agent, the easy recovery of the λ shuttle vector carrying a relatively short reporter gene amenable to rapid DNA sequencing (cII; 294 bp versus lacI: 1080 bp, LacZ: 3021 bp, gpt: 456 bp [4]) make this approach highly desirable for initial testing of suspect mutagens. More recently, we have expanded the applications of this approach by developing a novel technique in which a revised version of the λ Select cII assay coupled to next-generation sequencing platforms offers high throughput analysis of mutations in a time-, cost- and labor-effective manner [26].
Acknowledgments
We would like to acknowledge the contributions of all colleagues and collaborators to our original studies that have been showcased in this manuscript. Work of the authors is supported by grants from the National Institute of Dental and Craniofacial Research of the National Institutes of Health (1R01DE026043) to Ahmad Besaratinia and from the University of California Tobacco-Related Disease Research Program to Ahmad Besaratinia (TRDRP-26IR-0015) and Stella Tommasi (TRDRP-25IP-0001). The sponsors of the study had no role in study design, data collection, data analysis, data interpretation, writing of the report, nor in the decision to submit for publication.
Conflicts of Interest
The authors declare no conflicts of interest.
Abbreviations
| ANOVA | analysis of variance |
| DMEM | Dulbecco’s Modified Eagle’s Medium |
| DMSO | dimethylsulfoxide |
| E. coli | Escherichia coli |
| FBS | fetal calf serum |
| PBS | phosphate-buffered saline |
References
- Russell, W.M.S.; Burch, R.L. The Principles of Humane Experimental Technique; Methuen: London, UK, 1959. [Google Scholar]
- Besaratinia, A.; Pfeifer, G.P. Investigating human cancer etiology by DNA lesion footprinting and mutagenicity analysis. Carcinogenesis 2006, 27, 1526–1537. [Google Scholar] [CrossRef] [PubMed]
- Thybaud, V.; Dean, S.; Nohmi, T.; de Boer, J.; Douglas, G.R.; Glickman, B.W.; Gorelick, N.J.; Heddle, J.A.; Heflich, R.H.; Lambert, I.; et al. In vivo transgenic mutation assays. Mutat. Res. 2003, 540, 141–151. [Google Scholar] [CrossRef] [PubMed]
- Lambert, I.B.; Singer, T.M.; Boucher, S.E.; Douglas, G.R. Detailed review of transgenic rodent mutation assays. Mutat. Res. 2005, 590, 1–280. [Google Scholar] [CrossRef] [PubMed]
- Swiger, R.R. Quantifying in vivo somatic mutations using transgenic mouse model systems. Methods Mol. Biol. 2014, 1105, 271–282. [Google Scholar] [PubMed]
- Jakubczak, J.L.; Merlino, G.; French, J.E.; Muller, W.J.; Paul, B.; Adhya, S.; Garges, S. Analysis of genetic instability during mammary tumor progression using a novel selection-based assay for in vivo mutations in a bacteriophage lambda transgene target. Proc. Natl. Acad. Sci. USA 1996, 93, 9073–9078. [Google Scholar] [CrossRef] [PubMed]
- Watson, D.E.; Cunningham, M.L.; Tindall, K.R. Spontaneous and ENU-induced mutation spectra at the cII locus in Big Blue Rat2 embryonic fibroblasts. Mutagenesis 1998, 13, 487–497. [Google Scholar] [CrossRef] [PubMed]
- Erexson, G.L.; Watson, D.E.; Tindall, K.R. Characterization of new transgenic Big Blue(R) mouse and rat primary fibroblast cell strains for use in molecular toxicology studies. Environ. Mol. Mutagen. 1999, 34, 90–96. [Google Scholar] [CrossRef]
- Erexson, G.L.; Tindall, K.R. Micronuclei and gene mutations in transgenic big Blue((R)) mouse and rat fibroblasts after exposure to the epoxide metabolites of 1, 3-butadiene. Mutat. Res. 2000, 472, 105–117. [Google Scholar] [CrossRef]
- McDiarmid, H.M.; Douglas, G.R.; Coomber, B.L.; Josephy, P.D. 2-Amino-1-methyl-6-phenylimidazo[4,5-b]pyridine (PhIP)-induced mutagenesis in cultured Big Blue rat mammary epithelial and fibroblast cells. Environ. Mol. Mutagen. 2002, 39, 245–253. [Google Scholar] [CrossRef] [PubMed]
- Papp-Szabo, E.; Douglas, G.R.; Coomber, B.L.; Josephy, P.D. Mutagenicity of the oral carcinogen 4-nitroquinoline-1-oxide in cultured BigBlue rat tongue epithelial cells and fibroblasts. Mutat. Res. 2003, 522, 107–117. [Google Scholar] [CrossRef]
- Guichard, Y.; Gate, L.; Darne, C.; Bottin, M.C.; Langlais, C.; Micillino, J.C.; Goutet, M.; Julien, S.; Stephane, B. In Vitro Study of Mutagenesis Induced by Crocidolite-Exposed Alveolar Macrophages NR8383 in Cocultured Big Blue Rat2 Embryonic Fibroblasts. J. Toxicol. 2010, 2010, 323828. [Google Scholar] [CrossRef] [PubMed]
- Besaratinia, A.; Bates, S.E.; Pfeifer, G.P. Mutational signature of the proximate bladder carcinogen N-hydroxy-4-acetylaminobiphenyl: Inconsistency with the p53 mutational spectrum in bladder cancer. Cancer Res. 2002, 62, 4331–4338. [Google Scholar] [PubMed]
- Besaratinia, A.; Pfeifer, G.P. Enhancement of the mutagenicity of benzo(a)pyrene diol epoxide by a nonmutagenic dose of ultraviolet A radiation. Cancer Res. 2003, 63, 8708–8716. [Google Scholar] [PubMed]
- Besaratinia, A.; Pfeifer, G.P. Weak yet distinct mutagenicity of acrylamide in mammalian cells. J. Natl. Cancer Inst. 2003, 95, 889–896. [Google Scholar] [CrossRef] [PubMed]
- Besaratinia, A.; Pfeifer, G.P. Biological consequences of 8-methoxypsoralen-photoinduced lesions: Sequence-specificity of mutations and preponderance of T to C and T to a mutations. J. Investig. Dermatol. 2004, 123, 1140–1146. [Google Scholar] [CrossRef] [PubMed]
- Besaratinia, A.; Pfeifer, G.P. Genotoxicity of acrylamide and glycidamide. J. Natl. Cancer Inst. 2004, 96, 1023–1029. [Google Scholar] [CrossRef] [PubMed]
- Besaratinia, A.; Bates, S.E.; Synold, T.W.; Pfeifer, G.P. Similar mutagenicity of photoactivated porphyrins and ultraviolet A radiation in mouse embryonic fibroblasts: Involvement of oxidative DNA lesions in mutagenesis. Biochemistry 2004, 43, 15557–15566. [Google Scholar] [CrossRef] [PubMed]
- Yoon, J.H.; Besaratinia, A.; Feng, Z.; Tang, M.S.; Amin, S.; Luch, A.; Pfeifer, G.P. DNA damage, repair, and mutation induction by (+)-Syn and (−)-anti-dibenzo[a,l]pyrene-11,12-diol-13,14-epoxides in mouse cells. Cancer Res. 2004, 64, 7321–7328. [Google Scholar] [CrossRef] [PubMed]
- Besaratinia, A.; Synold, T.W.; Xi, B.; Pfeifer, G.P. G-to-T transversions and small tandem base deletions are the hallmark of mutations induced by ultraviolet a radiation in mammalian cells. Biochemistry 2004, 43, 8169–8177. [Google Scholar] [CrossRef] [PubMed]
- Besaratinia, A.; Pfeifer, G.P. Investigating DNA adduct-targeted mutagenicity of tamoxifen: Preferential formation of tamoxifen-DNA adducts in the human p53 gene in SV40 immortalized hepatocytes but not endometrial carcinoma cells. Biochemistry 2005, 44, 8418–8427. [Google Scholar] [CrossRef] [PubMed]
- Kim, S.I.; Pfeifer, G.P.; Besaratinia, A. Lack of mutagenicity of acrolein-induced DNA adducts in mouse and human cells. Cancer Res. 2007, 67, 11640–11647. [Google Scholar] [CrossRef] [PubMed]
- Besaratinia, A.; Kim, S.I.; Bates, S.E.; Pfeifer, G.P. Riboflavin activated by ultraviolet A1 irradiation induces oxidative DNA damage-mediated mutations inhibited by vitamin C. Proc. Natl. Acad. Sci. USA 2007, 104, 5953–5958. [Google Scholar] [CrossRef] [PubMed]
- Besaratinia, A.; Kim, S.I.; Pfeifer, G.P. Rapid repair of UVA-induced oxidized purines and persistence of UVB-induced dipyrimidine lesions determine the mutagenicity of sunlight in mouse cells. FASEB J. Off. Publ. Fed. Am. Soc. Exp. Biol. 2008, 22, 2379–2392. [Google Scholar] [CrossRef] [PubMed]
- Besaratinia, A.; Kim, S.I.; Hainaut, P.; Pfeifer, G.P. In vitro recapitulating of TP53 mutagenesis in hepatocellular carcinoma associated with dietary aflatoxin B1 exposure. Gastroenterology 2009, 137, 1127–1137, 1137.e1–1137.e5. [Google Scholar] [CrossRef] [PubMed]
- Besaratinia, A.; Li, H.; Yoon, J.I.; Zheng, A.; Gao, H.; Tommasi, S. A high-throughput next-generation sequencing-based method for detecting the mutational fingerprint of carcinogens. Nucleic Acids Res. 2012, 40, e116. [Google Scholar] [CrossRef] [PubMed]
- Tommasi, S.; Bates, S.E.; Behar, R.Z.; Talbot, P.; Besaratinia, A. Limited mutagenicity of electronic cigarettes in mouse or human cells in vitro. Lung Cancer 2017, 112, 41–46. [Google Scholar] [CrossRef] [PubMed]
- Dycaico, M.J.; Provost, G.S.; Kretz, P.L.; Ransom, S.L.; Moores, J.C.; Short, J.M. The use of shuttle vectors for mutation analysis in transgenic mice and rats. Mutat. Res. 1994, 307, 461–478. [Google Scholar] [CrossRef]
- Heddle, J.A.; Martus, H.J.; Douglas, G.R. Treatment and sampling protocols for transgenic mutation assays. Environ. Mol. Mutagen. 2003, 41, 1–6. [Google Scholar] [CrossRef] [PubMed]
- Tommasi, S.; Besaratinia, A.; Wilczynski, S.P.; Pfeifer, G.P. Loss of Rassf1a enhances p53-mediated tumor predisposition and accelerates progression to aneuploidy. Oncogene 2011, 30, 690–700. [Google Scholar] [CrossRef] [PubMed]
- Yuan, C.; He, Q.; Li, J.M.; Azzam, M.M.; Lu, J.J.; Zou, X.T. Evaluation of embryonic age and the effects of different proteases on the isolation and primary culture of chicken intestinal epithelial cells in vitro. Anim. Sci. J. 2015, 86, 588–594. [Google Scholar] [CrossRef] [PubMed]
- Fellows, M.D.; O’Donovan, M.R.; Lorge, E.; Kirkland, D. Comparison of different methods for an accurate assessment of cytotoxicity in the in vitro micronucleus test. II: Practical aspects with toxic agents. Mutat. Res. 2008, 655, 4–21. [Google Scholar] [CrossRef] [PubMed]
- Rossman, T.G. Inappropriate cytotoxicity measurements. Environ. Mol. Mutagen. 2009, 50, 81. [Google Scholar] [CrossRef] [PubMed]
- Organization for Economic Co-operation and Development (OECD). The OECD Guidelines for the Testing of Chemicals: In Vitro Mammalian Cell Micronucleus Test 2014; OECD: Paris, France, 2014. [Google Scholar]
- Organization for Economic Co-operation and Development (OECD). OECD Guideline for the Testing of Chemicals: In Vitro Mammalian Cell Gene Mutation Tests Using the Hprt and Xprt Genes; OECD: Paris, France, 2014. [Google Scholar]
- Organization for Economic Co-operation and Development (OECD). Guidance Document on Revisions to OECD Genetic Toxicology Test Guidelines; OECD: Paris, France, 2015. [Google Scholar]
- Agilent Technologies, Stratagene Products Division. λ Select-cII Mutation Detection System for Big Blue Rodents. Instruction Manual; Catalog #720120; Revision B.0. Available online: https://www.agilent.com/cs/library/usermanuals/public/720120.pdf (accessed on 10 January 2018).
- Herskowitz, I.; Hagen, D. The lysis-lysogeny decision of phage lambda: Explicit programming and responsiveness. Annu. Rev. Genet. 1980, 14, 399–445. [Google Scholar] [CrossRef] [PubMed]
- Adams, W.T.; Skopek, T.R. Statistical test for the comparison of samples from mutational spectra. J. Mol. Biol. 1987, 194, 391–396. [Google Scholar] [CrossRef]
- Cox, J.A.; Fellows, M.D.; Hashizume, T.; White, P.A. The utility of metabolic activation mixtures containing human hepatic post-mitochondrial supernatant (S9) for in vitro genetic toxicity assessment. Mutagenesis 2016, 31, 117–130. [Google Scholar] [CrossRef] [PubMed]
- Brambilla, G.; Martelli, A. Failure of the standard battery of short-term tests in detecting some rodent and human genotoxic carcinogens. Toxicology 2004, 196, 1–19. [Google Scholar] [CrossRef] [PubMed]
- DeMarini, D.M.; Gudi, R.; Szkudlinska, A.; Rao, M.; Recio, L.; Kehl, M.; Kirby, P.E.; Polzin, G.; Richter, P.A. Genotoxicity of 10 cigarette smoke condensates in four test systems: Comparisons between assays and condensates. Mutat. Res. 2008, 650, 15–29. [Google Scholar] [CrossRef] [PubMed]
- Henkler, F.; Stolpmann, K.; Luch, A. Exposure to polycyclic aromatic hydrocarbons: Bulky DNA adducts and cellular responses. EXS 2012, 101, 107–131. [Google Scholar] [PubMed]
- Gibbs, S.; van de Sandt, J.J.; Merk, H.F.; Lockley, D.J.; Pendlington, R.U.; Pease, C.K. Xenobiotic metabolism in human skin and 3D human skin reconstructs: A review. Curr. Drug Metab. 2007, 8, 758–772. [Google Scholar] [CrossRef] [PubMed]
- Wyborski, D.L.; Malkhosyan, S.; Moores, J.; Perucho, M.; Short, J.M. Development of a rat cell line containing stably integrated copies of a lambda/lacI shuttle vector. Mutat. Res. 1995, 334, 161–165. [Google Scholar] [CrossRef]
- Marx, V. Cell-line authentication demystified. Nat. Methods 2014, 11, 483–488. [Google Scholar] [CrossRef] [PubMed]
- LeBlanc, G.A.; Bain, L.J. Chronic toxicity of environmental contaminants: Sentinels and biomarkers. Environ. Health Perspect. 1997, 105 (Suppl. 1), 65–80. [Google Scholar] [CrossRef] [PubMed]
- Arlt, V.M.; Stiborova, M.; vom Brocke, J.; Simoes, M.L.; Lord, G.M.; Nortier, J.L.; Hollstein, M.; Phillips, D.H.; Schmeiser, H.H. Aristolochic acid mutagenesis: Molecular clues to the aetiology of Balkan endemic nephropathy-associated urothelial cancer. Carcinogenesis 2007, 28, 2253–2261. [Google Scholar] [CrossRef] [PubMed]
- Besaratinia, A.; Pfeifer, G.P. Second-hand smoke and human lung cancer. Lancet Oncol. 2008, 9, 657–666. [Google Scholar] [CrossRef]
- Tao, K.S.; Urlando, C.; Heddle, J.A. Comparison of somatic mutation in a transgenic versus host locus. Proc. Natl. Acad. Sci. USA 1993, 90, 10681–10685. [Google Scholar] [CrossRef] [PubMed]
- Walker, V.E.; Gorelick, N.J.; Andrews, J.L.; Craft, T.R.; deBoer, J.G.; Glickman, B.W.; Skopek, T.R. Frequency and spectrum of ethylnitrosourea-induced mutation at the hprt and lacI loci in splenic lymphocytes of exposed lacI transgenic mice. Cancer Res. 1996, 56, 4654–4661. [Google Scholar] [PubMed]
- Chen, T.; Aidoo, A.; Manjanatha, M.G.; Mittelstaedt, R.A.; Shelton, S.D.; Lyn-Cook, L.E.; Casciano, D.A.; Heflich, R.H. Comparison of mutant frequencies and types of mutations induced by thiotepa in the endogenous Hprt gene and transgenic lacI gene of Big Blue rats. Mutat. Res. 1998, 403, 199–214. [Google Scholar] [CrossRef]
- Cosentino, L.; Heddle, J.A. A comparison of the effects of diverse mutagens at the lacZ transgene and Dlb-1 locus in vivo. Mutagenesis 1999, 14, 113–119. [Google Scholar] [CrossRef] [PubMed]
- Shane, B.S.; de Boer, J.; Watson, D.E.; Haseman, J.K.; Glickman, B.W.; Tindall, K.R. LacI mutation spectra following benzo[a]pyrene treatment of Big Blue mice. Carcinogenesis 2000, 21, 715–725. [Google Scholar] [CrossRef] [PubMed]
- Kim, S.I.; Yoon, J.I.; Tommasi, S.; Besaratinia, A. New experimental data linking secondhand smoke exposure to lung cancer in nonsmokers. FASEB J. Off. Publ. Fed. Am. Soc. Exp. Biol. 2012, 26, 1845–1854. [Google Scholar] [CrossRef] [PubMed]
- Beal, M.A.; Gagne, R.; Williams, A.; Marchetti, F.; Yauk, C.L. Characterizing Benzo[a]pyrene-induced lacZ mutation spectrum in transgenic mice using next-generation sequencing. BMC Genom. 2015, 16, 812. [Google Scholar] [CrossRef] [PubMed]
- Shaver-Walker, P.M.; Urlando, C.; Tao, K.S.; Zhang, X.B.; Heddle, J.A. Enhanced somatic mutation rates induced in stem cells of mice by low chronic exposure to ethylnitrosourea. Proc. Natl. Acad. Sci. USA 1995, 92, 11470–11474. [Google Scholar] [CrossRef] [PubMed]
- Skopek, T.R.; Kort, K.L.; Marino, D.R.; Mittal, L.V.; Umbenhauer, D.R.; Laws, G.M.; Adams, S.P. Mutagenic response of the endogenous hprt gene and lacI transgene in benzo[a]pyrene-treated Big Blue B6C3F1 mice. Environ. Mol. Mutagen. 1996, 28, 376–384. [Google Scholar] [CrossRef]
- Mittelstaedt, R.A.; Manjanatha, M.G.; Shelton, S.D.; Lyn-Cook, L.E.; Chen, J.B.; Aidoo, A.; Casciano, D.A.; Heflich, R.H. Comparison of the types of mutations induced by 7,12-dimethylbenz[a]anthracene in the lacI and hprt genes of Big Blue rats. Environ. Mol. Mutagen. 1998, 31, 149–156. [Google Scholar] [CrossRef]
- Cosentino, L.; Heddle, J.A. Differential mutation of transgenic and endogenous loci in vivo. Mutat. Res. 2000, 454, 1–10. [Google Scholar] [CrossRef]
- Mellon, I.; Spivak, G.; Hanawalt, P.C. Selective removal of transcription-blocking DNA damage from the transcribed strand of the mammalian DHFR gene. Cell 1987, 51, 241–249. [Google Scholar] [CrossRef]
- Hanawalt, P.C. Transcription-coupled repair and human disease. Science 1994, 266, 1957–1958. [Google Scholar] [CrossRef] [PubMed]
- Tommasi, S.; Denissenko, M.F.; Pfeifer, G.P. Sunlight induces pyrimidine dimers preferentially at 5-methylcytosine bases. Cancer Res. 1997, 57, 4727–4730. [Google Scholar] [PubMed]
- Pfeifer, G.P.; Besaratinia, A. Mutational spectra of human cancer. Hum. Genet. 2009, 125, 493–506. [Google Scholar] [CrossRef] [PubMed]
- Poulos, R.C.; Olivier, J.; Wong, J.W.H. The interaction between cytosine methylation and processes of DNA replication and repair shape the mutational landscape of cancer genomes. Nucleic Acids Res. 2017, 45, 7786–7795. [Google Scholar] [CrossRef] [PubMed]
- Cosentino, L.; Heddle, J.A. A test for neutrality of mutations of the lacZ transgene. Environ. Mol. Mutagen. 1996, 28, 313–316. [Google Scholar] [CrossRef]
- Swiger, R.R.; Cosentino, L.; Masumura, K.I.; Nohmi, T.; Heddle, J.A. Further characterization and validation of gpt delta transgenic mice for quantifying somatic mutations in vivo. Environ. Mol. Mutagen. 2001, 37, 297–303. [Google Scholar] [CrossRef] [PubMed]
- Swiger, R.R.; Cosentino, L.; Shima, N.; Bielas, J.H.; Cruz-Munoz, W.; Heddle, J.A. The cII locus in the MutaMouse system. Environ. Mol. Mutagen. 1999, 34, 201–207. [Google Scholar] [CrossRef]
- Manjanatha, M.G.; Cao, X.; Shelton, S.D.; Mittelstaedt, R.A.; Heflich, R.H. In vivo cII, gpt, and Spi(-) gene mutation assays in transgenic mice and rats. Methods Mol. Biol. 2013, 1044, 97–119. [Google Scholar] [PubMed]
- Yatagai, F.; Nohmi, T.; Kusakabe, M.; Masumura, K.; Yoshiki, A.; Yamaguchi, H.; Kurobe, T.; Kuniya, K.; Hanaoka, F.; Yano, Y. Mutation induction by heavy-ion irradiation of gpt delta transgenic mice. Phys. Medica 2001, 17 (Suppl. 1), 192–193. [Google Scholar]
- Bhalli, J.A.; Shaddock, J.G.; Pearce, M.G.; Dobrovolsky, V.N. Sensitivity of the Pig-a assay for detecting gene mutation in rats exposed acutely to strong clastogens. Mutagenesis 2013, 28, 447–455. [Google Scholar] [CrossRef] [PubMed]
- Nohmi, T.; Masumura, K. Gpt delta transgenic mouse: A novel approach for molecular dissection of deletion mutations in vivo. Adv. Biophys. 2004, 38, 97–121. [Google Scholar] [CrossRef]
- Swiger, R.R. Just how does the cII selection system work in Muta Mouse? Environ. Mol. Mutagen. 2001, 37, 290–296. [Google Scholar] [CrossRef] [PubMed]
- Parrinello, S.; Samper, E.; Krtolica, A.; Goldstein, J.; Melov, S.; Campisi, J. Oxygen sensitivity severely limits the replicative lifespan of murine fibroblasts. Nat. Cell Biol. 2003, 5, 741–747. [Google Scholar] [CrossRef] [PubMed]
- D’Adda di Fagagna, F. Living on a break: Cellular senescence as a DNA-damage response. Nat. Rev. Cancer 2008, 8, 512–522. [Google Scholar] [CrossRef] [PubMed]
- Odell, A.; Askham, J.; Whibley, C.; Hollstein, M. How to become immortal: Let MEFs count the ways. Aging 2010, 2, 160–165. [Google Scholar] [CrossRef] [PubMed]
- Tommasi, S.; Zheng, A.; Weninger, A.; Bates, S.E.; Li, X.A.; Wu, X.; Hollstein, M.; Besaratinia, A. Mammalian cells acquire epigenetic hallmarks of human cancer during immortalization. Nucleic Acids Res. 2013, 41, 182–195. [Google Scholar] [CrossRef] [PubMed]
Figure 1.
Schematic presentation of the λ Select cII assay. The assay is based on the retrieval of the λLIZ shuttle vectors, containing the cII transgene as a mutational reporter gene, from genomic DNA of Big Blue® mouse cells treated in vitro with test chemical/agent(s) relative to the control, packaging the vectors into λ phage heads capable of infecting an indicator E. coli and performing temperature-sensitive incubation of the bacterial culture to phenotypically express the mutated cII transgene [2,4,5,6,28]. Determination of the induced cII mutant frequency and establishment of the mutation spectrum by DNA sequencing are highlighted.

Figure 2.
Comparison of the cII mutant frequencies induced by various chemicals and/or physical agents in Big Blue® mouse embryonic fibroblasts. Data are from our published studies on acrylamide [15], glycidamide [17], aflatoxin B1 (AFB1) [25], tamoxifen [21] and δ-aminolevulinic acid (δ-ALA) plus low dose ultraviolet light A (UVA: λ > 320–400 nm) [18], benzo(a)pyrene diol epoxide (B(a)PDE) [22] and equilethal doses of UVA, UVB (λ = 280–320 nm) and simulated sunlight UV (SSL) [24]. To efficiently metabolize aflatoxin B1 in Big Blue® mouse cells, the S9-activation system (S9 mix) consisted of Aroclor 1254-induced rat liver preparations and cofactor reagents was used [25].
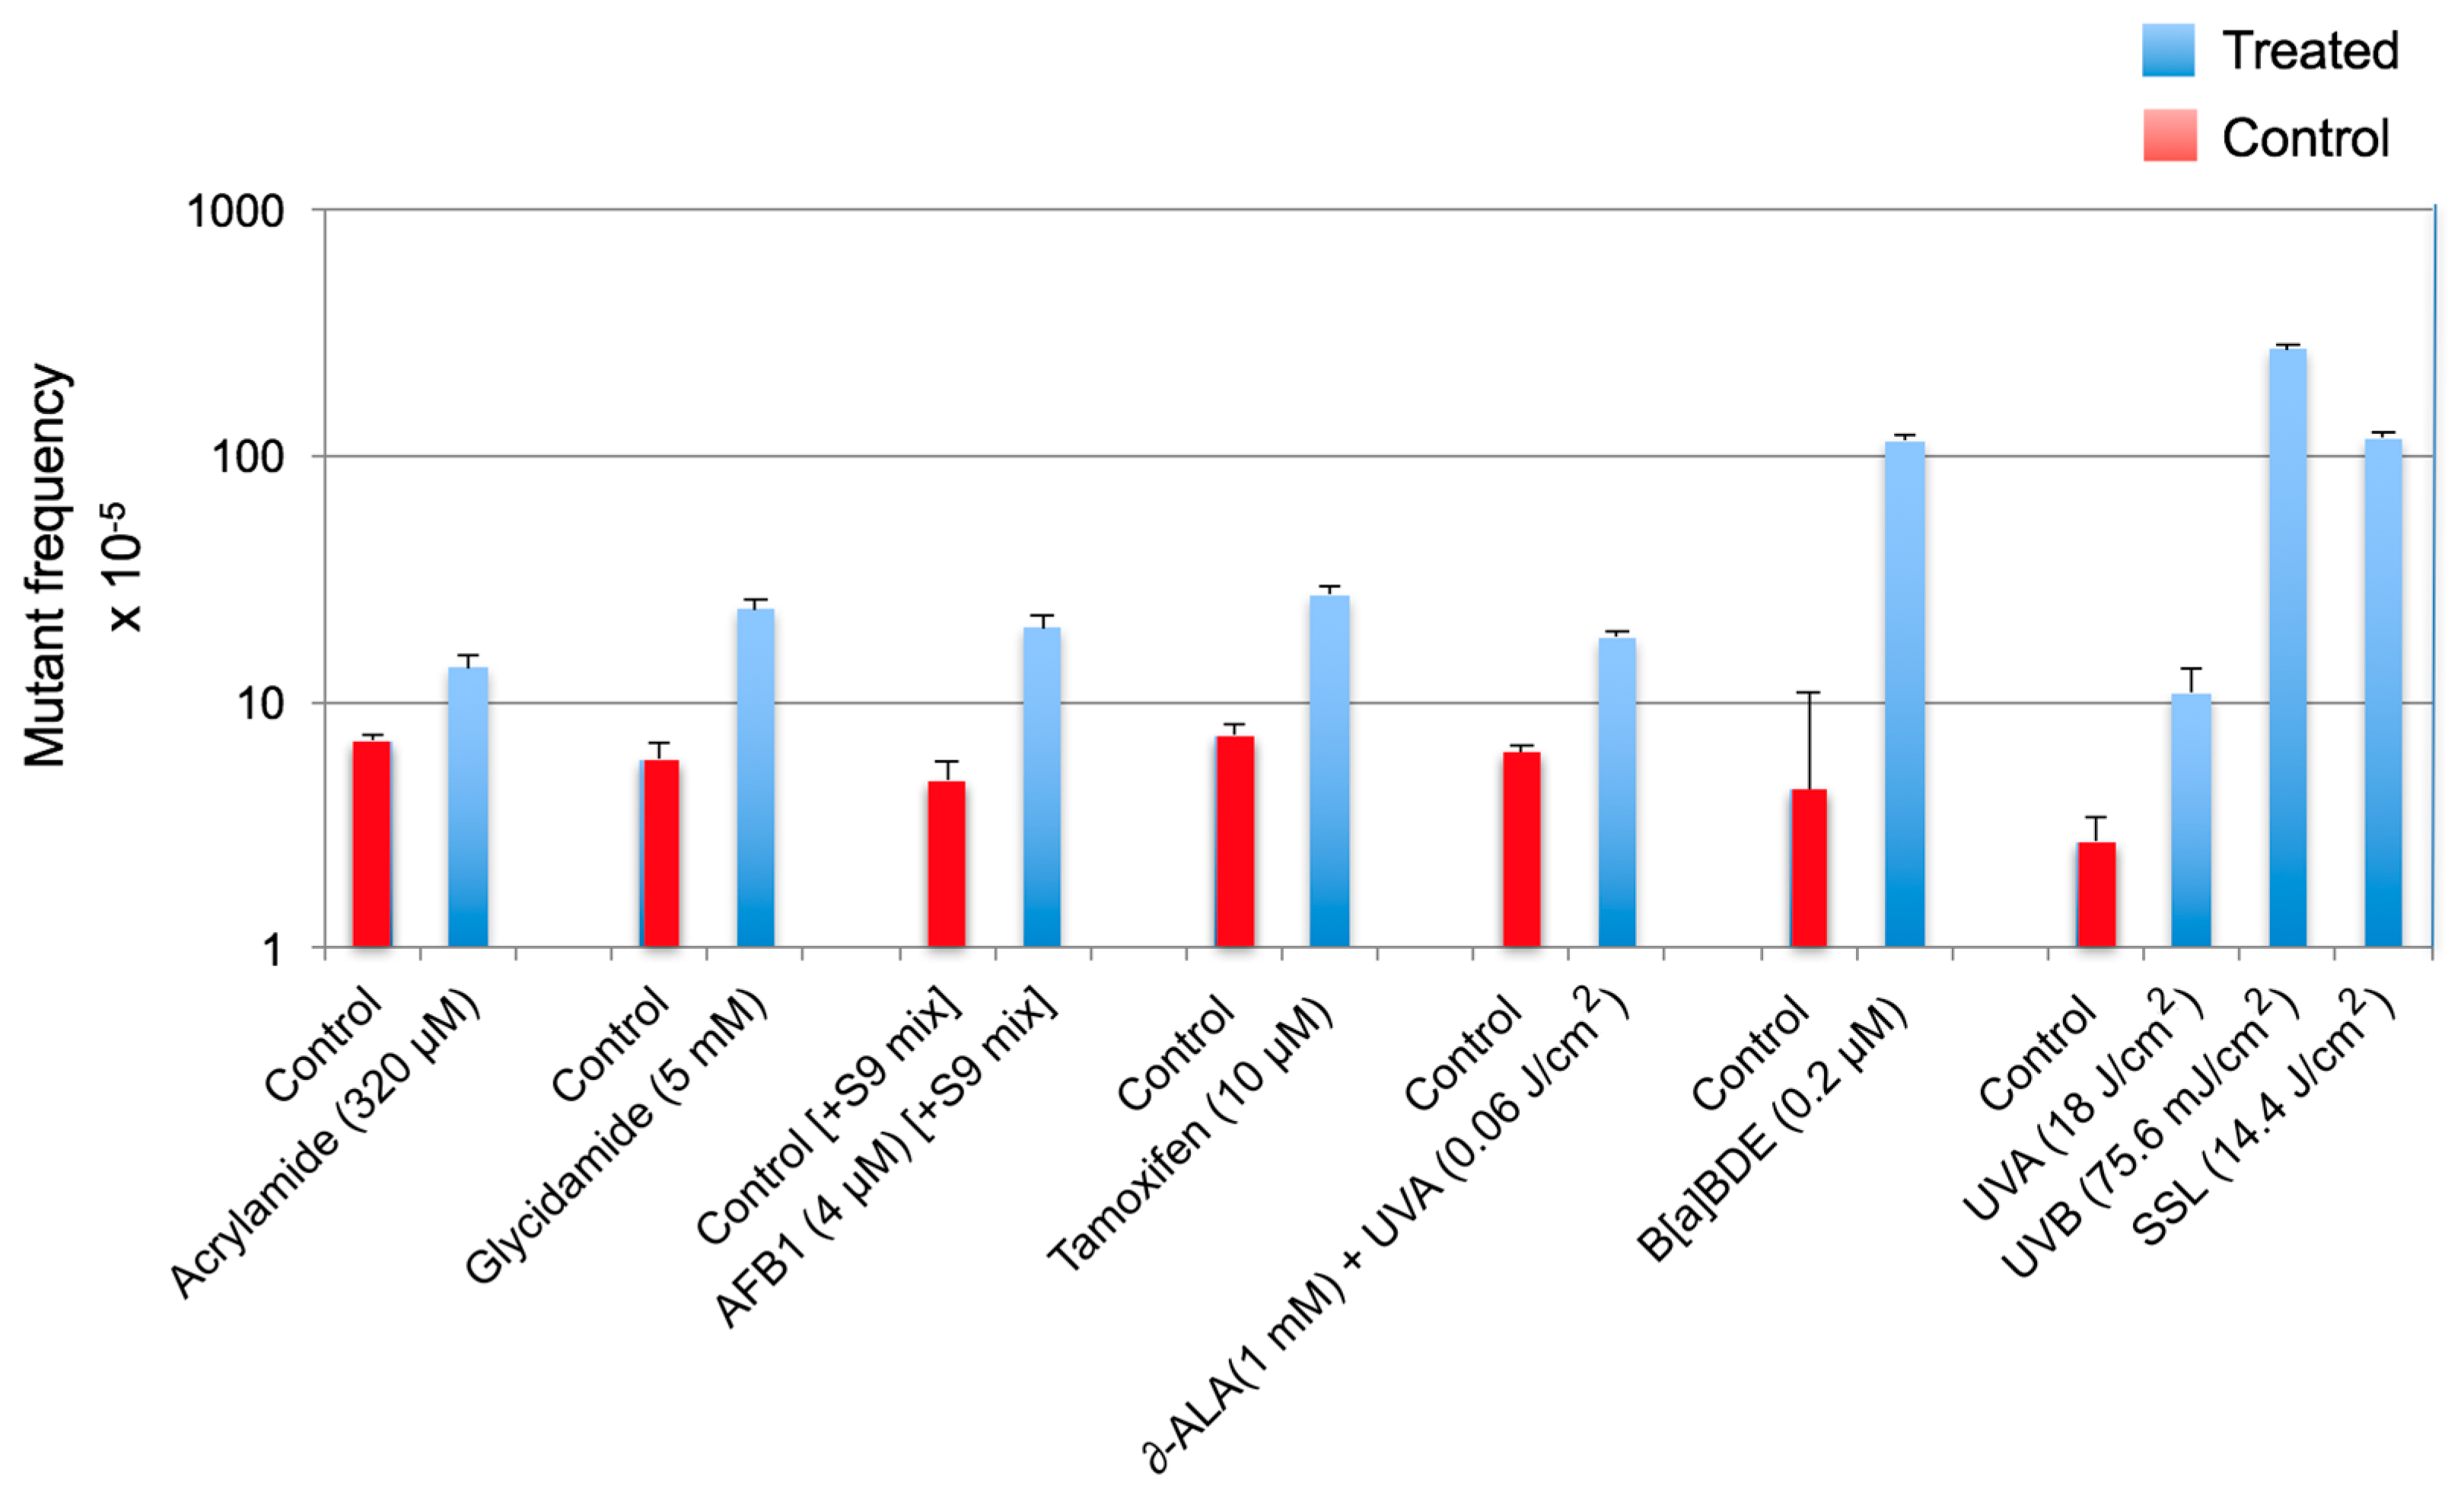
Figure 3.
Induced cII mutation spectrum in Big Blue® mouse embryonic fibroblasts irradiated with UVB relative to the control. Data are from our published study [26]. The strand mirror counterparts of all transitions (e.g., G → A and C → T) and transversions (e.g., G → T and C → A or G → C and C → G) are combined. Ins = insertion; Del = deletion. The UVB-induced mutation spectrum is characterized by significant increases in the relative frequency of single or tandem C → T transitions at pyrimidine dinucleotides.
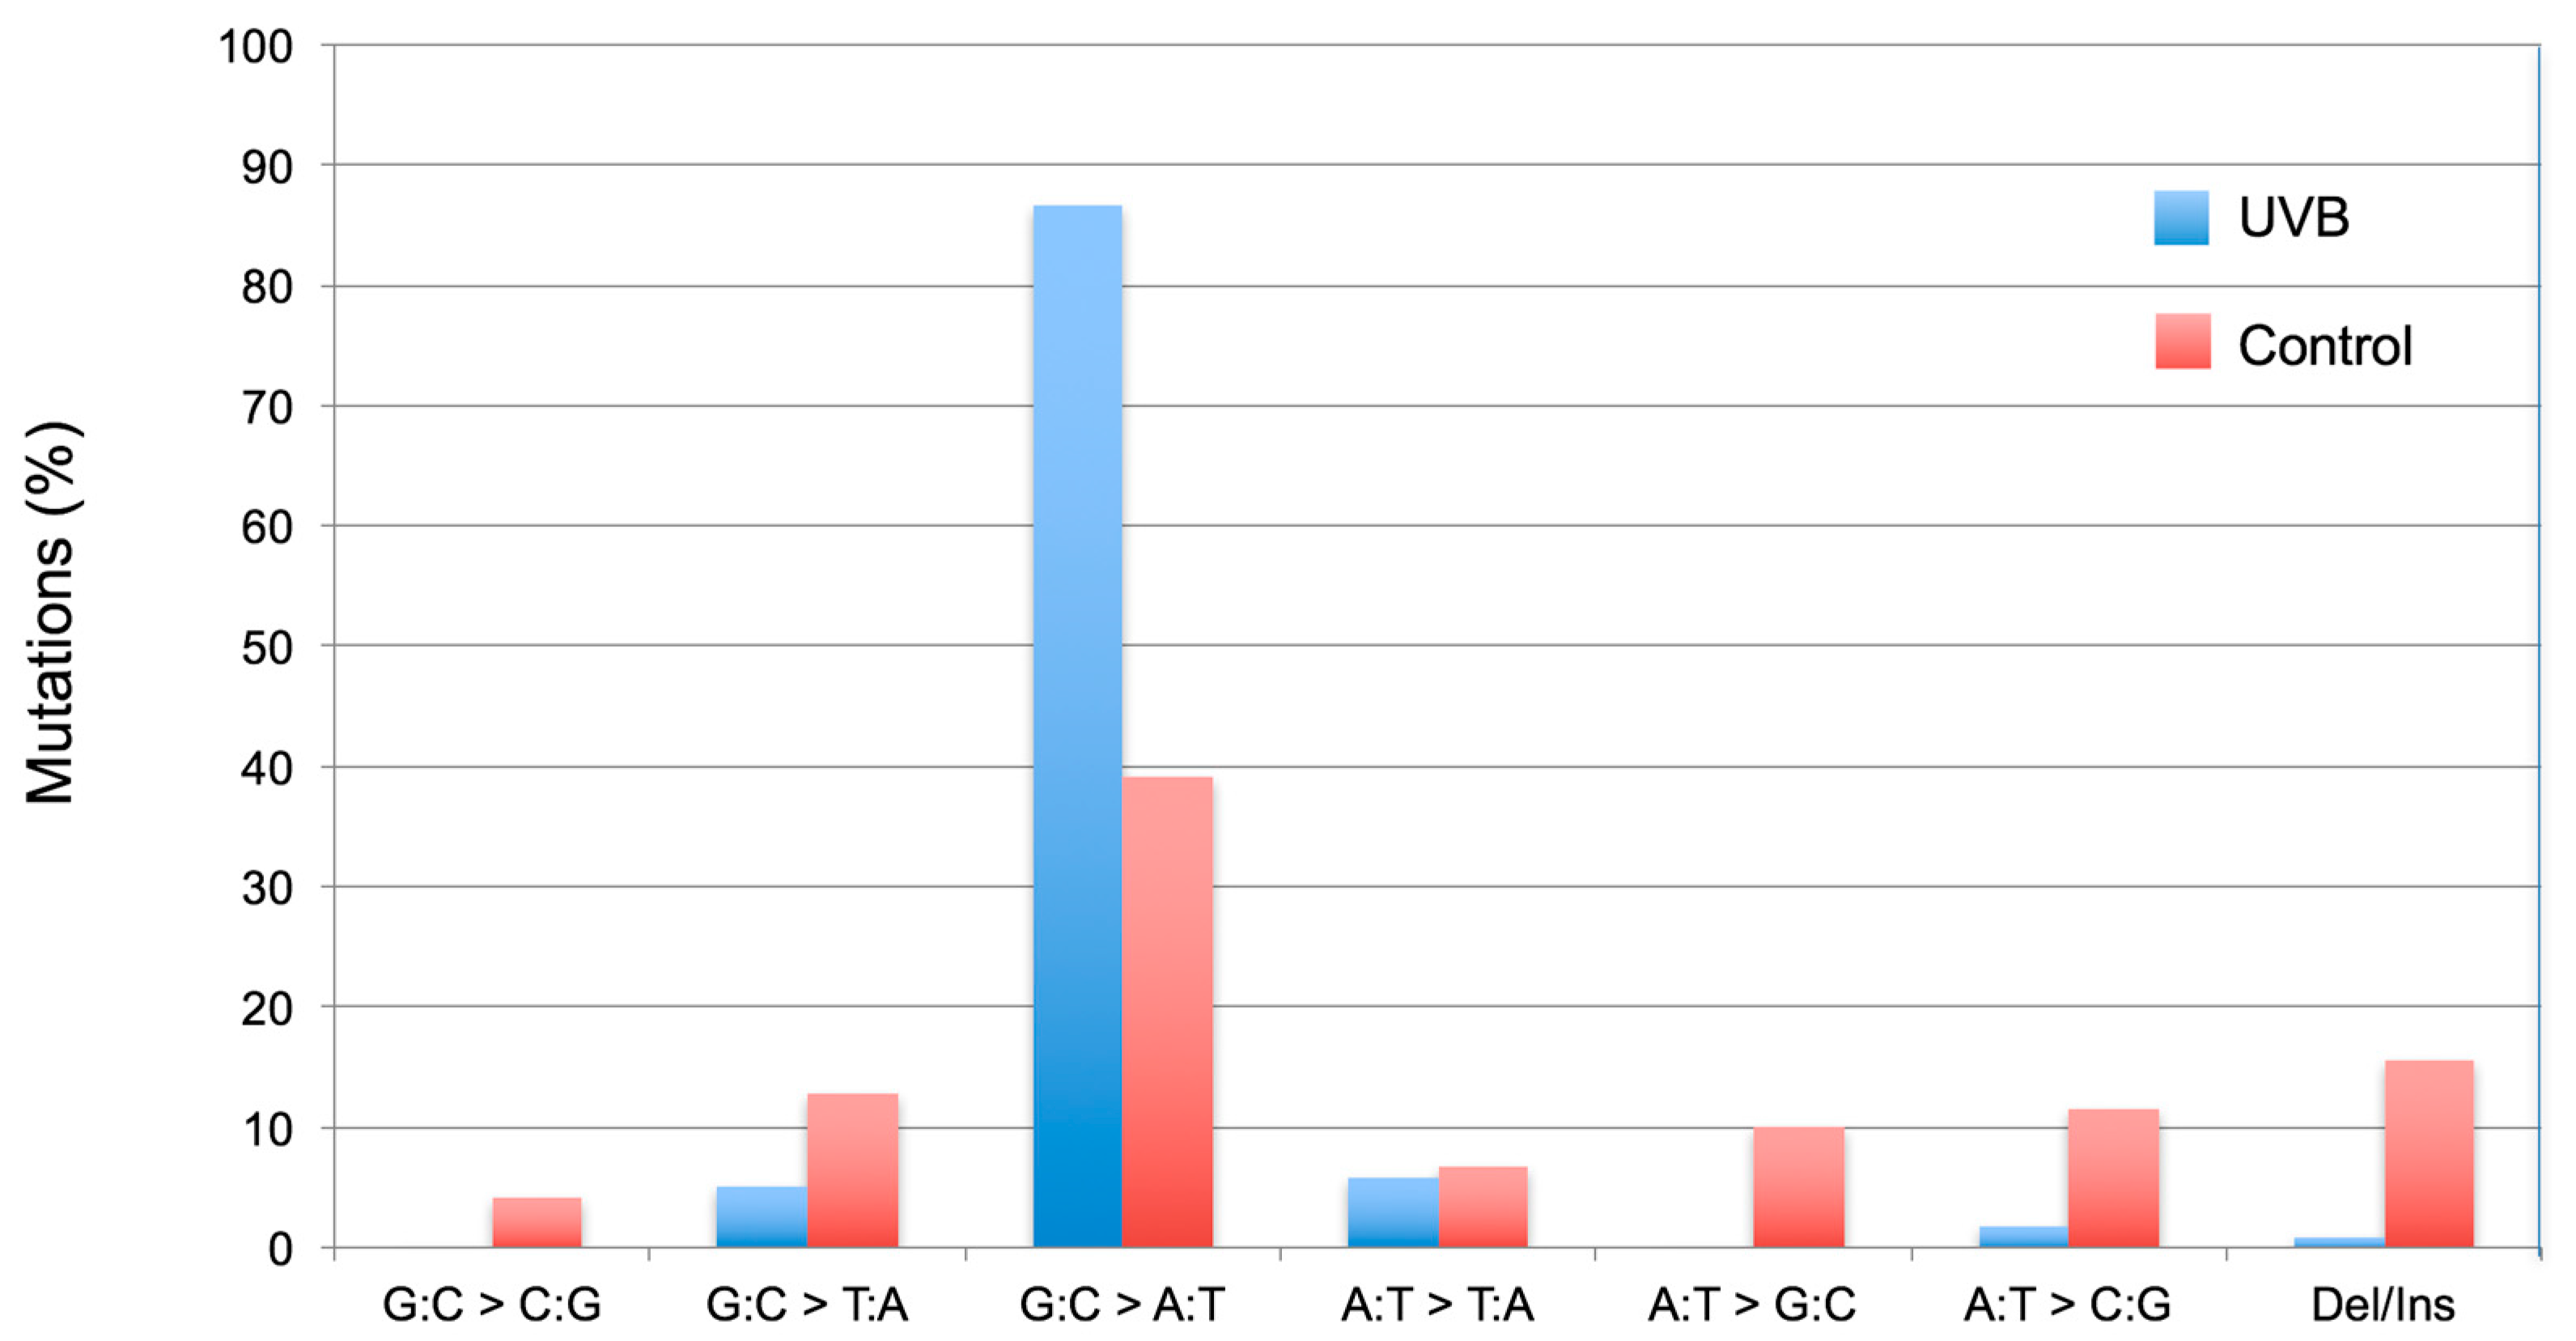
Figure 4.
Bar chart presentation of the induced and spontaneous cII mutation spectra in Big Blue® mouse embryonic fibroblasts irradiated with UVB and the control, respectively. Data are from our published study [26]. The location and percentage of mutations along the cII transgene in UVB-irradiated cells and control are indicated by bars above and below the reference sequence, respectively.

Figure 5.
Detailed map of the induced and spontaneous cII mutation spectra in Big Blue® mouse embryonic fibroblasts irradiated with UVB and the control, respectively. Data are from our published study [26]. The UVB-induced cII mutations are typed above the reference sequence, whereas the spontaneous mutations (control) are typed below the reference sequence. The height of a mutated base represents its frequency of mutations (i.e., the higher the base, the more frequently mutated). Numbers above a mutated base indicate its percentage frequency of mutations. Deleted bases are underlined. Inserted bases are shown with an arrow. Numbers below the bases are reference nucleotide positions.
© 2018 by the authors. Licensee MDPI, Basel, Switzerland. This article is an open access article distributed under the terms and conditions of the Creative Commons Attribution (CC BY) license (http://creativecommons.org/licenses/by/4.0/).
Share and Cite
MDPI and ACS Style
Besaratinia, A.; Zheng, A.; Bates, S.E.; Tommasi, S. Mutation Analysis in Cultured Cells of Transgenic Rodents. Int. J. Mol. Sci. 2018, 19, 262. https://doi.org/10.3390/ijms19010262
AMA Style
Besaratinia A, Zheng A, Bates SE, Tommasi S. Mutation Analysis in Cultured Cells of Transgenic Rodents. International Journal of Molecular Sciences. 2018; 19(1):262. https://doi.org/10.3390/ijms19010262
Chicago/Turabian StyleBesaratinia, Ahmad, Albert Zheng, Steven E. Bates, and Stella Tommasi. 2018. "Mutation Analysis in Cultured Cells of Transgenic Rodents" International Journal of Molecular Sciences 19, no. 1: 262. https://doi.org/10.3390/ijms19010262
Note that from the first issue of 2016, this journal uses article numbers instead of page numbers. See further details here.