Article

Functional Analyses of RUNX3 and CaMKIINα in Ovarian Cancer Cell Lines Reveal Tumor-Suppressive Functions for CaMKIINα and Dichotomous Roles for RUNX3 Transcript Variants

1
Department of Gynecology, Jena University Hospital—Friedrich Schiller University Jena, 07747 Jena, Germany
2
Department of Biochemistry II, Jena University Hospital—Friedrich Schiller University Jena, 07747 Jena, Germany
*
Authors to whom correspondence should be addressed.
Int. J. Mol. Sci. 2018, 19(1), 253; https://doi.org/10.3390/ijms19010253
Submission received: 12 December 2017 / Revised: 3 January 2018 / Accepted: 10 January 2018 / Published: 15 January 2018
(This article belongs to the Special Issue Ovarian Cancer: Pathogenesis, Diagnosis, and Treatment)

Abstract

:
(1) Background: Epithelial ovarian cancer (EOC) is the most lethal cancer of the female reproductive system. In an earlier study, we identified multiple genes as hypermethylated in tumors of patients with poor prognosis. The most promising combination of markers to predict a patient’s outcome was CaMKIINα and RUNX3. Aim of this study was to functionally validate the importance of both genes. (2) Methods: IC50 measurements, cell cycle distribution-, proliferation, and migration experiments were conducted after transgene overexpression in two EOC cell lines. (3) Results: We showed that CaMKIINα has tumor suppressive functions in vitro and reduces proliferation, migration, and colony formation. However, it had no effect on the reversion of the resistance to cisplatin. RUNX3 exhibited dualistic functions related to cisplatin sensitivity and migration capacity, depending on the respective transcript variant (TV). A2780 cells expressing RUNX3 TV2—the promoter of which harbors a CpG (5′-C-phosphate-G-3′) island and is potentially inactivated by hypermethylation—exhibited increased cisplatin sensitivity and reduced migration properties. However, RUNX3 TV1, not affected by CpG island methylation could be characterized as mediating resistance and enhancing migration in A2780. The higher resistance of RUNX3 TV1 transfected cells correlates with a reduction of cell proliferation. Moreover, RUNX3 TV1 expressing cells exhibit a reduced cell cycle arrest at the gap-2 or mitosis phase (G2/M) under cisplatin treatment comparable to resistant A2780 subcultures. (4) Conclusion: It appears that CaMKIINα and RUNX3 TV2 can reduce the malignant potential of EOC cells.

Graphical Abstract

1. Introduction

In developed countries, ovarian cancer is the third most common gynecological malignancy [1,2]. About 95% are of epithelial origin and can be classified into distinct subtypes. Within these subtypes, the high-grade serous EOC represent the biggest fraction and are at the same time also the most problematic one [3]. Because approximately 60–80% of the EOC patients are diagnosed in late stages such as T3, the 5-year-survival-rate (5yr-SR) is lower than 40% [2,4,5]. Besides the lack of specific early symptoms and missing screening opportunities which contribute to late diagnosis, the frequent relapse with a chemo-resistant disease is also responsible for the high mortality rate [6]. While just 3.6% of all cancer incidences worldwide are due to ovarian cancer, it accounts for 4.3% of all cancer death—the highest mortality rate of gynecological cancers in women [7]. Over the last decades the overall 5yr-SR of EOC diagnosed women has not changed much since the introduction of platinum-based chemotherapeutics [8,9,10]. Importantly new treatment options i.e., anti-angiogenesis and PARP-inhibitor treatments may improve the 5yr-SR in the future. The current standard therapy is initial surgery to reduce the tumor burden macroscopically followed by adjuvant therapy with carboplatin or cisplatin in combination with other antineoplastic drugs, e.g., taxane, doxorubicin. After an initial response, a high number of patients relapse with chemotherapeutic-resistant disease within a median of 18 months [6]. Reliable biomarkers are needed to improve and adjust the patients’ therapy.
The hypothesis that aberrant DNA methylation might be useful to establish new biomarkers for EOC has been proposed from several research groups [11,12]. In a previous study we identified and validated five potential marker genes by scanning 48 primary EOC tumors. It could be demonstrated that the hypermethylation of RUNX3 and CaMKIINα is a prognostic marker for EOC [13]. The marker combination CaMKIINα and RUNX3 demonstrated a sensitivity of 40%, and a specificity of 100% to identify patients with progression-free survival of <3 years. Furthermore, when performing Kaplan–Meier analysis it could be shown that the unmethylated cohort had a significantly prolonged progression-free survival in contrast to the methylated one, independent from the clinical parameters such as the resection status [13]. CaMKIINα is one of two endogenous inhibitors of the Calmodulin-dependent protein kinase-II [14,15]. Widely, its expression in other tumor entities is described to have positive effects on the patients’ outcome, indicating a tumor suppressor function [16,17,18]. RUNX3 on the other hand, is a transcription factor prone to have a dualistic association in carcinogenesis [19]. Analyses of RUNX3 isoforms described different functions during immune cell development and gastric cancer susceptibility [20,21]. The mechanism and functional involvement of CaMKIINα and RUNX3 isoforms in ovarian carcinogenesis is not fully understood until now. Here we aimed to determine the functional contribution of both genes to cellular properties i.e., cell proliferation, migration and cisplatin response. Results revealed that CaMKIINα has tumor suppressive functions and reduces proliferation, migration and colony formation but does not restore the cisplatin sensitivity of resistant cells. RUNX3 transcript variants exhibited dichotomous functions in regard to cisplatin sensitivity and migration of A2780 cells.

2. Results

Aim of the present study was the functional characterization of CaMKIINα and RUNX3 in ovarian cancer cell lines—specifically in isogenic pairs of platinum-sensitive and -resistant A2780 and SKOV3. Both genes were identified as hypermethylated in EOC patients with poor prognosis implicating a potential contribution to aggressive tumor biology or chemotherapeutic resistance. Moreover, CaMKIINα hypermethylation was identified during resistance development in SKOV3 cells resulting in an inhibition of gene expression under cisplatin treatment [13]. Additionally, neither parental nor resistant A2780 cells do express CaMKIINα. Therefore, we hypothesized a potential contribution of CaMKIINα to cisplatin sensitivity. To investigate the role of CaMKIINα, the gene was overexpressed in the resistant cell cultures, allowing for a reversion of cisplatin resistance. In contrast to CaMKIINα, RUNX3 methylation and expression levels were not altered during in vitro cisplatin resistance development in A2780 and SKOV3. Moreover, A2780 are negative for RUNX3, and SKOV3 express low levels of this gene [22], resembling EOC with RUNX3 loss. Thus, we aimed to analyze consequences of RUNX3 overexpression in parental A2780 and SKOV3 cells to investigate the ability of RUNX3 to influence EOC cell behavior. Importantly, we used both transcript variants namely TV1 expressed from promoter-1 and not affected by methylation and TV2 regulated by CpG island associated promoter-2.

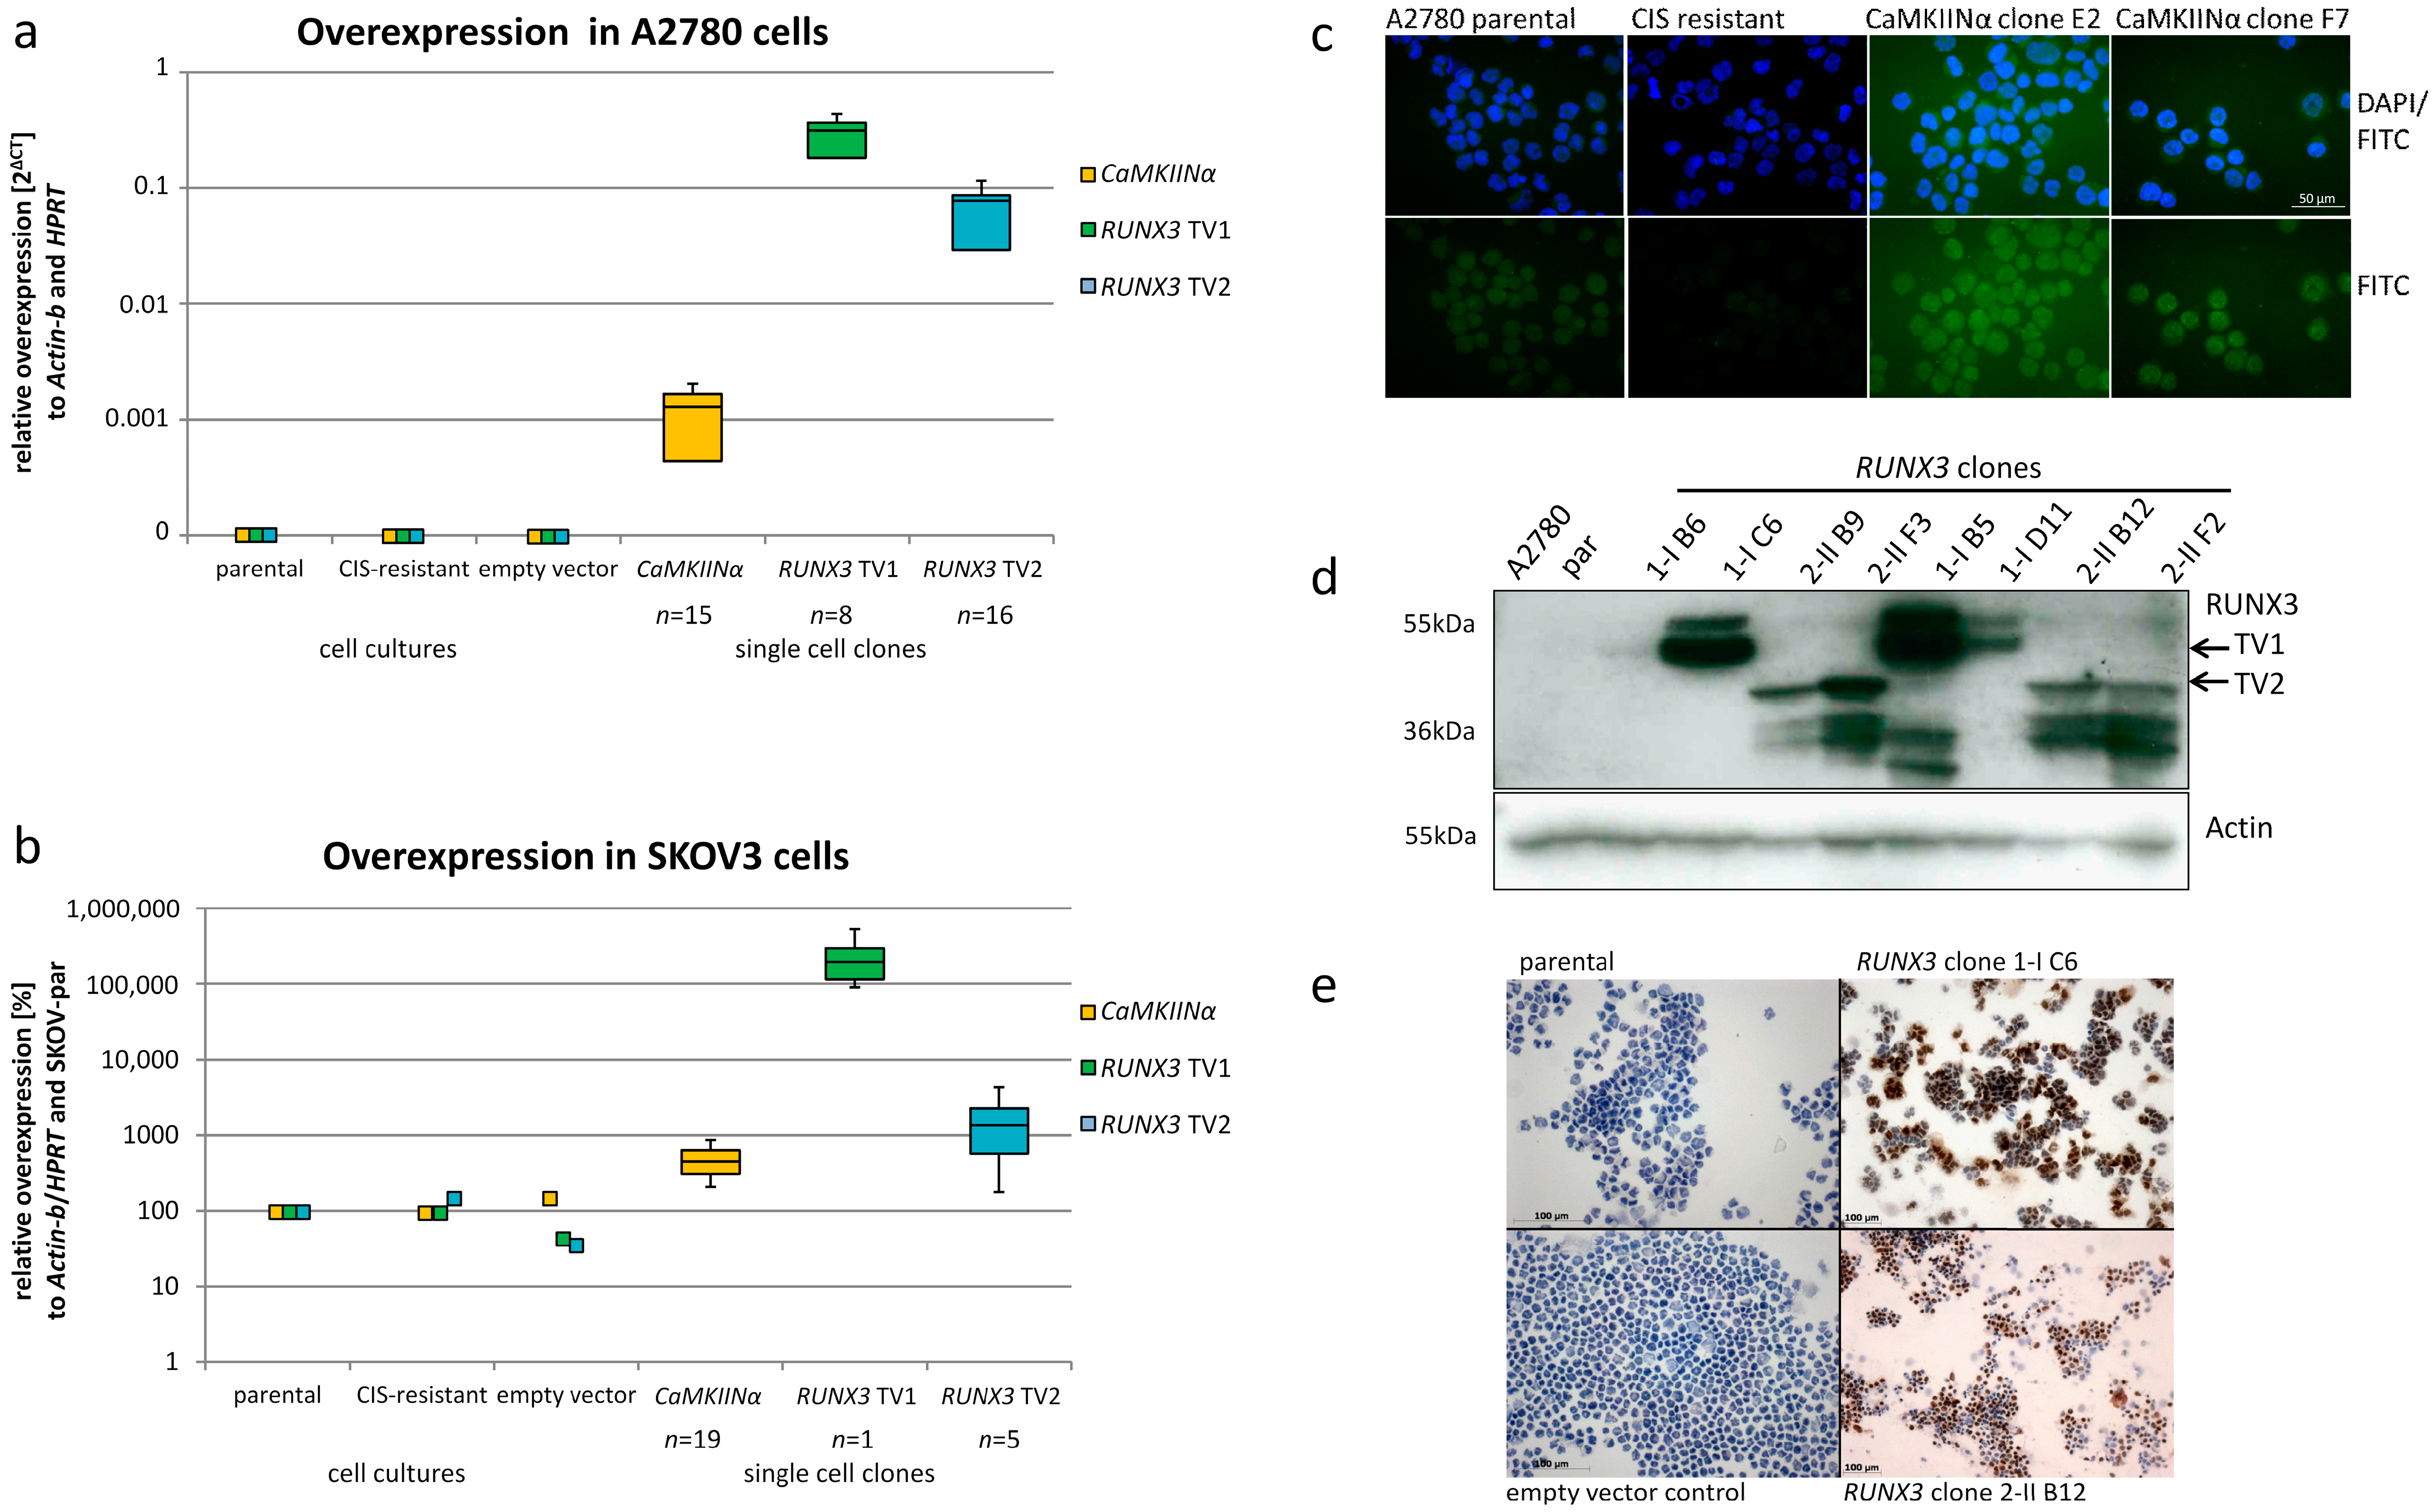
2.1. Ectopic Expression of CaMKIINα and RUNX3 in EOC Cells

Single cell clones transfected with the pBK-CaMKIINα vector were screened for overexpression via quantitative RT-PCR with gene specific primers. A total of 19 SKOV3 and 15 A2780 single cell clones significantly overexpressing CaMKIINα were established (Figure 1a,b). Protein expression was analyzed by immunofluorescence staining showing reduced CaMKIINα levels in resistant cells and the re-expression in transfected clones (Figure 1c).
For RUNX3, altogether 6 SKOV3 and 24 A2780 single cell clones were distinguished. Variations in overexpression and cell heterogeneity between the different clones were already visible by immunocytochemical staining. Of note is that the αRUNX3 antibody recognizes an epitope located in the C-terminus and cannot differentiate between the isoforms. A distinction between transcript variants 1 and 2 was possible by Western Blotting and by quantitative reverse transcriptase-polymerase chain reaction (qRT-PCR) (Figure 1a,b,d). In contrast, TV1 overexpression resulted in the specific double band (RUNX3 isoform p46 and p46 with potential posttranslational modification [23]), TV2 translates into the shorter isoform p44 (upper band) and several smaller proteins (Figure 1d). Since the full-length transcript could be detected by RT-PCR, these may represent RUNX3 degradation products, or may arise from internal translation initiation processes. In SKOV3 cells, pBK-RUNX3 transfection led to a 2- to 5000-fold overexpression compared to the untransfected parental SKOV3 cells. A pronounced overexpression was also accomplished in A2780 cells. The calculated fold changes of RUNX3 overexpression in the two cells lines also correlated with the amount of positively stained cells using immunocytochemical scoring (Figure 1e). For functional assays we used single cell clones with different expression level thereby ensuring unbiased results (Supplementary Figure S1).

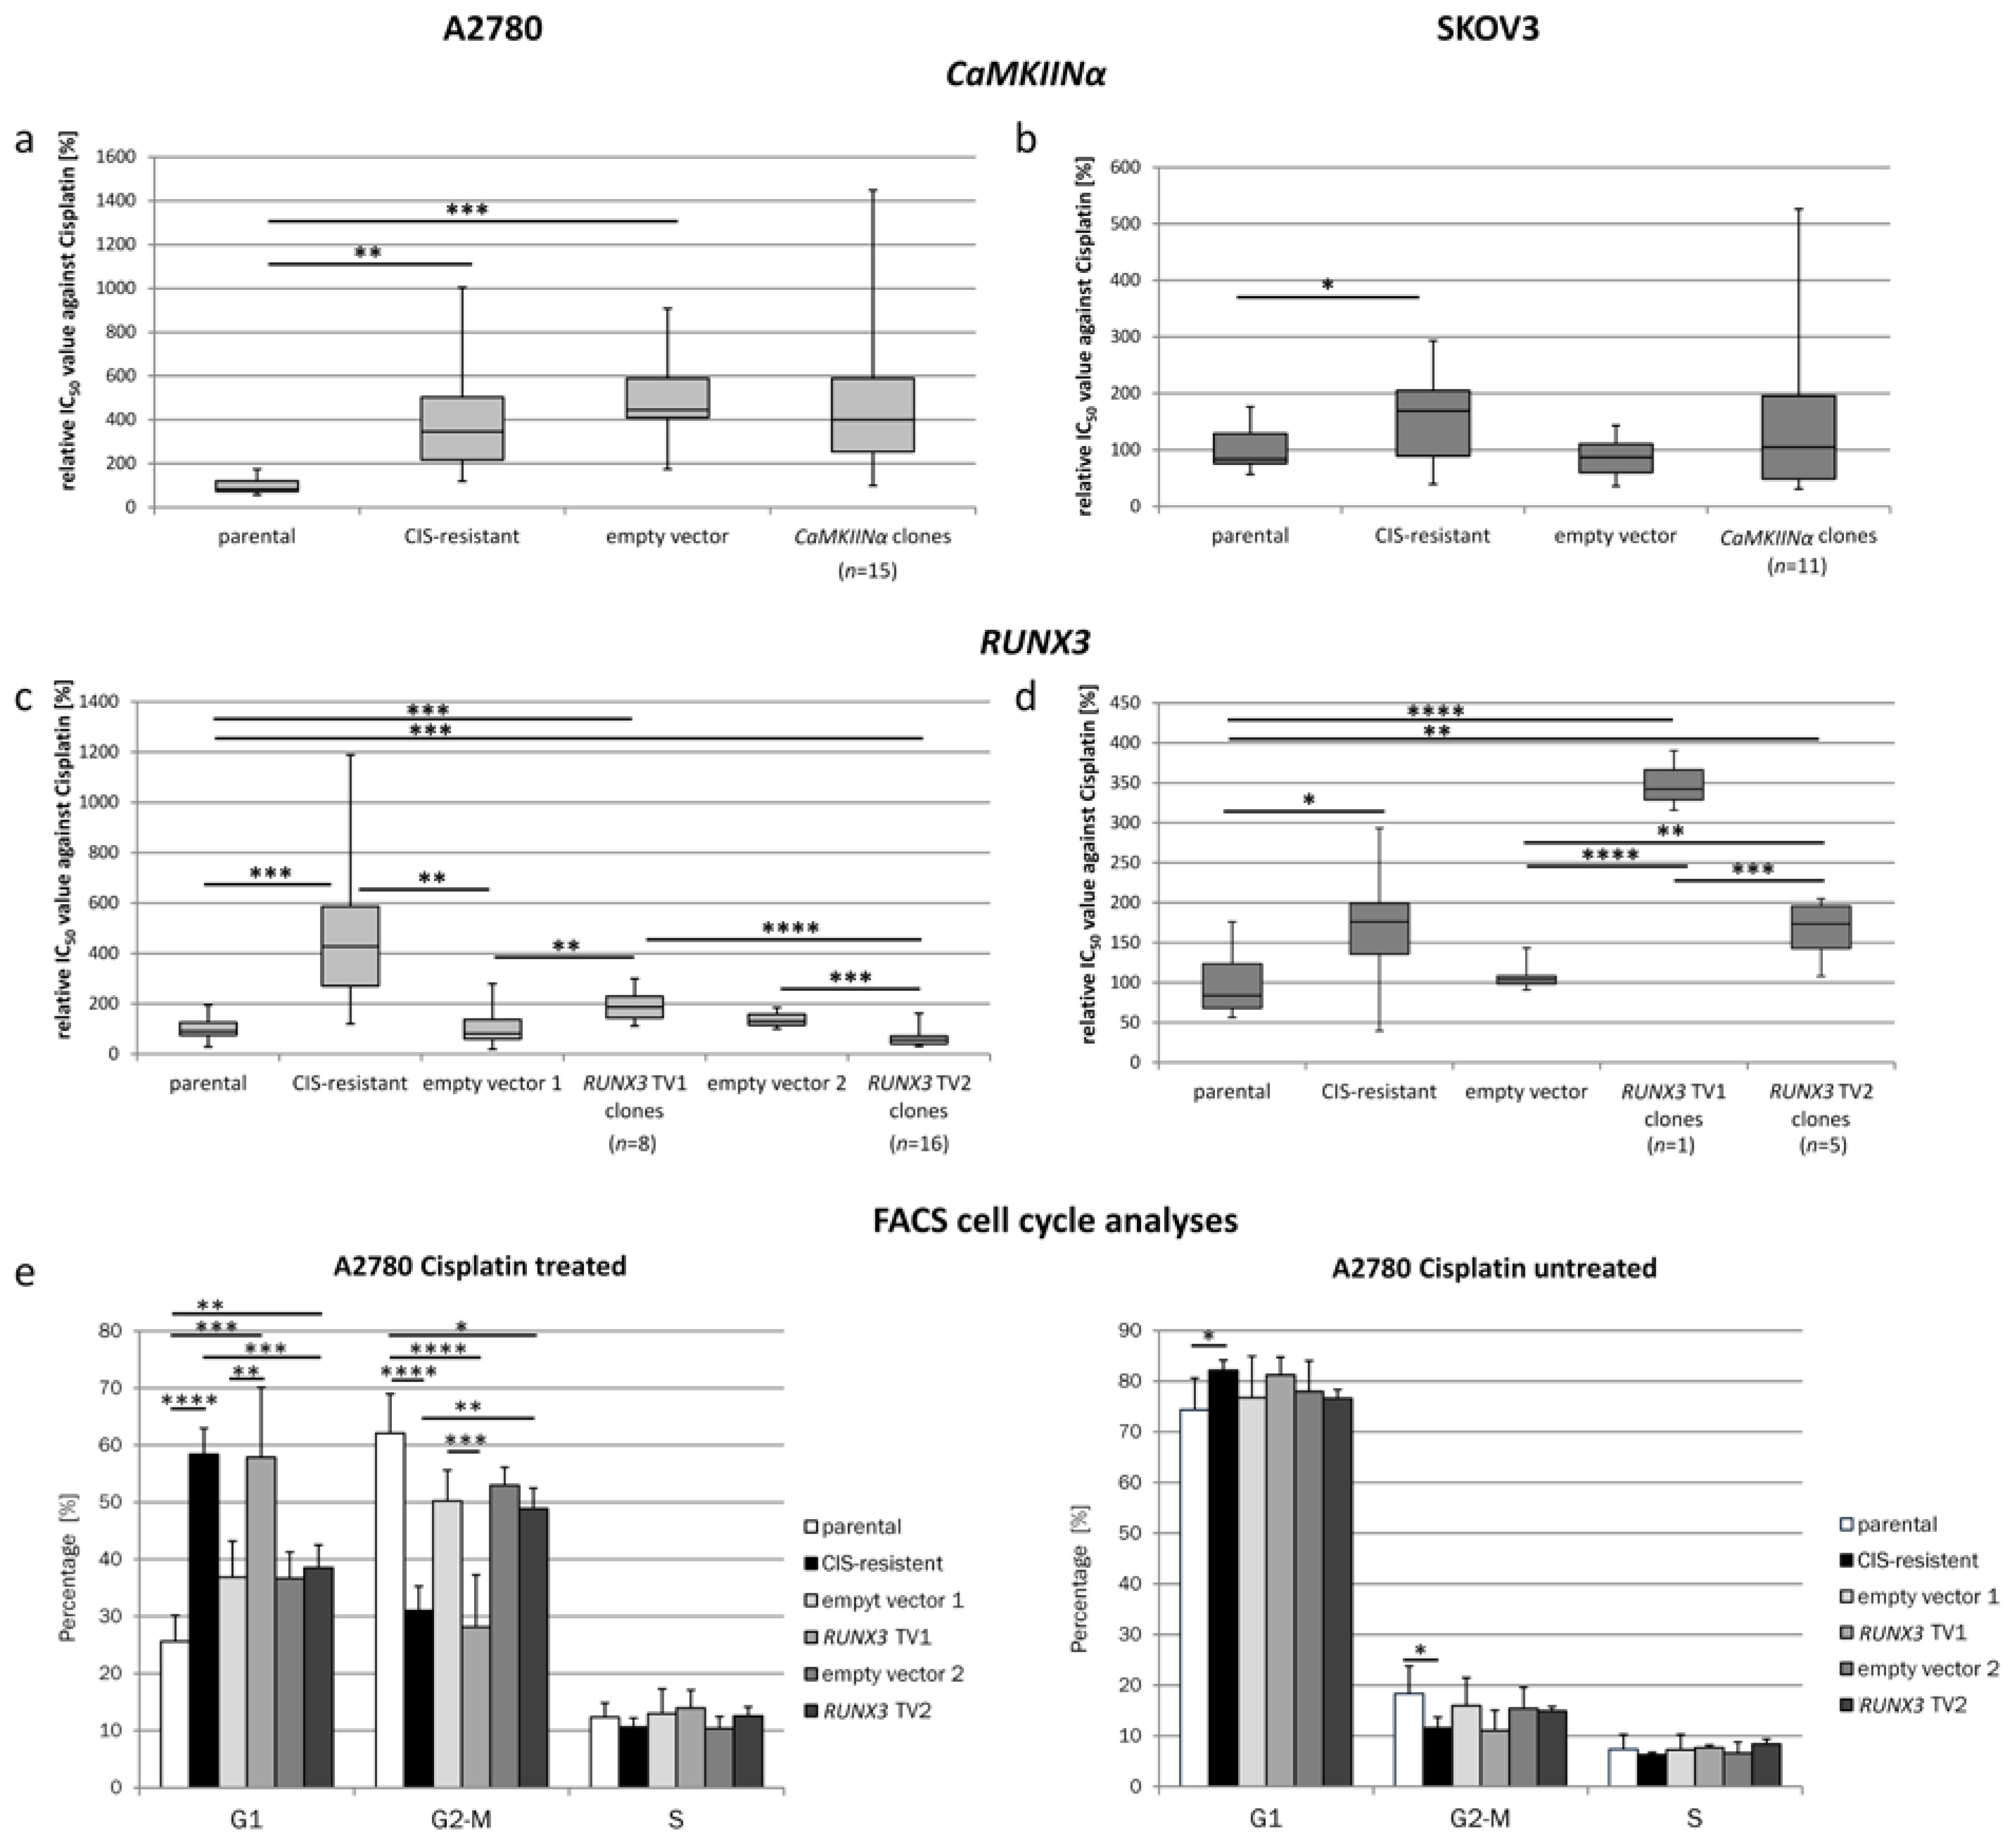
2.2. Cisplatin Sensitivity in CaMKIINα Overexpressing Resistant Cells

When testing CaMKIINα-expressing resistant cells the mean IC50 value of single cell clones was not different from resistant cells or empty vector control clones (Figure 2a,b). Only a few individual single cell clones showed a significant difference to the control cells. The high variability of IC50 values for the single cell clones may point to a variable cisplatin sensitivity of single cells from resistant A2780 and SKOV3 cultures. This assumption is supported by the large variation of IC50 values for the resistant cultures itself. Furthermore, no difference in the CaMKIINα overexpression level was identified in groups of clones with IC50 values lower or higher than the IC50 of resistant cells excluding an effect of CaMKIINα (Supplementary Figure S2). All in all, the tested A2780 CaMKIINα expressing single cell clones exhibited an average IC50 value of 21 µM, similar to the one of the initially transfected resistant A2780 cells. Comparably SKOV3 single cell clones expressing CaMKIINα showed an average IC50 equal to the one of SKOV3-CIS cells—45 µM.

2.3. Cisplatin Sensitivity under the Influence of RUNX3

Transfecting RUNX3 transcript variant 1 and 2 into the two respective ovarian cancer cells lines resulted in variable changes of cisplatin sensitivity. The strongest difference in the response towards cisplatin was measured in RUNX3 transfected A2780 cells (Figure 2c). While RUNX3 TV1 expressing A2780 clones had significantly higher cisplatin resistance levels, the expression of TV2 led to a significant reduction of the resistance compared to the empty vector control cells and parental A2780 cells. Comparing the IC50 value of the reference cells with the mean of the relative IC50 values of all tested clones expressing RUNX3 TV1, a significant increase of the resistance was detected (187.1%, SD ± 52.8%, p < 0.01). Contrary, A2780 single cell clones expressing transcript variant 2 exhibited a significant decreased mean relative IC50 value of 61.9% (SD ± 31%; p < 0.001) compared to the reference cells (Figure 2c). To obtain first insights into underlying mechanisms, the cell cycle distribution of A2780 cells was analyzed by FACS experiments (Figure 2e). RUNX3 TV1 expressing cells (clones #1-IC7, #1-ID11) did show a significantly reduced G2/M arrest under cisplatin treatment (28.1%) in comparison to parental (62.08%, p < 0.0001) or RUNX3 TV2 expressing cells (48.89%, clones #2-IC11, #2-IIB9, #2-IIF10, #2-IIF12; p < 0.0001), but similar to resistant A2780 cells (31.02%; p > 0.05). In SKOV3 cells we did not detect contrary effects of the transcript variants and both increased the resistance compared to parental and empty vector controls (Figure 2d). Albeit RUNX3 TV2 could not increase the sensitivity of SKOV3 cells, a different behavior of both transcript variants was identified. The cisplatin sensitivity of RUNX3 TV2 expressing clones was significantly higher than that of the RUNX3 TV1 clone (p < 0.001).

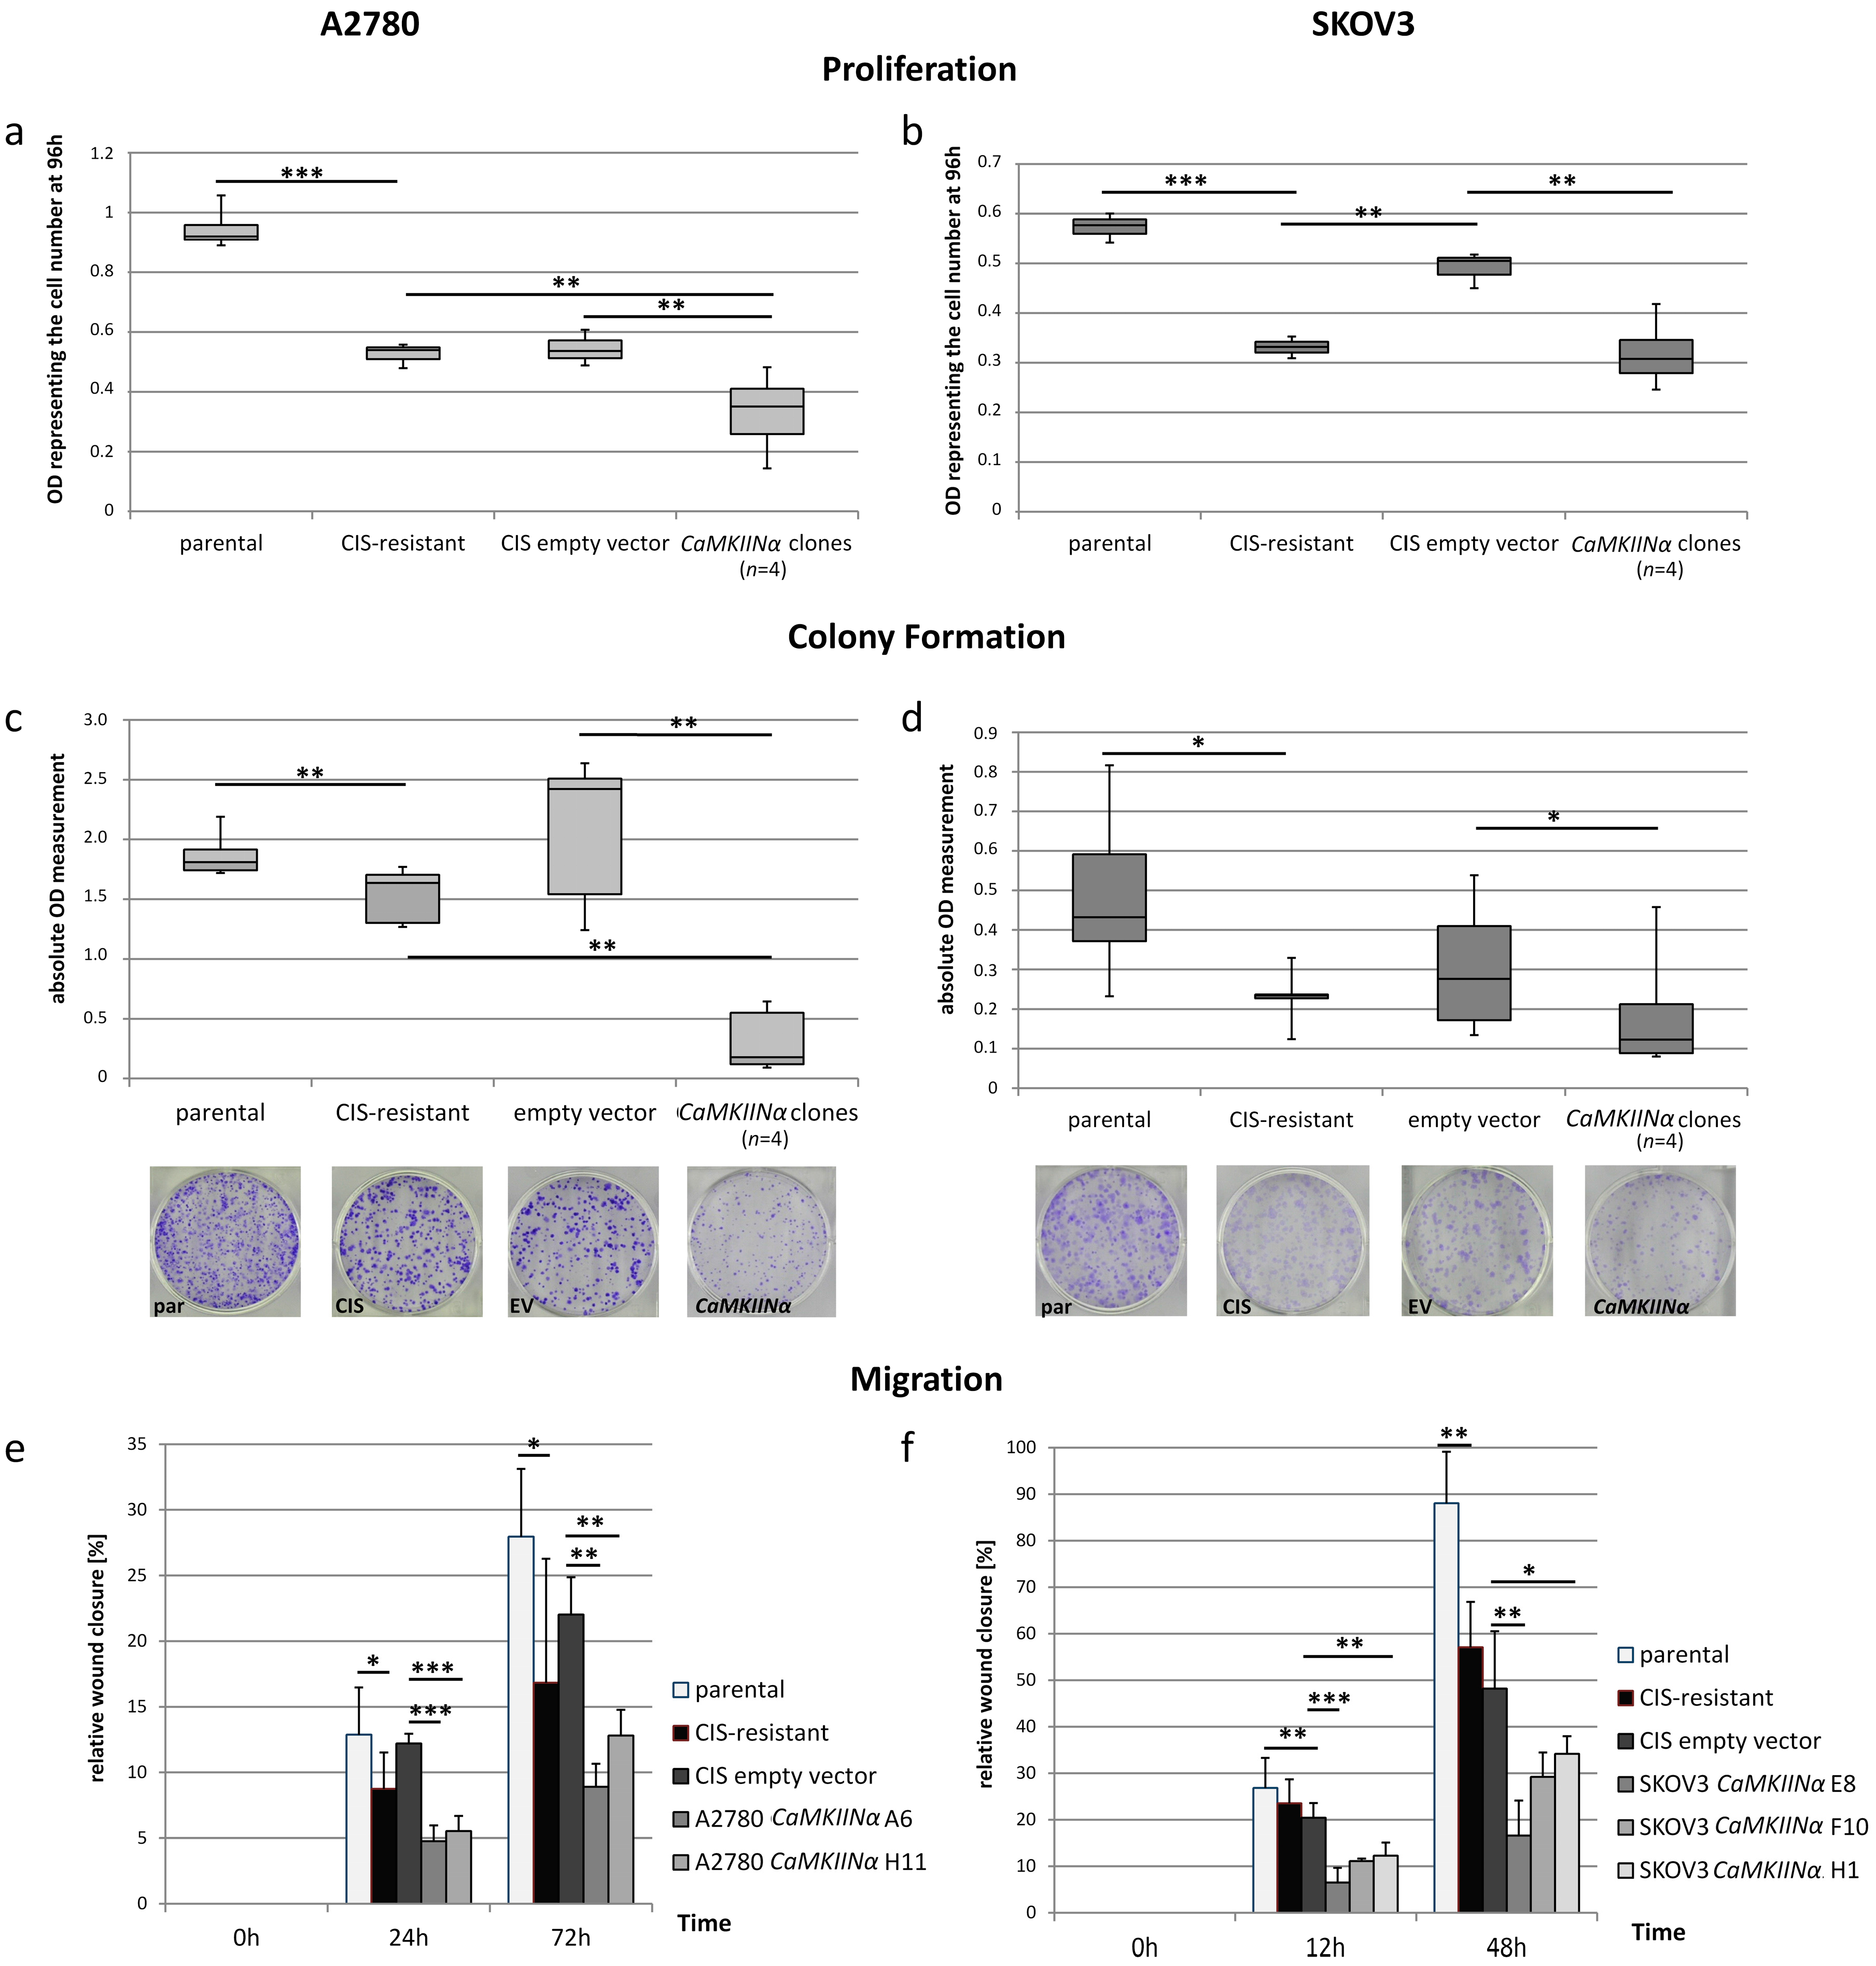
2.4. Reduction of Cellular Functions through CaMKIINα Overexpression

In both cell lines the overexpression of CaMKIINα resulted in a decrease of the cellular functions measured by proliferation, migration, and colony-formation ability assays (Figure 3 and Supplementary Figures S3–S5). A strong and significant decline in proliferation was seen in the four tested CaMKIINα expressing A2780-CIS single cell clones compared to both A2780-CIS and empty vector clones. SKOV3-CIS clones with CaMKIINα showed a significant lower proliferation only if compared to the empty vector. Thus, CaMKIINα may affect SKOV3 proliferation, though not to the same extent as A2780 cells. However, SKOV3-CIS cells transfected with the empty vector exhibited an increased proliferation capacity compared to the resistant cells likely caused by the enrichment of proliferating cells during single cell cloning. In all other functional tests resistant cells and empty vector controls did not show significantly different results. The tested A2780 CaMKIINα single cell clones presented a very strong decline of the colony formation ability both compared to empty vector cells and A2780-CIS (Figure 3c, p < 0.01). In SKOV3 cells the overexpression of CaMKIINα also led to a minimized ability to form colonies (Figure 3d). Analyzing migration in a wound healing assay, the CaMKIINα expressing cells of both cell lines had a significant diminishment of the migratory ability after 24 h compared to single cell clones expressing the empty vector or the resistant cultures (p < 0.05). This difference further enlarged over time (Figure 3e,f).

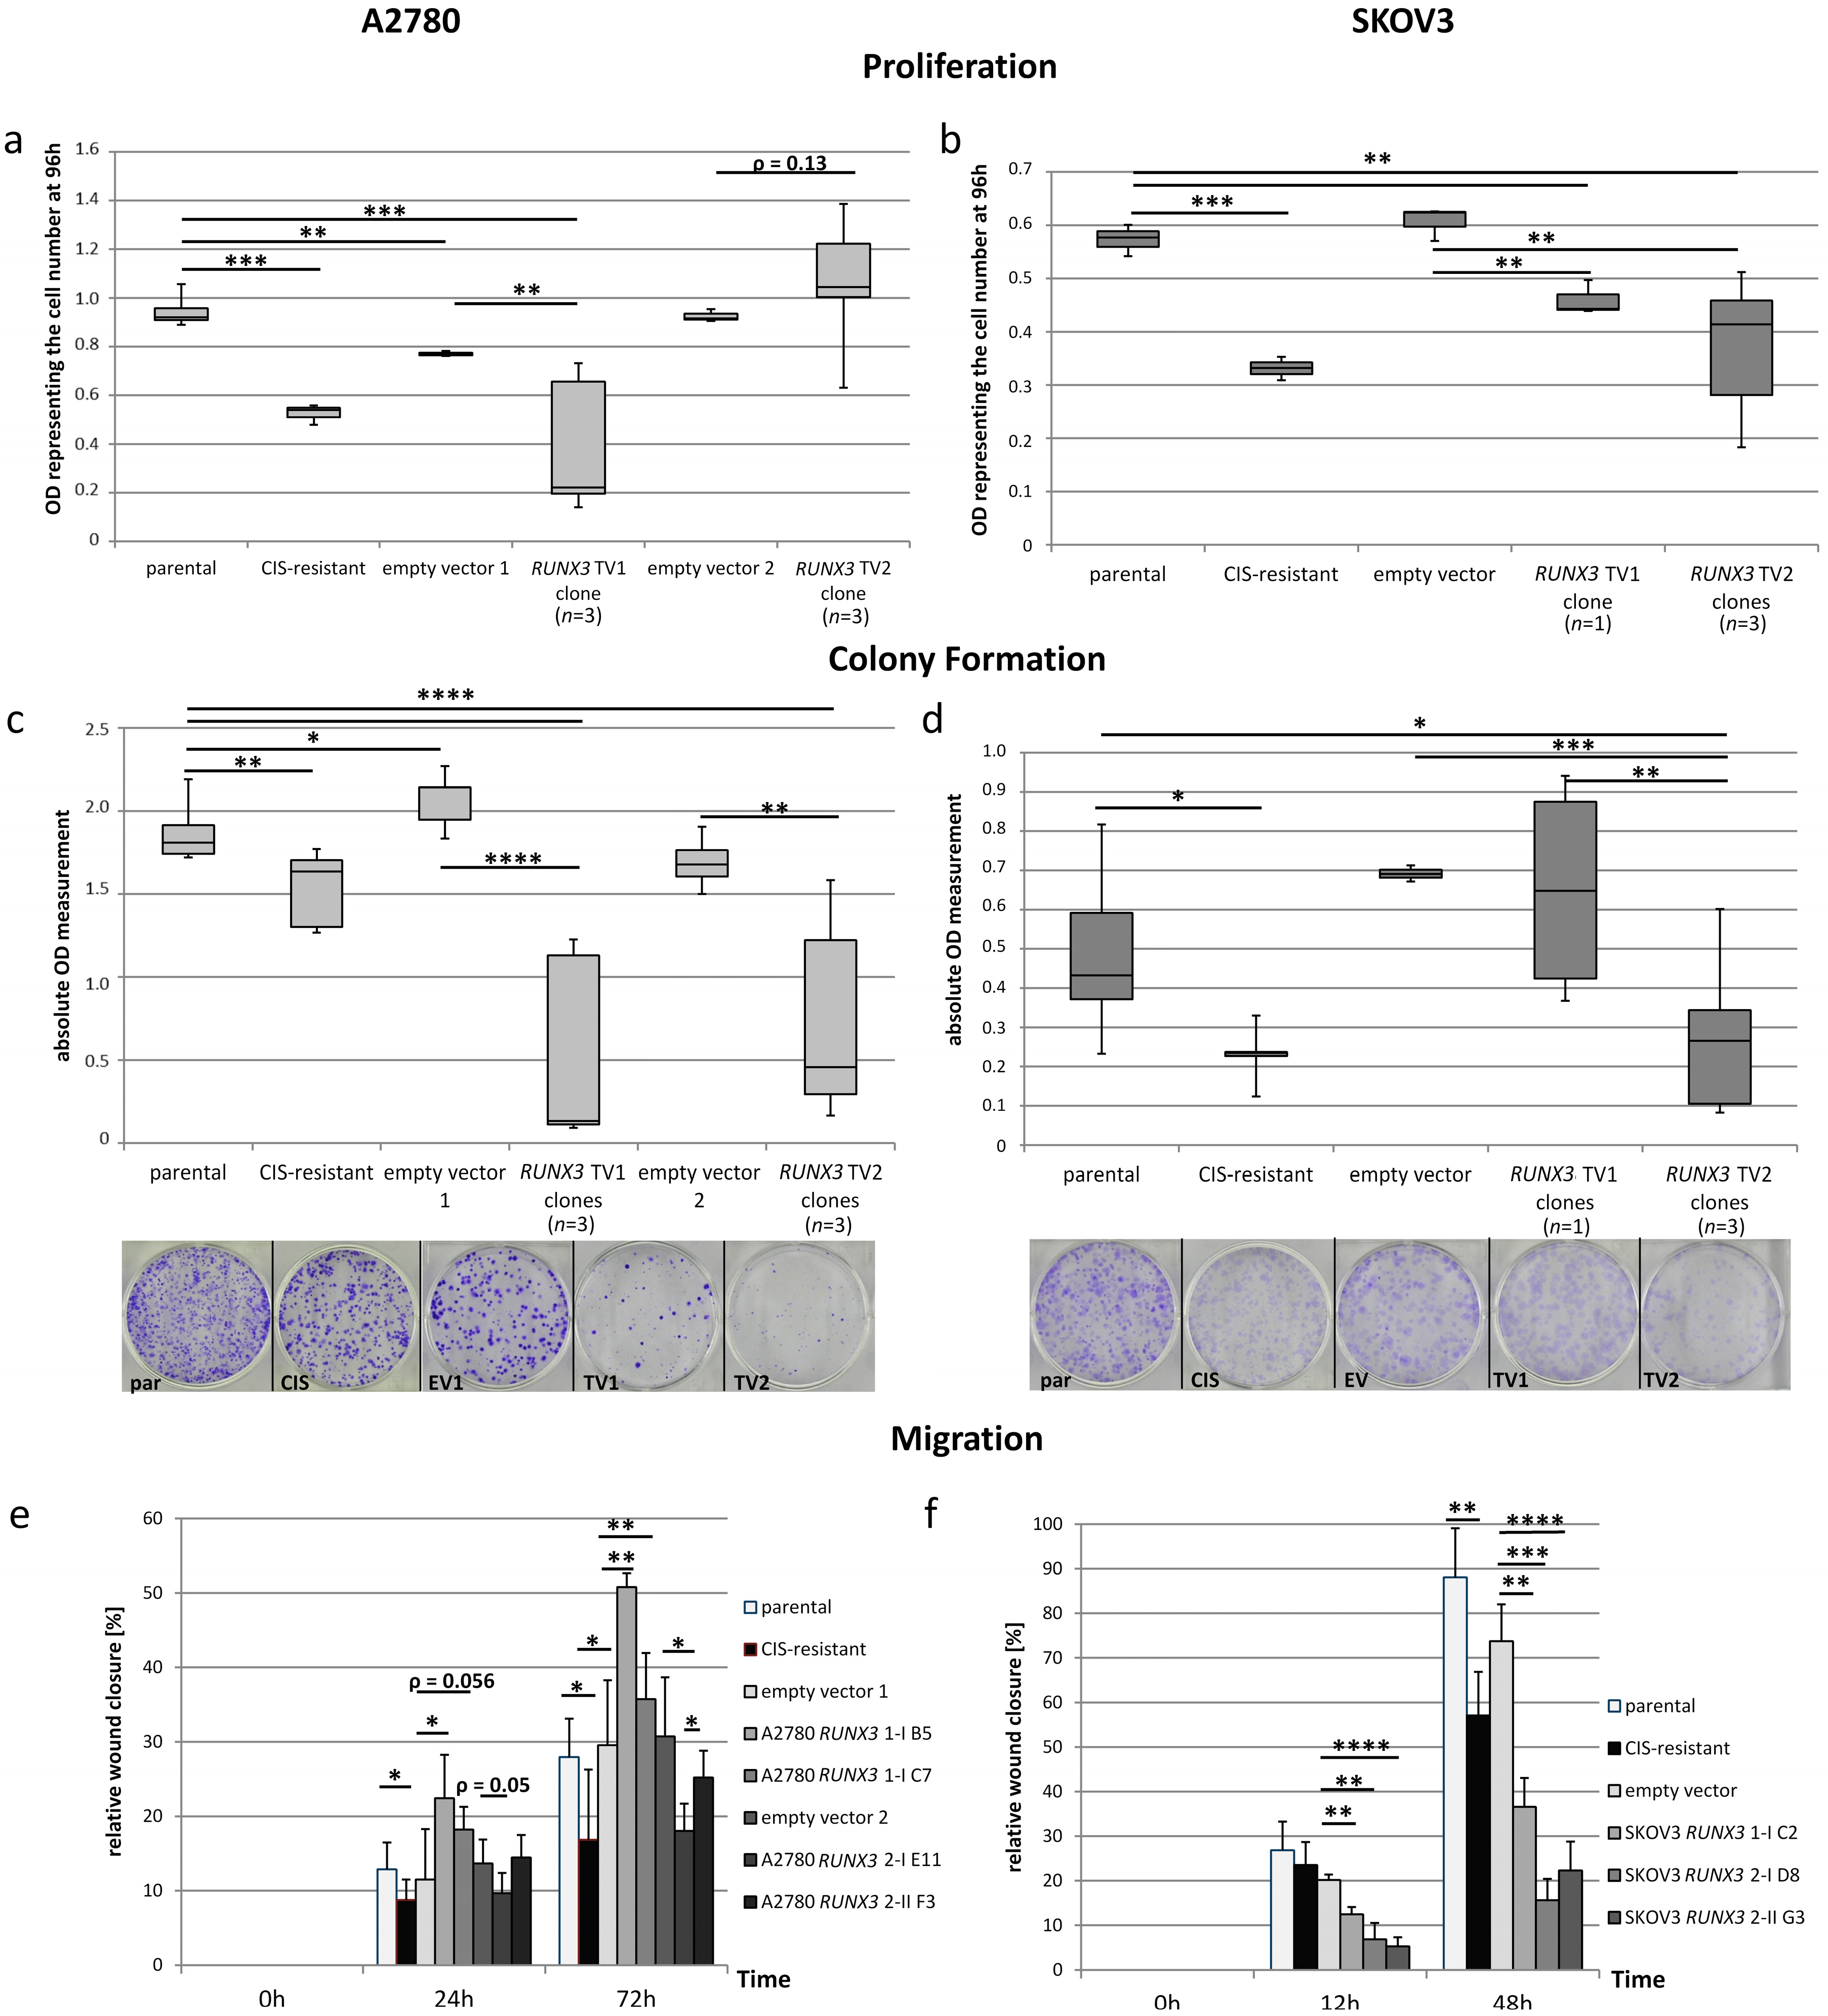
2.5. Dualistic Effect of the RUNX3 Transcript Variants on Cellular Functions

RUNX3 variants exhibited different properties depending on the cell line and functional read out. Whereas TV1 inhibited proliferation in both cell lines, SKOV3 cell proliferation was additionally inhibited by TV2 (Figure 4a,b). Contrary, A2780 cell proliferation was slightly but not significantly increased by transcript variant 2 proving potential differences in RUNX3 isoform functions. The colony forming capacity was affected differently by the transcript variants in SKOV3 but not A2780 cells (Figure 4c,d). Both variants inhibited A2780 colony formation significantly whereas only TV2 reduced SKOV3 colony number. The migratory movement differed between the variants (Figure 4e,f and Supplementary Figure S3). In A2780 cells as well as SKOV3 cells overexpression of RUNX3 TV2 resulted in a significantly reduced migration compared to the empty vector control cells (p < 0.05). RUNX3 TV1 on the other hand, led to a significant increase of the migratory behavior of A2780 compared to the reference indicating a promoting effect of transcript variant 1. In the case of SKOV3 cells, TV1 inhibited migration but to a smaller extent than TV2.

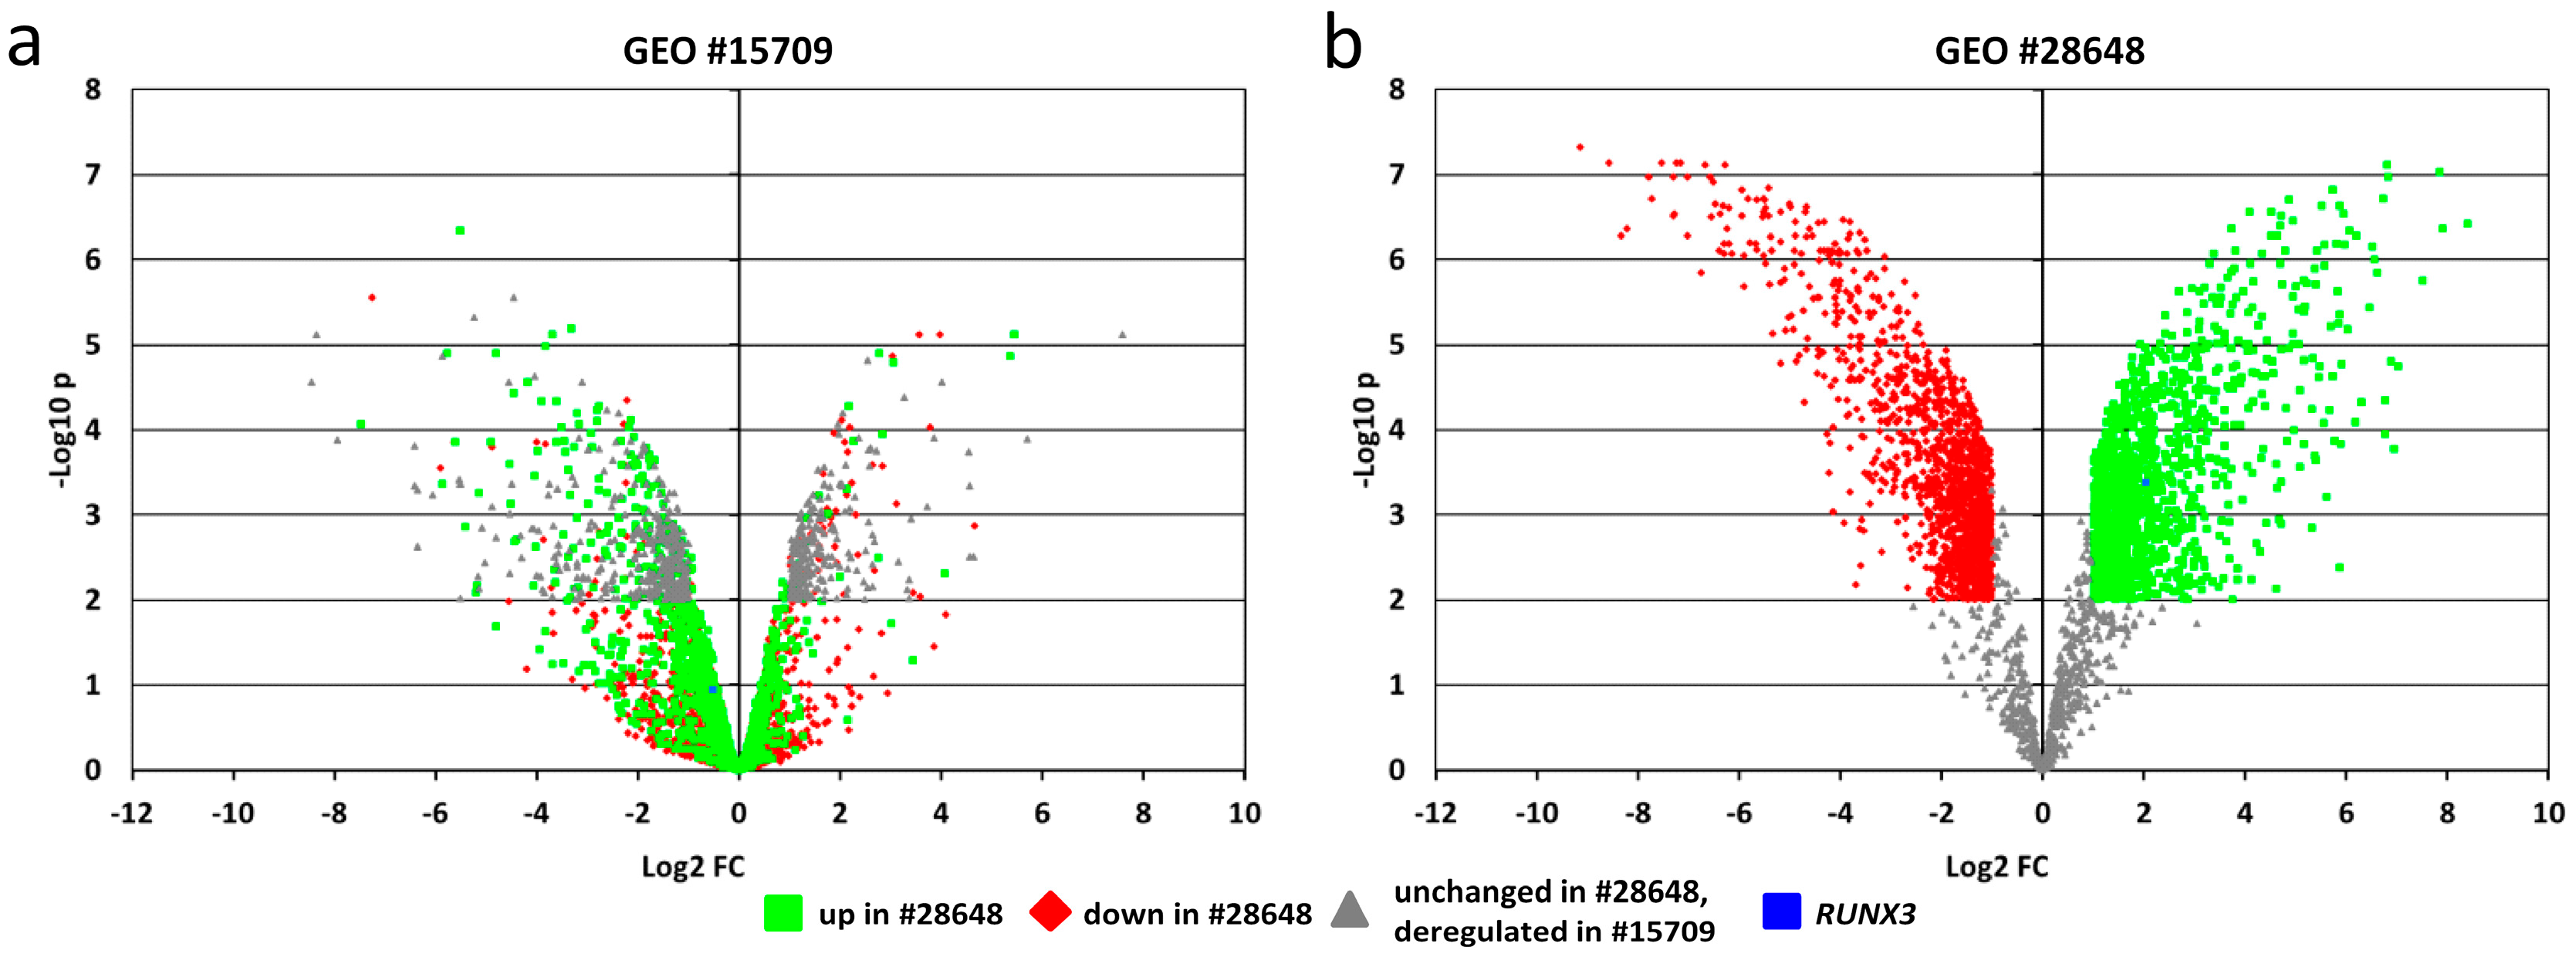
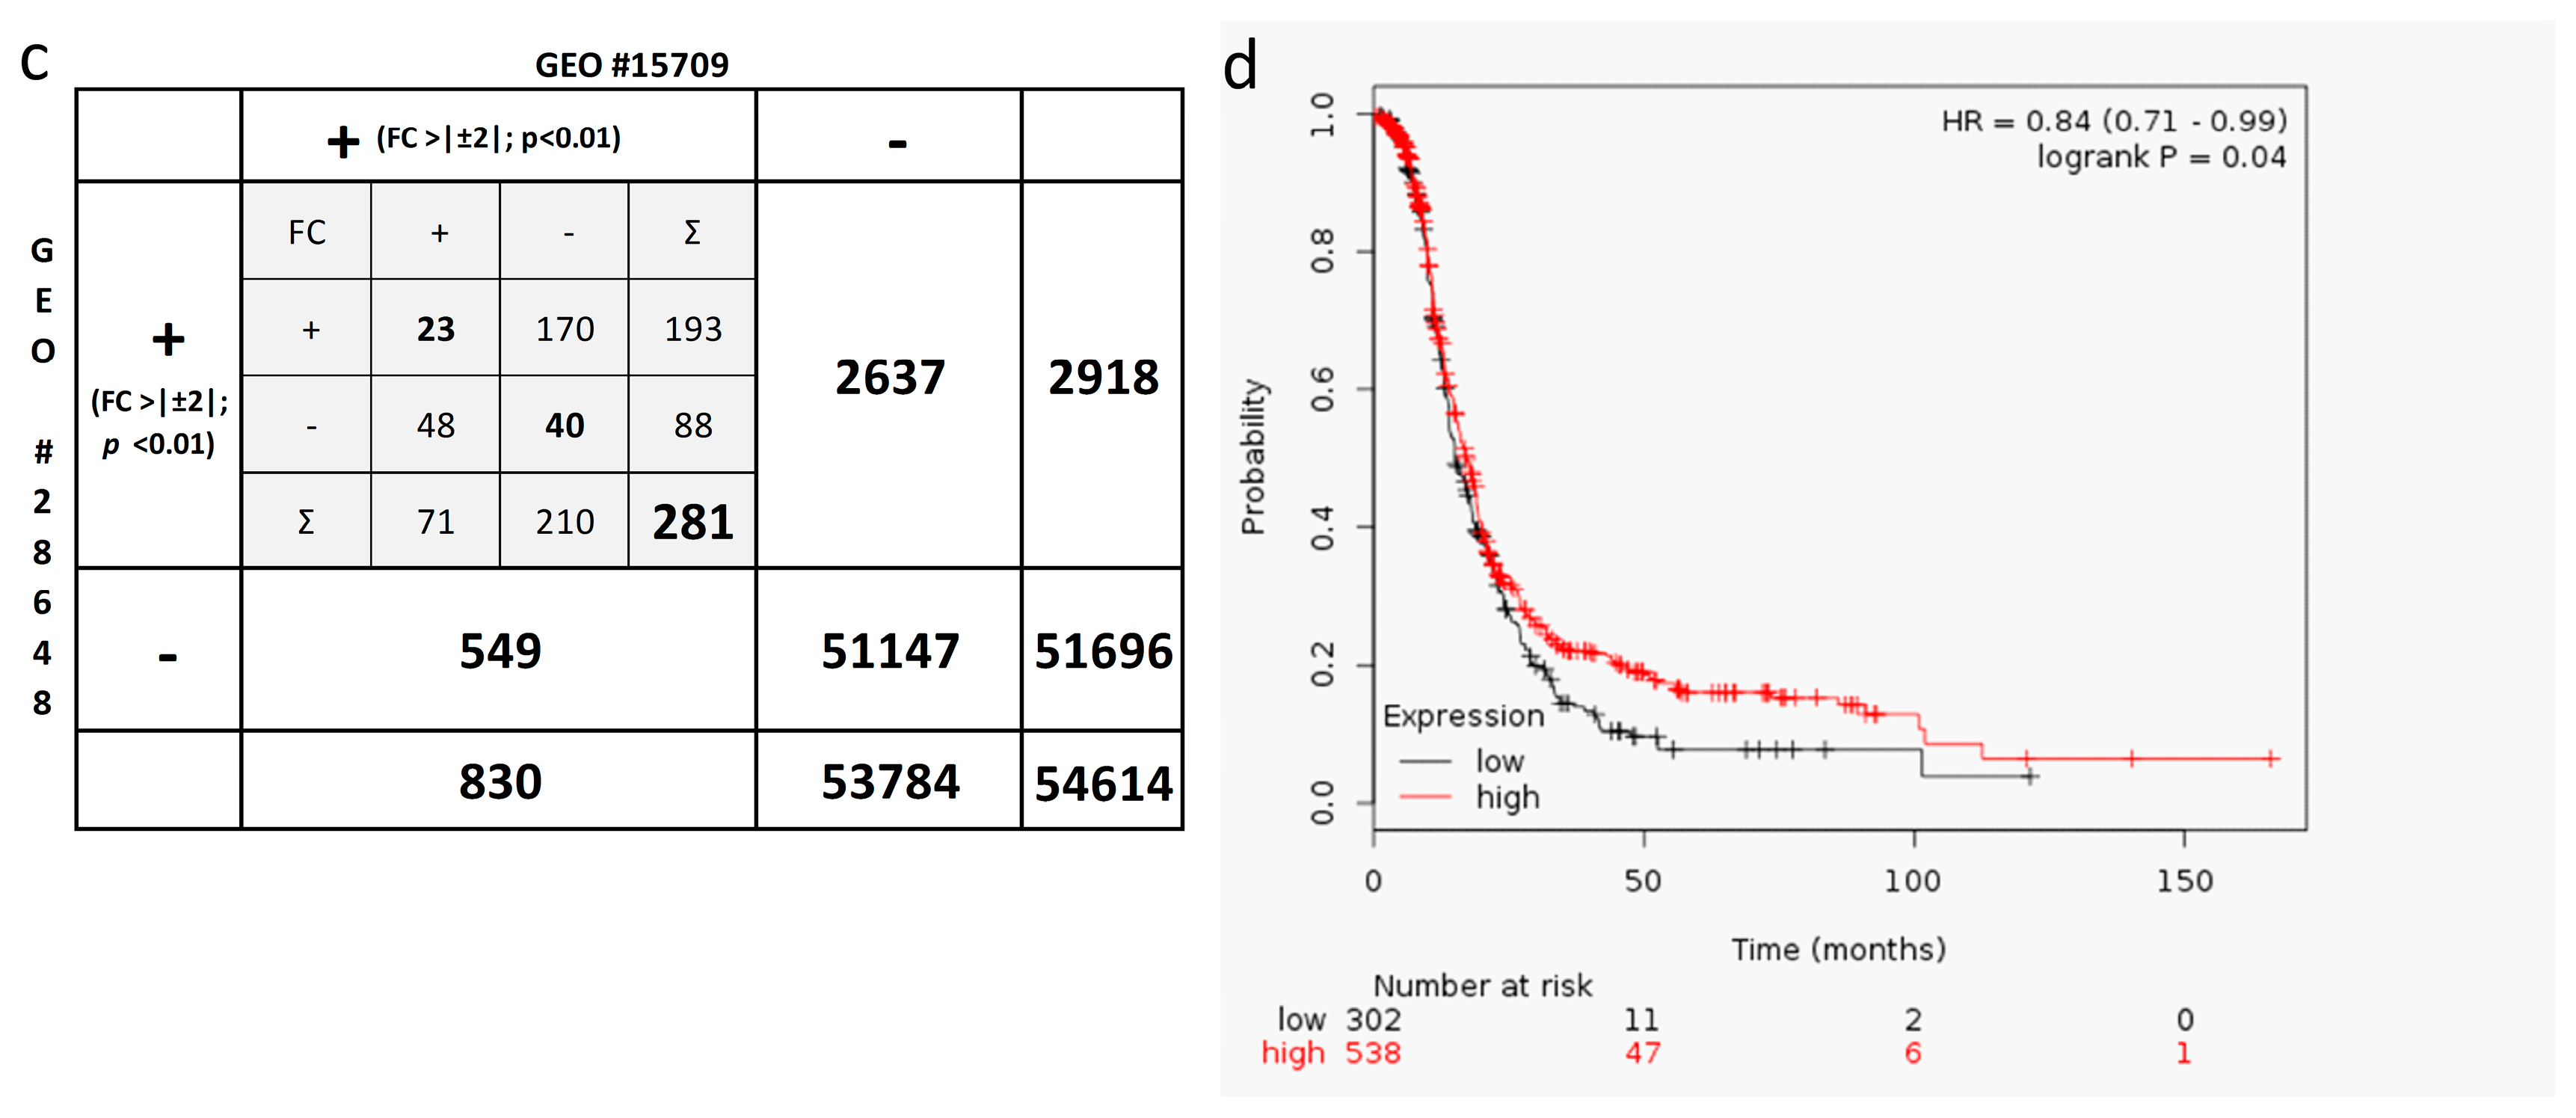
2.6. In-Silico Analysis of Published Datasets for RUNX3

RUNX3 is described as mediating platinum resistance in A2780 cells [24]. Our data point to transcript variant 1 in mediating this effect (Figure 2c) but we did not observe an aberrant RUNX3 expression in resistant A2780 (Figure 1). Therefore, we have interrogated public data (NCBI Geo database, TCGA) partly using the Kaplan–Meier Plotter tool [25]. Two genome-wide gene expression datasets (U133+2.0 Affymetrix platform) of independent isogenic pairs of A2780 platinum-sensitive and -resistant subcultures (GSE#15709 [26], GSE#28648 [27]) are available. We are not aware of other ovarian cancer cell lines with independent isogenic platinum-resistant subcultures enabling an analysis of the heterogeneity of resistance states. The comparison of both A2780 data sets clearly proves the presence of at least two largely different genome expression states associated with resistance (Figure 5a–c). The overall number of deregulated transcripts (fold change >|±2|; p < 0.01 BH-corrected) differed 3.5-fold (2918 vs. 830 transcripts) and only 281 transcripts were deregulated in both resistant A2780 cultures. Only the minority of these 281 transcripts were deregulated in identical direction in both isogenic pairs (63/281). RUNX3 was upregulated in GSE#28648 contributing to platinum resistance in these cells [24]. Thus, the existence of two platinum resistance states for A2780 of which only one depends on RUNX3 (potentially TV1) can be supposed. Unfortunately, array-based gene expression analyses cannot differentiate between RUNX3 transcript variants. Variable effects of RUNX3 in independent cultures of A2780 may also translate into variable associations between RUNX3 expression and clinical outcome in different patient cohorts. Barghout et al. analyzed GSE#28739 [28] and detected an up-regulation of RUNX3 in platinum-resistant EOC consistent with their A2780 data [24]. We cannot confirm these data by in-silico analyses (Kaplan−Meier Plotter, Figure 5d). Stratification of EOC patients (serous, FIGO III/IV, treated with platinum; n = 840) by RUNX3 expression revealed that patients with high RUNX3 expression have slightly improved progression-free survival.

3. Discussion

Since the two analyzed genes play a crucial role in cellular functions, CaMKIINα and RUNX3 are highly regulated in normal healthy cells. The hypermethylation of at least one of both genes is associated with reduced progression-free survival, implicating a functional contribution to tumor properties [13]. Thus, we aimed to analyze both genes together, albeit we had no data pointing to a functional relationship between the two proteins. Whether these two genes have a functional relevance and influence ovarian carcinogenesis was not fully elucidated so far. Only the function of CaMKIINβ was evaluated in ovarian cancer [17], but there is evidence that both endogenous CaMKII inhibitors function in a comparable way. The definitive proof for this hypothesis was not yet given. There is extensive literature on RUNX3 for various tumor entities and it appears to be causally involved in tumor development [29]. Interestingly, no one so far has rigorously evaluated the functional difference between the two transcript variants in carcinogenesis; even though it is known that the variants are differentially regulated, and resulting proteins differ in their N-terminus.
After initial surgery the platinum based chemotherapeutics carbo- or cisplatin are used as standard treatment [8,9,10]. Consequently, an important aim of the present study was to evaluate the influence of CaMKIINα or RUNX3 overexpression on the cisplatin sensitivity of EOC cells. Overexpressing CaMKIINα did not result in an effect on cisplatin sensitivity or in a correlation between CaMKIINα expression level and IC50 values. This might have been expected, at least for SKOV3 cells, because of the resistance-associated hypermethylation of CaMKIINα in this cell line [13]. From this result, we conclude that the resistance acquisition in SKOV3 is not a direct consequence of the CaMKIINα promoter methylation that can be reverted solely by overexpression of CaMKIINα. Nevertheless, we cannot exclude a contribution of CaMKIINα at early stages of resistance development or a function in regulatory mechanisms, incompatible with a dominant resistance phenotype. The reduced proliferation and colony-forming ability after CaMKIINα overexpression in resistant cells may point to such an involvement. Moreover, treatment of ovarian cancer cells with calmodulin inhibitors increases the sensitivity to cisplatin [30,31]. Thus, the contribution of Ca2+-calmodulin pathways to cisplatin sensitivity should still be investigated further. In the functional assays we demonstrated that CaMKIINα drives the cells towards a loss of oncogenic behavior. A reduction in proliferation (A2780 only) and reduced colony formation were seen, indicating a tumor suppressive function of CaMKIINα. Comparable effects were detected in prostate cancer cells by Wang and colleagues [16]. Furthermore, the influence of CaMKII and its endogenous inhibitors on proliferation and cellular growth was also investigated in various other tumor entities pointing in the same direction [17,32,33,34,35,36]. The endogenous CaMKII inhibitors possibly lead to a cell cycle arrest in S phase [36]. The reduction of migratory behavior induced via CaMKIINα overexpression was not observed so far, but indicates in line with the other results that CaMKIINα can act tumor suppressive in ovarian cancer cell lines. This matches studies showing a protective role of this gene from developing a more aggressive and extensive thyroid tumor [18].
In contrast to CaMKIINα, we see direct effects on the cisplatin sensitivity when overexpressing RUNX3 transcript variants in the analyzed ovarian cancer cell lines. Both RUNX3 variants led to a gain of resistance but with a largely different effect size in SKOV3 cells. Whereas TV 1 increased the resistance of SKOV3 3.5-fold, TV 2 induced a 1.16-fold resistance only. In A2780 the resistance-effect was only seen when transfected with transcript variant 1 (1.9-fold increase of IC50). Moreover, the cells became sensitive against cisplatin when overexpressing RUNX3 TV2 (2.3-fold decreased resistance). The contrary effects of both transcript variants are associated with different cell cycle distributions under cisplatin treatment i.e., RUNX3 TV1 reduced the G2/M arrest to a level comparable with resistant A2780 cells (Figure 2e). The 1.9-fold increased resistance of A2780 after transfection of RUNX3 TV1 resembles data from Barghout et al. showing a 1.8-fold increased resistance for carboplatin treatment of RUNX3 overexpressing A2780 [24]. The different behavior of A2780 and SKOV3 after RUNX3 TV2 overexpression is maybe related to the p53 status (A2780 p53wt; SKOV3 p53-null). RUNX3 acts as co-activator of p53 in DNA-damage response and apoptosis induction [37]. Our data point towards RUNX3 TV2 in mediating this effect. Combining the herein presented cell line data with the clinical data from our study [13], we hypothesize that the cisplatin sensitivity-mediating transcript variant 2 is inactivated via P2 promoter methylation—enabling a shift to transcript variant 1 and causing a platinum-resistant phenotype. Thus, the resistance may lead to a worsened outcome for the patient. It was already described that the response to platinum-based chemotherapy is influenced by the deregulation of RUNX proteins or Abl-YAP1-p73 signaling [23], suggesting the importance of the transcription factors for the therapy’s success. Beside platinum resistance, we measured RUNX3 transcript-specific effects on cell proliferation and migration. While growth of the analyzed cell lines was reduced by overexpression of RUNX3 TV1 the same anti-proliferative effect with overexpression of RUNX3 TV2 was just seen in SKOV3 cells. The slight induction of proliferation in A2780 cells expressing variant 2 is also a plausible explanation for the fact that those cells experience higher cisplatin sensitivity. Already Nevandunsky and colleagues reported the effect that RUNX3 overexpression leads to an increased cellular proliferation of A2780 [38]. Since no differentiation between the two transcript variants was done they assumed a general oncogenic function for RUNX3. But it appears that a faster proliferation in A2780 is just seen in RUNX3 TV2 expressing cells with concomitantly increased platinum sensitivity. The net effect may not provide the cancer cells with a survival benefit after chemotherapy in vivo. The cisplatin-resistant RUNX3 TV1-expressing A2780 cells presented also an increased migratory movement further underscoring the hypothesis of RUNX3 TV1 as mediating an aggressive phenotype. Additionally, murine leukemia virus integration in the RUNX3 loci, resulting in overexpression of P1 derived RUNX3 TV1, caused lymphomas, and revealed a potential oncogenic function [39]. The difference in the observed aggressiveness between cells overexpressing RUNX3 variants is possibly caused by the different ways the two transcript variants regulate the NF-κB pathway. The oncogenic activity of NF-κB is enhanced by the action of RUNX3 TV1 encoded isoforms while TV2 impacts its cancer inhibitory function [20]. Combining this with the fact that NF-κB induces the migration of immune cells [40], one may have a potential explanation why RUNX3 TV1 and TV2 transfected cells differ in their migratory properties. Altogether, the crucial factor in patients’ tumors may not be the proliferation rate (TV2-mediated), but the ability to persist unaffected by the chemotherapeutic drug and the ability to form metastasis (TV1-mediated). Thus RUNX3 TV1 may favor tumor progression and relapse.
Our data provide novel insight on the functional roles for RUNX3. RUNX3 is described to exert tissue-specific functions leading to both oncogenic and tumor-suppressive roles depending on analyzed tumor entities [23]. Moreover, RUNX3 can act in both ways within pancreatic cancer cells depending on cellular background and functional read out [41]. Unfortunately, most papers analyzing RUNX3 function or aberrations neither differentiate between isoforms, nor specify which transcript variant is analyzed. Such differentiation is hampered by the absence of specific antibodies against the protein isoforms, and a small difference in the 5′ nucleotide sequence only. Thus, we cannot estimate the contribution of the isoforms to the reported variable roles of RUNX3 in general. Even for the platinum resistance phenotype, both transcript variants and cellular background differences may contribute to contrary RUNX3 effects. We have shown dichotomous roles for RUNX3 transcript variants in A2780 and our results for RUNX3 TV1 correspond to results from Barghout and colleagues [24]. They describe the contribution of RUNX3 to platinum resistance in A2780 but do not report about the transcript specificity of their results. Overexpression of RUNX3 in A2780 resulted in increased resistance, whereas knockdown in A2780CP lead to higher sensitivity of this resistant subculture [24]. Nevertheless, we did not detect an overexpression of RUNX3 in resistant cells but our in-silico analysis proves the presence of at least two different genome-wide expression states, associated with platinum resistance in A2780, of which only one is related to RUNX3 overexpression (Figure 5). Thus, the herein analyzed A2780-CIS cells may represent the second resistance state not depending on RUNX3, explaining the absent up-regulation of RUNX3 (Figure 1). Analyses of RUNX3 expression as biomarker in clinical samples is hampered by missing isoform-specific antibodies and a frequent transcript quantification not differentiating between variants. Additionally, the number of tumor-infiltrating immune cells influences the measured tissue-based RUNX3 gene expression because of an inherent RUNX3 expression in immune cells. Thus, potential bias can be induced because the number of immune cells itself has also prognostic effects for ovarian cancer patients [42]. These reasons may contribute to observed discrepancies between publicly available datasets (Figure 5d and Barghout et al. [24]).
Limitations of the present study are the analysis of single cell clones and the choice of used cell lines. The necessity for using cell clones arose because of a high frequency of transgene negative cells after selection precluding the analysis of batch cultures. Nevertheless, we reduced sources of bias by analyzing clones with different transgene expression level (clonal effects) and empty vector controls for each transfection experiment (batch effects, A2780 RUNX3 transfection). The functional implications of CaMKIINα and RUNX3 expression in ovarian carcinogenesis were analyzed using A2780 and SKOV3 cells. It was shown that both cell lines do not represent high-grade serous EOC well [43]. Thus, data from this study may not be completely transferred to all high-grade serous EOC, but main conclusions fit to previously published methylation data, and may partially explain the worse clinical outcome for ca. 40% of type II EOC patients with PFS <3 years [13]. We had chosen these lines for functional analyses because of the availability of isogenic pairs of sensitive and resistant cultures in our lab and the fact that both cell lines were the ones most often used in published studies [43]. Specifically most data about RUNX3 and CaMKIINβ functions in EOC were derived from A2780 or SKOV3 [17,22,24,38].
Applying various functional assays, we prove that CaMKIINα acts as a tumor suppressor, as already seen in other cancer types [16,36]. Both endogenous CaMKII inhibitors operate in ovarian cancer in the equal manner [17]. Likewise, this evidence is supported by the fact that CaMKIINα promoter hypermethylation is associated with poor patient’s prognosis [13]. Evaluating the data of the second marker gene, we demonstrated that RUNX3 TV1 has a more aggressive potential than the shorter variant 2. In accordance with clinical data showing promoter P2 hypermethylation in patients with poor prognosis [13], RUNX3 TV2 can be labelled as the more tumor suppressive version. Therefore, we encourage the idea that RUNX3 has a dualistic effect on EOC cells as already postulated by Chuang and Ito [19]. Because the two RUNX3 protein isoforms function in a different manner the necessity to discriminate between the two transcript variants can be deduced from this study. So far such a distinction was not regularly considered when evaluating its role in carcinogenesis. In summary, our data showed that CaMKIINα and RUNX3 are functionally involved in ovarian carcinogenesis and support that the methylation of both genes should be further evaluated as biomarker.

4. Materials and Methods

4.1. Cell Culture

SKOV3 and A2780 ovarian cancer cells were maintained in RPMI (Roswell Park Memorial Institute) Medium 1640—GlutaMAX™-I (Life Technologies, Darmstadt, Germany) containing 10% fetal calf serum and 1% Pen Strep (Life Technologies) in a 37 °C incubator under 5% CO2 and 95% humidity. Respective cisplatin-resistant cells of each cell line were generated as published for SKOV3 [13]. Transfected cells were cultured in cell line specific selection RPMI media comprising 0.3 or 0.4 mg/mL of the selection antibiotic Geneticin—G418 for A2780 and SKOV3 respectively. Cell lines were obtained from A. Brüning (Munich, Germany, A2780) and P. Altevogt (Heidelberg, Germany, SKOV3). Cell line authentication was done by STR profiling in September 2014 and February 2016 and revealed the correct identity depicted by a 97 % and 100 % match for A2780 and SKOV3 (ICLAC Match Criteria Worksheet [44]) compared to STR reference profiles (ATCC and [45]).

4.2. Transfection and Single Cell Clone Generation

The copy DNA (cDNA) of CaMKIINα (NM_018584) and RUNX3 in its transcript variants 1 (NM_001031680) and 2 (NM_004350) were cloned into a pBK-CMV expression vector flanking BamHI and XbaI sites by PCR-amplification of the open reading frames from cDNA of the ovarian cancer cell line HOC-7 (CaMKIINα) or a biopsy from an ovarian cancer patient (#2340; RUNX3). Correct, error-free sequences were confirmed by Sanger-sequencing of plasmid DNA. A2780 cells were transfected using the IsiFECT™ transfection reagent (BianoScience, Zwickau, Germany) while the Lipofectamine transfection reaction (Invitrogen, Darmstadt, Germany) was used for SKOV3 cells. Empty vector pBK-CMV transfected cells were used as controls. The RUNX3 transcript variants were transfected into A2780 in different experiments resulting in two different control cell cultures (empty vector 1 and 2). The pBK-CaMKIINα plasmids were transfected into cisplatin-resistant cells while the pBK-RUNX3 plasmids were transfected into parental cells. To generate single cell clones the cells were either seeded in a 96-well plate with statistically less than one cell per well or seeded with 500 cells in a 10 cm Petri dish and directly picked after colony formation. The cells were expanded in different dishes till they were able to cover a 6 cm Petri dish. From the 6 cm Petri dish, cells were cryogenic stored or treated with lysis buffer for RNA isolation (Macherey Nagel, Düren, Germany).

4.3. Immunocytochemical Staining Assays

Up to 30,000 cells of each single cell clone were grown for 24 h in one well of a 8-well chamber slide (Nalgene Nunc International, Penfield, NY, USA) and used for the immunocytochemical staining against RUNX3 as previously described [13]. The overexpression of RUNX3 was confirmed via qRT-PCR for each positively stained clone. CaMKIINα protein expression was analyzed by immunofluorescence analysis as published [13].

4.4. Gene expression Analysis

To analyze the overexpression of transfected genes expression analyses were conducted using established techniques and gene specific primers (Table 1) [13].

4.5. Western Blot Analysis

Total proteins were extracted using RIPA (Radioimmunoprecipitation assay) buffer supplemented with protease inhibitors (Complete mini, Roche, Mannheim, Germany). Equal amounts of proteins from each lysate were separated on a 10% sodium dodecyl sulfate-polyacrylamide gel electrophoresis (SDS-PAGE) and transferred onto a polyvinylidene fluoride (PVDF) membrane (Millipore, Burlington, MA, USA). The Tris-buffered saline with Tween-20 (TBST)-blocked membrane was incubated with the appropriate primary antibody overnight at 4 °C; RUNX3 (R3-5G4, Santa Cruz Biotechnology, Dallas, TX, USA), Actin (BD Biosciences, San Jose, CA, USA). After being washed three times in 1xTBST the membrane was exposed to the secondary antibody against mouse IgG (Jackson Laboratories, Bar Harbor, ME, USA) for 1 h at room temperature (RT). The protein expression was visualized by chemiluminescence using ECL reagents (Pierce, Thermo Fisher Scientific, Waltham, MA, USA). Actin was used as loading control.

4.6. IC50 Determination Against Cisplatin

A total of 1 × 10⁴ cells were seeded as technical triplicate in a 96-well plate in a total of 200 µL RPMI medium and cultivated for 24 h. Different cisplatin concentrations (between 100 and 0.1 µM) were generated through a serial dilution of a 1 mg/mL stock solution. The cells were incubated for 48 h under the substances influence. Afterwards the cells were incubated for 1 to 1.5 h with fresh RPMI medium before 15 µL MTT (tetrazolium dye 3-(4,5-dimethylthiazol-2-yl)-2,5-diphenyltetrazolium bromide) reagent (Promega, Mannheim, Germany) was added to each well and cells were lysed after incubation for 1 h. The emerging purple precipitate was measured at 570 nm using a microplate reader (SPECTROstar Omega, BMG Labtech, Freiburg, Germany). After background subtraction relative values were calculated and analyzed via GraphPad 5.0 software using non-linear regression analyses.

4.7. Cell Proliferation Assay

A total of 2500 cells were seeded as technical triplicates in a 96-well plate in a total of 100 µL RPMI medium. To assess the proliferation rate the CellTiter 96® Non-Radioactive Cell Proliferation Assay (MTT) from Promega was used. Similar to the IC50 determination the cells were treated with 15 µL MTT reagent and incubated 1 h at 37 °C and lysed before spectrometric measurement at 570 nm. The amount of cells was analyzed after 24, 48, 72 and 96 h. To exclude variations in cell number an initial measurement was taken 2 h after seeding, and subtracted from all further measurement. To confirm the proliferation rate assessed with the MTT reagent and to exclude variations in the enzymatic activity between different cells one radioactivity based tritium (3H) assay was additionally performed.

4.8. Colony Formation Assay

Five hundred cells were seeded as a technical triplicate in 6-well plates and cultured in 2 mL RMPI medium for 10 days. The established colonies were washed with DPBS +/+ and fixed 20 min at 4 °C with ice-cold 70% EtOH. After washing with double-deionized water the fixed colonies were air-dried and stained with differently concentrated crystal violet solution for 5 min at RT. To stain A2780 cells a 0.1% crystal violet solution was used while for SKOV3 cells a 1% solution was needed to improve visible staining. Acetic acid (10% concentration) was used to extract the crystal violet pigments from the stained colonies and the amount of crystal violet was then measured at a wavelength of 630 nm. The measured optical density correlated with the amount of cells stained and therefore also with the numbers of colonies counted.

4.9. Migration-Scratch Assay

A total of 1 × 10⁶ (SKOV3) or 2.5 × 10⁶ (A2780) cells were seeded in a 6-well plate and grown in normal RPMI medium till 80–90% confluence was reached. Three scratches were introduced into the cell monolayer and washed with DPBS +/+ to remove cell debris. To measure just the migratory ability the cells were further cultivated in serum-free medium. Images were taken at three pre-defined areas of the scratches at the time points 0, 6, 12, 24 and 48 h. Since A2780 cells migrate slower, an additional image was taken 72 h after the scratch introduction. Analysis was then conducted using the open source software T-Scratch. The mean wound closure at the three pre-defined areas represented the result for each independent experiment.

4.10. Flow Cytometry

For cell cycle analysis cells were treated with 3 µM cisplatin for 48 h, washed twice with PBS, and fixed in 50% ice cold ethanol at −20 °C for at least 3 h. After washing out the ethanol with double-deionized water, cells were treated with RNase A and stained with propidium iodide (PI, 50 µg/mL). Cells were measured using a Canto II (BD Biosciences). Data were analyzed with FlowJo software (FlowJo, Ashland, OR, USA).

4.11. Statistical Analysis

Statistical comparisons of the data from the in vitro assays were conducted applying the Student t-test. p-values smaller than 0.05 were considered as statistical significant. All data are reported as mean ± standard deviation reflecting at least three independent experiments (n ≥ 3) for cell cultures or individual single cell clones. Averaged data for multiple clones represent the mean from individual clones gathered from at least three independent experiments. Boxplots depict minimum and maximum values (whiskers); the inter quartile range (box) and the median (line).

5. Conclusions

In vitro analyses of CaMKIINα and RUNX3 identified an influence on proliferation, migration or platinum resistance consistent with a less aggressive phenotype in vivo for tumors without hypermethylation of these genes. Thus, the results support the association of hypermethylation and a worse prognosis for ovarian cancer patients. Importantly, RUNX3 variants exhibited dichotomous roles, and studies analyzing RUNX3 function should discriminate between them.

Supplementary Materials

The following are available online at www.mdpi.com/1422-0067/19/1/253/s1.

Acknowledgments

This work was supported by grants of the Interdisciplinary Centre for Clinical Research (IZKF) Jena (Junior Project J17) and the Deutsche Forschungsgemeinschaft DFG (HA5068/2-1) to Norman Häfner.

Author Contributions

Karolin Heinze and Norman Häfner established all methods and Karolin Heinze conducted the presented experimental work. Norman Häfner established resistant subcultures of A2780 and SKOV3 and cloned RUNX3 variants. Daniel Kritsch and Norman Häfner performed initial cloning work of the pBK-CaMKIINα plasmid. Alexander S. Mosig and Karolin Heinze performed FACS analyses. Norman Häfner conducted RUNX3-specific database analyses. Ingo B. Runnebaum, Norman Häfner and Matthias Dürst developed the project idea and supervised the work. Karolin Heinze, Norman Häfner and Matthias Dürst drafted the paper. All authors approved the final manuscript version.

Conflicts of Interest

The authors declare no conflict of interest. The founding sponsors had no role in the design of the study; in the collection, analyses, or interpretation of data; in the writing of the manuscript, and in the decision to publish the results.

Abbreviations

EOCepithelial ovarian cancer
ICinhibitory concentration
TVtranscript variant
5yr-SR5-year-survival-rate

References

  1. Siegel, R.L.; Miller, K.D.; Jemal, A. Cancer statistics, 2015. CA Cancer J. Clin. 2015, 65, 5–29. [Google Scholar] [CrossRef] [PubMed]
  2. Robert-Koch-Institut (RKI). Krebs in Deutschland 2011/2012; Robert-Koch-Institut und GEKID: Berlin, Germany, 2015. [Google Scholar]
  3. Vaughan, S.; Coward, J.I.; Bast, R.C., Jr.; Berchuck, A.; Berek, J.S.; Brenton, J.D.; Coukos, G.; Crum, C.C.; Drapkin, R.; Etemadmoghadam, D.; et al. Rethinking ovarian cancer: Recommendations for improving outcomes. Nat. Rev. Cancer 2011, 11, 719–725. [Google Scholar] [CrossRef] [PubMed]
  4. National-Cancer-Institute SEER. SEER Cancer Statistics Review, 1975–2012; SEER: Bethesda, MD, USA, 2015. [Google Scholar]
  5. McCluggage, W.G. Morphological subtypes of ovarian carcinoma: A review with emphasis on new developments and pathogenesis. Pathology 2011, 43, 420–432. [Google Scholar] [CrossRef] [PubMed]
  6. Greenlee, R.T.; Hill-Harmon, M.B.; Murray, T.; Thun, M. Cancer statistics, 2001. CA Cancer J. Clin. 2001, 51, 15–36. [Google Scholar] [CrossRef] [PubMed]
  7. International Agency for Research on Cancer (IARC). GLOBOCAN 2012: Estimated Cancer Incidence, Mortality and Prevalence Worldwide in 2012; IARC: Lyon, France, 2012. [Google Scholar]
  8. McGuire, W.P. Maintenance therapy for ovarian cancer: Of Helsinki and Hippocrates. J. Clin. Oncol. 2009, 27, 4633–4634. [Google Scholar] [CrossRef] [PubMed]
  9. Omura, G.; Blessing, J.A.; Ehrlich, C.E.; Miller, A.; Yordan, E.; Creasman, W.T.; Homesley, H.D. A randomized trial of cyclophosphamide and doxorubicin with or without cisplatin in advanced ovarian carcinoma. A Gynecologic Oncology Group Study. Cancer 1986, 57, 1725–1730. [Google Scholar] [CrossRef]
  10. Coleman, M.P.; Forman, D.; Bryant, H.; Butler, J.; Rachet, B.; Maringe, C.; Nur, U.; Tracey, E.; Coory, M.; Hatcher, J.; et al. Cancer survival in Australia, Canada, Denmark, Norway, Sweden, and the UK, 1995–2007 (the International Cancer Benchmarking Partnership): An analysis of population-based cancer registry data. Lancet 2011, 377, 127–138. [Google Scholar] [CrossRef]
  11. Bijron, J.G.; Bol, G.M.; Verheijen, R.H.; van Diest, P.J. Epigenetic biomarkers in the diagnosis of ovarian cancer. Expert Opin. Med. Diagn. 2012, 6, 421–438. [Google Scholar] [CrossRef] [PubMed]
  12. Barton, C.A.; Hacker, N.F.; Clark, S.J.; O’Brien, P.M. DNA methylation changes in ovarian cancer: Implications for early diagnosis, prognosis and treatment. Gynecol. Oncol. 2008, 109, 129–139. [Google Scholar] [CrossRef] [PubMed]
  13. Hafner, N.; Steinbach, D.; Jansen, L.; Diebolder, H.; Durst, M.; Runnebaum, I.B. RUNX3 and CAMK2N1 hypermethylation as prognostic marker for epithelial ovarian cancer. Int. J. Cancer 2016, 138, 217–228. [Google Scholar] [CrossRef] [PubMed]
  14. Chang, B.H.; Mukherji, S.; Soderling, T.R. Characterization of a calmodulin kinase II inhibitor protein in brain. Proc. Natl. Acad. Sci. USA 1998, 95, 10890–10895. [Google Scholar] [CrossRef] [PubMed]
  15. Chang, B.H.; Mukherji, S.; Soderling, T.R. Calcium/calmodulin-dependent protein kinase II inhibitor protein: Localization of isoforms in rat brain. Neuroscience 2001, 102, 767–777. [Google Scholar] [CrossRef]
  16. Wang, T.; Liu, Z.; Guo, S.; Wu, L.; Li, M.; Yang, J.; Chen, R.; Xu, H.; Cai, S.; Chen, H.; et al. The tumor suppressive role of CAMK2N1 in castration-resistant prostate cancer. Oncotarget 2014, 5, 3611–3621. [Google Scholar] [CrossRef] [PubMed]
  17. Ma, S.; Yang, Y.; Wang, C.; Hui, N.; Gu, L.; Zhong, H.; Cai, Z.; Wang, Q.; Zhang, Q.; Li, N.; et al. Endogenous human CaMKII inhibitory protein suppresses tumor growth by inducing cell cycle arrest and apoptosis through down-regulation of the phosphatidylinositide 3-kinase/Akt/HDM2 pathway. J. Biol. Chem. 2009, 284, 24773–24782. [Google Scholar] [CrossRef] [PubMed]
  18. Russo, E.; Salzano, M.; De Falco, V.; Mian, C.; Barollo, S.; Secondo, A.; Bifulco, M.; Vitale, M. Calcium/Calmodulin-dependent protein kinase II and its endogenous inhibitor alpha in medullary thyroid cancer. Clin. Cancer Res. 2014, 20, 1513–1520. [Google Scholar] [CrossRef] [PubMed]
  19. Chuang, L.S.; Ito, Y. RUNX3 is multifunctional in carcinogenesis of multiple solid tumors. Oncogene 2010, 29, 2605–2615. [Google Scholar] [CrossRef] [PubMed]
  20. Lim, B.; Ju, H.; Kim, M.; Kang, C. Increased genetic susceptibility to intestinal-type gastric cancer is associated with increased activity of the RUNX3 distal promoter. Cancer 2011, 117, 5161–5171. [Google Scholar] [CrossRef] [PubMed]
  21. Egawa, T.; Tillman, R.E.; Naoe, Y.; Taniuchi, I.; Littman, D.R. The role of the Runx transcription factors in thymocyte differentiation and in homeostasis of naive T cells. J. Exp. Med. 2007, 204, 1945–1957. [Google Scholar] [CrossRef] [PubMed]
  22. Lee, C.W.; Chuang, L.S.; Kimura, S.; Lai, S.K.; Ong, C.W.; Yan, B.; Salto-Tellez, M.; Choolani, M.; Ito, Y. RUNX3 functions as an oncogene in ovarian cancer. Gynecol. Oncol. 2011, 122, 410–417. [Google Scholar] [CrossRef] [PubMed]
  23. Ito, Y.; Bae, S.C.; Chuang, L.S. The RUNX family: Developmental regulators in cancer. Nat. Rev. Cancer 2015, 15, 81–95. [Google Scholar] [CrossRef] [PubMed]
  24. Barghout, S.H.; Zepeda, N.; Vincent, K.; Azad, A.K.; Xu, Z.; Yang, C.; Steed, H.; Postovit, L.M.; Fu, Y. RUNX3 contributes to carboplatin resistance in epithelial ovarian cancer cells. Gynecol. Oncol. 2015, 138, 647–655. [Google Scholar] [CrossRef] [PubMed]
  25. Gyorffy, B.; Lanczky, A.; Szallasi, Z. Implementing an online tool for genome-wide validation of survival-associated biomarkers in ovarian-cancer using microarray data from 1287 patients. Endocr. Relat. Cancer 2012, 19, 197–208. [Google Scholar] [CrossRef] [PubMed]
  26. Li, M.; Balch, C.; Montgomery, J.S.; Jeong, M.; Chung, J.H.; Yan, P.; Huang, T.H.; Kim, S.; Nephew, K.P. Integrated analysis of DNA methylation and gene expression reveals specific signaling pathways associated with platinum resistance in ovarian cancer. BMC Med. Genom. 2009, 2, 34. [Google Scholar] [CrossRef] [PubMed]
  27. Zeller, C.; Dai, W.; Steele, N.L.; Siddiq, A.; Walley, A.J.; Wilhelm-Benartzi, C.S.; Rizzo, S.; van der Zee, A.; Plumb, J.A.; Brown, R. Candidate DNA methylation drivers of acquired cisplatin resistance in ovarian cancer identified by methylome and expression profiling. Oncogene 2012, 31, 4567–4576. [Google Scholar] [CrossRef] [PubMed]
  28. Bachvarov, D.; L’Esperance, S.; Popa, I.; Bachvarova, M.; Plante, M.; Tetu, B. Gene expression patterns of chemoresistant and chemosensitive serous epithelial ovarian tumors with possible predictive value in response to initial chemotherapy. Int. J. Oncol. 2006, 29, 919–933. [Google Scholar] [CrossRef] [PubMed]
  29. Ito, K.; Lim, A.C.; Salto-Tellez, M.; Motoda, L.; Osato, M.; Chuang, L.S.; Lee, C.W.; Voon, D.C.; Koo, J.K.; Wang, H.; et al. RUNX3 attenuates beta-catenin/T cell factors in intestinal tumorigenesis. Cancer Cell 2008, 14, 226–237. [Google Scholar] [CrossRef] [PubMed]
  30. Kikuchi, Y.; Miyauchi, M.; Kizawa, I.; Oomori, K.; Kato, K. Establishment of a cisplatin-resistant human ovarian cancer cell line. J. Natl. Cancer Inst. 1986, 77, 1181–1185. [Google Scholar] [PubMed]
  31. Perez, R.P.; Handel, L.M.; Hamilton, T.C. Potentiation of cisplatin cytotoxicity in human ovarian carcinoma cell lines by trifluoperazine, a calmodulin inhibitor. Gynecol. Oncol. 1992, 46, 82–87. [Google Scholar] [CrossRef]
  32. Zhang, J.; Li, N.; Yu, J.; Zhang, W.; Cao, X. Molecular cloning and characterization of a novel calcium/calmodulin-dependent protein kinase II inhibitor from human dendritic cells. Biochem. Biophys. Res. Commun. 2001, 285, 229–234. [Google Scholar] [CrossRef] [PubMed]
  33. Ducibella, T.; Schultz, R.M.; Ozil, J.P. Role of calcium signals in early development. Semin. Cell Dev. Biol. 2006, 17, 324–332. [Google Scholar] [CrossRef] [PubMed]
  34. Colomer, J.; Means, A.R. Physiological roles of the Ca2+/CaM-dependent protein kinase cascade in health and disease. In Sub-Cellular Biochemistry; Springer: Dordrecht, The Netherlands, 2007; Volume 45, pp. 169–214. [Google Scholar]
  35. Rusciano, M.R.; Salzano, M.; Monaco, S.; Sapio, M.R.; Illario, M.; De Falco, V.; Santoro, M.; Campiglia, P.; Pastore, L.; Fenzi, G.; et al. The Ca2+-calmodulin-dependent kinase II is activated in papillary thyroid carcinoma (PTC) and mediates cell proliferation stimulated by RET/PTC. Endocr. Relat. Cancer 2010, 17, 113–123. [Google Scholar] [CrossRef] [PubMed]
  36. Wang, C.; Li, N.; Liu, X.; Zheng, Y.; Cao, X. A novel endogenous human CaMKII inhibitory protein suppresses tumor growth by inducing cell cycle arrest via p27 stabilization. J. Biol. Chem. 2008, 283, 11565–11574. [Google Scholar] [CrossRef] [PubMed]
  37. Yamada, C.; Ozaki, T.; Ando, K.; Suenaga, Y.; Inoue, K.; Ito, Y.; Okoshi, R.; Kageyama, H.; Kimura, H.; Miyazaki, M.; et al. RUNX3 modulates DNA damage-mediated phosphorylation of tumor suppressor p53 at Ser-15 and acts as a co-activator for p53. J. Biol. Chem. 2010, 285, 16693–16703. [Google Scholar] [CrossRef] [PubMed]
  38. Nevadunsky, N.S.; Barbieri, J.S.; Kwong, J.; Merritt, M.A.; Welch, W.R.; Berkowitz, R.S.; Mok, S.C. RUNX3 protein is overexpressed in human epithelial ovarian cancer. Gynecol. Oncol. 2009, 112, 325–330. [Google Scholar] [CrossRef] [PubMed]
  39. Stewart, M.; MacKay, N.; Cameron, E.R.; Neil, J.C. The common retroviral insertion locus Dsi1 maps 30 kilobases upstream of the P1 promoter of the murine Runx3/Cbfa3/Aml2 gene. J. Virol. 2002, 76, 4364–4369. [Google Scholar] [CrossRef] [PubMed]
  40. Young, N.A.; Bruss, M.S.; Gardner, M.; Willis, W.L.; Mo, X.; Valiente, G.R.; Cao, Y.; Liu, Z.; Jarjour, W.N.; Wu, L.C. Oral administration of nano-emulsion curcumin in mice suppresses inflammatory-induced NFkappaB signaling and macrophage migration. PLoS ONE 2014, 9, e111559. [Google Scholar] [CrossRef] [PubMed]
  41. Whittle, M.C.; Izeradjene, K.; Rani, P.G.; Feng, L.; Carlson, M.A.; DelGiorno, K.E.; Wood, L.D.; Goggins, M.; Hruban, R.H.; Chang, A.E.; et al. RUNX3 Controls a Metastatic Switch in Pancreatic Ductal Adenocarcinoma. Cell 2015, 161, 1345–1360. [Google Scholar] [CrossRef] [PubMed]
  42. Mariya, T.; Hirohashi, Y.; Torigoe, T.; Asano, T.; Kuroda, T.; Yasuda, K.; Mizuuchi, M.; Sonoda, T.; Saito, T.; Sato, N. Prognostic impact of human leukocyte antigen class I expression and association of platinum resistance with immunologic profiles in epithelial ovarian cancer. Cancer Immunol. Res. 2014, 2, 1220–1229. [Google Scholar] [CrossRef] [PubMed]
  43. Domcke, S.; Sinha, R.; Levine, D.A.; Sander, C.; Schultz, N. Evaluating cell lines as tumour models by comparison of genomic profiles. Nat. Commun. 2013, 4, 2126. [Google Scholar] [CrossRef] [PubMed]
  44. American National Standards Institute ANSI/ATCC. Authentication of Human Cell Lines: Standardization of STR Profiling; ASN-0002-2011; ANSI Standards Store: Washington, DC, USA, 2012. [Google Scholar]
  45. Beaufort, C.M.; Helmijr, J.C.; Piskorz, A.M.; Hoogstraat, M.; Ruigrok-Ritstier, K.; Besselink, N.; Murtaza, M.; van IJcken, W.F.; Heine, A.A.; Smid, M.; et al. Ovarian cancer cell line panel (OCCP): Clinical importance of in vitro morphological subtypes. PLoS ONE 2014, 9, e103988. [Google Scholar] [CrossRef] [PubMed] [Green Version]
Figure 1. Overexpression of CaMKIINα and RUNX3 TV1 and TV2 in A2780 and SKOV3 cells. (a) Boxplot showing the overexpression of the transgenes in A2780 cells compared to untransfected parental, cisplatin (CIS)-resistant cells and the empty vector controls expressing neither CaMKIINα nor RUNX3; (b) Boxplot showing the relative expression of the candidate genes in SKOV3 cells compared to the untransfected parental cells. Whereas CIS-resistant cells and the empty vector controls did not show an increased expression the transfected cells exhibited high levels of the transgenes. All data were normalized against the housekeeping genes Actin-b and HPRT; (c) Immunofluorescence staining for CaMKIINα exemplary for A2780 validating protein re-expression in transfected resistant A2780 clones (scale bar 50 µm); (d,e) Western blot and immunocytochemistry (scale bar 100 µm) confirming expression of differently sized RUNX3 isoforms in exemplary single cell clones. (Boxplots depict minimum and maximum values (whiskers); the inter quartile range (box) and the median (line)).
Ijms 19 00253 g001
Figure 2. Sensitivity of the transgene expressing cells towards cisplatin. (a) IC50 measurements of A2780-CIS cells overexpressing CaMKIINα. The resistant A2780-CIS cells and the empty vector control presented the expected increased resistance towards cisplatin compared to parental A2780 cells. No significant change of IC50 values was observed when CaMKIINα was overexpressed in A2780-CIS; (b) In SKOV3-CIS cells the overexpression of CaMKIINα as well resulted in unchanged cisplatin sensitivity; (c) IC50 measurements of parental A2780 cells overexpressing RUNX3 in its two transcript variants. A2780 single cell clones expressing RUNX3 TV1 showed a significantly increased cisplatin resistance compared to the empty vector control and the parental cells but did not reach the resistance level of A2780-CIS cells. In contrast the A2780 RUNX3 TV2 single cell clones presented a significantly increased sensitivity. When comparing the A2780 clones expressing RUNX3 TV1 and clones expressing RUNX3 TV2, the difference in sensitivity was highly significant; (d) SKOV3 cells expressing RUNX3 TV1 exhibited a strong increase in cisplatin resistance while TV2 led to a slight increase, only. The difference between the cells expressing the two variants was significant; (e) Cell cycle analysis of A2780 cells revealed a significantly reduced G2/M arrest in cisplatin treated cells overexpressing RUNX3 TV1, resembling resistant A2780 subcultures. Mean values are shown for different RUNX3 overexpressing clones (n = 4). For all subfigures: * p < 0.05, ** p < 0.01, *** p < 0.001, **** p < 0.0001. (Boxplots depict minimum and maximum values (whiskers); the inter quartile range (box) and the median (line). Bar charts depict the mean ± SD).
Ijms 19 00253 g002
Figure 3. Effects of CaMKIINα overexpression on cellular functions. (a,b) The CaMKIINα expressing cells showed a significant reduction in proliferation compared to the empty vector. This was observed in A2780 as well as SKOV3 cells; (c,d) The ability to establish colonies independent from other cells was also evaluated in CaMKIINα expressing cells. The CaMKIINα clones established fewer colonies as the control cells. A significant reduction in this cellular property was seen in both cell lines. Pictures show exemplary staining of 6 cm dishes; (e) The overexpression of CaMKIINα resulted in a significant reduction of chemoattractant-independent migration of A2780. An overall reduction of migration by 41% was seen compared to the control cells; (f) In SKOV3 cells all tested CaMKIINα single cell clones presented a similar reduction of the migratory behavior as A2780. Two of three clones had a significant reduction in the migratory behavior. An overall reduction of 21% was observed. For all subfigures: * p < 0.05, ** p < 0.01, *** p < 0.001. (Boxplots depict minimum and maximum values (whiskers); the inter quartile range (box) and the median (line). Bar charts depict the mean ± SD).
Ijms 19 00253 g003
Figure 4. Effects of RUNX3 overexpression on cellular functions. (a,b) In A2780 cells, the expression of the two transcript variants resulted in different proliferation rates. While variant 1 led to a high decline, variant 2 caused an increase in the proliferation. In SKOV3 cells the two RUNX3 transcript variants led both to a reduction of proliferation; (c,d) The overexpression of RUNX3 transcript variant 1 in A2780 cells led to a reduction while in SKOV3 cells the tested clone showed no change in its colony formation ability. All single cell clones of both cell lines expressing RUNX3 TV2 showed significantly reduced colony formation compared to the parental or control cells. Because of space limitations the exemplary colony formation picture from 6 cm dishes for A2780 empty vector 2 was excluded; (e) The overexpression of RUNX3 TV1 in A2780 resulted in a significant increase of migration while a reduction was seen in clones expressing RUNX3 TV2. An overall reduction of migration by 14.8% was seen compared to the control cells; (f) In SKOV3 cells all tested RUNX3 clones of both variants presented a decreased migratory behavior while the effect of transcript variant 1 was less pronounced. For all subfigures: * p < 0.05, ** p < 0.01, *** p < 0.001, **** p < 0.0001. (Boxplots depict minimum and maximum values (whiskers); the inter quartile range (box) and the median (line). Bar charts depict the mean ± SD).
Ijms 19 00253 g004
Figure 5. Cisplatin resistance in A2780 can be associated with different genome wide gene expression profiles. (a,b) Volcano plots for transcripts differentially expressed between parental A2780 and cisplatin-resistant A2780 (p < 0.01 and fold change (FC) >2 or <−2) from either GEO#15709 (a) or GEO#28648 (b). Color codes relate to data from GEO#28648 depicting upregulated genes (green), down regulated genes (red) or genes not differentially expressed in this dataset, but in GEO#15709 (grey). The comparison of both plots indicates largely different genome wide expression changes during resistance development in the two independent resistant A2780 cell cultures (GEO#15709; GEO#28648); (c) Cross table comparing the number of targets which are differentially expressed or unchanged in both data sets (outer table). Whereas most genes were not affected in both sets (93.7%) only 281 targets from 2918 (GEO#28648) or from 830 (GEO#15709) are concordantly deregulated. Moreover, only 63 from these 281 transcripts are deregulated in the same direction (23 upregulated, 40 down regulated; inner table, grey). The expression of the majority of 218/281 transcripts is changed in opposite directions; (d) Prognostic value of RUNX3 gene expression analyzed by the Kaplan–Meier-Plotter for public available datasets from EOC patients (serous, FIGO III/IV, treated with platinum; n = 840). Patients with high RUNX3 gene expression show slightly increased progression free survival (PFS) compared to the RUNX3-low group.
Ijms 19 00253 g005aIjms 19 00253 g005b
Table 1. Primer data.
PrimerSequenceProduct Size & Annealing Temperature
CaMKIINα-F5′-GACACCAACAACTTCTTCGG-3′84 bp, 58 °C
CaMKIINα-R5′-CAATAACAACCCGCTTGCT-3′
HPRT-F5′-ACGAAGTGTTGGATATAAGC-3′214 bp, 56 °C
HPRT-R5′-ATAATTTTACTGGCGATGTC-3′
ACTB-F5′-GGACTTCGAGCAAGAGATGG-3′294 bp, 56 °C
ACTB-R5′-GCAGTGATCTCCTTCTGCATC-3′
RUNX3-TV1-F5′-ATGGCATCGAACAGCATCTTC-3′337 bp, 60 °C
RUNX3-TV1-R5′-CCAATGCCACCACCTTGAA-3′
RUNX3-TV2-F5′-ATGCGTATTCCCGTAGACCC-3′295 bp, 60 °C
RUNX3-TV2-R5′-CCAATGCCACCACCTTGAA-3′

