1. Introduction
Although the PubChem database [
1] has stored millions of chemical compounds, the number of compounds having target protein information are limited. Drug discovery (finding new drug–target interactions, DTIs) requires much more cost and time via biochemical experiments. Hence, some efficient computational methods for predicting potential DTIs are used to cover the shortage of traditional experimental methods. There are three categories of the DTIs prediction approaches: molecular docking, matrix-based, and feature vector-based methods. Cheng et al. [
2] and Rarey et al. [
3] developed molecular docking methods, which were based on the crystal structure of the target binding site (3D structures). Docking simulations quantitatively estimate the maximal affinity achievable by a drug-like molecule, and these calculated values correlate with drug discovery outcomes. However, docking simulations depend on the spatial structure of targets and are usually time-consuming because of the screening technique. In contrast to docking methods, the other two kinds of computational methods (matrix-based and feature vector-based methods) can achieve the large-scale prediction of DTIs.
Compared with molecular docking, matrix-based methods of chemical structure similarity are more popular. Many matrix-based approaches are becoming popular in the area of DTI predicition. The bipartite graph learning (BGL) [
4] model was firstly proposed by Yamanishi et al. They developed a new supervised method to infer unknown DTIs by integrating chemical space and genomic space into a unified space. Bleakley and Yamanishi et al. [
5] raised the bipartite local model (BLM) to solve the DTI prediction problem in chemical and genomic spaces, and applied the bipartite model to transform prediction into a binary classification [
5]. Mei et al. [
6] improved the BLM with neighbor-based interaction-profile inferring (BLM-NII). The NII strategy inferred label information or training data from neighbors when there was no training data readily available from the query compound/protein itself. Laarhoven et al. designed kernel regularized least squares (RLS), in which they defined Gaussian interaction profile (GIP) kernels on the profiles of drugs and targets to predict DTIs [
7]. Xia et al. raised Laplacian regularized least square based on interaction network (NetLapRLS) [
8] to improve the prediction performance of RLS. Zheng et al. built a DTI predictor with collaborative matrix factorization (CMF) [
9], which can incorporate multiple types of similarities from drugs and those from targets at once. Laarhoven et al. [
10] also proposed weighted nearest neighbor with Gaussian interaction profile kernels (WNN-GIP) to predict DTIs. The WNN constructed an interaction score profile for a new drug compound using chemical and interaction information about known compounds in the dataset. Another matrix factorization-based method—kernelized Bayesian matrix factorization with twin kernels (KBMF2K) [
11]—was proposed by Gönen, M. The novelty of KBMF2K came from the joint Bayesian formulation of projecting drug compounds and target proteins into a unified subspace using the similarities and estimating the interaction network in that subspace. Neighborhood regularized logistic matrix factorization (NRLMF) was raised by Liu et al. [
12]. NRLMF focused on modeling the probability that a drug would interact with a target by logistic matrix factorization, where the properties of drugs and targets were represented by drug-specific and target-specific latent vectors, respectively. Nevertheless, the drawback of pairwise kernel method is the high computational complexity on the occasion of a large numbers of samples. In addition, matrix-based methods did not consider the physical and chemical properties of the target protein. These properties reflect some particular relationship between targets and the molecular structure of drugs.
To handle the above problem, other machine learning approaches of feature vector-based method was raised. Cao et al. firstly proposed several works to predict DTIs via drug (molecular fingerprint), target (sequence descriptors), and network information [
13,
14]. They used composition (C), transition (T), and distribution (D) and Molecular ACCess System (MACCS) fingerprint to describe target sequence and drug molecule, respectively. The above features were fed into random forest (RF) to detect DTIs.
In this article, we propose a new DTI predictor based on signal compression technology. The target sequence can be regarded as biomolecule signal of a cell. To further extract effective features from the target sequence, we utilize discrete wavelet transform (DWT) as a spectral analysis tool to compress the signal of the target sequence. According to Heisenberg’s uncertainty principle, the velocity and location of moving quanta cannot be determined at the same time. Similarly, in a time–frequency coordinate system, the frequency and location of a signal cannot be determined at the same time. Wavelet transform can be based on the scale of the transformation and offset in different frequency bands, given different resolution. This is an effective scenario in practice. We also use MACCS fingerprint to describe the drug. Further more, network feature provides the relationship between drug–target pairs. Many models (e.g., BLM, BLM-NII, NetLapRLS, CMF, KBMF2K, NRLMF, and Cao’s work [
14]) were built with network information. Therefore, our feature contains sequence (DWT feature), drug (MACCS feature), and network (net feature). Moreover, we combine the above three types of features with support vector machine (SVM) and feature selection (FS) to develop a predictor of DTIs. We evaluate our method on four benchmark datasets including Enzyme, Ion Channel, guanosine-binding protein coupled receptor (GPCR), and Nuclear receptor. The result shows that our method achieves better prediction performance than outstanding approaches.
2. Results
We evaluated our method (DAWN) on balanced DTI datasets, described by Cao’s work [
14]. We analyzed the performance of features (including MACCS, DWT, and net feature). Then, we compared DAWN with other outstanding methods, including BLM [
5], RLS [
7], BGL [
4], NetLapRLS [
8], and Cao’s work [
14]. In addition, we also tested DAWN on imbalanced DTI datasets, compared with NetLapRLS [
8], BLM-NII [
6], CMF [
9], WNN-GIP [
10], KBMF2K [
11], and NRLMF [
12]. We found that DAWN achieved better values of AUCs.
2.1. Dataset
To evaluate the performance and scalability of our method, we adopted enzyme, ion channels, GPCR, and nuclear receptors used by Yamanishi et al. [
4] as the gold standard datasets. These datasets come from the Kyoto Encyclopedia of Genes and Genomes (KEGG) database [
15]. The information of drug–target interactions comes from KEGG BRITE [
15], BRENDA [
16], Super Target [
17], and DrugBank databases [
18].
Table 1 presents some quantitative descriptors about the golden datasets, including the number of drugs (
n), number of targets (
m), number of interactions, and ratio of
n to
m.
2.1.1. Balanced Dataset
In Cao’s study [
14], all real drug–target interaction pairs were used as the positive samples. For negative examples, they selected random, unknown interacting pairs from these drug and protein molecules. DAWN was tested on Cao’s four balanced benchmark datasets (including Enzyme, Ion channels, GPCRs, and Nuclear receptors).
2.1.2. Imbalanced Dataset
The gold standard datasets only contain positive examples (interaction pairs). Hence, non-interaction drug–target pairs are considered as negative examples. Because the number of non-interaction pairs is larger than interaction pairs, the ratio between majority and minority examples is much greater than 1.
2.2. Evaluation Measurements
Three parameters were adopted as criteria: overall prediction accuracy (ACC), sensitivity (SN), and specificity (Spec).
represents the number of positive samples predicted correctly. Similarly, we have , and , which represent the number of negative samples predicted correctly, the number of negative samples predicted as positive, and the positive samples predicted as negative, respectively.
In signal detection theory, a receiver operating characteristic (ROC), or simply ROC curve, is a graphical plot illustrating the performance of a binary classifier system as its varied discrimination threshold. A ROC curve can be used to illustrate the relation between sensitivity and specificity.
Area under the precision–recall curve (PRC) (AUPR) is an average of the precision weighted by a given threshold probability. We employed both ROC and the area under the precision–recall curve (PRC), because the representation of PRC is more effective than ROC on highly imbalanced or skewed datasets. Area under the ROC curve (AUC) and AUPR can quantitatively describe sensitivity against specificity and precision against recall, respectively.
2.3. Experimental Results on Balanced Datasets
2.3.1. Performance Analysis of Feature
In order to analyze the performance of MACCS, DWT, and net features, we tested these features on four balanced datasets (each set contains 10 balanced subsets) through five-fold cross-validation. Results of DWT + MACCS, DWT + MACCS (with FS), DWT + NET + MACCS, and DWT + NET + MACCS (with FS) are shown in
Table 2. Because the datasets are balanced, the evaluation of ACC or AUC can measure overall performance. DWT + NET + MACCS (with FS) had the best performance of ACC on Enzyme (
), IC (
), GPCR (
), and Nuclear receptor (
), respectively. The performance (AUC) of DWT + NET + MACCS (Enzyme:
, IC:
, GPCR:
, Nuclear receptor:
) was better than DWT + MACCS (Enzyme:
, IC:
, GPCR:
, Nuclear receptor:
). The feature DWT + NET + MACCS indeed improved the prediction performance by adding network information. In addition, the performance (AUC) of DWT + NET + MACCS (with FS) (Enzyme:
, IC:
, GPCR:
, Nuclear receptor:
) was better than DWT + NET + MACCS (without FS) (Enzyme:
, IC:
, GPCR:
, Nuclear receptor:
).
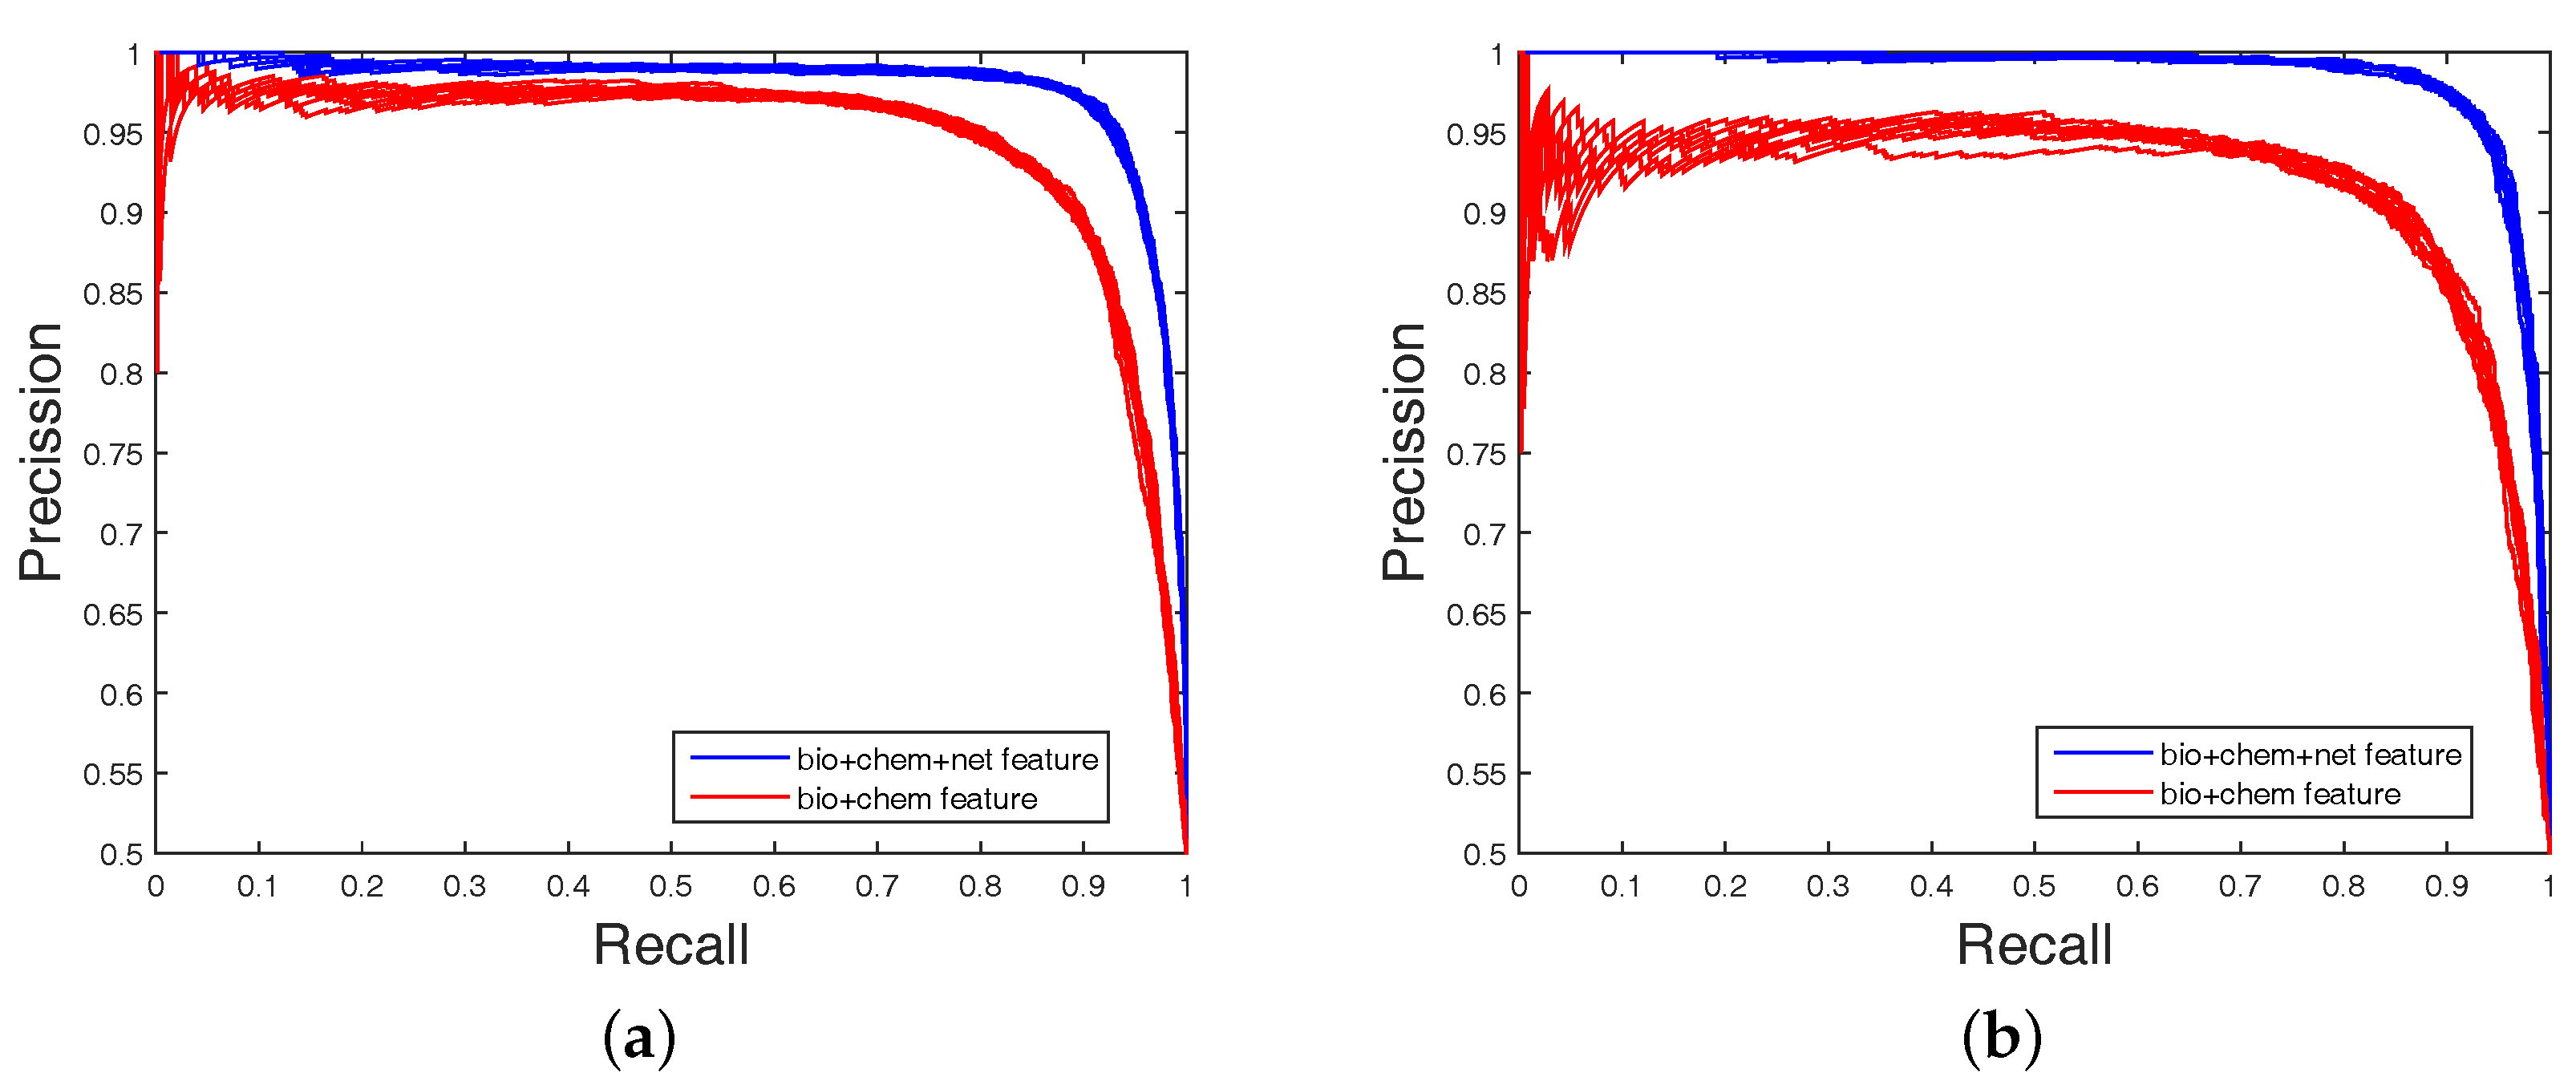
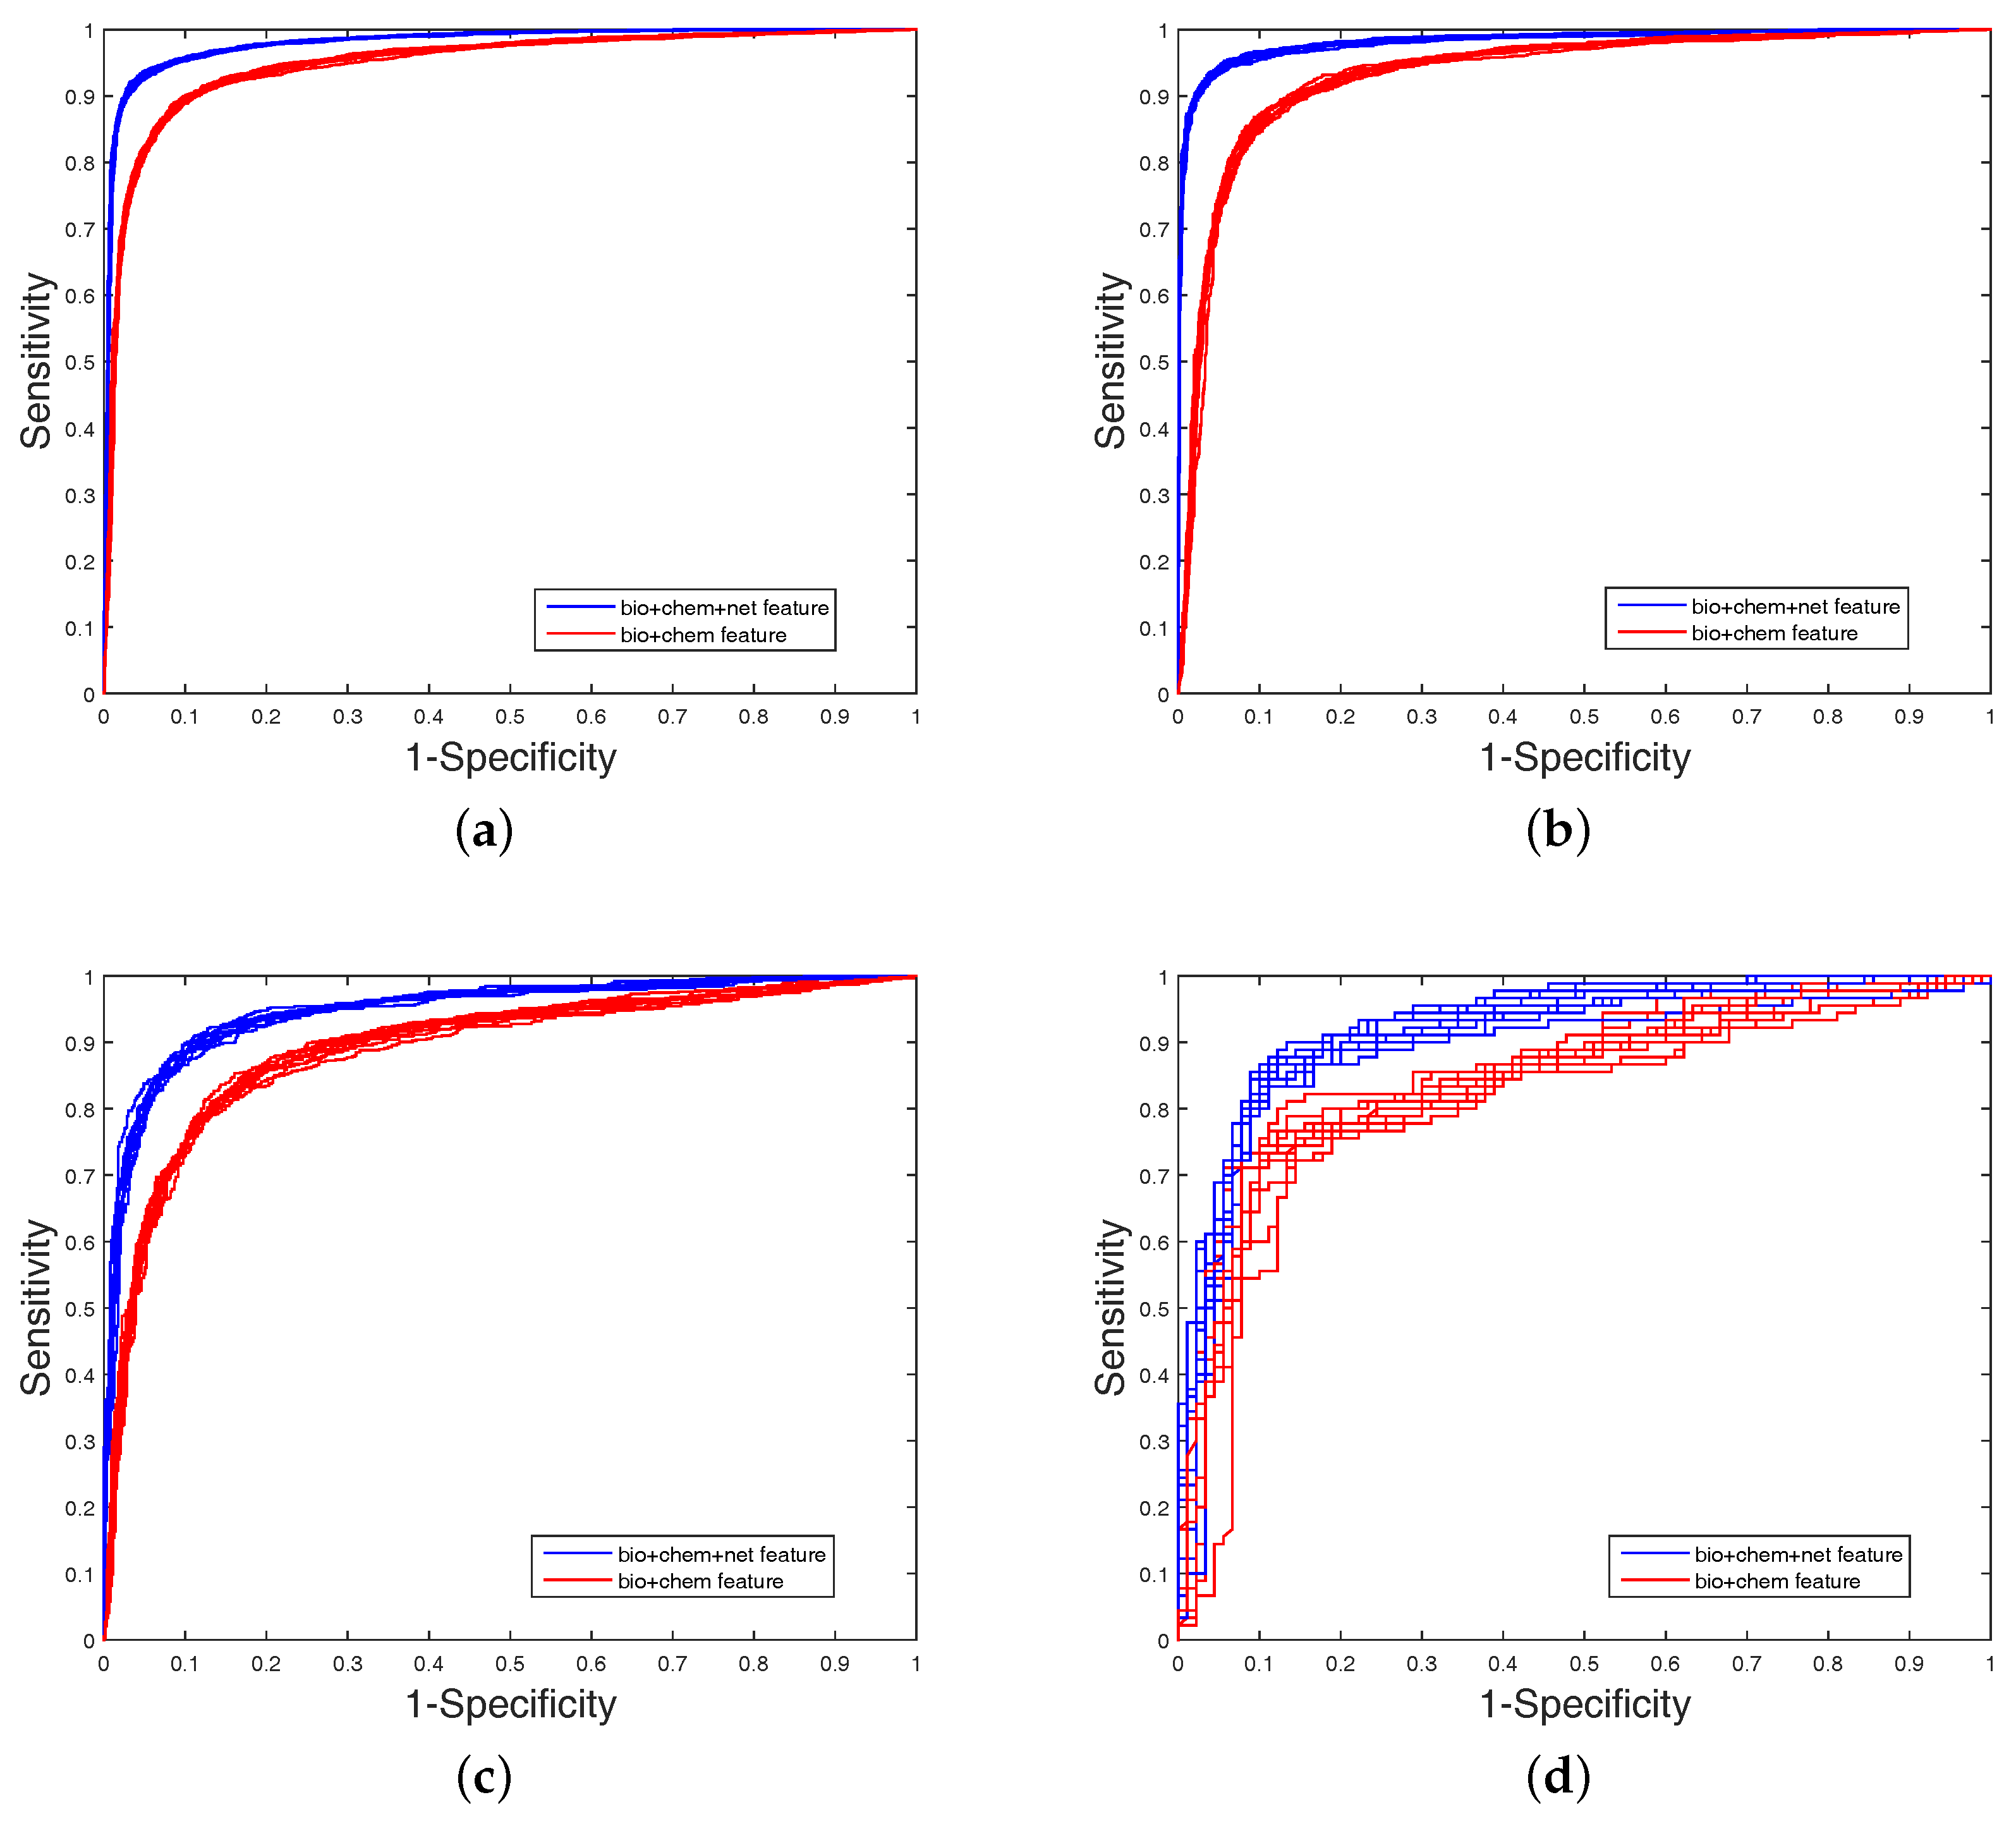
It is clear that FS plays a key role in elevating the prediction of our method. The FS can enhance generalization by reducing the overfitting. Obviously, the performance of DWT + NET + MACCS (with FS) can be seen from
Figure 1 and
Figure 2. Network topology can be a useful supplement to improve prediction effect.
2.3.2. Comparing with Existing Methods
On the balanced datasets [
14], we compare DAWN with other common methods by five-fold cross validation. These methods contain BLM [
5], RLS [
7], BGL [
4], NetLapRLS [
8] and Cao’s work [
14]. The detailed results are listed in
Table 3. DAWN achieved the best values of AUCs on Enzyme (
) and Nuclear receptor (
), respectively. Although the AUC value of DAWN on Ion channel and GPCR datasets were not higher than Cao’s work [
14] and BLM, we still have a competitive prediction rate. Recapitulating about the aforementioned description, DAWN has a competitive ability among these works.
2.4. Experimental Results on Imbalanced Datasets
In order to highlight the advantage of our method, we also tested DAWN on the imbalanced datasets of DTIs by 10-fold cross validation. DAWN was compared with NetLapRLS [
8], BLM-NII [
6], CMF [
9], WNN-GIP [
10], KBMF2K [
11], and NRLMF [
12]. The detailed results are listed in
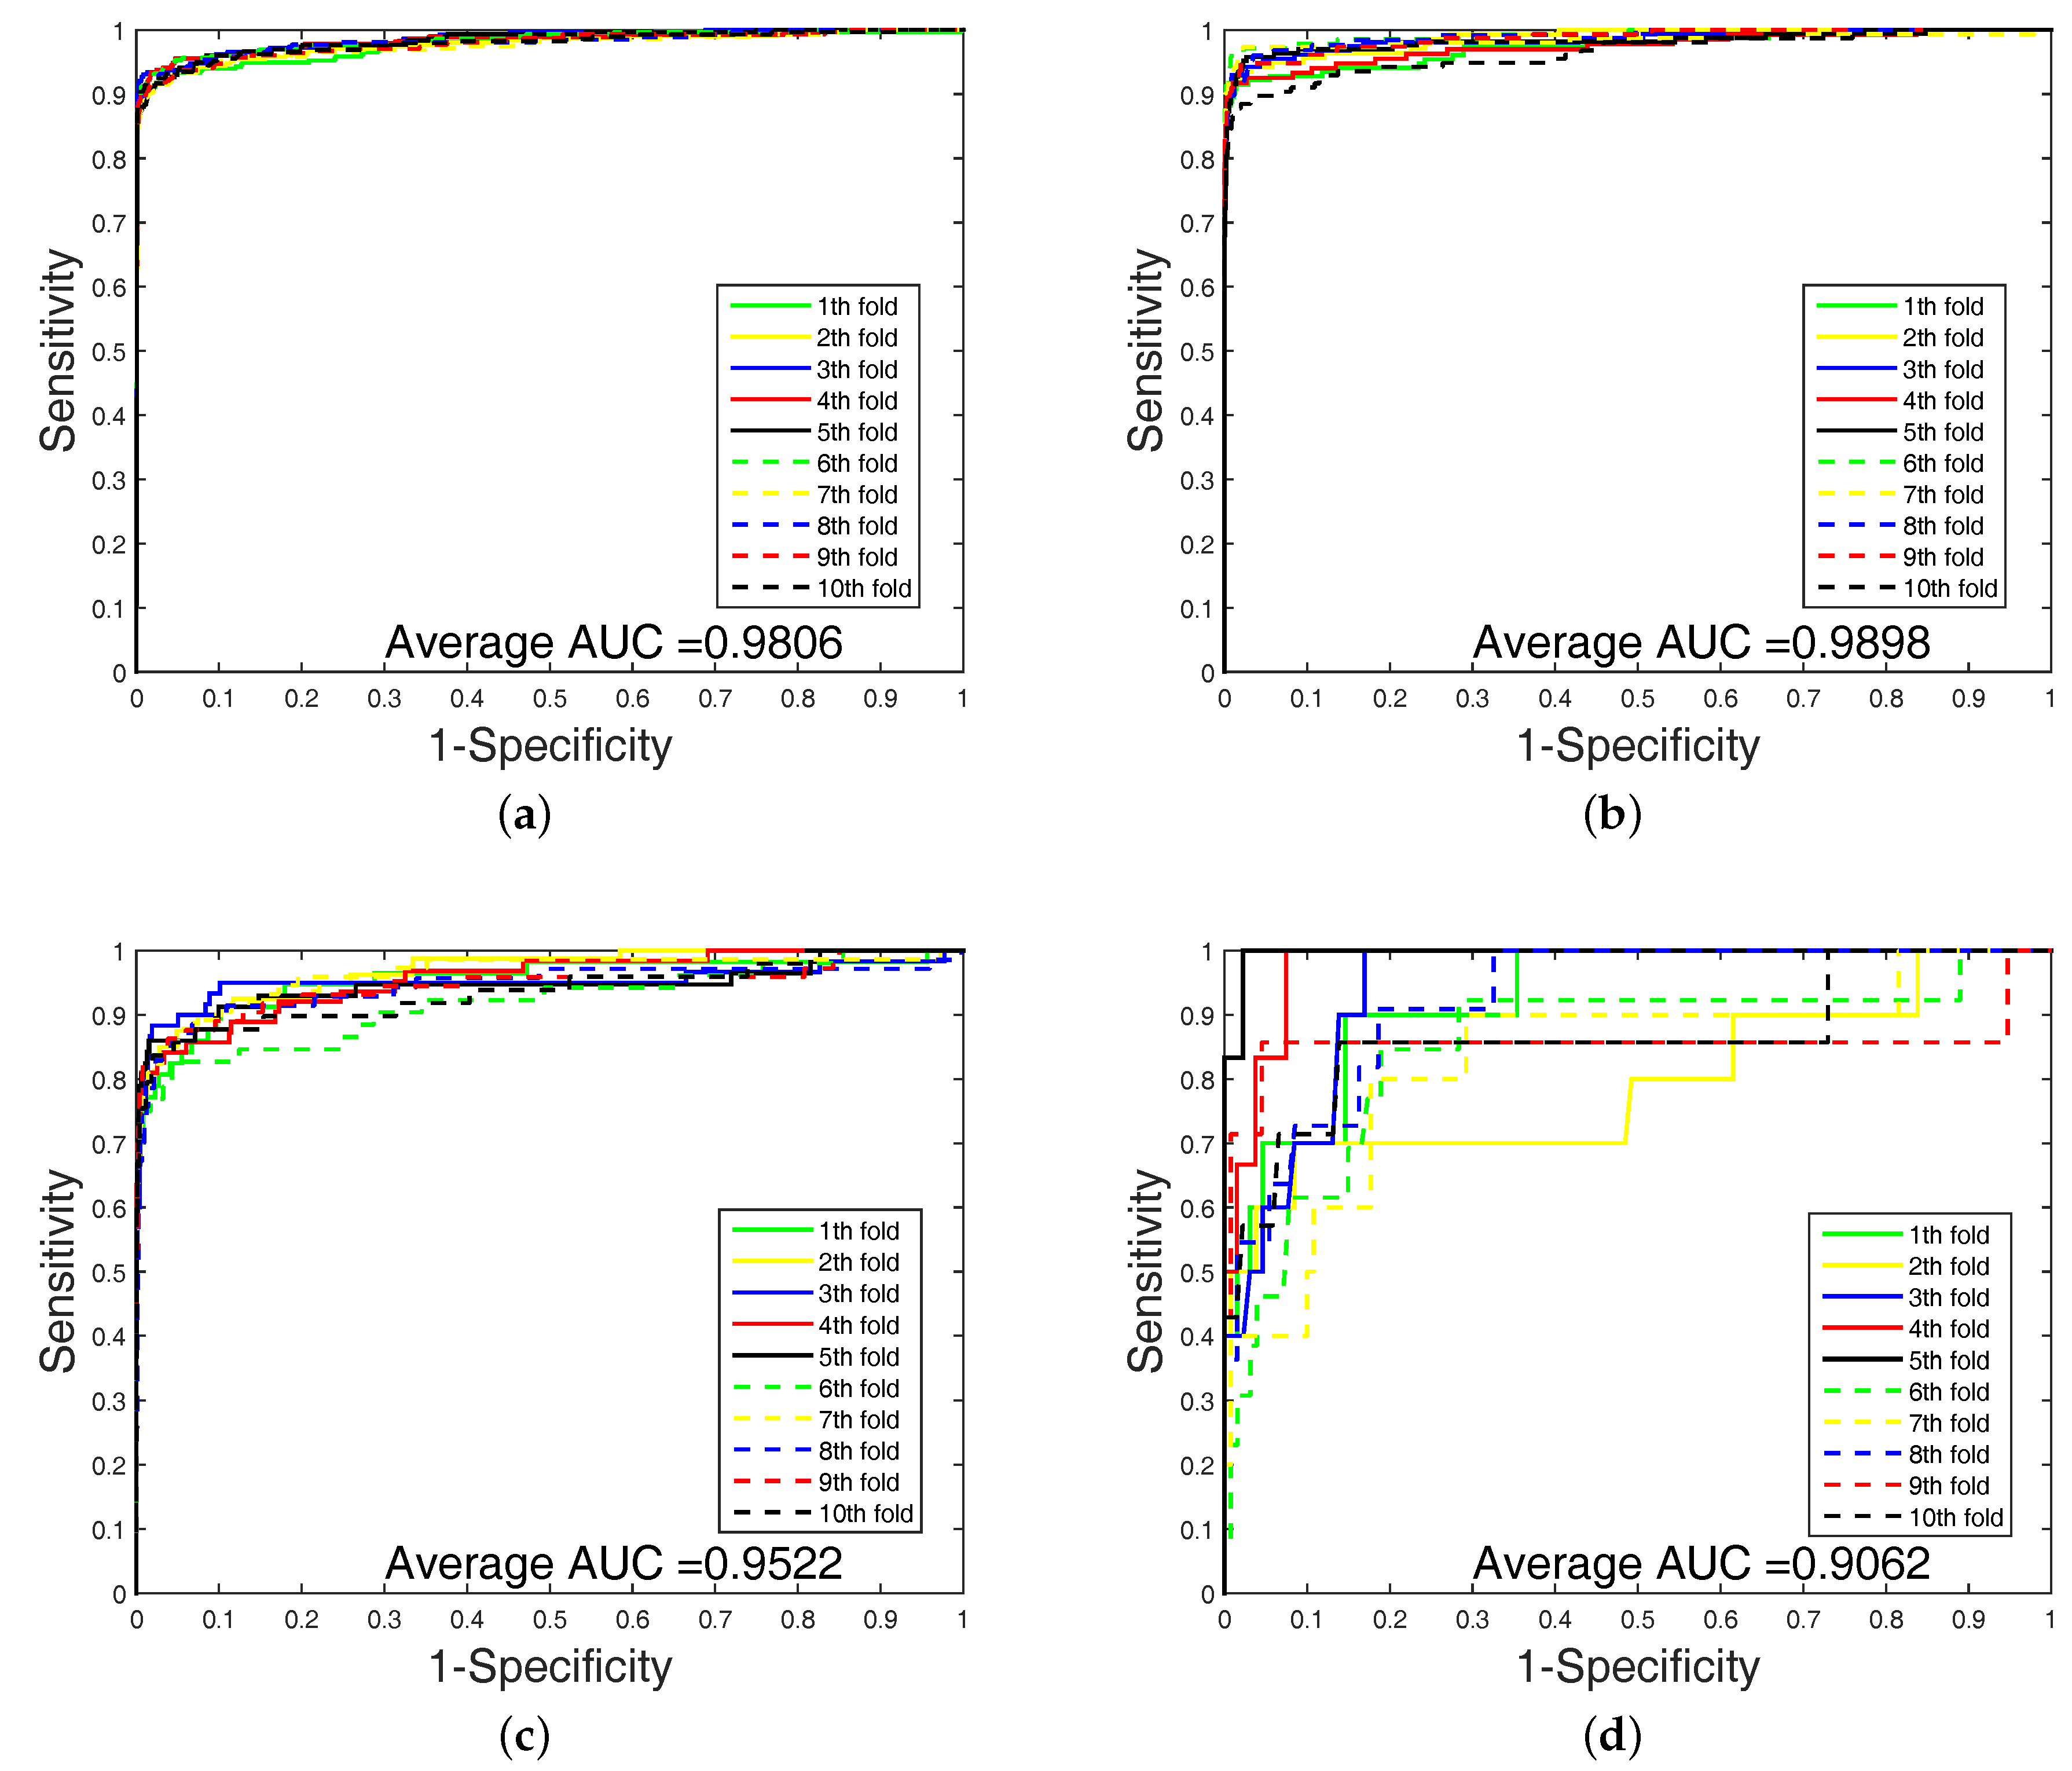
Table 4. Because the datasets are imbalanced, the evaluation of AUC and AUPR were both used to measure overall performance. DAWN achieved average AUCs of
,
,
, and
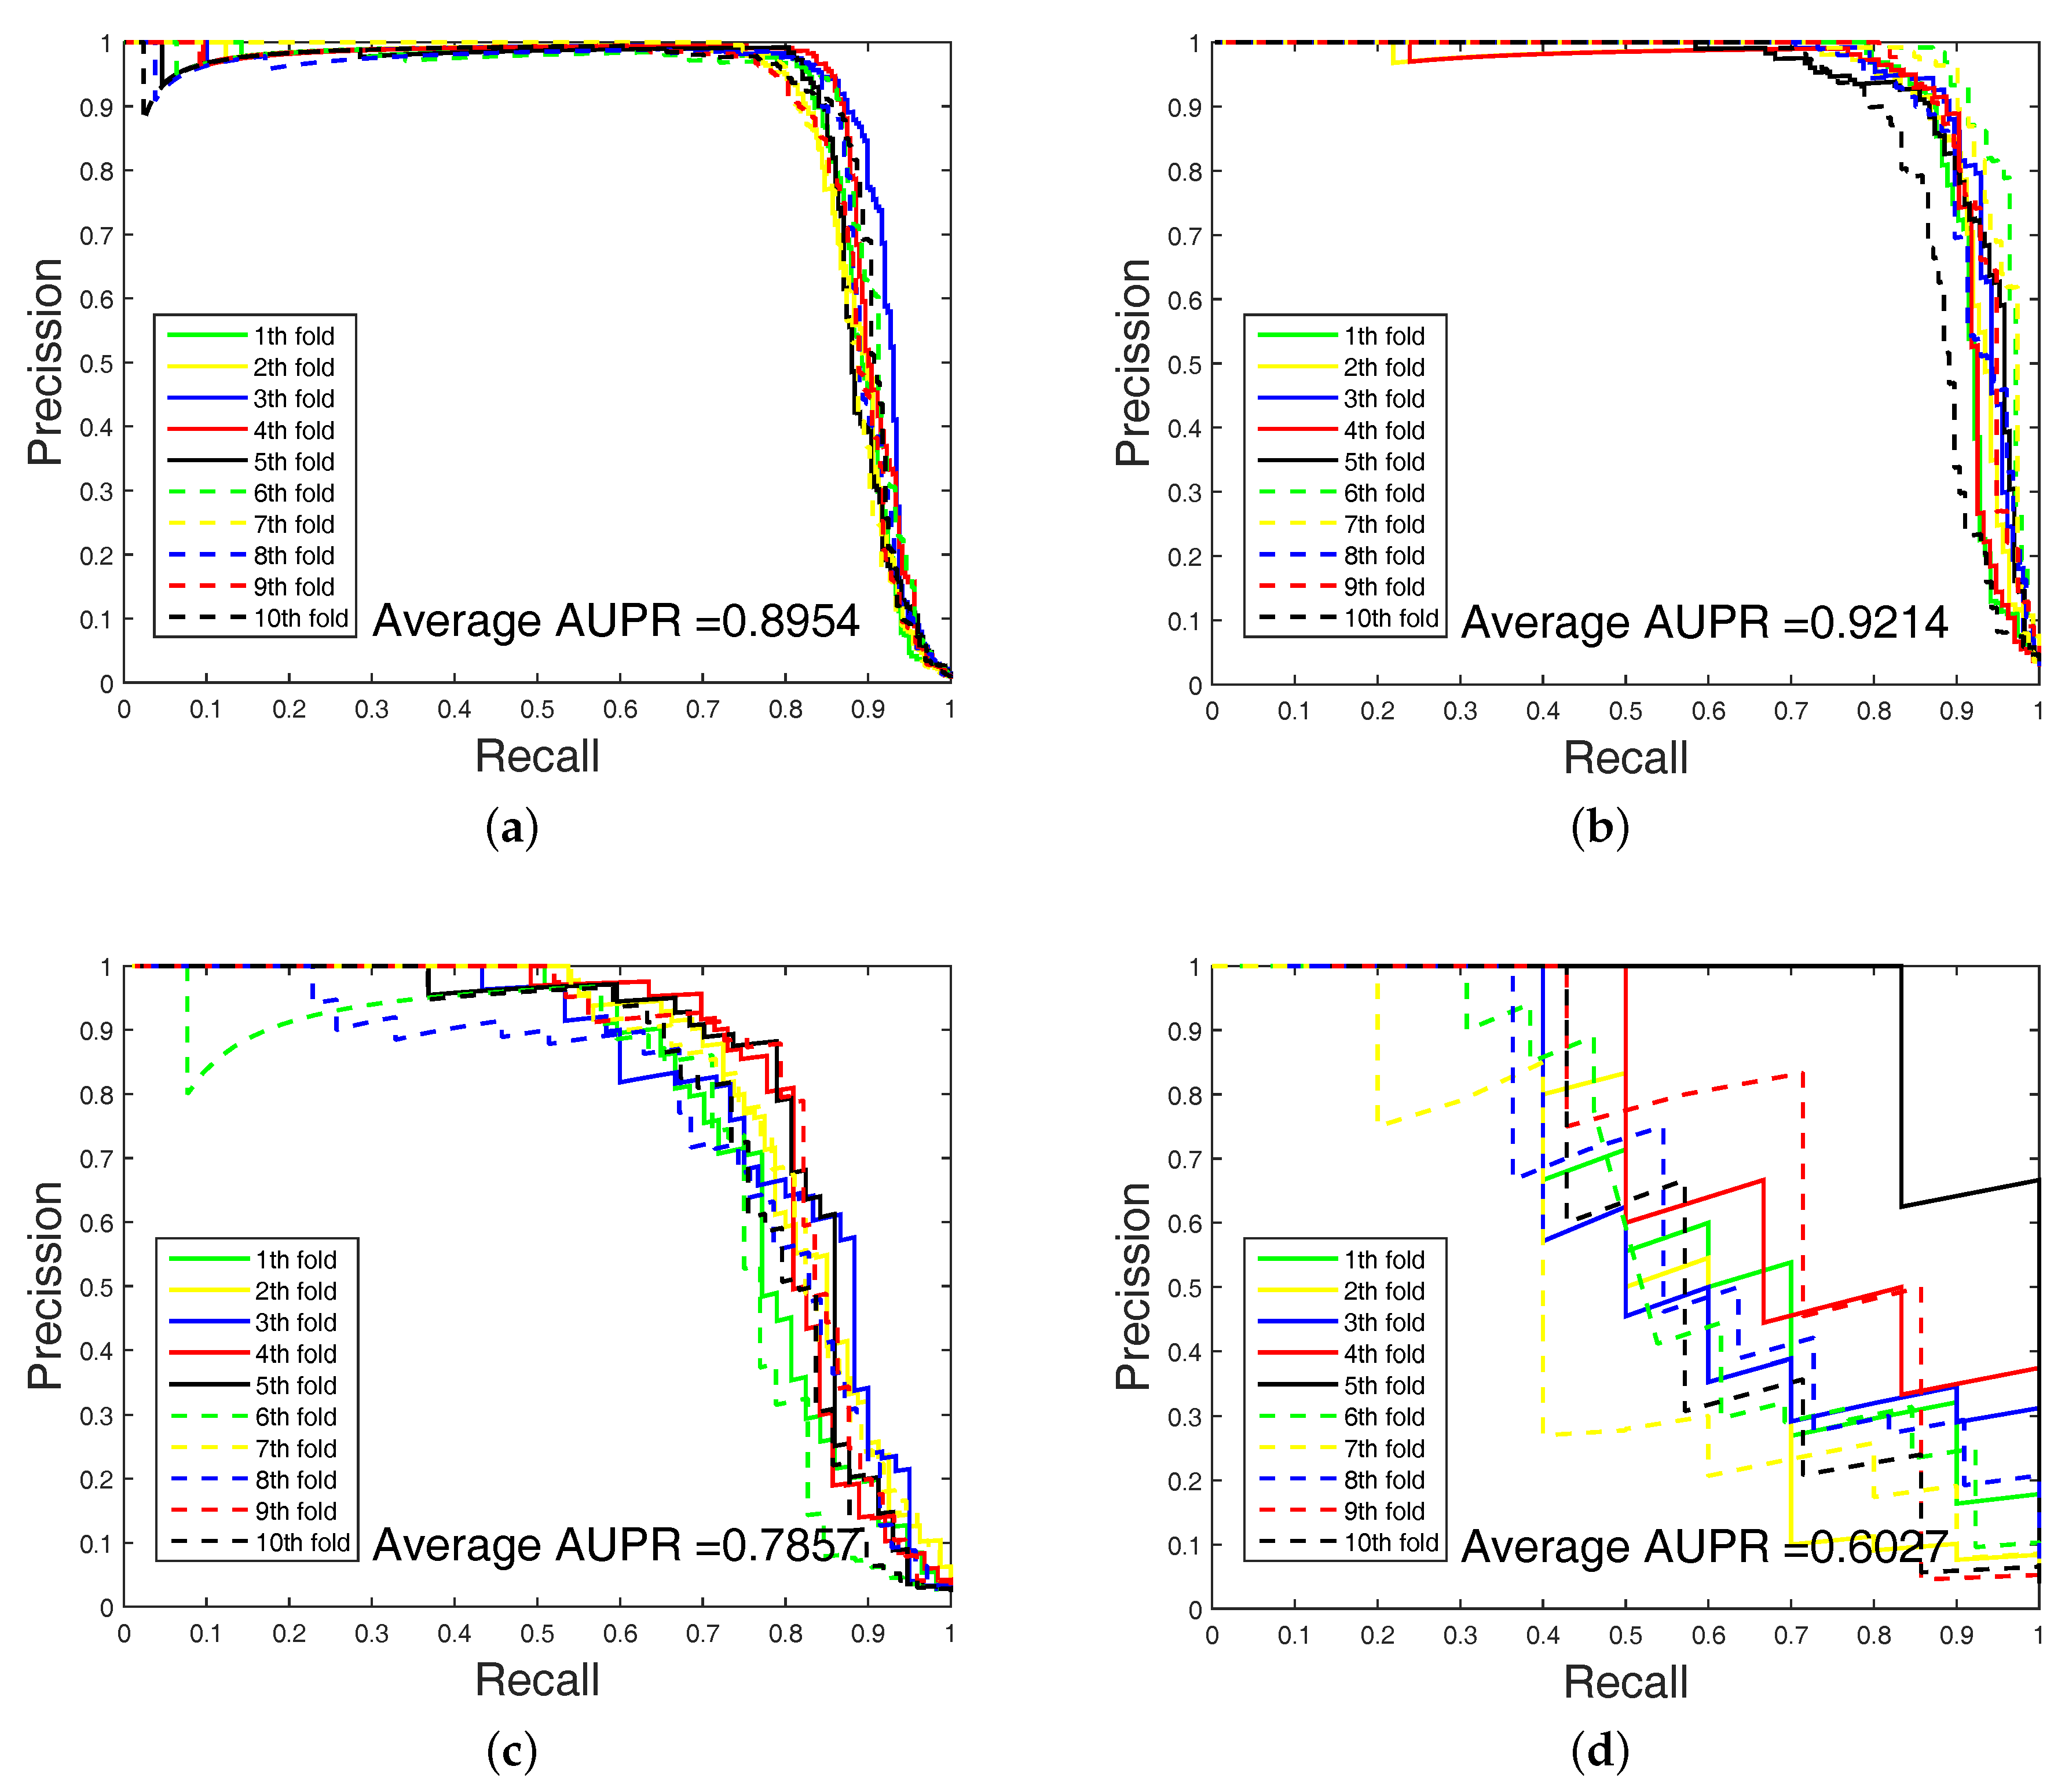
, and the AUPR values of DAWN were
,
,
, and
on Enzyme, Ion channel, GPCR, and Nuclear receptor, respectively. The AUC value of DAWN on the Enzyme dataset was
and AUPR was
, and only the NRLMF (AUC:
, AUPR:
) method was comparable. On Ion channel and GPCR datasets, we also had best or second-best results. For AUPR value on Nuclear receptor, NRLMF was higher than DAWN. The Nuclear receptor dataset is smaller than the other three datasets. The size of the dataset might be a reason for DAWN’s performance. Therefore, the DAWN method that adopted the mean of DWT was not as effective as larger datasets. However, among methods in
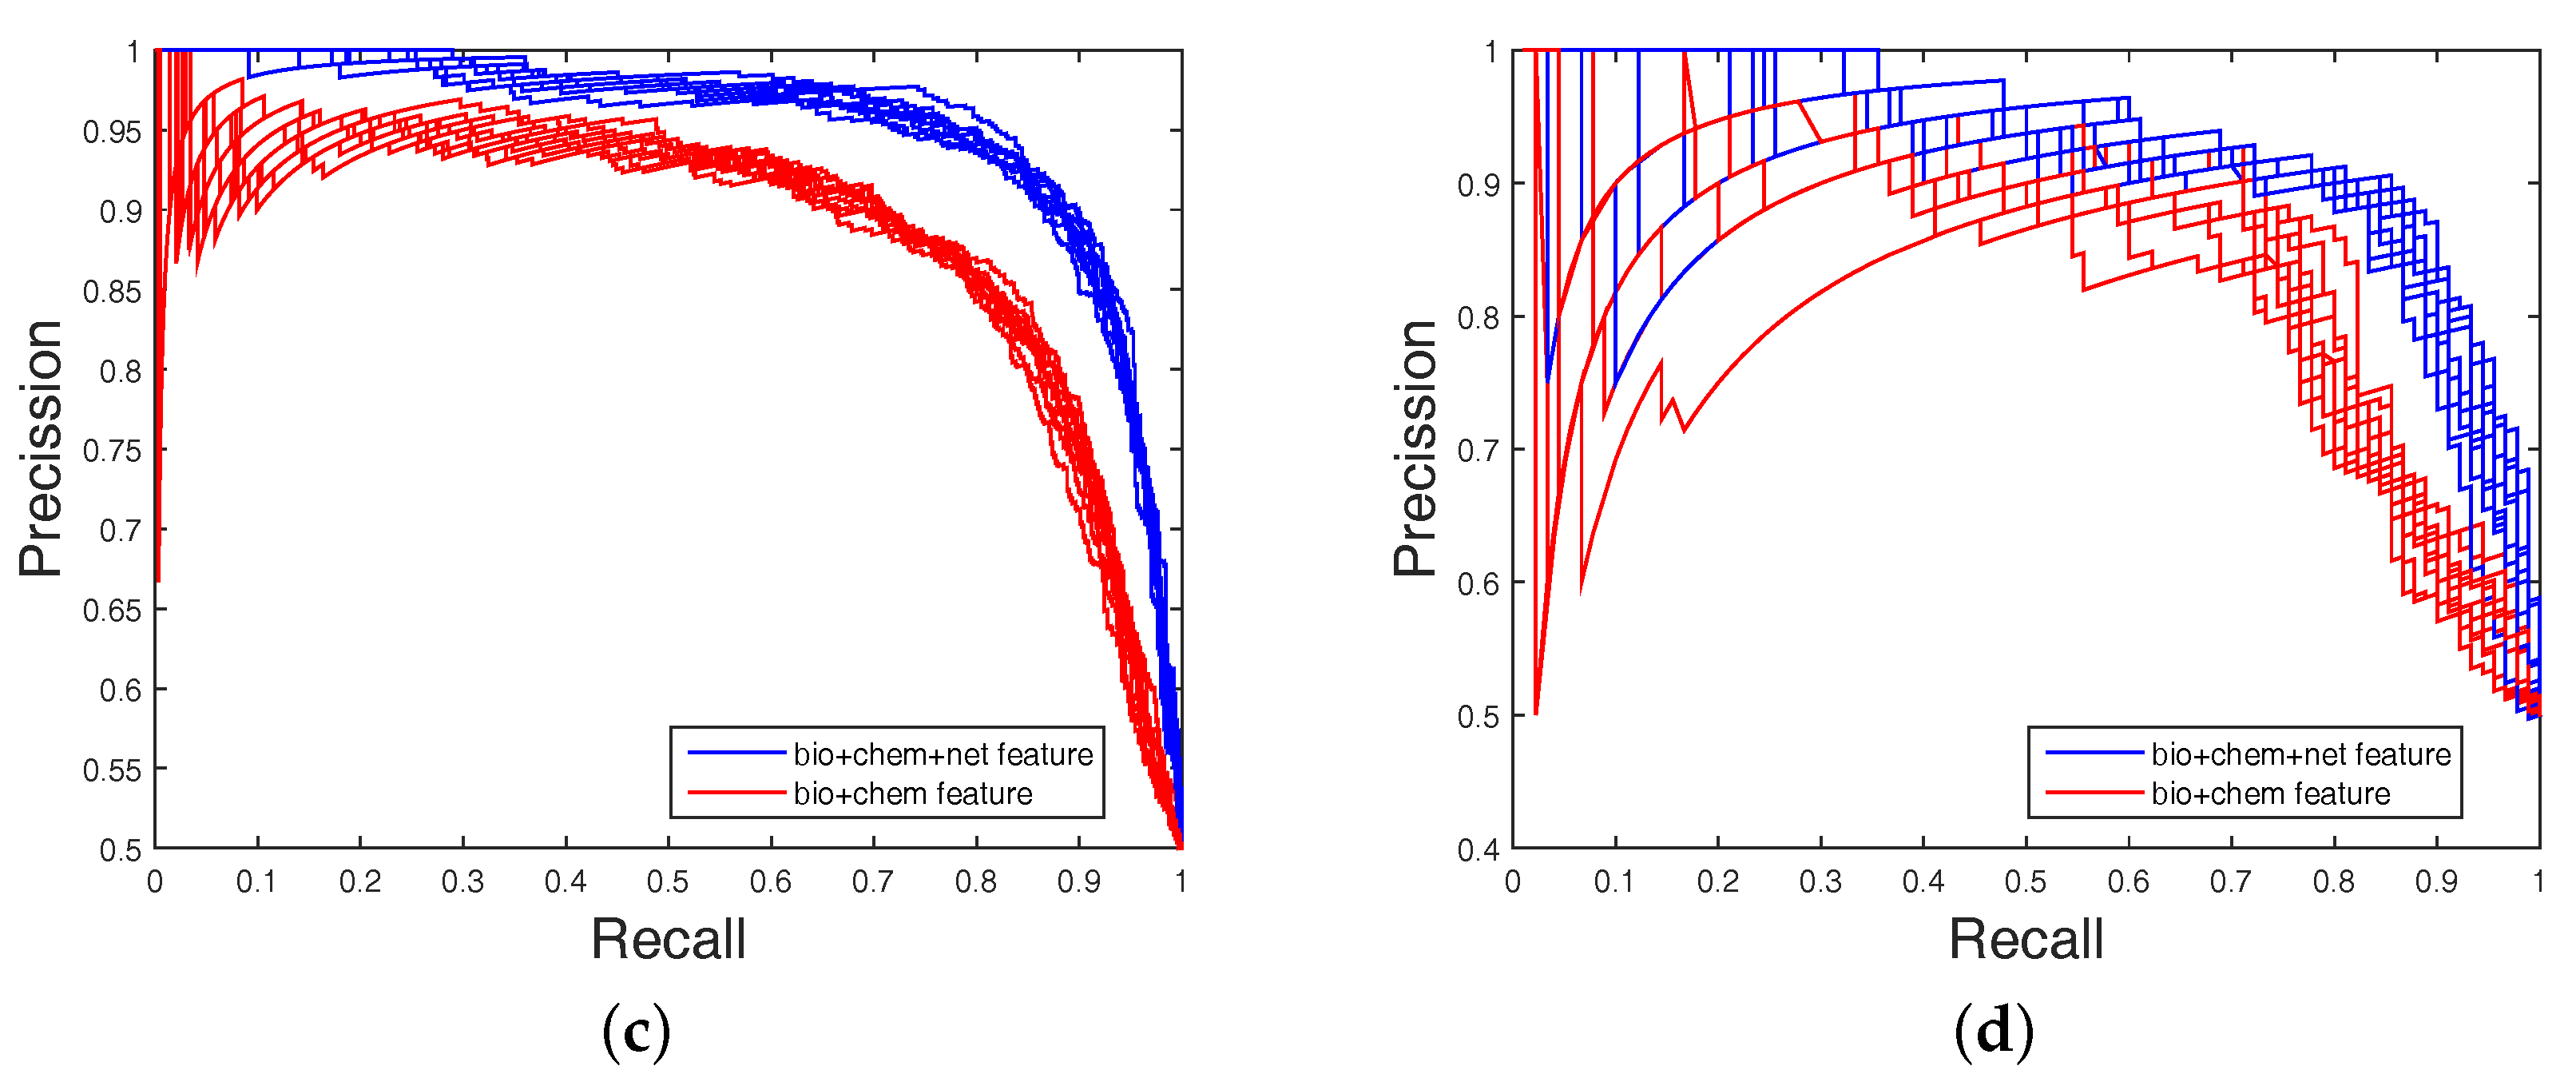
Table 4, none could give markedly higher prediction performance on all four datasets in both AUC and AUPR. Therefore, it is fair to claim that our strategy has comparable performance. Further,
Figure 3 and
Figure 4 show the curves of AUC and AUPR on imbalanced datasets through 10-fold cross validation. Related datasets, codes, and figures of our algorithm are available at
https://github.com/6gbluewind/DTIDWT.
2.5. Predicting New DTIs
In this experiment, the balanced DTIs were set as training data sets. We ranked the remaining non-interacting pairs and selected the top five non-interacting pairs as predicted interactions. We utilized four well-known biological databases (including ChEMBL (C) [
19], DrugBank (D) [
18], KEGG (K) [
15] and Matador (M) [
20]) as references to verify whether or not the predicted new DTIs are true. The predicted novel interactions by DAWN can be ranked based on the interaction probabilities, which are shown in
Table 5. The potential DTIs may be present in one or several databases. For example, the secondly ranked DTI of GPCR (D00563: hsa3269) belongs to DrugBank and Matador databases. In addition, the DTI databases (the above four databases) are still being updated, and the accuracy of identifying new DTIs by DAWN may be increased.
3. Discussion
In this paper, we proposed a new DTIs predictor based on signal compression technology. We encoded the drug molecule by a substructure fingerprint with a dictionary of substructure patterns. Moreover, we applied the DWT to extract features from target sequences. At last, we concatenated the target, drug, and network features to construct predictive model of DTIs.
To evaluate the performance of our method, the DTIs model was compared to other state-of-the-art DTIs prediction methods on four benchmark datasets. DAWN achieved average AUCs of , , , and , and the AUPR values of DAWN were , , , and on Enzyme, Ion channel, GPCR, and Nuclear receptor, respectively. Although our result using feature selection could be a kind of ameliorated prediction, the imbalanced problem of DTIs prediction is not solved very well. SVM is poor on imbalanced data. The AUPR value of DAWN is low on the Nuclear receptor dataset.
4. Materials and Methods
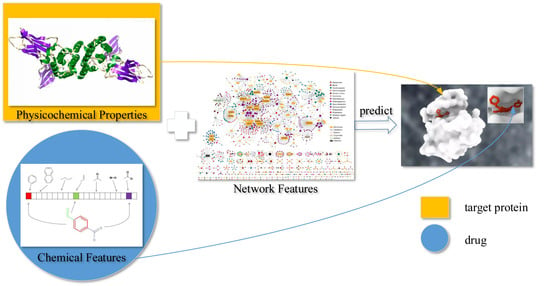
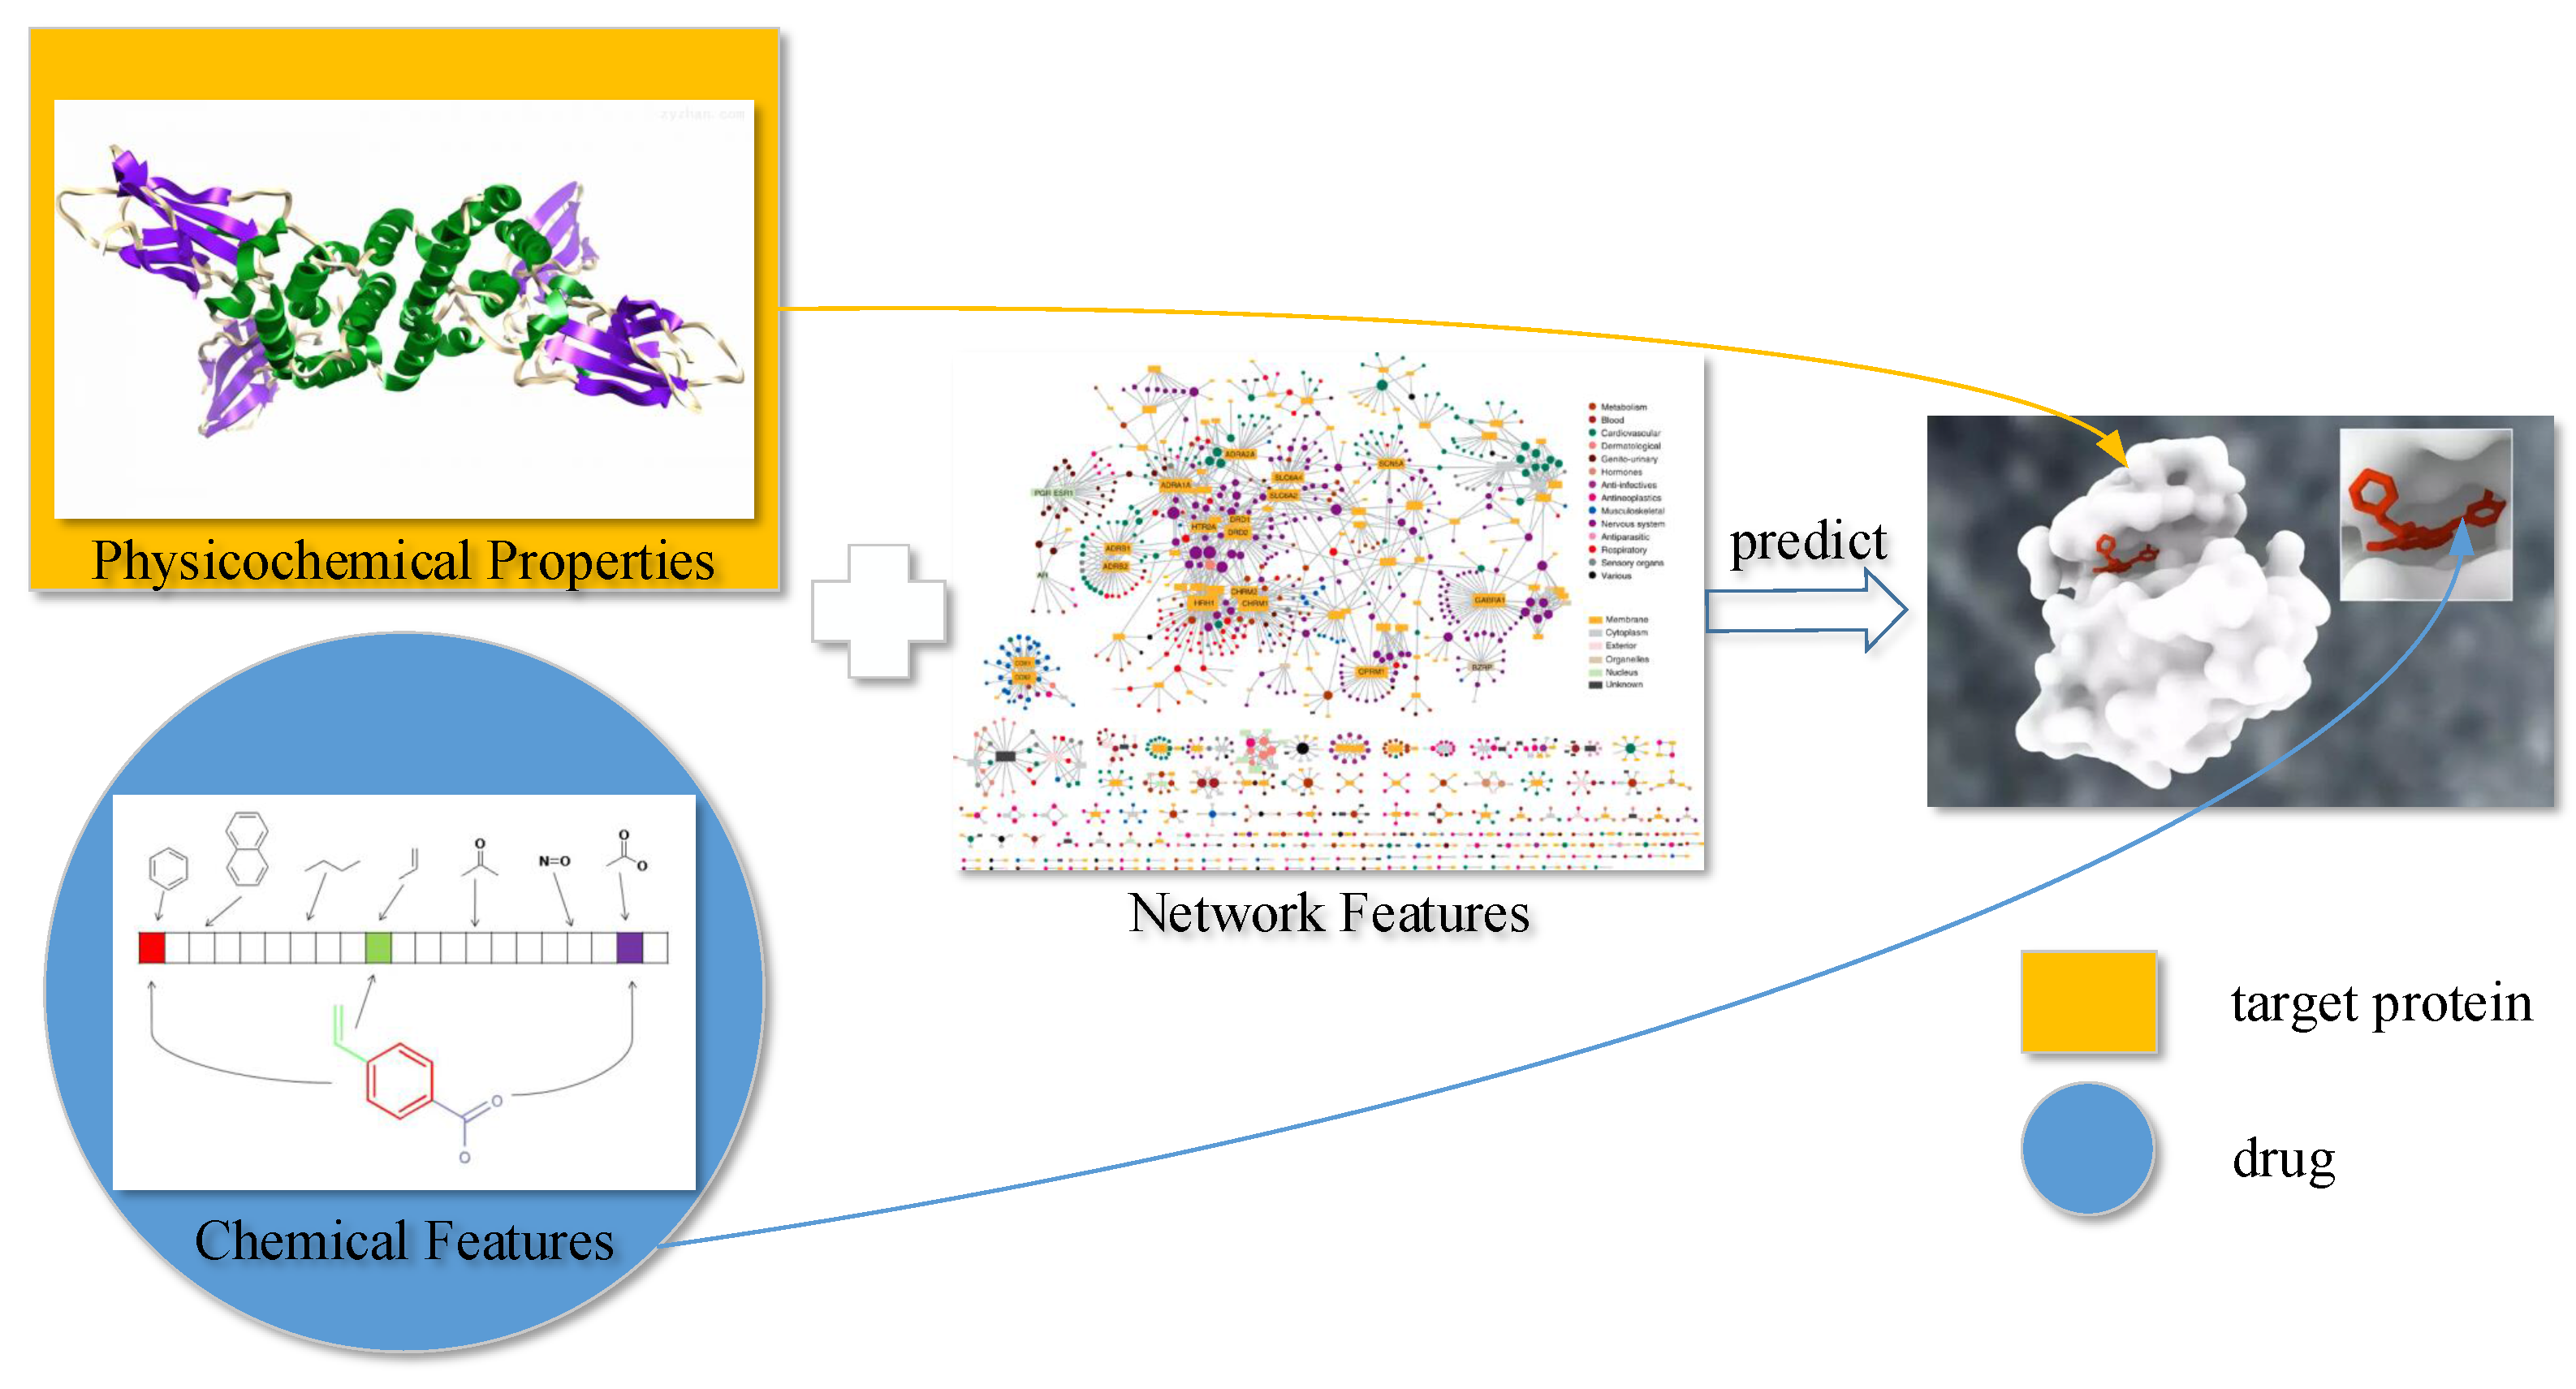
To predict DTIs by machine learning methods, one challenge is to extract effective features from the target protein, drug, and the relationship between drug–target pairs. Considering that DTIs depend on the molecular properties of the drug and the physicochemical properties of target, we use MACCS fingerprints (Open Babel 2.4.0 Released, OpenEye Scientific Software, Inc., Santa Fe, New Mexico, United States) to represent the drug, and extract biological features from the target via DWT. In addition, the net feature describes the topology information of the DTIs network. We utilize the above features to train the SVM predictor (LIBSVM Version 3.22, National Taiwan University, Taiwan, China) for detecting DTIs.
4.1. Molecular Substructure Fingerprint of Drug
To encode the chemical structure of the drug, we utilize MACCS fingerprints with 166 common chemical substructures. These substructures are defined in the Molecular Design Limited (MDL) system, which can be found from OpenBabel (
http://openbabel.org). The MACCS feature is encoded by a binary bits vector, which shows the presence (1) or absence (0) of some specific substructures in a molecule. Please refer to the relevant literature [
13,
14] for details.
4.2. Biological Feature of Target
4.2.1. Six Physicochemical Properties of Amino Acids
The target sequence can be denoted by
, where
.
is the
i-th residue of sequence
, and
L is the length of sequence
. In addition, for ease of calculation about feature representation, we select six kinds of physicochemical properties for 20 amino acid types as original target features [
21,
22,
23,
24]. More specifically, they are hydrophobicity (H), volumes of side chains of amino acids (VSC), polarity (P1), polarizability (P2), solvent-accessible surface area (SASA) and net charge index of side chains (NCISC), respectively. Values of all kinds of amino acid are shown in
Table 6.
For the sake of facilitating the dealing with the datasets, the amino acid residues are translated and normalized according to Equation (
4).
where
and
indicate the value of the
j-th descriptor of amino acid type
i and the mean of 20 amino acid types of descriptor value
j, respectively, standard deviation (SD) corresponding to
.
Each target sequence can be translated into six vectors with each amino acid represented by normalized values of six descriptors. Thus, the can be represented as physicochemical matrix .
4.2.2. Discrete Wavelet Transform
Discrete wavelet transform (DWT) with its inversion formula was established by physical intuition and practical experience of signal processing [
25].
If a signal or a function can be represented as Equation (
5), then the signal or function has a linear decomposition. If the formula of expansion is unique, then the set of expansion can be said as a group of basis. If this group of basis is orthogonal or represented as Equation (
6), then the coefficient can be computed by inner product as Equation (
7).
where
ℓ and
k are the finite or infinite integer indexes,
and
are the real coefficients of the expansion, and
and
are the set of real functions.
For wavelet expansion, we can construct a system with two parameters, then the formula can be transferred as Equation (
8):
where
j and
k are integer index, and
is wavelet function, which generally forms a group of orthogonal basis.
The expansion coefficient set
is known as the discrete wavelet transform (DWT) of
. Nanni et al. proposed an efficient algorithm to perform DWT by assuming that the discrete signal
is
.
where
h and
g refer to high-pass filter and low-pass filter,
L is the length of discrete signal,
is the approximate coefficient (low-frequency components) of the signal,
is the decomposition level of DWT,
is the physicochemical index, and
is the detailed coefficient (high-frequency components).
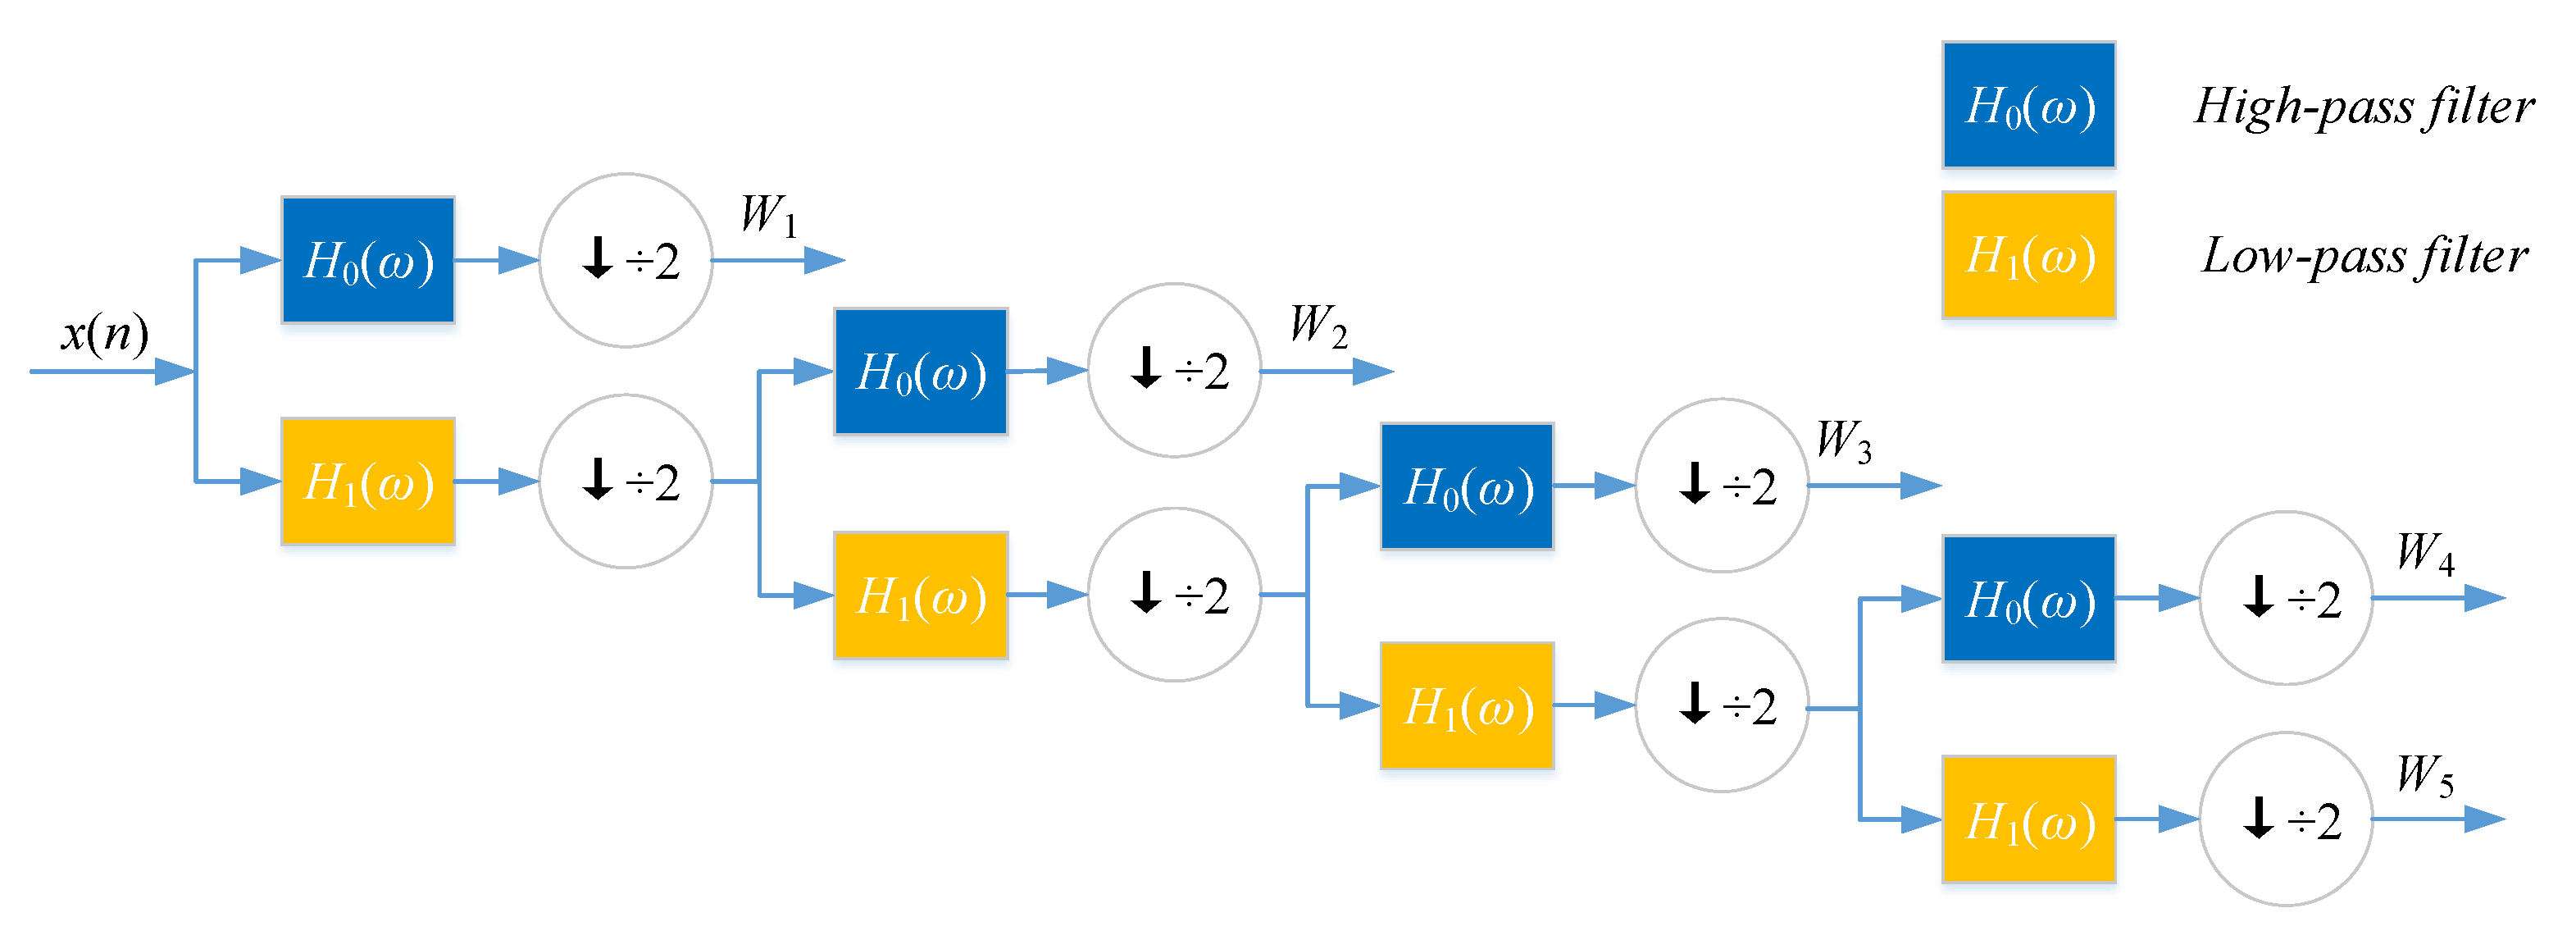
DWT can decompose discrete sequences into high- and low-frequency coefficients. Nanni et al. [
26] substituted each amino acid of the protein sequence with a physicochemical property. Then, the protein sequence was encoded as a numerical sequence. DWT compresses discrete sequence and removes noise from the origin sequence. Different decomposition scales with discrete wavelet have different results for representing the sequence of the target protein. They used 4-level DWT and calculated the maximum, minimum, mean, and standard deviation values of different scales (four levels of both low- and high-frequency coefficients). In addition, high-frequency components are more noisy while low-frequency components are more critical. Therefore, they extracted the beginning of the first five Discrete Cosine Transform (DCT) coefficients from the approximation coefficients. We utilize Nanni’s method to describe the sequence of the target protein. The schematic diagram of a 4-level DWT is shown in
Figure 5.
4.3. Drug–Target Associations from Network
State-of-the-art works such as BLM [
5], BLM-NII [
6], NetLapRLS [
8], CMF [
9], KBMF2K [
11], NRLMF [
12], and Cao’s work [
14] used DTI network topology information to improve the prediction performance. Therefore, we also consider utilizing net feature to build a DTI predictor.
The DTI network can be conveniently regarded as a bipartite graph. In the network, each drug is associated with targets, and each target is associated with drugs. Excluding target itself, we make a binary vector of all other known targets of in the bipartite network, as well as a separate list of targets not known to be targeted by . Known and unknown targets are labeled by 1 and 0, respectively. For drug , we get -dimensional binary vector. Similarly, we also get -dimensional binary vector of target . Thus, we can get a -dimensional vector for describing net feature.
4.4. Feature Selection and Training SVM Model
Not all features are useful for DTIs prediction. Therefore, we apply support vector machine recursive feature elimination and correlation bias reduction (SVM-RFE+CBR) [
27,
28] to select the important features of DTIs. The SVM-RFE+CBR can estimate the score of importance for each dimensional feature. We rank these features (including MACCS feature, DWT feature, and net feature) by the scores in descending order. Then, we select an optimal feature subset in top
k ranked manner to predict DTIs.
Support vector machine (SVM) was originally developed by Vapnik [
29] and coworkers, and has shown a promising capability to solve a number of chemical or biological classification problems. SVM and other machine learning algorithms (e.g., random forest, RF, k-nearest neighbor, kNN, etc.) are widely used in computational biology [
30,
31,
32,
33]. SVM performs classification tasks by constructing a hyperplane in a multidimensional space to differentiate two classes with a maximum margin. The input data of SVM is defined as {
},
, feature vector
and labels
.
The classification decision function implemented by SVM is shown as Equation (
10).
where the coefficient
is obtained by solving a convex quadratic programming problem, and
is called a kernel function.
Here, we focus on choosing a radial basis function (RBF) kernel [
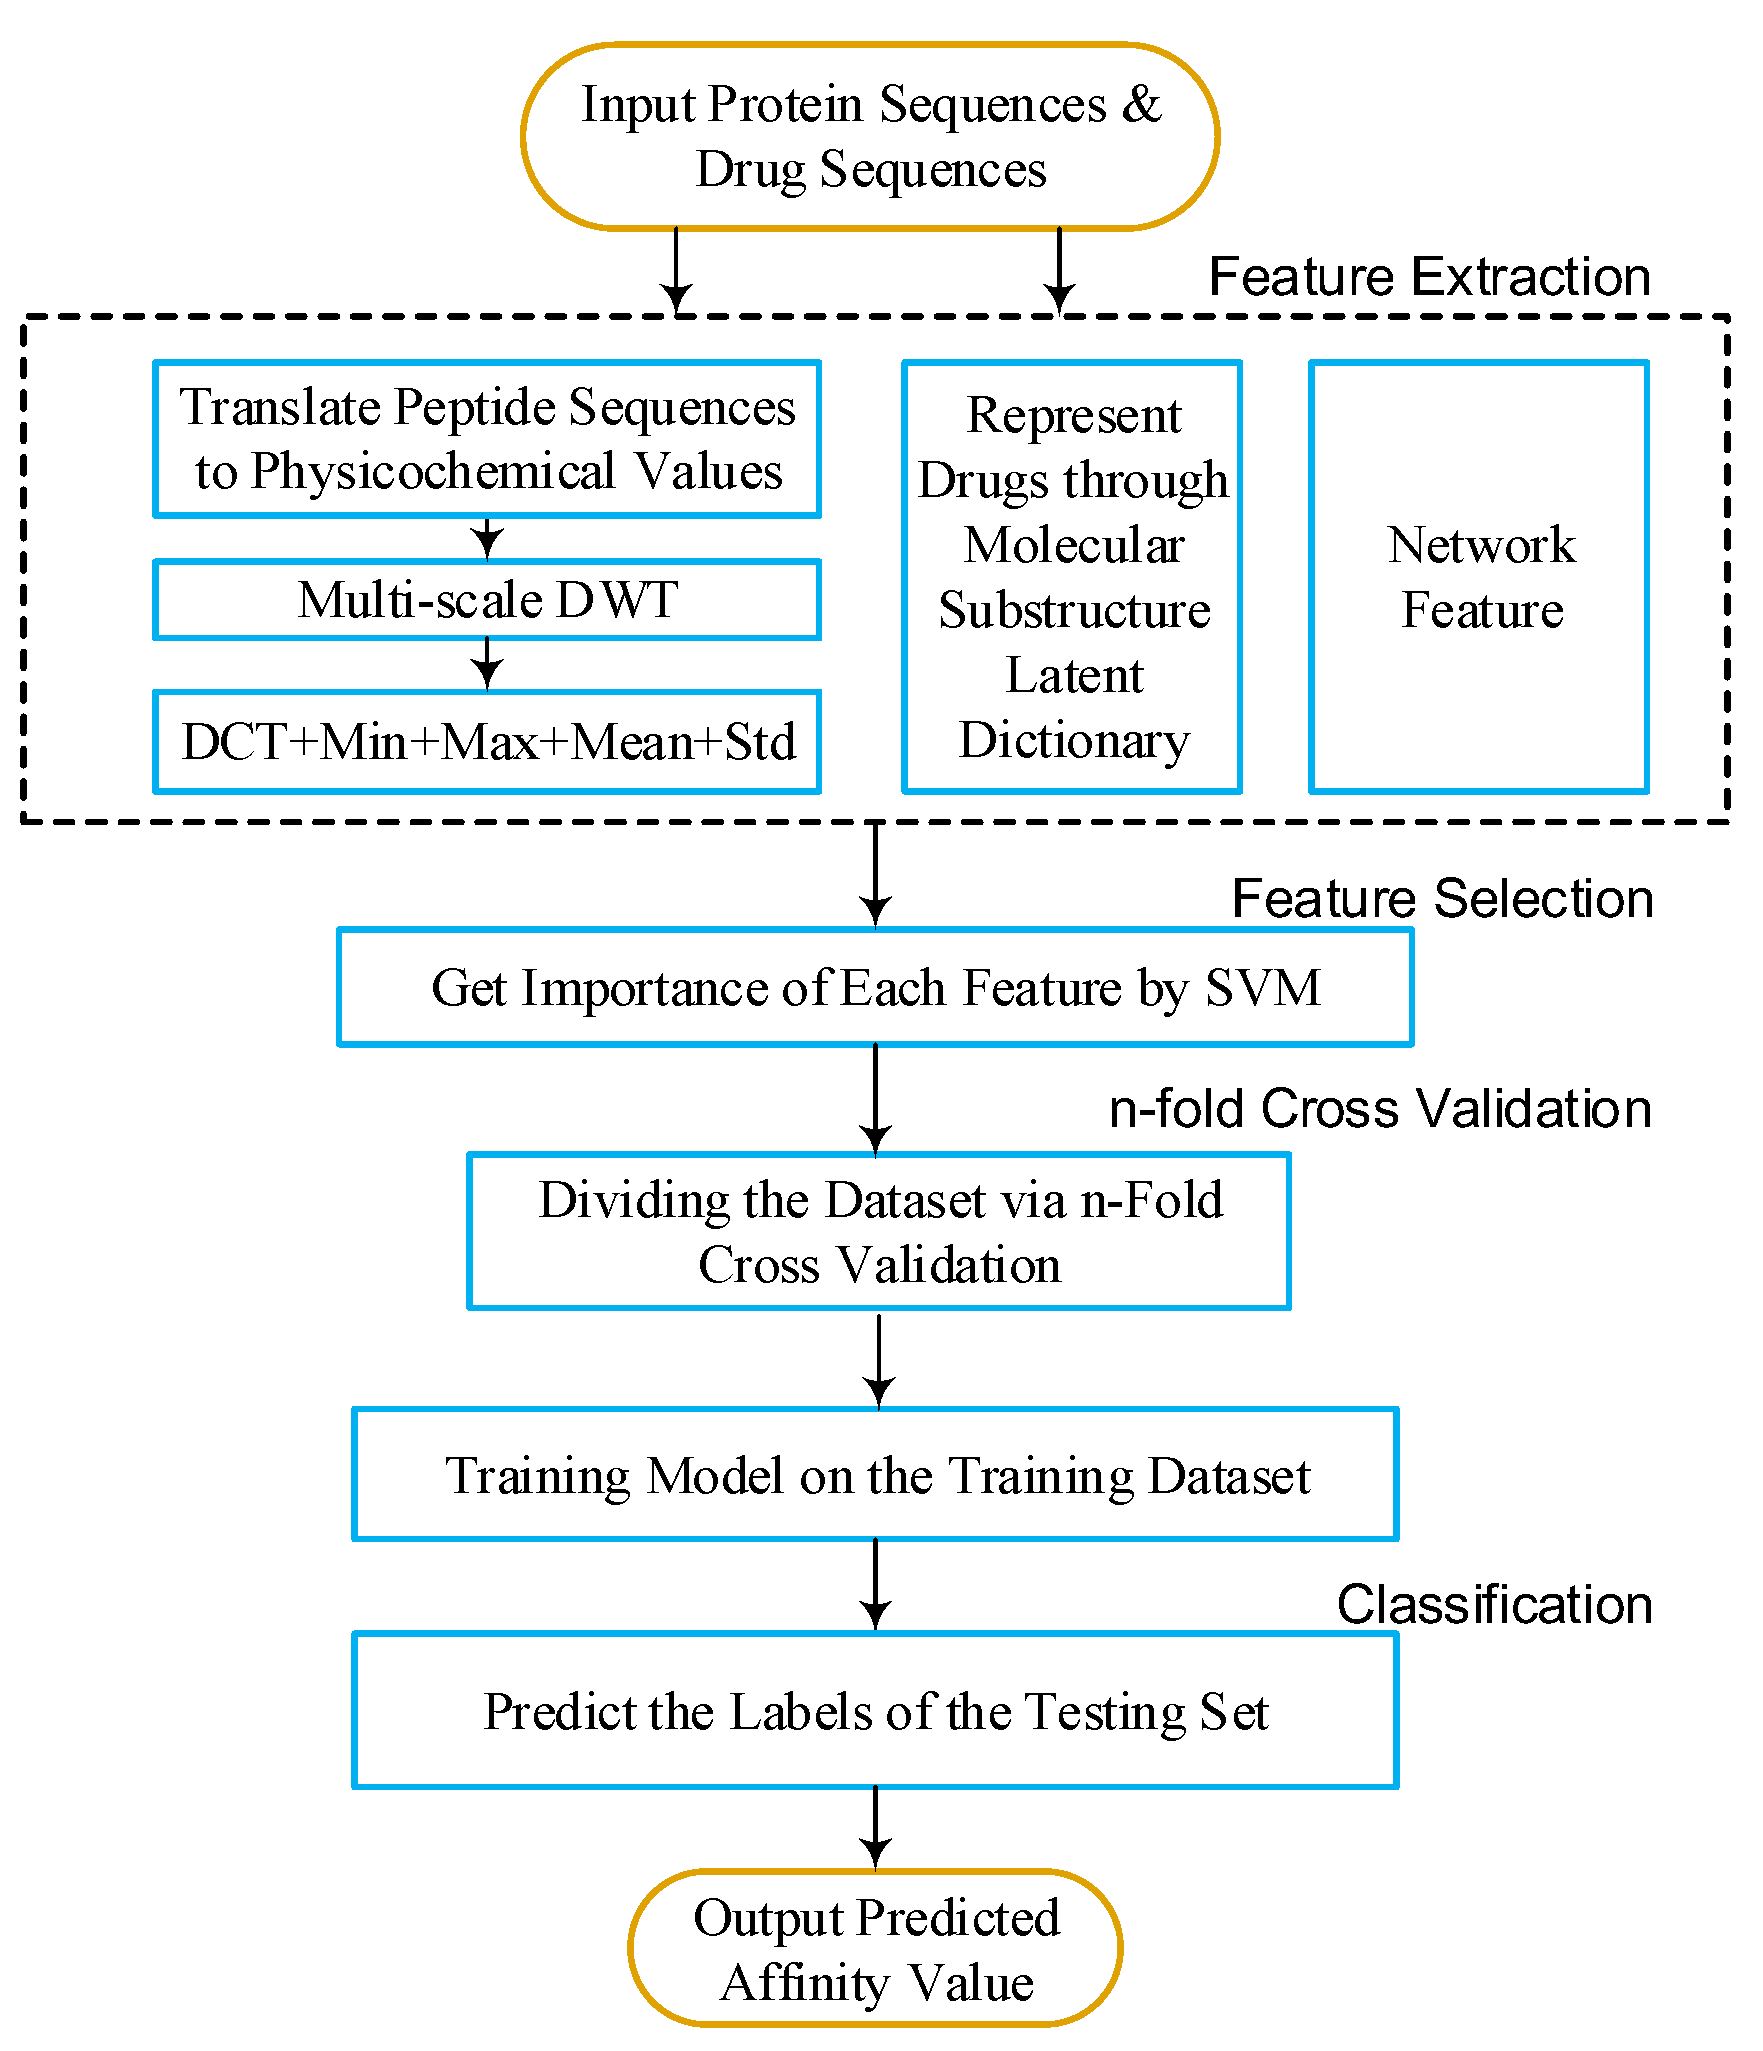
34], because it not only has better boundary response but can also make most high-dimensional data approximate a Gaussian-like distribution. The architecture of our proposed method is shown in
Figure 6 and
Figure 7.
5. Conclusions
In this paper, we present a DTI prediction method by using multi-scale discrete wavelet transform and network features. We employ a DWT algorithm to extract target features, and combine them with drug fingerprint and network feature. Our method can achieve satisfactory prediction performances, and our prediction can be a kind of ameliorated prediction by comparing with other existing methods after feature selection. However, the imbalanced problem of DTIs prediction is not solved very well. SVM is poor on imbalanced data. The AUPR value of DAWN is low on the Nuclear receptor dataset.
The prediction accuracy may be further enhanced with the further expansion of more refined representation of the structural and physicochemical properties or a better machine learning model (such as sparse representation and gradient boosting decision tree) for predicting drug–target interactions. In the future, we will build the classification by the strategy of bootstrap sampling and weighting sub-classifiers.
Acknowledgments
This research and this article’s publication costs are supported by a grant from the National Science Foundation of China (NSFC 61,772,362, 61,402,326), Peiyang Scholar Program of Tianjin University (no. 2016XRG-0009), and the Tianjin Research Program of Application Foundation and Advanced Technology (16JCQNJC00200).
Author Contributions
Cong Shen, Yijie Ding and Fei Guo conceived the study. Cong Shen and Yijie Ding performed the experiments and analyzed the data. Cong Shen, Yijie Ding and Fei Guo drafted the manuscript. All authors read and approved the manuscript.
Conflicts of Interest
The authors declare that they have no competing interests.
References
- Sayers, E.W.; Barrett, T.; Benson, D.A.; Bryant, S.H.; Canese, K.; Chetvernin, V.; Church, D.M.; DiCuccio, M.; Edgar, R.; Federhen, S.; et al. Database resources of the national center for biotechnology information. Nucleic Acids Res. 2009, 37, 5–15. [Google Scholar] [CrossRef] [PubMed]
- Cheng, A.C.; Coleman, R.G.; Smyth, K.T.; Cao, Q.; Soulard, P.; Caffrey, D.R.; Salzberg, A.C.; Huang, E.S. Structure-based maximal affinity model predicts small-molecule druggability. Nat. Biotechnol. 2007, 25, 71–75. [Google Scholar] [CrossRef] [PubMed]
- Rarey, M.; Kramer, B.; Lengauer, T.; Klebe, G. A fast flexible docking method using an incremental construction algorithm. J. Mol. Biol. 1996, 261, 470–489. [Google Scholar] [CrossRef] [PubMed]
- Yamanishi, Y.; Araki, M.; Gutteridge, A.; Honda, W.; Kanehisa, M. Prediction of drug–target interaction networks from the integration of chemical and genomic spaces. Bioinformatics 2008, 24, i232–i240. [Google Scholar] [CrossRef] [PubMed]
- Bleakley, K.; Yamanishi, Y. Supervised prediction of drug–target interactions using bipartite local models. Bioinformatics 2009, 25, 2397–2403. [Google Scholar] [CrossRef] [PubMed]
- Mei, J.P.; Kwoh, C.K.; Yang, P.; Li, X.L.; Zheng, J. Drug-target interaction prediction by learning from local information and neighbors. Bioinformatics 2013, 29, 238–245. [Google Scholar] [CrossRef] [PubMed]
- Van, L.T.; Nabuurs, S.B.; Marchiori, E. Gaussian interaction profile kernels for predicting drug–target interaction. Bioinformatics 2011, 27, 3036–3043. [Google Scholar]
- Xia, Z.; Wu, L.Y.; Zhou, X.; Wong, S.T. Semi-supervised drug-protein interaction prediction from heterogeneous biological spaces. BMC Syst. Biol. 2010, 4, 6–17. [Google Scholar] [CrossRef] [PubMed]
- Zheng, X.; Ding, H.; Mamitsuka, H.; Zhu, S. Collaborative matrix factorization with multiple similarities for predicting drug–target interactions. In Proceedings of the 19th ACM SIGKDD International Conference on Knowledge Discovery and Data Mining, Chicago, IL, USA, 11–14 August 2013; pp. 1025–1033. [Google Scholar]
- Van, L.T.; Marchiori, E. Predicting Drug-Target Interactions for New Drug Compounds Using a Weighted Nearest Neighbor Profile. PLoS ONE 2013, 8, e66952. [Google Scholar]
- Gönen, M. Predicting drug–target interactions from chemical and genomic kernels using Bayesian matrix factorization. Bioinformatics 2012, 28, 2304–2310. [Google Scholar] [CrossRef] [PubMed]
- Liu, Y.; Wu, M.; Miao, C.; Zhao, P.; Li, X.L. Neighborhood Regularized Logistic Matrix Factorization for Drug-Target Interaction Prediction. PLoS Comput. Biol. 2016, 12, e1004760. [Google Scholar] [CrossRef] [PubMed]
- Cao, D.S.; Liu, S.; Xu, Q.S.; Lu, H.M.; Huang, J.H.; Hu, Q.N.; Liang, Y.Z. Large-scale prediction of drug–target interactions using protein sequences and drug topological structures. Anal. Chim. Acta 2012, 752, 1–10. [Google Scholar] [CrossRef] [PubMed]
- Cao, D.S.; Zhang, L.X.; Tan, G.S.; Xiang, Z.; Zeng, W.B.; Xu, Q.S.; Chen, A.F. Computational Prediction of DrugTarget Interactions Using Chemical, Biological, and Network Features. Mol. Inform. 2014, 33, 669–681. [Google Scholar] [CrossRef] [PubMed]
- Kanehisa, M.; Goto, S.; Hattori, M.; Aoki-Kinoshita, K.F.; Itoh, M.; Kawashima, S.; Katayama, T.; Araki, M.; Hirakawa, M. From genomics to chemical genomics: New developments in KEGG. Nucleic Acids Res. 2006, 34, 354–357. [Google Scholar] [CrossRef] [PubMed]
- Schomburg, I.; Chang, A.; Placzek, S.; Söhngen, C.; Rother, M.; Lang, M.; Munaretto, C.; Ulas, S.; Stelzer, M.; Grote, A.; et al. BRENDA in 2013: Integrated reactions, kinetic data, enzyme function data, improved disease classification: New options and contents in BRENDA. Nucleic Acids Res. 2013, 41, 764–772. [Google Scholar] [CrossRef] [PubMed]
- Hecker, N.; Ahmed, J.; Eichborn, J.V.; Dunkel, M.; Macha, K.; Eckert, A.; Gilson, M.K.; Bourne, P.E.; Preissner, R. SuperTarget goes quantitative: Update on drug–target interactions. Nucleic Acids Res. 2012, 40, 1113–1117. [Google Scholar] [CrossRef] [PubMed]
- Law, V.; Knox, C.; Djoumbou, Y.; Jewison, T.; Guo, A.C.; Liu, Y.; Maciejewski, A.; Arndt, D.; Wilson, M.; Neveu, V.; et al. DrugBank 4.0: Shedding new light on drug metabolism. Nucleic Acids Res. 2014, 42, 1091–1097. [Google Scholar] [CrossRef] [PubMed]
- Gaulton, A.; Bellis, L.J.; Bento, A.P.; Chambers, J.; Davies, M.; Hersey, A.; Light, Y.; McGlinchey, S.; Michalovich, D.; Al-Lazikani, B.; et al. Chembl: A large-scale bioactivity database for drug discovery. Nucleic Acids Res. 2012, 40, D1100–D1107. [Google Scholar] [CrossRef] [PubMed]
- Günther, S.; Kuhn, M.; Dunkel, M.; Campillos, M.; Senger, C.; Petsalaki, E.; Ahmed, J.; Urdiales, E.G.; Gewiess, A.; Jensen, L.J.; et al. Supertarget and matador: Resources for exploring drug–target relationships. Nucleic Acids Res. 2008, 36, 919–922. [Google Scholar] [CrossRef] [PubMed]
- Ding, Y.; Tang, J.; Guo, F. Predicting protein-protein interactions via multivariate mutual information of protein sequences. BMC Bioinform. 2016, 17, 389–410. [Google Scholar] [CrossRef] [PubMed]
- Ding, Y.; Tang, J.; Guo, F. Identification of Protein–Protein Interactions via a Novel Matrix-Based Sequence Representation Model with Amino Acid Contact Information. Int. J. Mol. Sci. 2016, 17, 1623. [Google Scholar] [CrossRef] [PubMed]
- Li, Z.; Tang, J.; Guo, F. Learning from real imbalanced data of 14-3-3 proteins binding specificity. Neurocomputing 2016, 217, 83–91. [Google Scholar] [CrossRef]
- You, Z.H.; Lei, Y.K.; Zhu, L.; Xia, J.F.; Wang, B. Prediction of protein-protein interactions from amino acid sequences with ensemble extreme learning machines and principal component analysis. BMC Bioinform. 2013, 14. [Google Scholar] [CrossRef] [PubMed]
- Mallat, S.G. A Theory for Multiresolution Signal Decomposition: The Wavelet Representation. IEEE Trans. Pattern Anal. Mach. Intell. 1989, 11, 674–693. [Google Scholar] [CrossRef]
- Nanni, L.; Brahnam, S.; Lumini, A. Wavelet images and Chou’s pseudo amino acid composition for protein classification. Amino Acids 2012, 43, 657–665. [Google Scholar] [CrossRef] [PubMed]
- Guyon, I.; Weston, J.; Barnhill, S.; Vapnik, V. Gene selection for cancer classification using support vector machines. Mach. Learn. 2002, 46, 389–422. [Google Scholar] [CrossRef]
- Yan, K.; Zhang, D. Feature selection and analysis on correlated gas sensor data with recursive feature elimination. Sens. Actuators B Chem. 2015, 212, 353–363. [Google Scholar] [CrossRef]
- Cortes, C.; Vapnik, V. Support-vector networks. Mach. Learn. 1995, 20, 273–297. [Google Scholar] [CrossRef]
- Zou, Q.; Zeng, J.C.; Cao, L.J.; Ji, R.R. A Novel Features Ranking Metric with Application to Scalable Visual and Bioinformatics Data Classification. Neurocomputing 2016, 173, 346–354. [Google Scholar] [CrossRef]
- Zou, Q.; Wan, S.X.; Ju, Y.; Tang, J.J.; Zeng, X.X. Pretata: Predicting TATA binding proteins with novel features and dimensionality reduction strategy. BMC Syst. Biol. 2016, 10 (Suppl. 4), 114. [Google Scholar] [CrossRef] [PubMed]
- Wei, L.Y.; Tang, J.J.; Zou, Q. Local-DPP: An Improved DNA-binding Protein Prediction Method by Exploring Local Evolutionary Information. Inf. Sci. 2017, 384, 135–144. [Google Scholar] [CrossRef]
- Zou, Q.; Li, J.J.; Hong, Q.Q.; Lin, Z.Y.; Wu, Y.; Shi, H.; Ju, Y. Prediction of microRNA-disease associations based on social network analysis methods. BioMed Res. Int. 2015, 2015, 810514. [Google Scholar] [CrossRef] [PubMed]
- Chang, C.C.; Lin, C.J. LIBSVM: A Library for support vector machines. ACM Trans. Intell. Syst. Technol. 2011, 2, 389–396. [Google Scholar] [CrossRef]
© 2017 by the authors. Licensee MDPI, Basel, Switzerland. This article is an open access article distributed under the terms and conditions of the Creative Commons Attribution (CC BY) license (http://creativecommons.org/licenses/by/4.0/).


