Sustained Low Serum Substance P Levels in Non-Surviving Septic Patients

 , ,
, ,
Abstract
:1. Introduction
2. Results
3. Discussion
4. Methods
4.1. Design and Subjects
4.2. Determination of Serum Concentrations of SP, Tumor Necrosis Factor (TNF)-α, and Interleukin (IL)-10
4.3. Statistical Methods
5. Conclusions
Acknowledgments
Author Contributions
Conflicts of Interest
Abbreviations
| APACHE | Acute physiology and chronic health evaluation |
| aPTT | Activated partial thromboplastin time |
| COPD | Chronic obstructive pulmonary disease |
| FIO2 | Fraction inspired oxygen |
| INR | International normalized ratio |
| ICU | Intensive care unit |
| PaO2 | Pressure of arterial oxygen |
| TNF | Tumor necrosis factor |
| SOFA | Sepsis-related organ failure assessment score |
| SP | Substance P |
References
- Angus, D.C.; Linde-Zwirble, W.T.; Lidicker, J.; Clermont, G.; Carcillo, J.; et al. Epidemiology of severe sepsis in the United States: analysis of incidence, outcome, and associated costs of care. Crit. Care Med. 2001, 29, 1303–1310. [Google Scholar] [CrossRef] [PubMed]
- Vincent, J.L.; Sakr, Y.; Sprung, C.L.; Ranieri, V.M.; Reinhart, K.M.; Gerlach, H.; Moreno, R.; Carlet, J.; Le Gall, J.R.; Payen, D. Sepsis Occurrence in Acutely Ill Patients Investigators. Sepsis in European intensive care units: Results of the SOAP study. Crit. Care Med. 2006, 34, 344–353. [Google Scholar] [CrossRef] [PubMed]
- Maggi, C.A. The effects of tachykinins on inflammatory and immune cells. Regul. Pept. 1997, 70, 75–90. [Google Scholar] [CrossRef]
- Barnes, P.J. Neurogenic inflammation in the airways. Respir. Physiol. 2001, 125, 145–154. [Google Scholar] [CrossRef]
- Almeida, T.A.; Rojo, J.; Nieto, P.M.; Pinto, F.M.; Hernandez, M.; Martín, J.D.; Candenas, M.L. Tachykinins and tachykinin receptors: Structure and activity relationships. Curr. Med. Chem. 2004, 11, 2045–2081. [Google Scholar] [CrossRef] [PubMed]
- Pennefather, J.N.; Lecci, A.; Candenas, M.L.; Patak, E.; Pinto, F.M.; Maggi, C.A. Tachykinins and tachykinin receptors: A growing family. Life Sci. 2004, 74, 1445–1463. [Google Scholar] [CrossRef] [PubMed]
- Groneberg, D.A.; Quarcoo, D.; Frossard, N.; Fischer, A. Neurogenic mechanisms in bronchial inflammatory diseases. Allergy 2004, 59, 1139–1152. [Google Scholar] [CrossRef] [PubMed]
- Satake, H.; Kawada, T. Overview of the Primary Structure, Tissue-Distribution, and Functions of Tachykinins and their Receptors. Curr. Drug Targets 2006, 7, 963–974. [Google Scholar] [CrossRef] [PubMed]
- De Swert, K.O.; Joos, G.F. Extending the understanding of sensory neuropeptides. Eur. J. Pharmacol. 2006, 533, 171–181. [Google Scholar] [CrossRef] [PubMed]
- Bodkin, J.V.; Fernandes, E.S. TRPV1 and SP: Key elements for sepsis outcome? Br. J. Pharmacol. 2013, 170, 1279–1292. [Google Scholar] [CrossRef] [PubMed]
- Steinhoff, M.S.; von Mentzer, B.; Geppetti, P.; Pothoulakis, C.; Bunnett, N.W. Tachykinins and their receptors: Contributions to physiological control and the mechanisms of disease. Physiol. Rev. 2014, 94, 265–301. [Google Scholar] [CrossRef] [PubMed]
- Mashaghi, A.; Marmalidou, A.; Tehrani, M.; Grace, P.M.; Pothoulakis, C.; Dana, R. Neuropeptide substance P and the immune response. Cell Mol. Life Sci. 2016, 73, 4249–4264. [Google Scholar] [CrossRef] [PubMed]
- Lotz, M.; Vaughan, J.H.; Carson, D.A. Effect of neuropeptides on production of inflammatory cytokines by human monocytes. Science 1988, 241, 1218–1221. [Google Scholar] [CrossRef] [PubMed]
- Laurenzi, M.A.; Persson, M.A.; Dalsgaard, C.J.; Haegerstrand, A. The neuropeptide substance P stimulates production of interleukin 1 in human blood monocytes: Activated cells are preferentially influenced by the neuropeptide. Scand. J. Immunol. 1990, 31, 529–533. [Google Scholar] [CrossRef] [PubMed]
- Ansel, J.C.; Brown, J.R.; Payan, D.G.; Brown, M.A. Substance P selectively activates TNF-α gene expression in murine mast cells. J. Immunol. 1993, 150, 4478–4485. [Google Scholar] [PubMed]
- Yamaguchi, M.; Kojima, T.; Kanekawa, M.; Aihara, N.; Nogimura, A.; Kasai, K. Neuropeptides stimulate production of interleukin-1b, interleukin-6, and tumor necrosis factor-α in human dental pulp cells. Inflamm. Res. 2004, 53, 199–204. [Google Scholar] [CrossRef] [PubMed]
- Jiang, M.H.; Chung, E.; Chi, G.F.; Ahn, W.; Lim, J.E.; Hong, H.S.; Kim, D.W.; Choi, H.; Kim, J.; Son, Y. Substance P induces M2-type macrophages after spinal cord injury. Neuroreport 2012, 23, 786–792. [Google Scholar] [CrossRef] [PubMed]
- Jiang, M.H.; Lim, J.E.; Chi, G.F.; Ahn, W.; Zhang, M.; Chung, E.; Son, Y. Substance P reduces apoptotic cell death possibly by modulating the immune response at the early stage after spinal cord injury. Neuroreport 2013, 24, 846–851. [Google Scholar] [CrossRef] [PubMed]
- Verdrengh, M.; Tarkowski, A. The impact of substance P signalling on the development of experimental staphylococcal sepsis and arthritis. Scand. J. Immunol. 2008, 67, 253–259. [Google Scholar] [CrossRef] [PubMed]
- Yang, S.; Stepien, D.; Hanseman, D.; Robinson, B.; Goodman, M.D.; Pritts, T.A.; Caldwell, C.C.; Remick, D.G.; Lentsch, A.B. Substance P mediates reduced pneumonia rates after traumatic brain injury. Crit. Care Med. 2014, 42, 2092–2100. [Google Scholar] [CrossRef] [PubMed]
- Kincy-Cain, T.; Bost, K.L. Increased susceptibility of mice to Salmonella infection following in vivo treatment with the substance P antagonist, spantide II. J. Immunol. 1996, 157, 255–264. [Google Scholar] [PubMed]
- Lighvani, S.; Huang, X.; Trivedi, P.P.; Swanborg, R.H.; Hazlett, L.D. Substance P regulates natural killer cell interferon-gamma production and resistance to Pseudomonas aeruginosa infection. Eur. J. Immunol. 2005, 35, 1567–1575. [Google Scholar] [CrossRef] [PubMed]
- Beer, S.; Weighardt, H.; Emmanuilidis, K.; Harzenetter, M.D.; Matevossian, E.; Heidecke, C.D.; Bartels, H.; Siewert, J.R.; Holzmann, B. Systemic neuropeptide levels as predictive indicators for lethal outcome in patients with postoperativesepsis. Crit. Care Med. 2002, 30, 1794–1798. [Google Scholar] [CrossRef] [PubMed]
- Arnalich, F.; Sánchez, J.F.; Martínez, M.; Jiménez, M.; López, J.; Vázquez, J.J.; Hernanz, A. Changes in plasma concentrations of vasoactive neuropeptides in patients with sepsis and septic shock. Life Sci. 1995, 56, 75–81. [Google Scholar] [CrossRef]
- Jacob, P.; Mueller, M.H.; Hahn, J.; Wolk, I.; Mayer, P.; Nagele, U.; Hennenlotter, J.; Stenzl, A.; Konigsrainer, A.; Glatzle, J. Alterations of neuropeptides in the human gut during peritonitis. Langenbecks Arch. Surg. 2007, 392, 267–271. [Google Scholar] [CrossRef] [PubMed]
- Lorente, L.; Martín, M.M.; Almeida, A.; Hernández, M.; Ferreres, J.; Solé-Violán, J.; Labarta, L.; Díaz, C.; Jiménez, A. Association between serum substance P levels and mortality in patients with severe sepsis. J. Crit. Care 2015, 30, 924–928. [Google Scholar] [CrossRef] [PubMed]
- Singer, M.; Deutschman, C.S.; Seymour, C.W.; Shankar-Hari, M.; Annane, D.; Bauer, M.; Bellomo, R.; Bernard, G.R.; Chiche, J.D.; Coopersmith, C.M.; et al. The Third International Consensus Definitions for Sepsis and Septic Shock (Sepsis-3). JAMA 2016, 315, 801–810. [Google Scholar]
- Levy, M.M.; Fink, M.P.; Marshall, J.C.; Abraham, E.; Angus, D.; Cook, D.; Cohen, J.; Opal, S.M.; Vincent, J.L.; Ramsay, G. International Sepsis Definitions Conference: 2001 SCCM/ ESICM/ ACCP/ ATS/ SIS International Sepsis Definitions Conference. Intensive Care Med. 2003, 29, 530–538. [Google Scholar] [CrossRef] [PubMed]
- Lorente, L.; Martín, M.M.; Abreu-González, P.; Domínguez-Rodriguez, A.; Labarta, L.; Díaz, C.; Solé-Violán, J.; Ferreres, J.; Cabrera, J.; Igeño, J.C.; et al. Sustained high serum malondialdehyde levels are associated with severity and mortality in septic patients. Crit. Care 2013, 17, R290. [Google Scholar] [CrossRef] [PubMed]
- Lorente, L.; Martín, M.M.; Solé-Violán, J.; Blanquer, J.; Labarta, L.; Díaz, C.; Borreguero-León, J.M.; Orbe, J.; Rodríguez, J.A.; Jiménez, A.; et al. Association of sepsis-related mortality with early increase of TIMP-1/MMP-9 ratio. PLoS ONE 2014, 9, e94318. [Google Scholar] [CrossRef] [PubMed]
- Lorente, L.; Martín, M.M.; López-Gallardo, E.; Blanquer, J.; Solé-Violán, J.; Labarta, L.; Díaz, C.; Jiménez, A.; Montoya, J.; Ruiz-Pesini, E. Decrease of oxidative phosphorylation system function in severe septic patients. J. Crit. Care. 2015, 30, 935–939. [Google Scholar] [CrossRef] [PubMed]
- Lorente, L.; Martín, M.M.; Pérez-Cejas, A.; López, R.O.; Ferreres, J.; Solé-Violán, J.; Labarta, L.; Díaz, C.; Palmero, S.; Buitrago, M.; et al. Higher serum caspase-cleaved cytokeratin-18 levels during the first week of sepsis diagnosis in non-survivor patients. Clin. Chem. Lab. Med. 2017. [CrossRef] [PubMed]
- Vincent, J.L.; Moreno, R.; Takala, J.; Willatts, S.; de Mendonça, A.; Bruining, H.; Reinhart, C.K.; Suter, P.M.; Thijs, L.G. The SOFA (Sepsis-related Organ Failure Assessment) score to describe organ dysfunction/failure. Intensive Care Med. 1996, 22, 707–710. [Google Scholar] [CrossRef] [PubMed]
- Knaus, W.A.; Draper, E.A.; Wagner, D.P.; Zimmerman, J.E. APACHE II: A severity of disease classification system. Crit. Care Med. 1985, 13, 818–829. [Google Scholar] [CrossRef] [PubMed]


| Characteristic | Non–Survivors (n = 104) | Survivors (n = 206) | p–Value |
|---|---|---|---|
| Sex female—n (%) | 36 (34.6) | 66 (32.0) | 0.70 |
| Ischemic heart disease—n (%) | 10 (9.6) | 21 (10.2) | 0.99 |
| Diabetes mellitus—n (%) | 42 (40.4) | 52 (25.2) | 0.009 |
| COPD—n (%) | 13 (12.5) | 28 (13.6) | 0.86 |
| Chronic renal failure—n (%) | 11 (10.6) | 12 (5.8) | 0.17 |
| SOFA score—median (p 25–75) | 11 (9–14) | 9 (7–11) | <0.001 |
| Platelets (cells/mm3)—median × 103 (p 25–75) | 133 (68–225) | 197 (131–271) | <0.001 |
| PaO2/FIO2 ratio—median (p 25–75) | 169 (103–240) | 180 (123–270) | 0.17 |
| Leukocytes (cells/mm3)—median × 103 (p 25–75) | 14.9 (6.8–20.4) | 14.4 (9.1–18.9) | 0.84 |
| Lactic acid (mmol/L)—median (p 25–75) | 3.56 (1.60–6.00) | 2.00 (1.15–3.50) | <0.001 |
| INR—median (p 25–75) | 1.42 (1.15–1.90) | 1.25 (1.10–1.50) | 0.003 |
| Creatinine (mg/dL)—median (p 25–75) | 1.63 (1.00–2.95) | 1.30 (0.80–2.10) | 0.007 |
| Bilirubin (mg/dL)—median (p 25–75) | 0.94 (0.50–2.17) | 0.87 (0.47–1.40) | 0.26 |
| aPTT (seconds)—median (p 25–75) | 36 (29–46) | 32 (28–39) | 0.005 |
| APACHE–II score—median (p 25–75) | 23 (19–28) | 19 (15–23) | <0.001 |
| Age—median years (p 25–75) | 64 (56–74) | 60 (47–69) | 0.003 |
| Bloodstream infection—n (%) | 17 (16.3) | 30 (14.6) | 0.74 |
| Empiric antimicrobial treatment adequate | 0.72 | ||
| Unknown due to negative cultures—n (%) | 55 (52.9) | 105 (51.0) | |
| Adequate—n (%) | 42 (40.4) | 83 (40.3) | |
| Inadequate—n (%) | 3 (2.9) | 4 (1.9) | |
| Unknown due to antigenuria diagnosis—n (%) | 4 (3.8) | 14 (6.8) | |
| Microorganism responsibles | |||
| Unknwon—n (%) | 55 (52.9) | 105 (51.0) | 0.81 |
| Gram-positive—n (%) | 26 (25.0) | 50 (24.3) | 0.89 |
| Gram-negative—n (%) | 23 (22.1) | 51 (24.8) | 0.67 |
| Fungii—n (%) | 4 (3.8) | 4 (1.9) | 0.45 |
| Anaerobe—n (%) | 1 (1.0) | 2 (1.0) | 0.99 |
| Site of infection | 0.75 | ||
| Respiratory—n (%) | 61 (58.7) | 118 (57.3) | |
| Abdominal—n (%) | 26 (25.0) | 58 (28.2) | |
| Neurological | 1 (1.0) | 4 (1.9) | |
| Urinary—n (%) | 5 (4.8) | 11 (5.3) | |
| Skin—n (%) | 5 (4.8) | 9 (4.4) | |
| Endocarditis—n (%) | 5 (4.8) | 6 (2.9) | |
| Osteomyelitis | 1 (0.9) | 0 | |
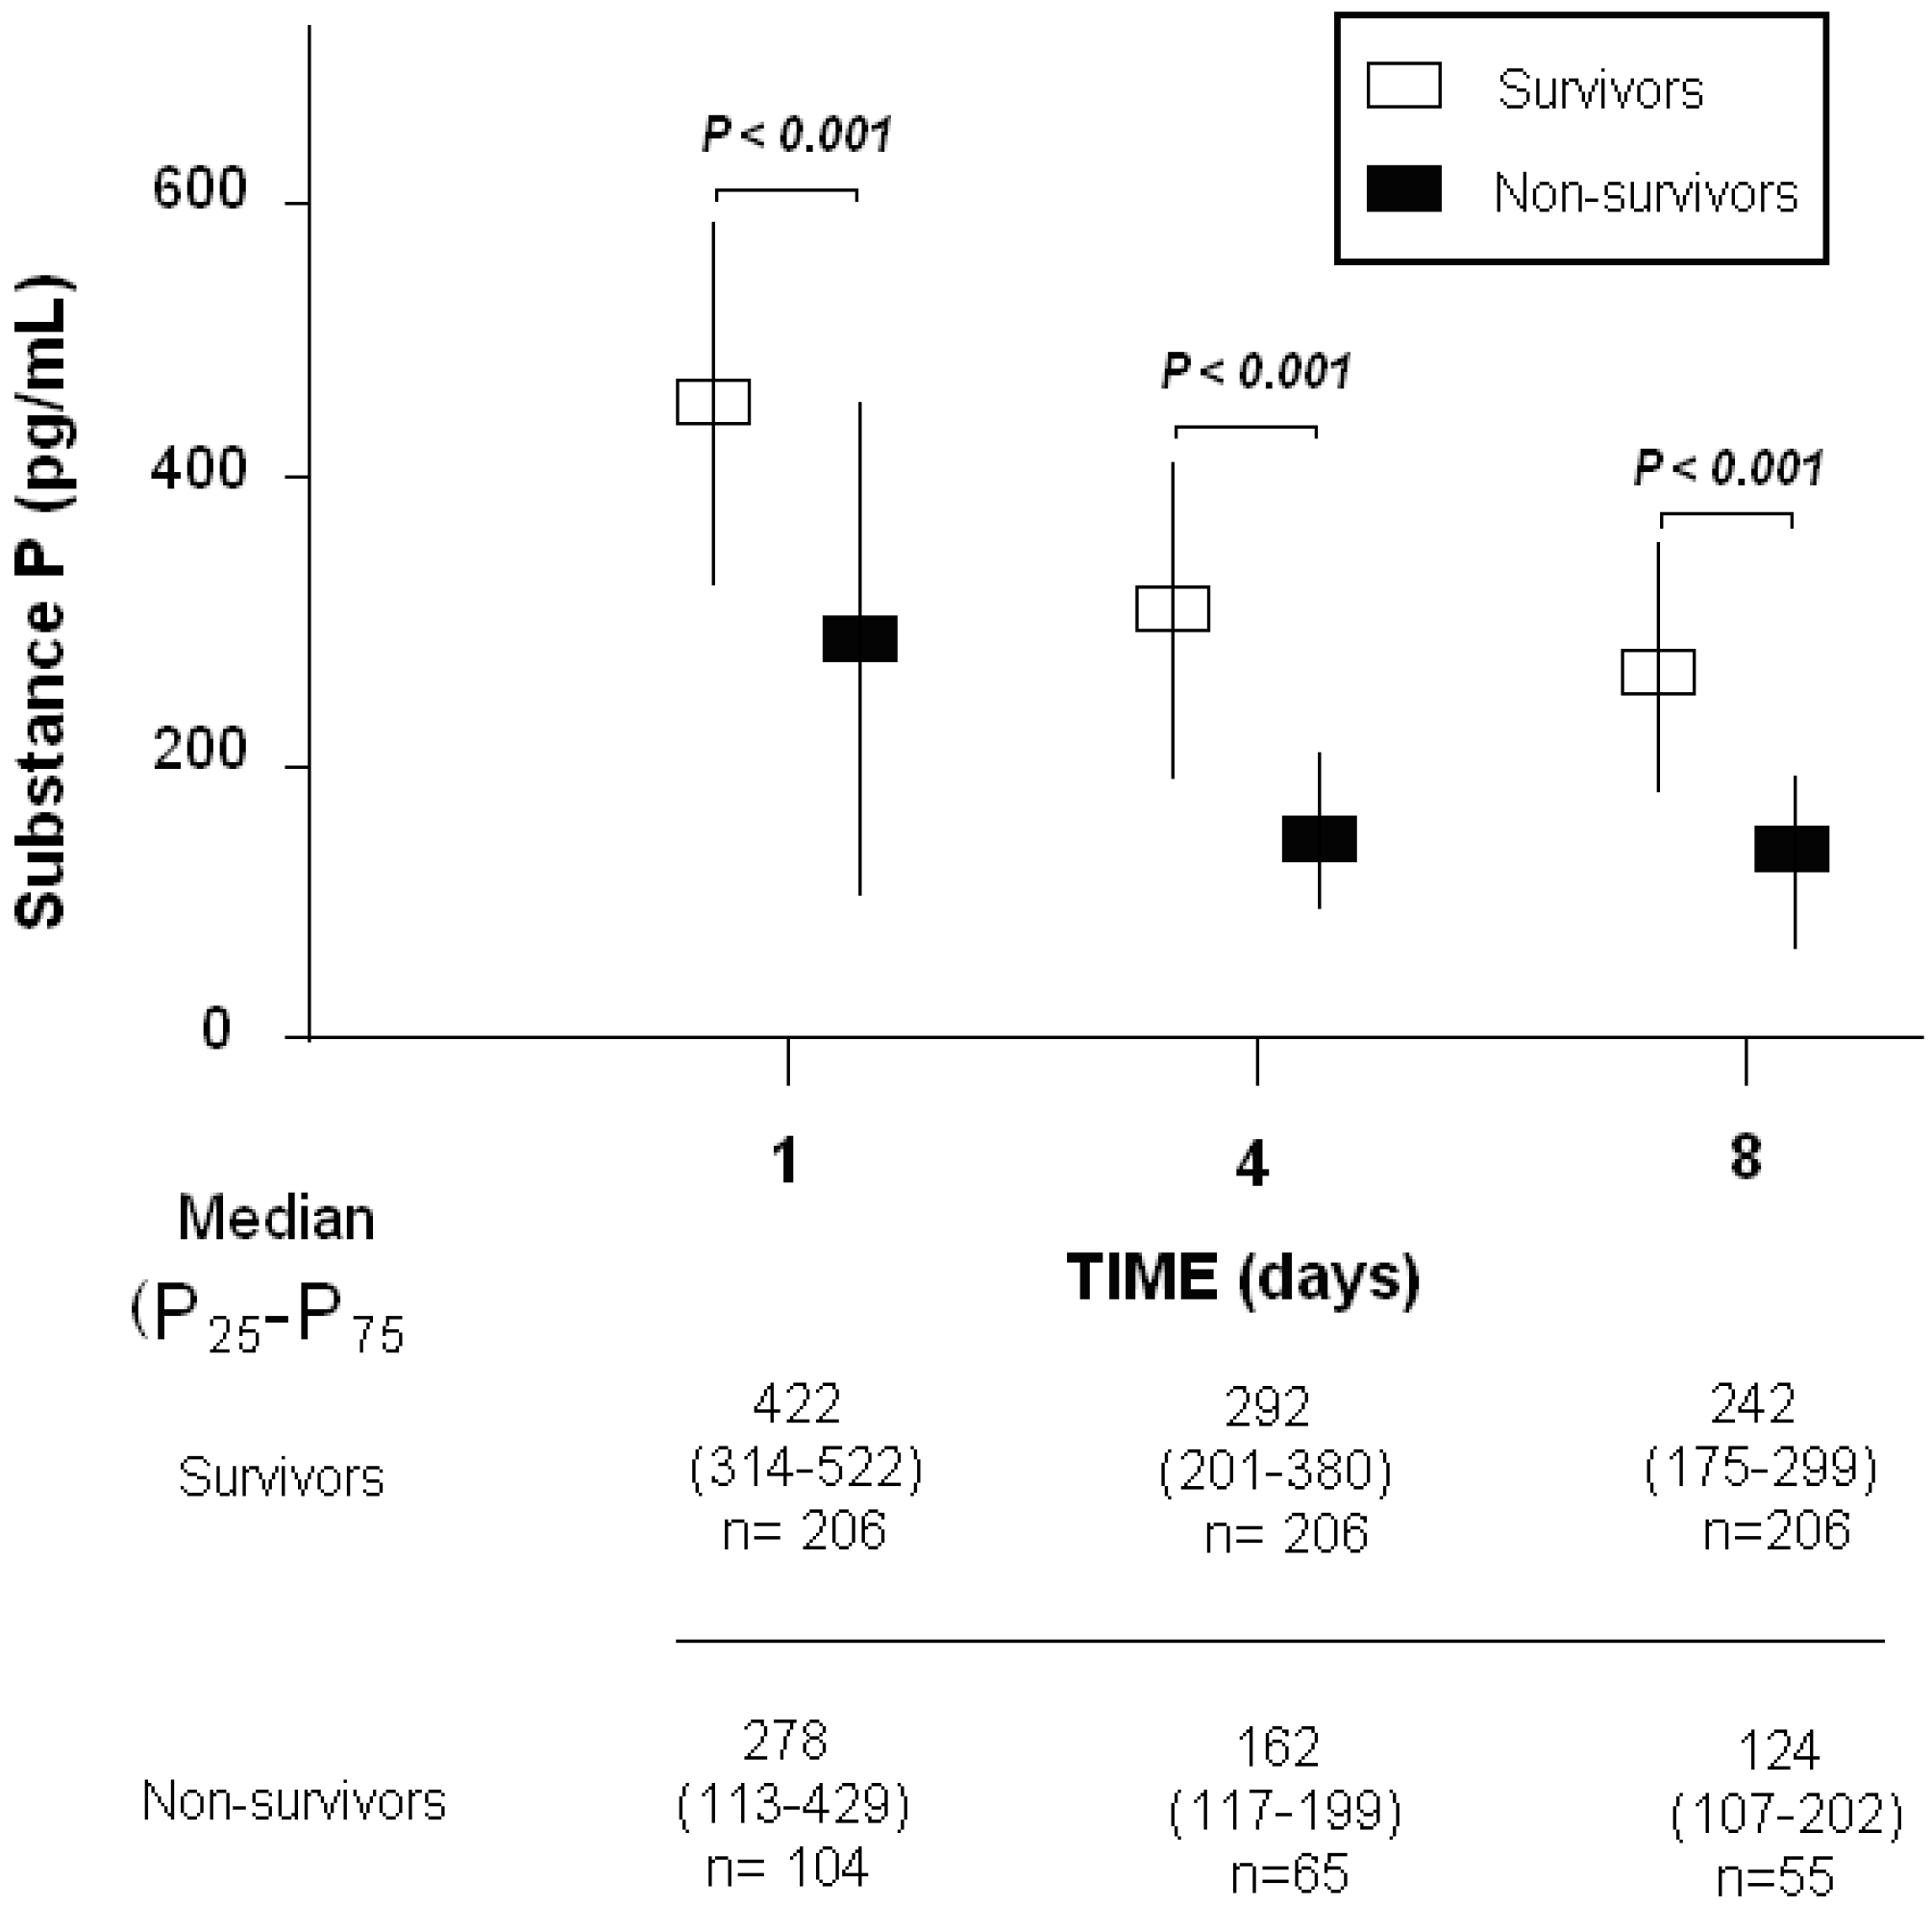
| Substance P (pg/mL)—median (p 25–75) | 278 (113–429) | 422 (314–522) | <0.001 |
| TNF-α (pg/mL)—median (p 25–75) | 36 (18–74) | 30 (19–49) | 0.24 |
| Interleukin-10 median pg/mL (p 25–75) | 38 (8–118) | 10 (5–37) | <0.001 |
| Parameters—Median (p 25−75) | Nonsurvivors | Survivors | p |
|---|---|---|---|
| Day 1 | (n = 104) | (n = 206) | |
| Substance P (pg/mL)—median (p 25–75) | 278 (113–429) | 422 (314–522) | <0.001 |
| SOFA score—median (p 25–75) | 11 (9–14) | 9 (7–11) | <0.001 |
| TNF-α—median pg/mL (p 25–75) | 36 (18–74) | 30 (19–49) | 0.24 |
| Interleukin-10 median pg/mL (p 25–75) | 38 (8–118) | 10 (5–37) | <0.001 |
| Day 4 | (n = 65) | (n = 206) | |
| Substance P (pg/mL)—median (p 25–75) | 162 (117–199) | 292 (201–380) | <0.001 |
| SOFA score—median (p 25–75) | 10 (7–15) | 6 (3–10) | <0.001 |
| TNF-α—median pg/mL (p 25–75) | 35 (26–49) | 22 (14–32) | 0.001 |
| Interleukin-10 median pg/mL (p 25–75) | 13 (6–37) | 6 (5–13) | <0.001 |
| Day 8 | (n = 55) | (n = 2064) | |
| Substance P (pg/mL)—median (p 25–75) | 124 (107–202) | 242 (175–299) | <0.001 |
| SOFA score—median (p 25–75) | 10 (6–13) | 4 (1–7) | <0.001 |
| TNF-α—median pg/mL (p 25–75) | 26 (15–48) | 17 (12–29) | 0.04 |
| Interleukin-10 median pg/mL (p 25–75) | 12 (6–28) | 5 (5–9) | 0.001 |
| Header | Day 1 | Day 4 | Day 8 |
|---|---|---|---|
| SOFA score | R = −0.09; p = 0.12 | R = −0.18; p = 0.003 | R = −0.12; p = 0.06 |
| TNF-α (pg/mL) | R = 0.11; p = 0.13 | R = 0.05; p = 0.59 | R = 0.08; p = 0.42 |
| Interleukin-10 (pg/mL) | R = 0.10; p = 0.19 | R = 0.03; p = 0.72 | R = 0.13; p = 0.18 |
| Header | Day 1 | Day 4 | Day 8 |
|---|---|---|---|
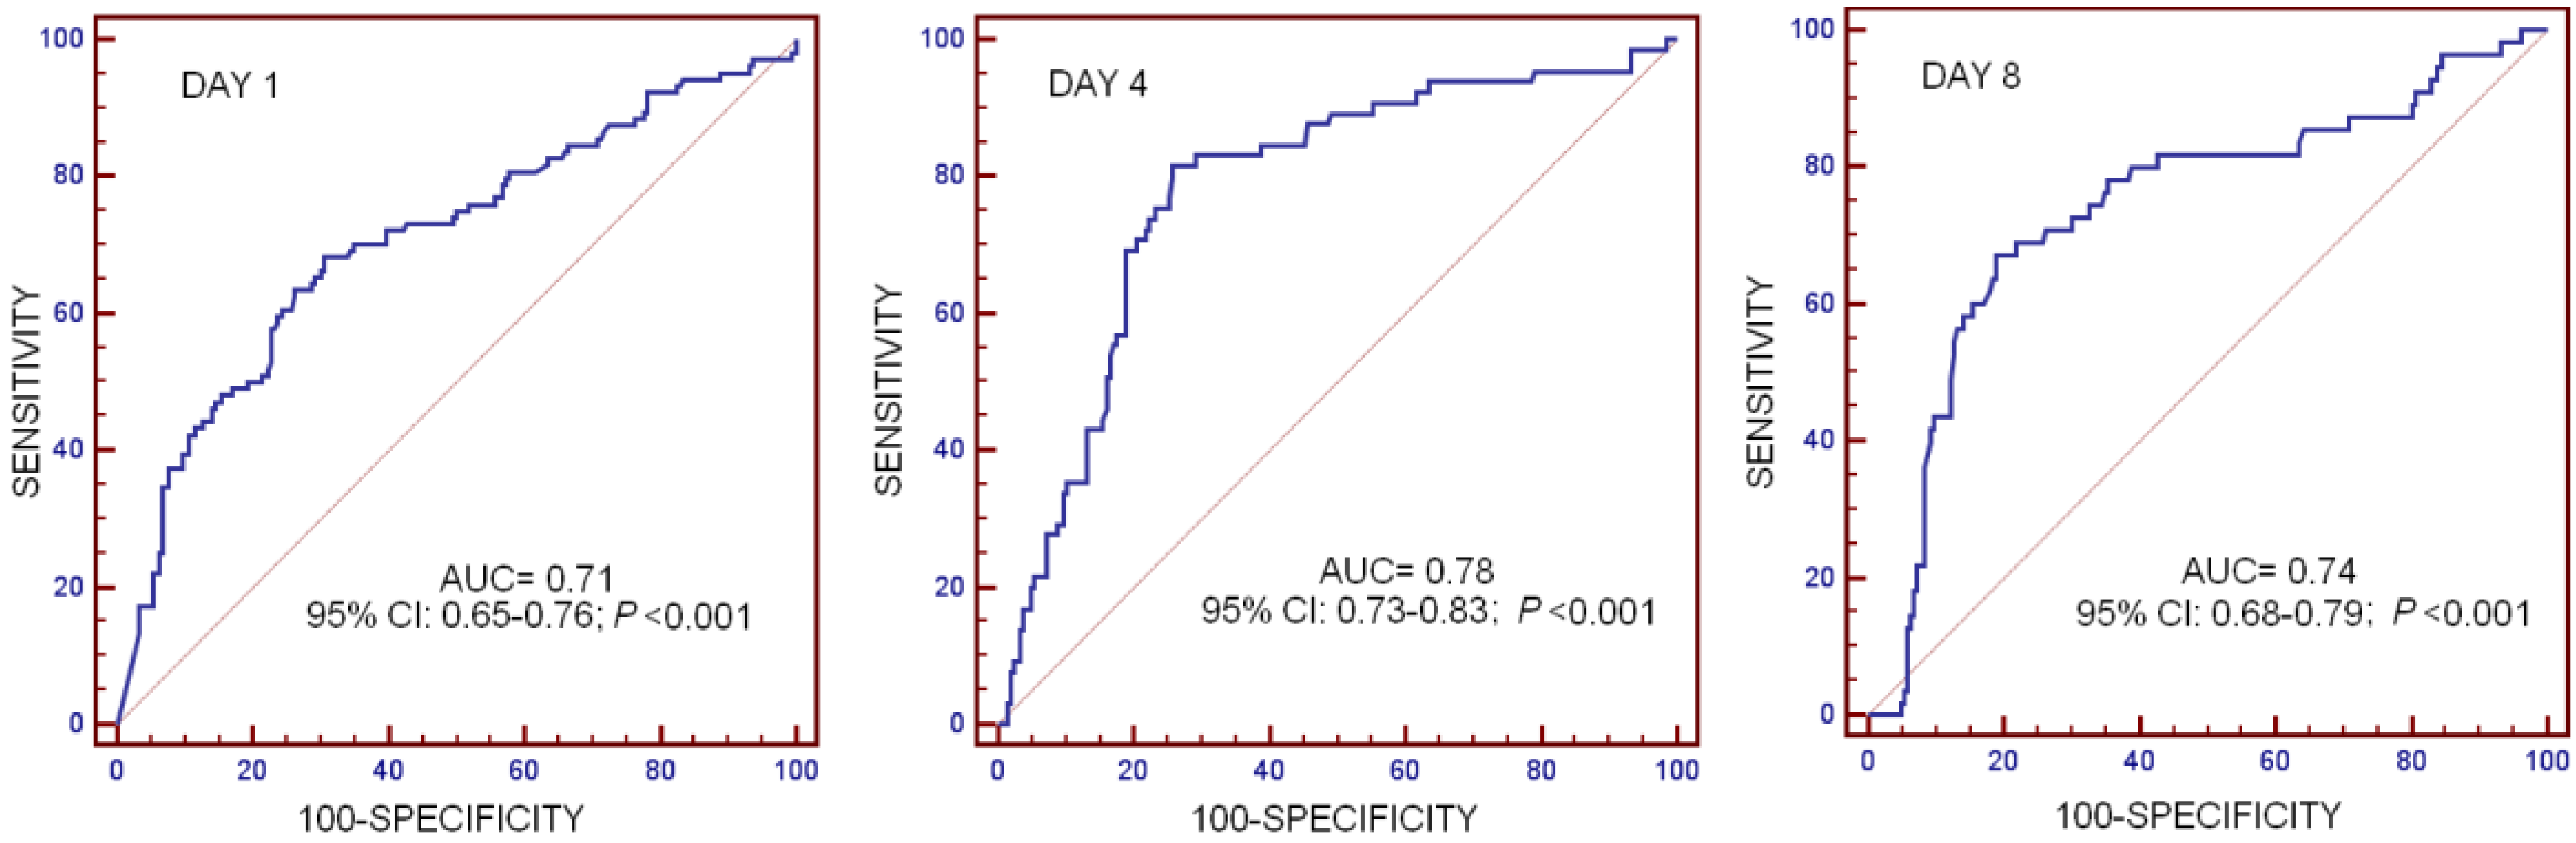
| Cut-off of Substance P (pg/mL) | <339 | <203 | <148 |
| AUC, 95% CI, and p-value | 0.71 (0.65–0.76) p < 0.001 | 0.78 (0.73–0.83) p < 0.001 | 0.74 (0.68–0.79) p < 0.001 |
| Sensitivity and 95% CI | 66.4 (56.4–75.3) | 81.5 (70.0–90.1) | 67.3 (53.3–79.3) |
| Specificity and 95% CI | 69.4 (62.6–75.6) | 74.3 (67.7–80.1) | 81.1 (75.0–86.2) |
| Positive likelihood ratio and 95% CI | 2.2 (1.7–2.8) | 3.2 (2.4–4.1) | 3.6 (2.5–5.0) |
| Negative likelihood ratio and 95% CI | 0.5 (0.4–0.6) | 0.3 (0.1–0.4) | 0.4 (0.3–0.6) |
| Positive predicted value and 95% CI | 52.3 (43.4–61.0) | 50.0 (40.1–59.9) | 48.7 (37.0–60.4) |
| Negative predicted value and 95% CI | 80.3 (73.7–85.9) | 92.7 (87.6–96.2) | 90.3 (85.1–94.1) |
| Header | Hazard Ratio | 95% Confidence Interval | p-Value |
|---|---|---|---|
| Model: Mortality estimated at day 1 | |||
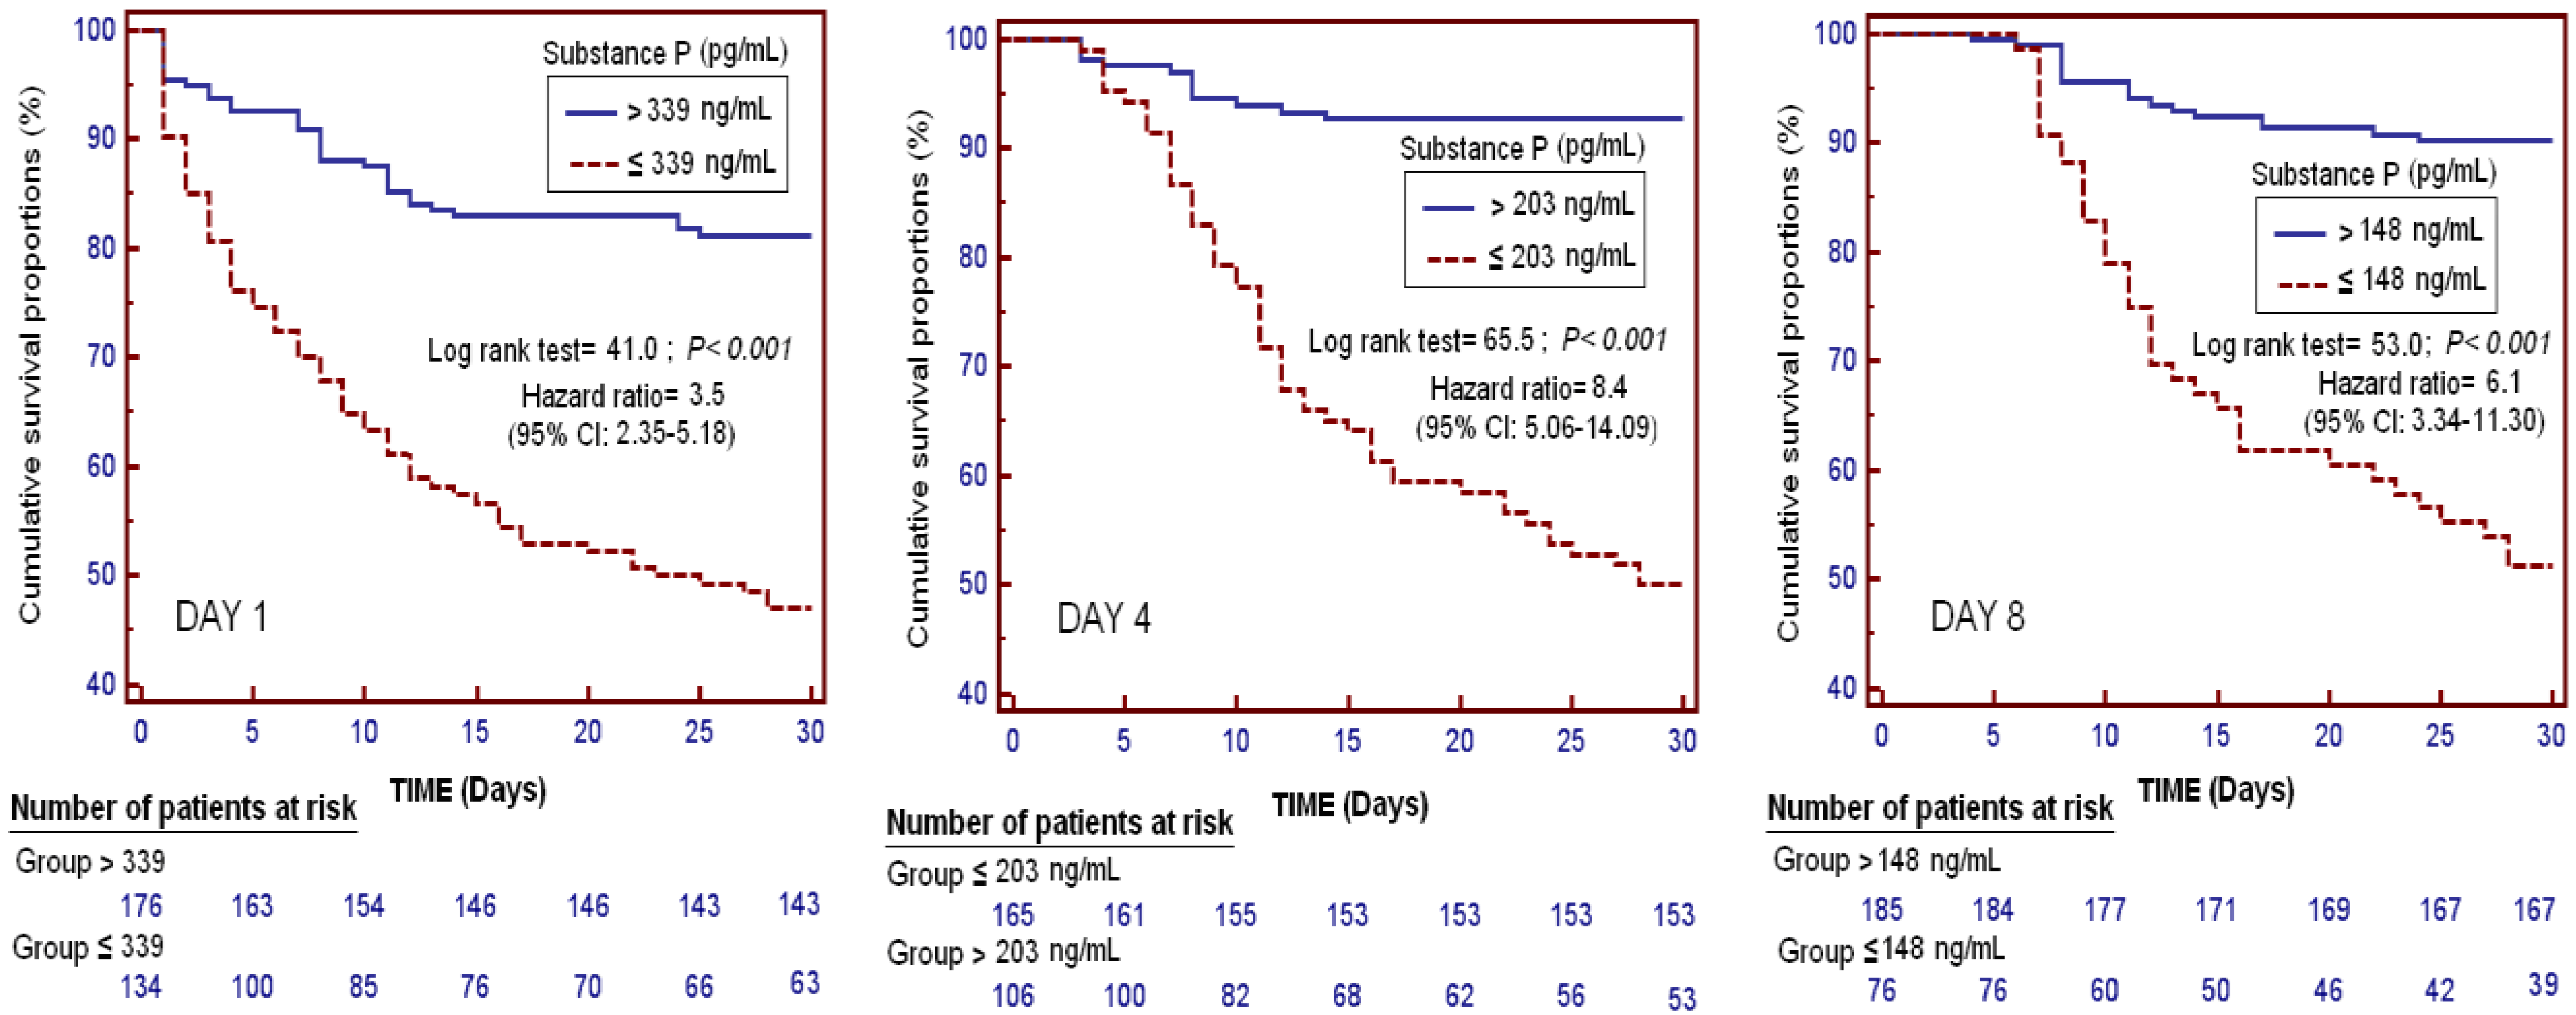
| SP levels < 339 pg/mL at day 1 | 4.296 | 2.470–7.471 | <0.001 |
| SOFA at day 1 | 1.165 | 1.070–1.267 | <0.001 |
| Lactic acid (mmol/L) at day 1 | 1.110 | 1.008–1.223 | 0.03 |
| Diabetes Mellitus | 1.789 | 0.989–3.237 | 0.055 |
| Age (years) | 1.022 | 1.002–1.042 | 0.03 |
| Model: Mortality estimated at day 4 | |||
| SP levels < 203 pg/mL at day 4 | 14.619 | 6.304–33.900 | <0.001 |
| SOFA at day 4 | 1.118 | 1.017–1.229 | 0.02 |
| Lactic acid (mmol/L) at day 4 | 1.652 | 1.241–2.198 | 0.001 |
| Diabetes Mellitus | 2.001 | 0.917–4.365 | 0.08 |
| Age (years) | 1.027 | 1.001–1.054 | 0.04 |
| Model: Mortality estimated at day 8 | |||
| SP levels < 148 pg/mL at day 8 | 6.003 | 2.711–13.290 | <0.001 |
| SOFA at day 8 | 1.212 | 1.111–1.323 | <0.001 |
| Lactic acid (mmol/L) at day 8 | 1.557 | 0.933–2.599 | 0.09 |
| Diabetes Mellitus | 1.669 | 0.734–3.793 | 0.22 |
| Age (years) | 1.026 | 0.997–1.056 | 0.08 |
© 2017 by the authors. Licensee MDPI, Basel, Switzerland. This article is an open access article distributed under the terms and conditions of the Creative Commons Attribution (CC BY) license (http://creativecommons.org/licenses/by/4.0/).
Share and Cite
Lorente, L.; Martín, M.M.; Pérez-Cejas, A.; Ferreres, J.; Solé-Violán, J.; Labarta, L.; Díaz, C.; Jiménez, A. Sustained Low Serum Substance P Levels in Non-Surviving Septic Patients. Int. J. Mol. Sci. 2017, 18, 1531. https://doi.org/10.3390/ijms18071531
Lorente L, Martín MM, Pérez-Cejas A, Ferreres J, Solé-Violán J, Labarta L, Díaz C, Jiménez A. Sustained Low Serum Substance P Levels in Non-Surviving Septic Patients. International Journal of Molecular Sciences. 2017; 18(7):1531. https://doi.org/10.3390/ijms18071531
Chicago/Turabian StyleLorente, Leonardo, María M. Martín, Antonia Pérez-Cejas, José Ferreres, Jordi Solé-Violán, Lorenzo Labarta, César Díaz, and Alejandro Jiménez. 2017. "Sustained Low Serum Substance P Levels in Non-Surviving Septic Patients" International Journal of Molecular Sciences 18, no. 7: 1531. https://doi.org/10.3390/ijms18071531