Article

The Prostate Cancer Cells Resistant to Docetaxel as in vitro Model for Discovering MicroRNAs Predictive of the Onset of Docetaxel Resistance

by
Lorenzo Bascetta
1,†,
Arianna Oliviero
1,†,
Romina D’Aurizio
2,
Monica Evangelista
1,
Alberto Mercatanti
1,
Marco Pellegrini
2,
Francesca Marrocolo
3,
Sergio Bracarda
3,4 and
Milena Rizzo
1,4,*
1
Non-Coding RNA Laboratory, Institute of Clinical Physiology (IFC), National Research Council (CNR), via G. Moruzzi 1, 56124 Pisa, Italy
2
Laboratory for Integrative System Medicine (LISM), Institute of Informatics and Telematics (IIT), National Research Council (CNR), via G. Moruzzi 1, 56124 Pisa, Italy
3
Department of Oncology, San Donato Hospital, Azienda USL Toscana Sud-Est, via P. Nenni 20, 52100 Arezzo, Italy
4
Istituto Toscano Tumori (ITT), via T. Alderotti 26/N, 50139 Firenze, Italy
*
Author to whom correspondence should be addressed.
These authors contributed equally to this work.
Int. J. Mol. Sci. 2017, 18(7), 1512; https://doi.org/10.3390/ijms18071512
Submission received: 19 June 2017 / Revised: 5 July 2017 / Accepted: 5 July 2017 / Published: 13 July 2017
(This article belongs to the Special Issue Diagnostic, Prognostic and Predictive Biomarkers in Prostate Cancer)

Abstract

:
On the grounds that miRNAs present in the blood of prostate cancer (PCa) patients are released in the growth medium by PCa cells, it is conceivable that PCa cells resistant to docetaxel (DCT) (DCTR) will release miRNAs that may be found in PCa patients under DCT therapy if resistant PCa cells appear. We isolated DCTR clones respectively from 22Rv1 and DU-145 PCa cell lines and performed through next-generation sequencing (NGS) the miRNAs profiles of the released miRNAs. The analysis of the NGS data identified 105 and 1 miRNAs which were differentially released in the growth medium of the 22Rv1/DCTR and DU-145/DCTR clones, respectively. Using additional filters, we selected 12 and 1 miRNA more released by all 22Rv1/DCTR and DU-145/DCTR clones, respectively. Moreover, we showed that 6 of them were more represented in the growth medium of the DCTR cells than the ones of DCT-treated cells. We speculated that they have the pre-requisite to be tested as predictive biomarkers of the DCT resistance in PCa patients under DCT therapy. We propose the utilization of clones resistant to a given drug as in vitro model to identify the differentially released miRNAs, which in perspective could be tested as predictive biomarkers of drug resistance in tumor patients under therapy.

Graphical Abstract

1. Introduction

Prostate cancer (PCa) evolves into a condition known as castration-resistant prostate cancer (CRPC) when the androgen deprivation therapy fails. At this stage, docetaxel (DCT) represents the gold standard treatment [1]. Unfortunately, most patients develop resistance to the drug within a year from the beginning of the therapy, and the disease progresses [2]. The identification of biomarkers capable to predict in advance the onset of the DCT resistance could facilitate the shift towards alternative effective therapies, thus increasing the life expectancy of the patients.
MicroRNAs (miRNAs), and more recently circulating miRNAs (c-miRNA), have been proposed as molecules with a diagnostic and prognostic value for PCa [3,4] but only few studies explored c-miRNAs as predictive biomarker of DCT resistance [5,6].
We have already reported that PCa cells in vitro specifically released in the growth medium the same miRNAs found in the peripheral blood of PCa patients [7]. Therefore, it is conceivable that PCa cells resistant to DCT will release in the growth medium miRNAs that, if detected in the blood of PCa patients, could reveal the presence of DCT-resistant cells. To approach the problem, we isolated PCa cells resistant to DCT and used the next-generation sequencing (NGS) technology and bioinformatics tools to identify miRNAs differentially released in the growth medium by DCT-resistant cells (DCTR-miRNAs). We also discussed that DCTR-miRNAs may represent potential predictive biomarkers of the DCT resistance suitable to be tested in PCa patients under DCT therapy.

2. Results

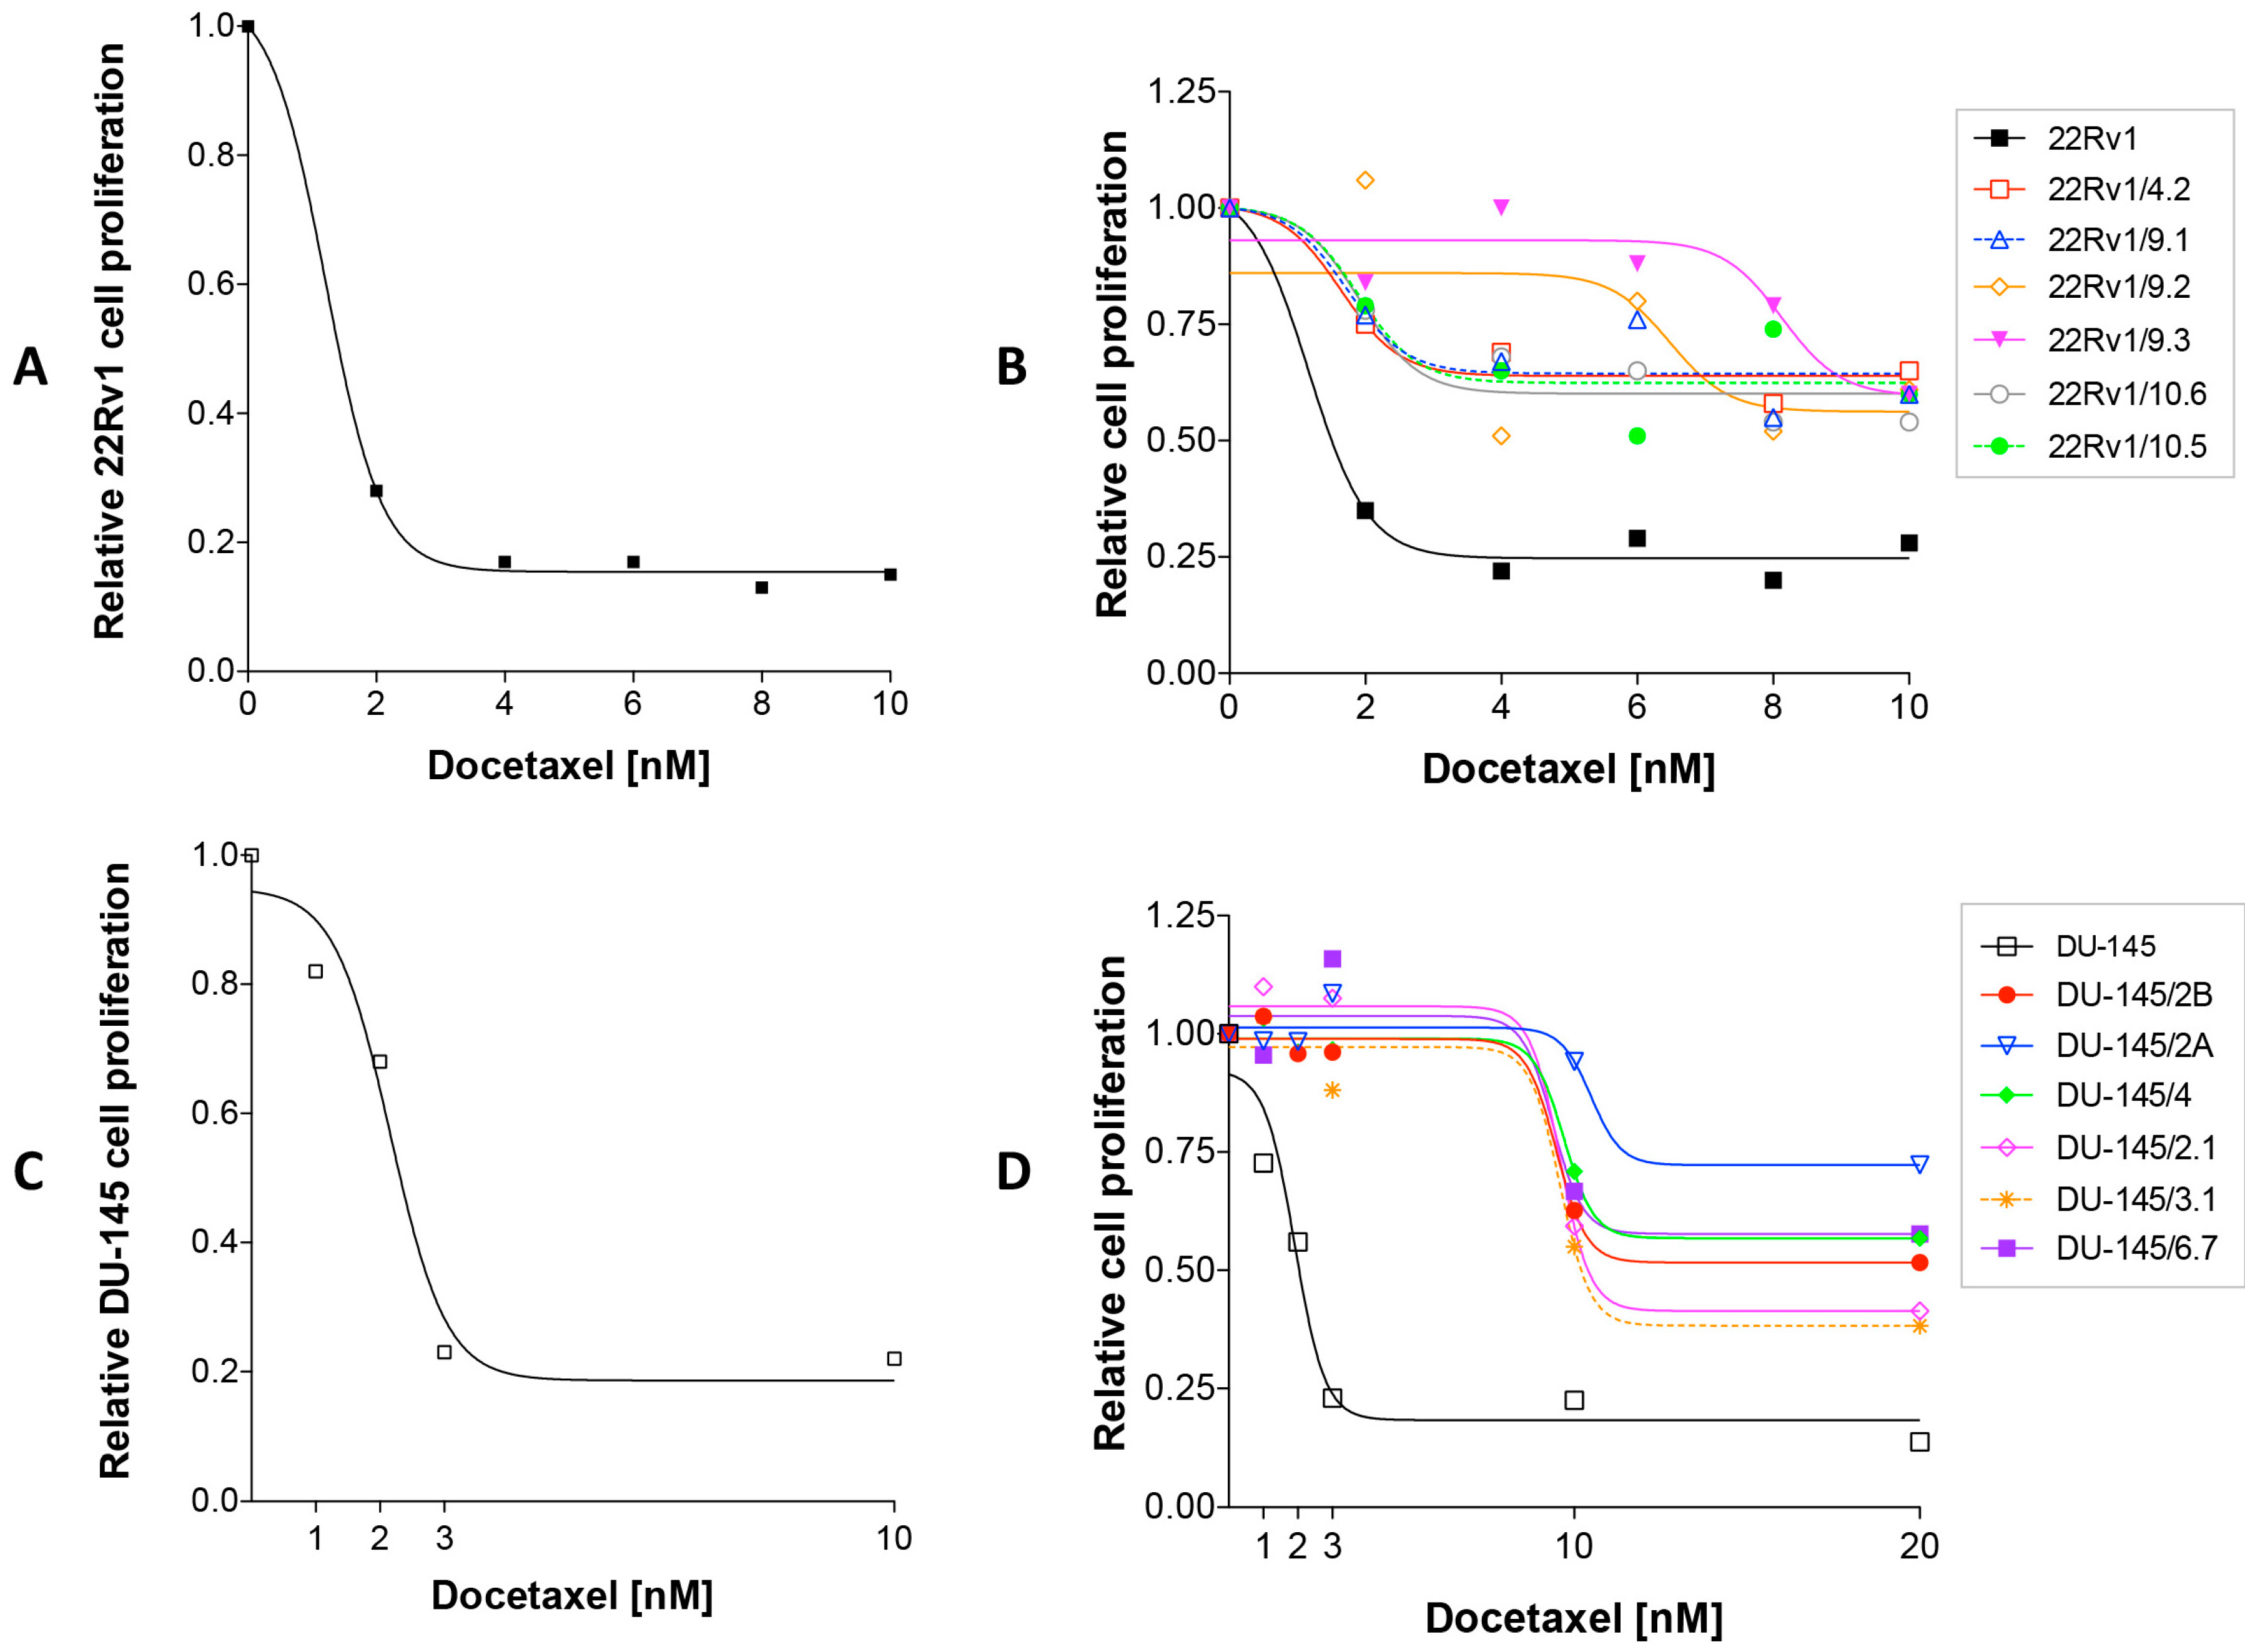
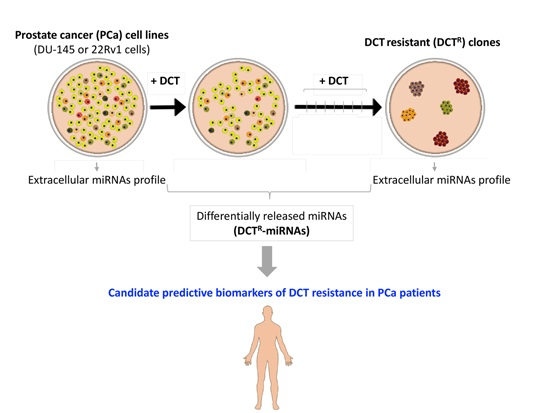
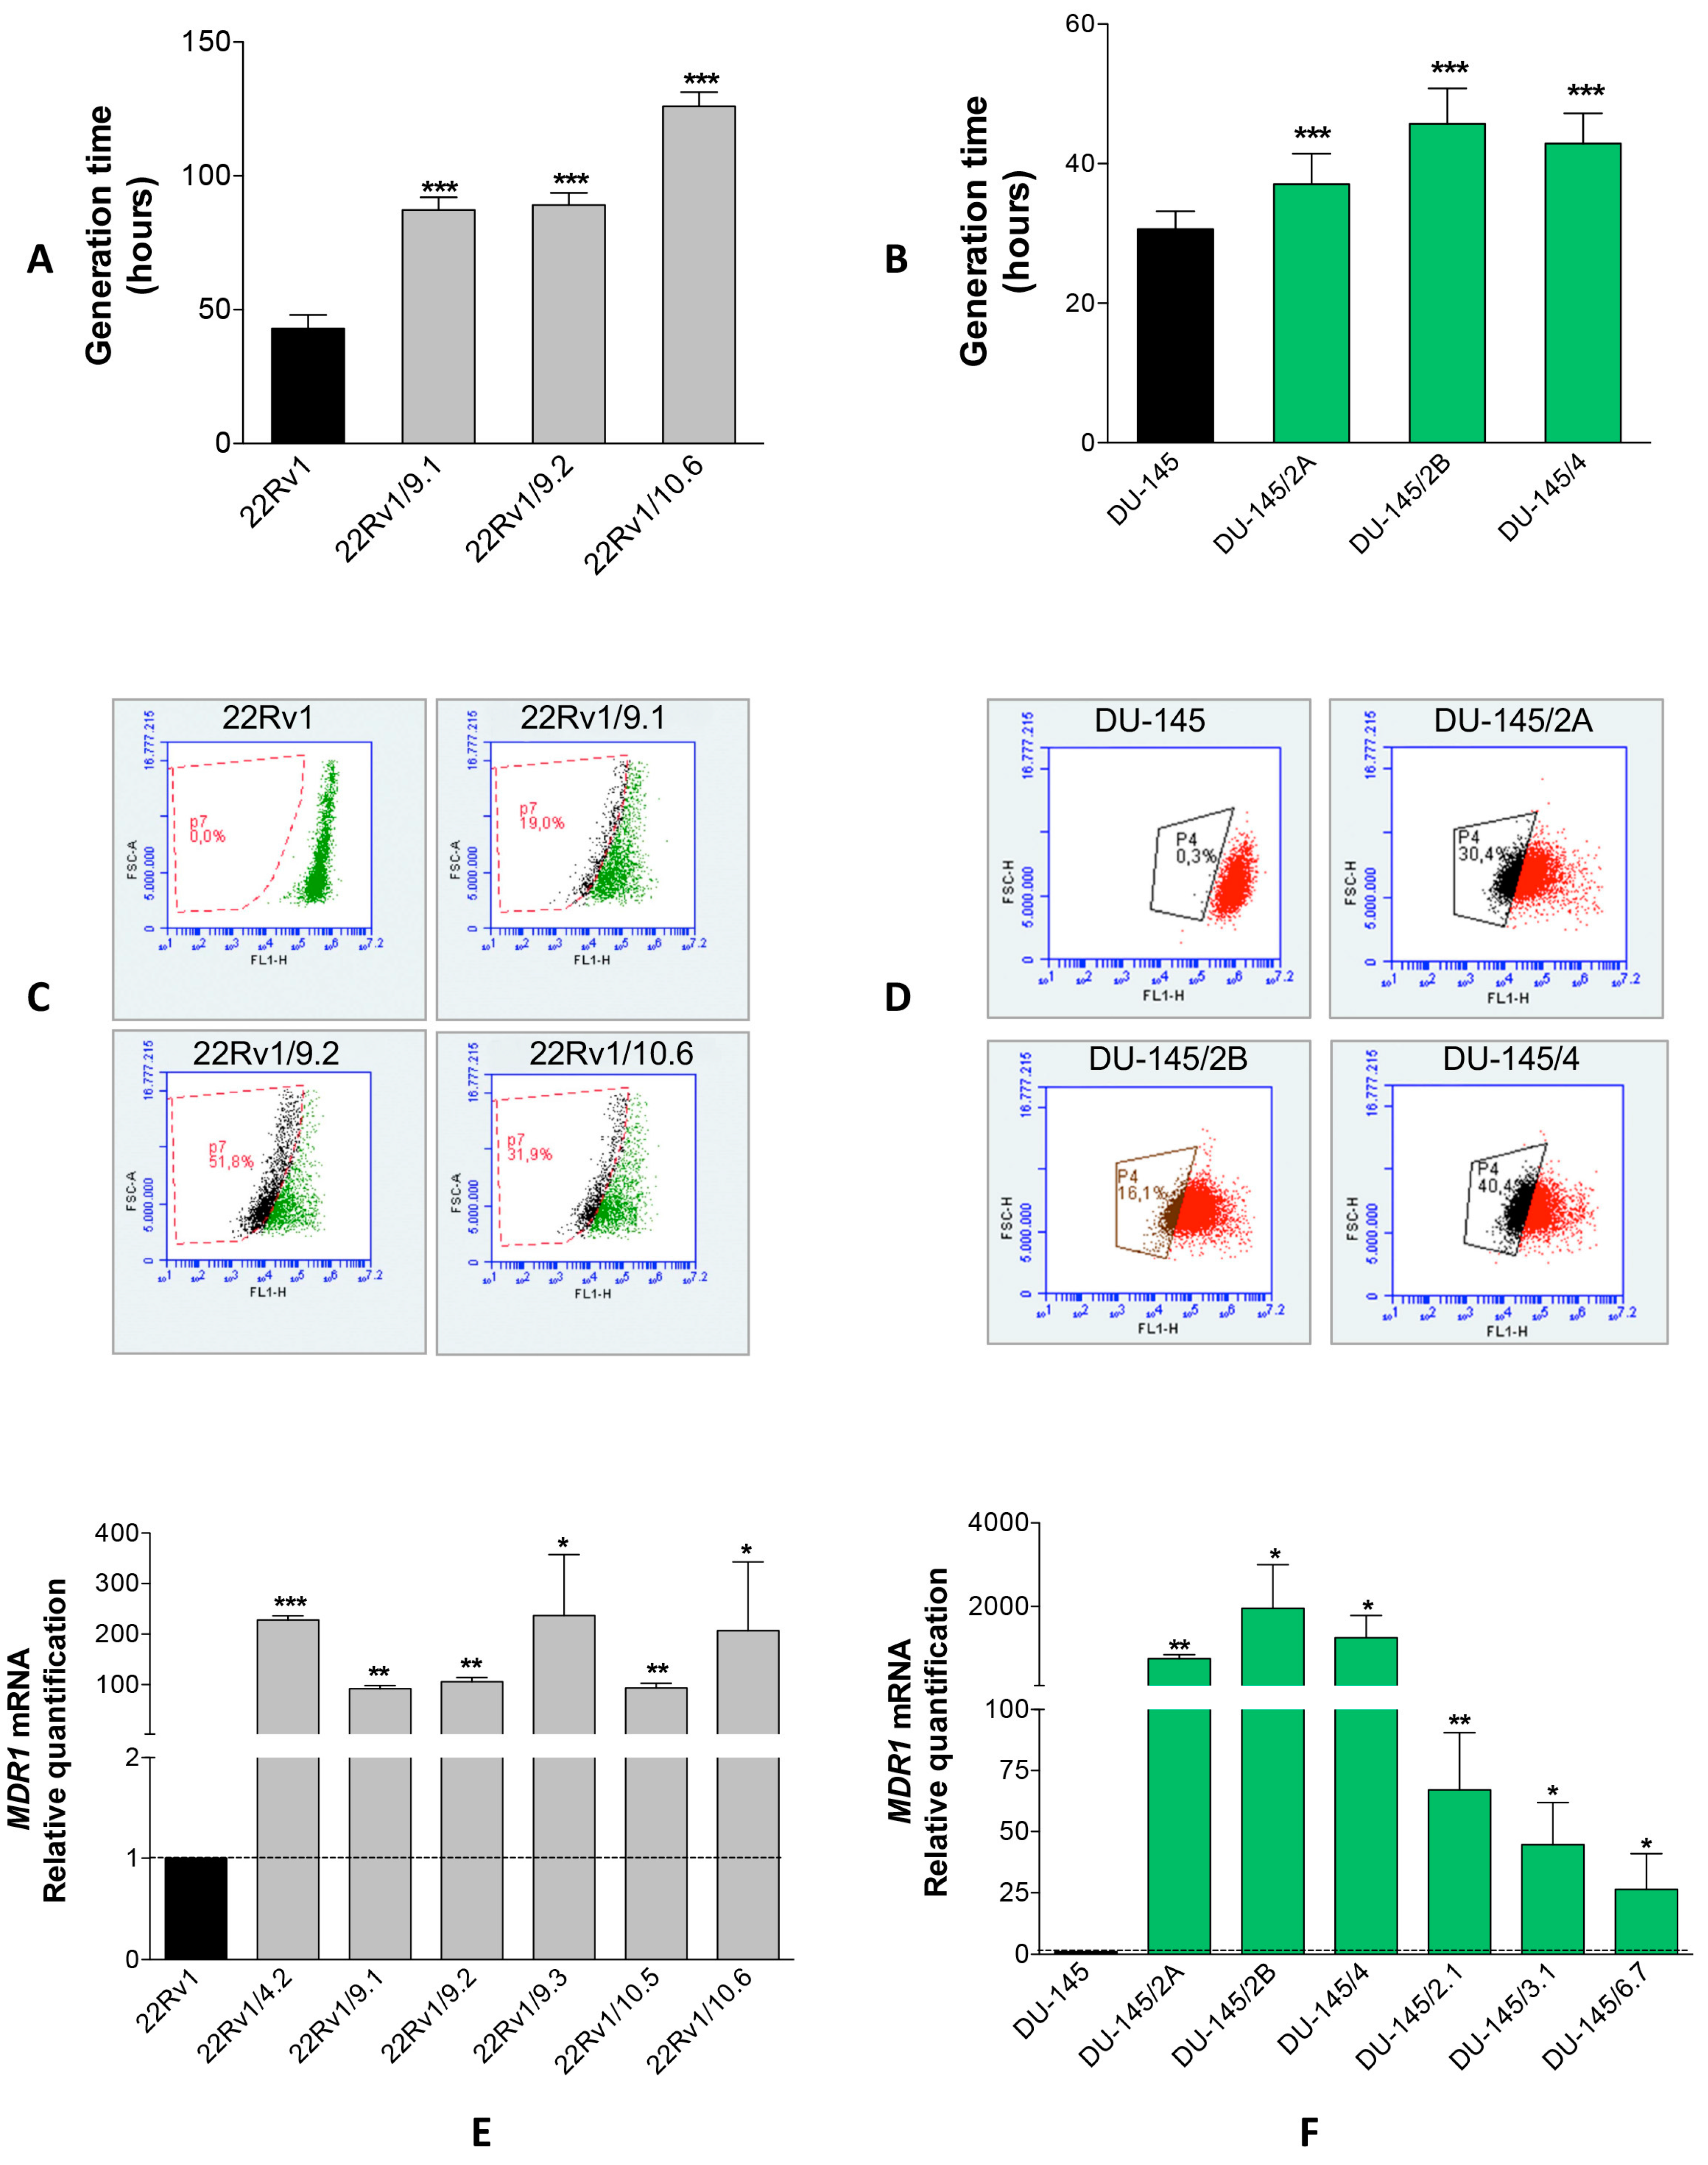
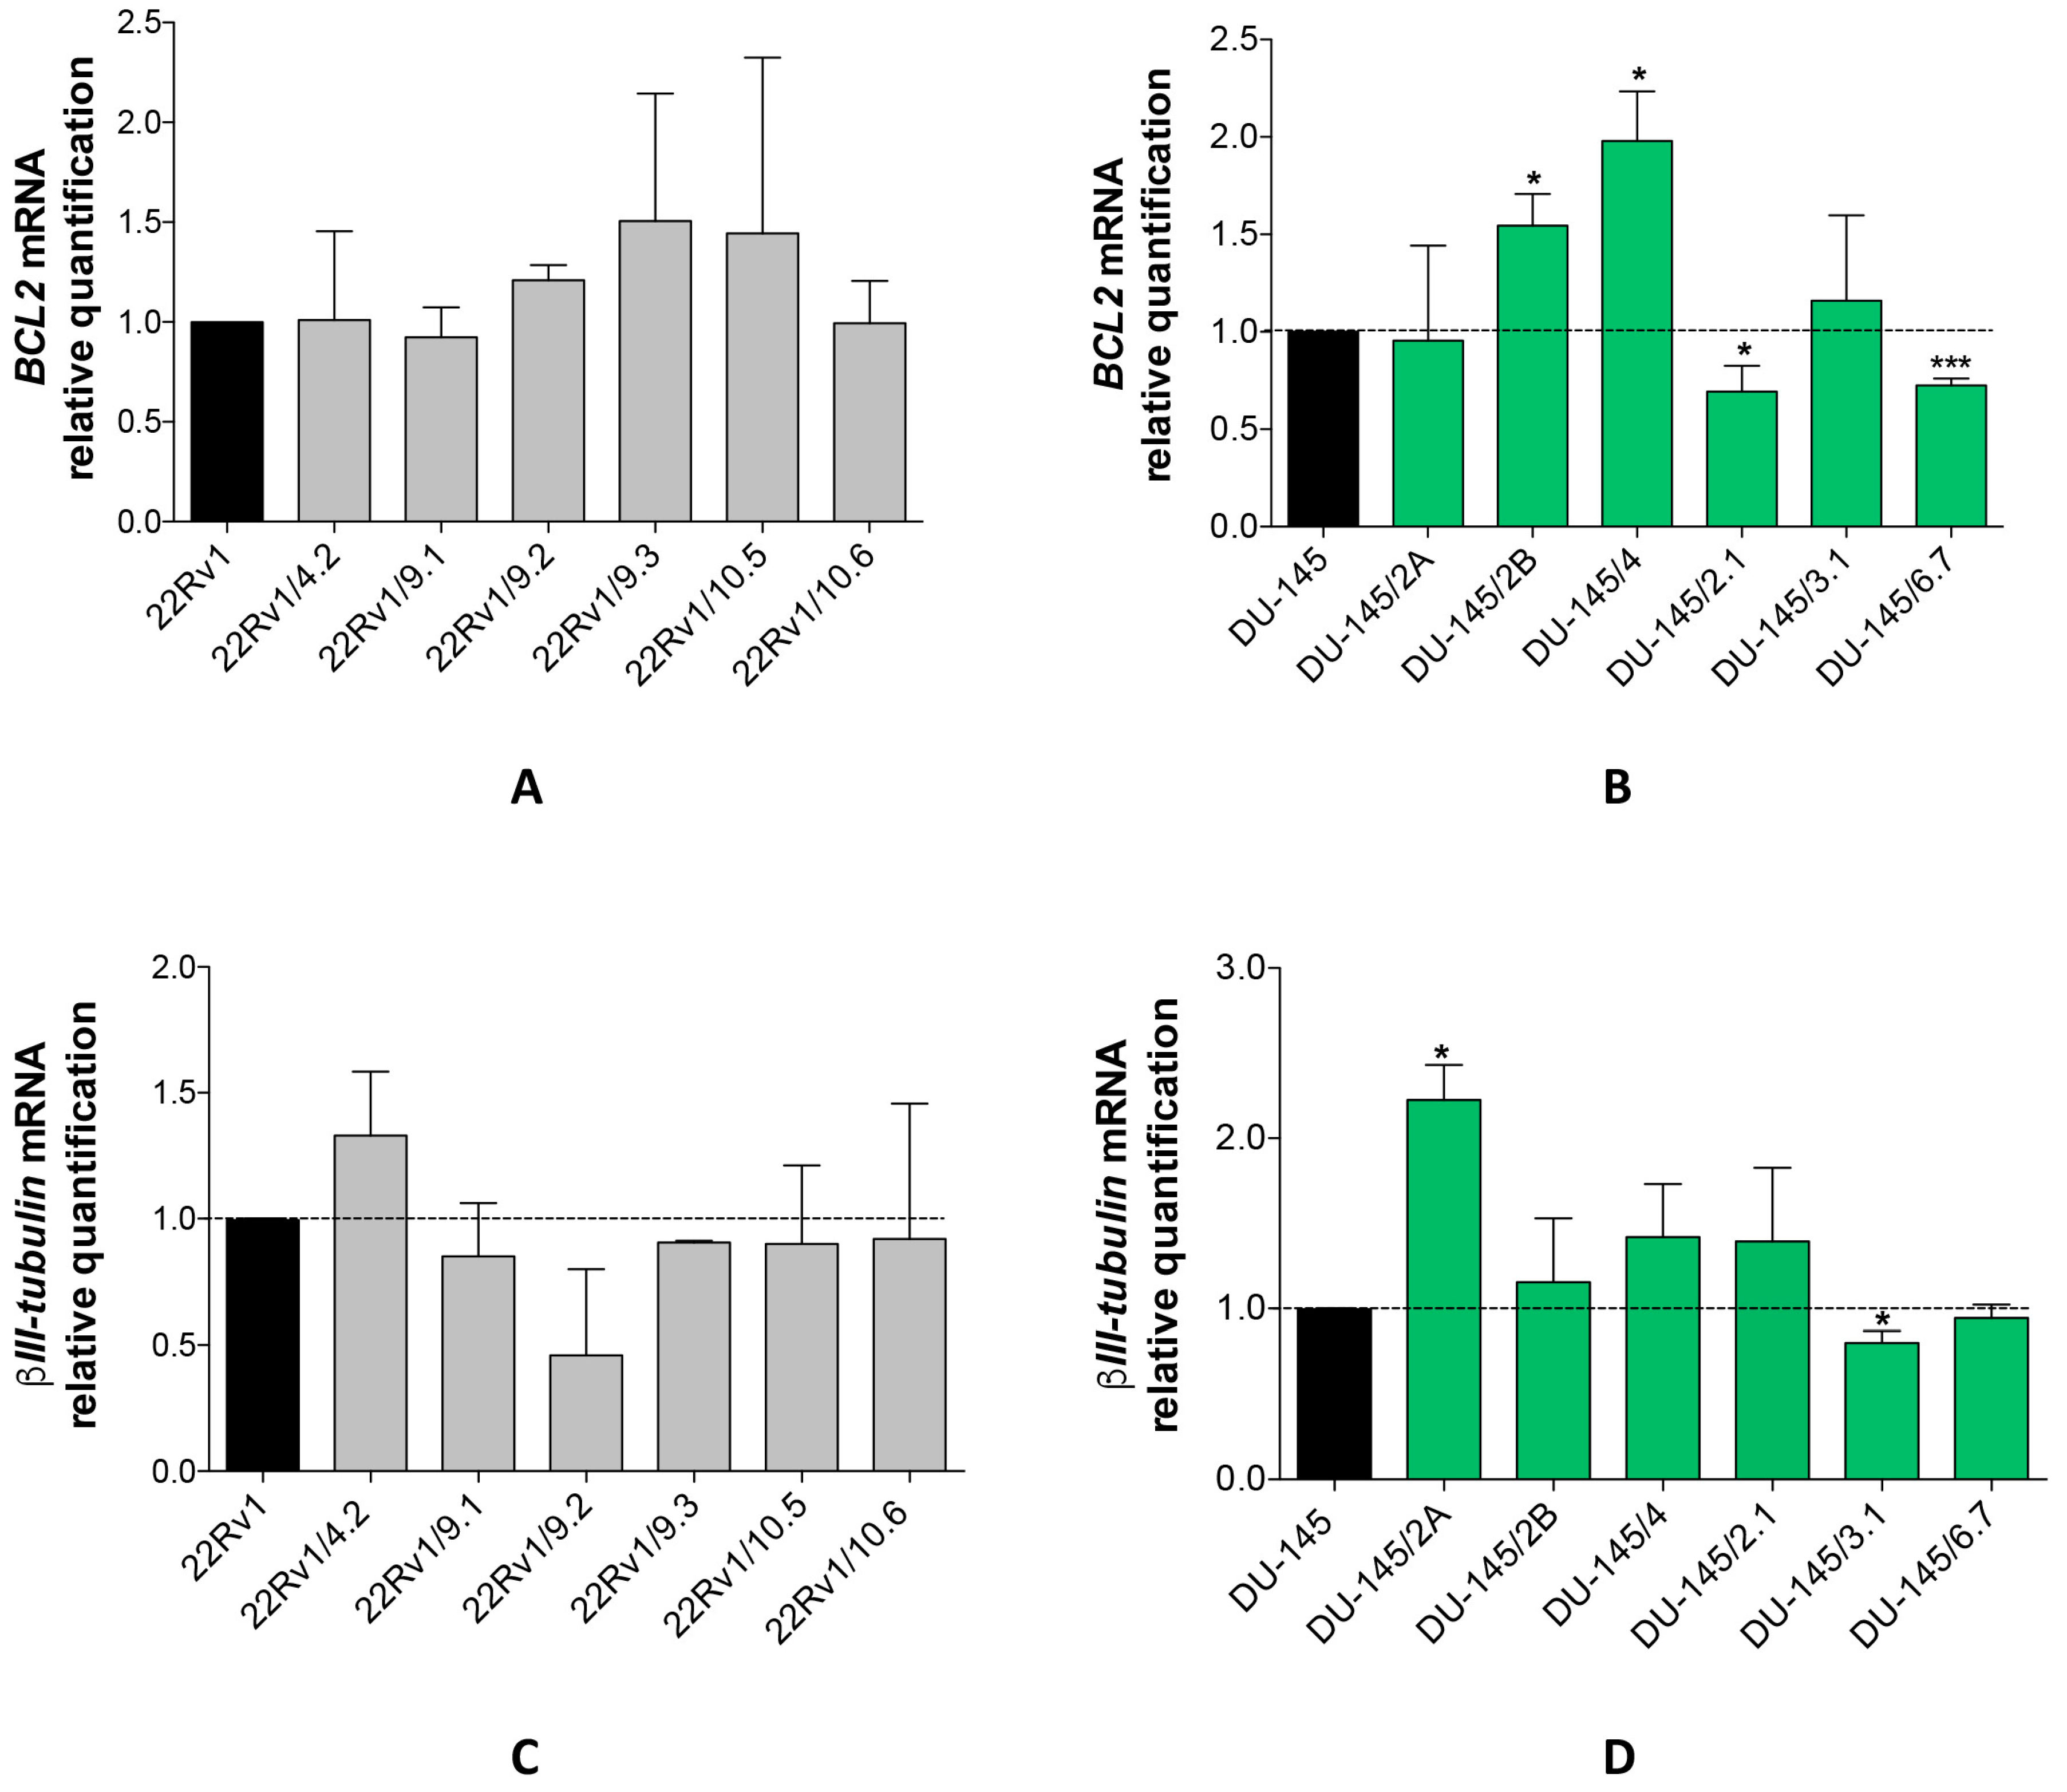
2.1. Isolation of DCTR Clones from 22Rv1 and DU-145 Prostate Cancer Cell Lines

We exposed for three days either 22Rv1 or DU-145 PCa cells to increasing concentrations of DCT and observed a dose-dependent inhibition of cell proliferation which reached a plateau phase at 4 nM concentration and 3 nM, respectively (Figure 1A,C). We then grew continuously 22Rv1 cells and DU-145 cells respectively in 4 nM and 3 nM DCT-containing medium until we observed colonies presumably resistant to DCT. We isolated and expanded as clones 6 independent colonies from both 22Rv1 cells (22Rv1/DCTR clones) and DU-145 cells (DU-145/DCTR clones). Afterwards, we tested them for the DCT resistance. We treated cells with increasing DCT concentration and showed that 22Rv1/DCTR and DU-145/DCTR clones were more resistant to DCT with respect to parental cell lines (Figure 1B,D).
In addition, we showed that 22Rv1/DCTR as well as DU-145/DCTR clones presented expanded generation times (Figure 2A,B) and an acquired capability to extrude Rhodamine 123 (Figure 2C,D). These results, together with the upregulation of MDR1 gene (Figure 2E,F), indicated that the drug export increase through the ABC transporters was at the basis of the DCT resistance in all clones. We tested also the expression of BCL2 and βIII tubulin genes, whose upregulation is involved in the DCT resistance in PCa [8,9].
It is worth noting that while in 22Rv1/DCTR clones the expression level of both BCL2 (Figure 3A) and βIII tubulin (Figure 3B) genes did not change, these genes showed slight but significant variations in DU-145/DCTR clones. In particular, BCL2 was upregulated in DU-145/2B and DU-145/4 clones and downregulated in DU-145/2.1 and DU-145/6.7 clones (Figure 3B). In addition, βIII tubulin gene was upregulated in DU-145/2A clones and downregulated in DU-145/3.1 clones (Figure 3D).

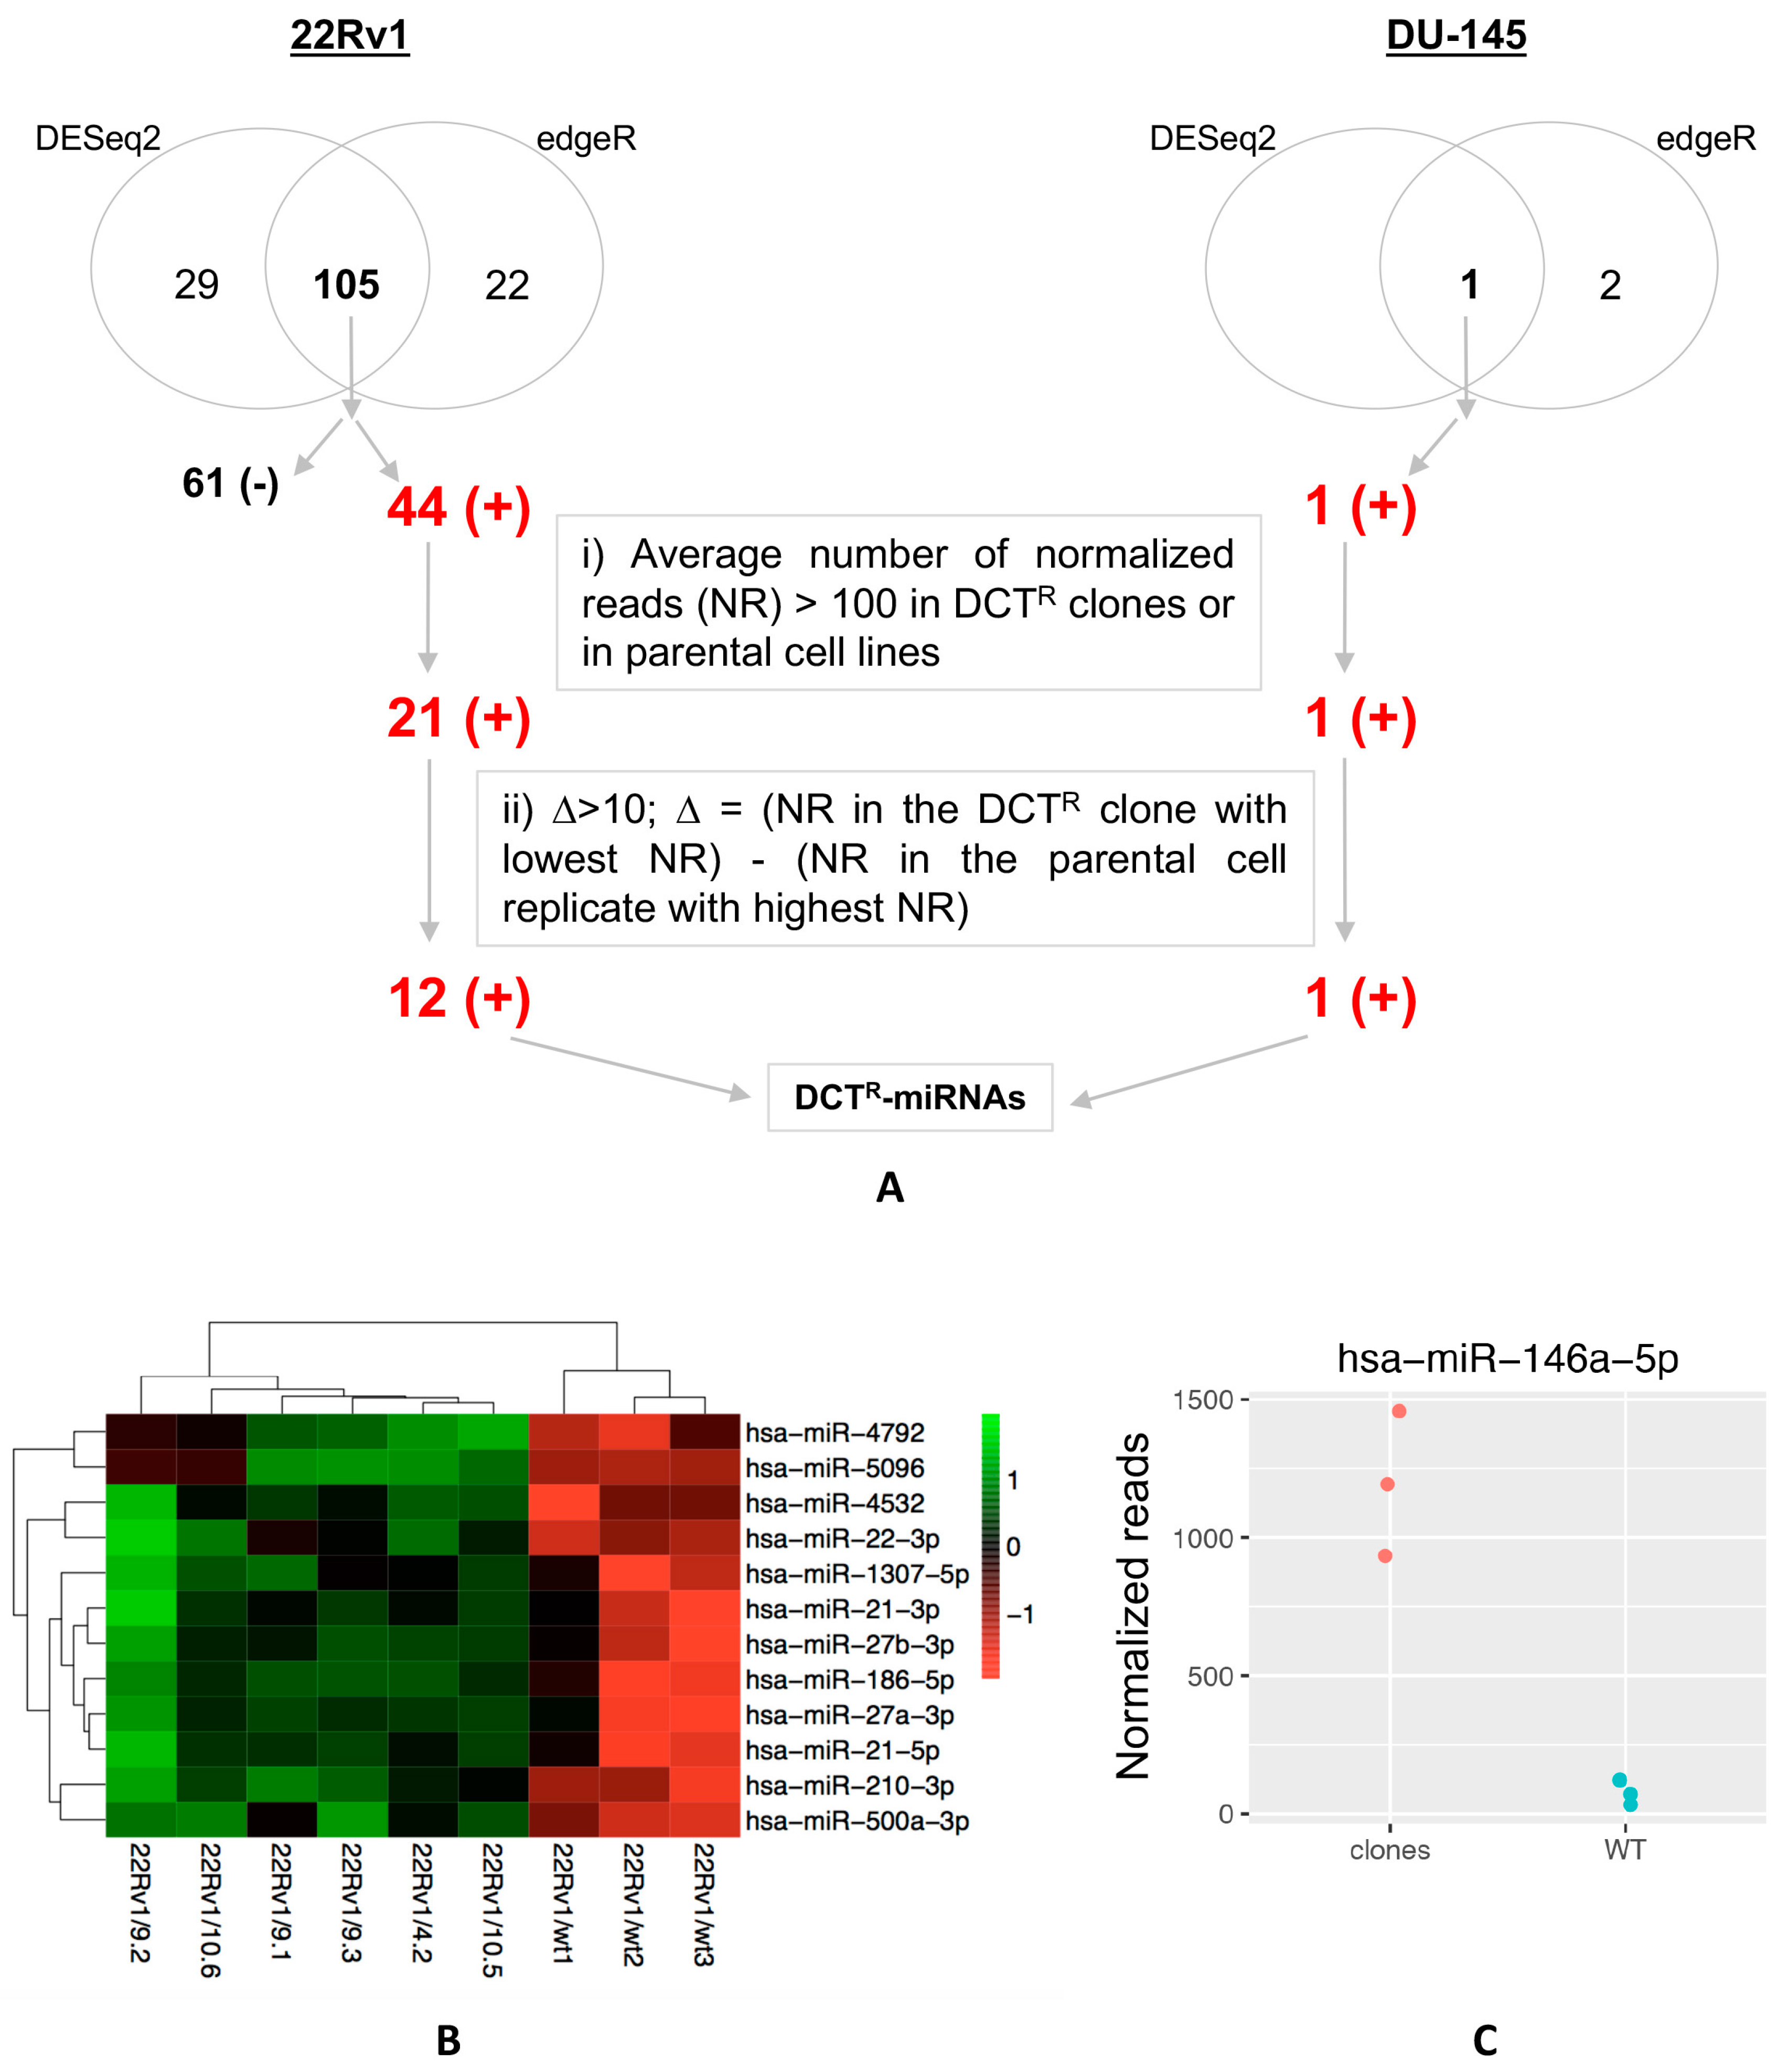
2.2. Identification of miRNAs Differentially Released by DCTR Clones

We collected the growth medium of each 22Rv1/DCTR and DU-145/DCTR clone as well as the one of parental cells and performed the miRNAs expression profile using next-generation sequencing (small RNA-seq). We conducted the differential analysis to identify, for each PCa cell line, the miRNAs that were differentially released with a statistical significance from all DCTR clones with respect to the corresponding parental cells. The analysis was performed using two different methods, i.e., DESeq2 and edgeR. For DU-145/DCTR clones, the small RNA-seq experiment was conducted in two different runs. To test whether the experiment could suffer a batch effect on distribution of detected miRNAs, we performed a principal component analysis and observed a significant bias (Figure S1). Therefore, for DU-145/DCTR clones, we use an additive model formula in the design formula of DESeq2 and edgeR. We identified 134 (with DESeq2) and 127 (with edgeR) miRNAs differentially released (FDR ≤ 0.01) by 22Rv1/DCTR clones (Table S1) and 1 (with DESeq2) and 3 (with edgeR) miRNAs differentially released (FDR ≤ 0.01) by DU-145/DCTR clones (Table S2). We then considered only the miRNAs identified by both algorithms which were 105 miRNAs for 22Rv1/DCTR clones (44 more released miRNAs, 61 retained/less released miRNAs) and 1 more released miRNA for DU-145/DCTR clones (Figure 4A). We then focused on miRNAs more released (red in Figure 4A) and we selected those whose average number of normalized reads (NR) in all 22Rv1/DCTR (or DU-145/DCTR) clones or in the corresponding parental cells was greater than 100 (Figure 4A, box i). Among them, we selected those with a difference greater than 10 NR (∆ > 10) between the clone with the lowest value and the biological replicate of the parental cells with the highest value (Figure 4A, box ii). Thus, we identified 12 miRNAs for 22Rv1/DCTR clones (Figure 4B) and 1 miRNA (miR-146a-5p) for DU-145/DCTR clones (Figure 4C and Figure S2).
Finally, we validated the expression of these miRNAs (DCTR-miRNAs) in the growth medium of both 22Rv1/DCTR and DU-145/DCTR clones by qRT-PCR. With the exception of miR-1307-5p (whose level showed a slight change), the levels of all DCTR-miRNAs were higher in the growth medium of the DCTR clones (Figure 5A,B) thus confirming the NGS data.

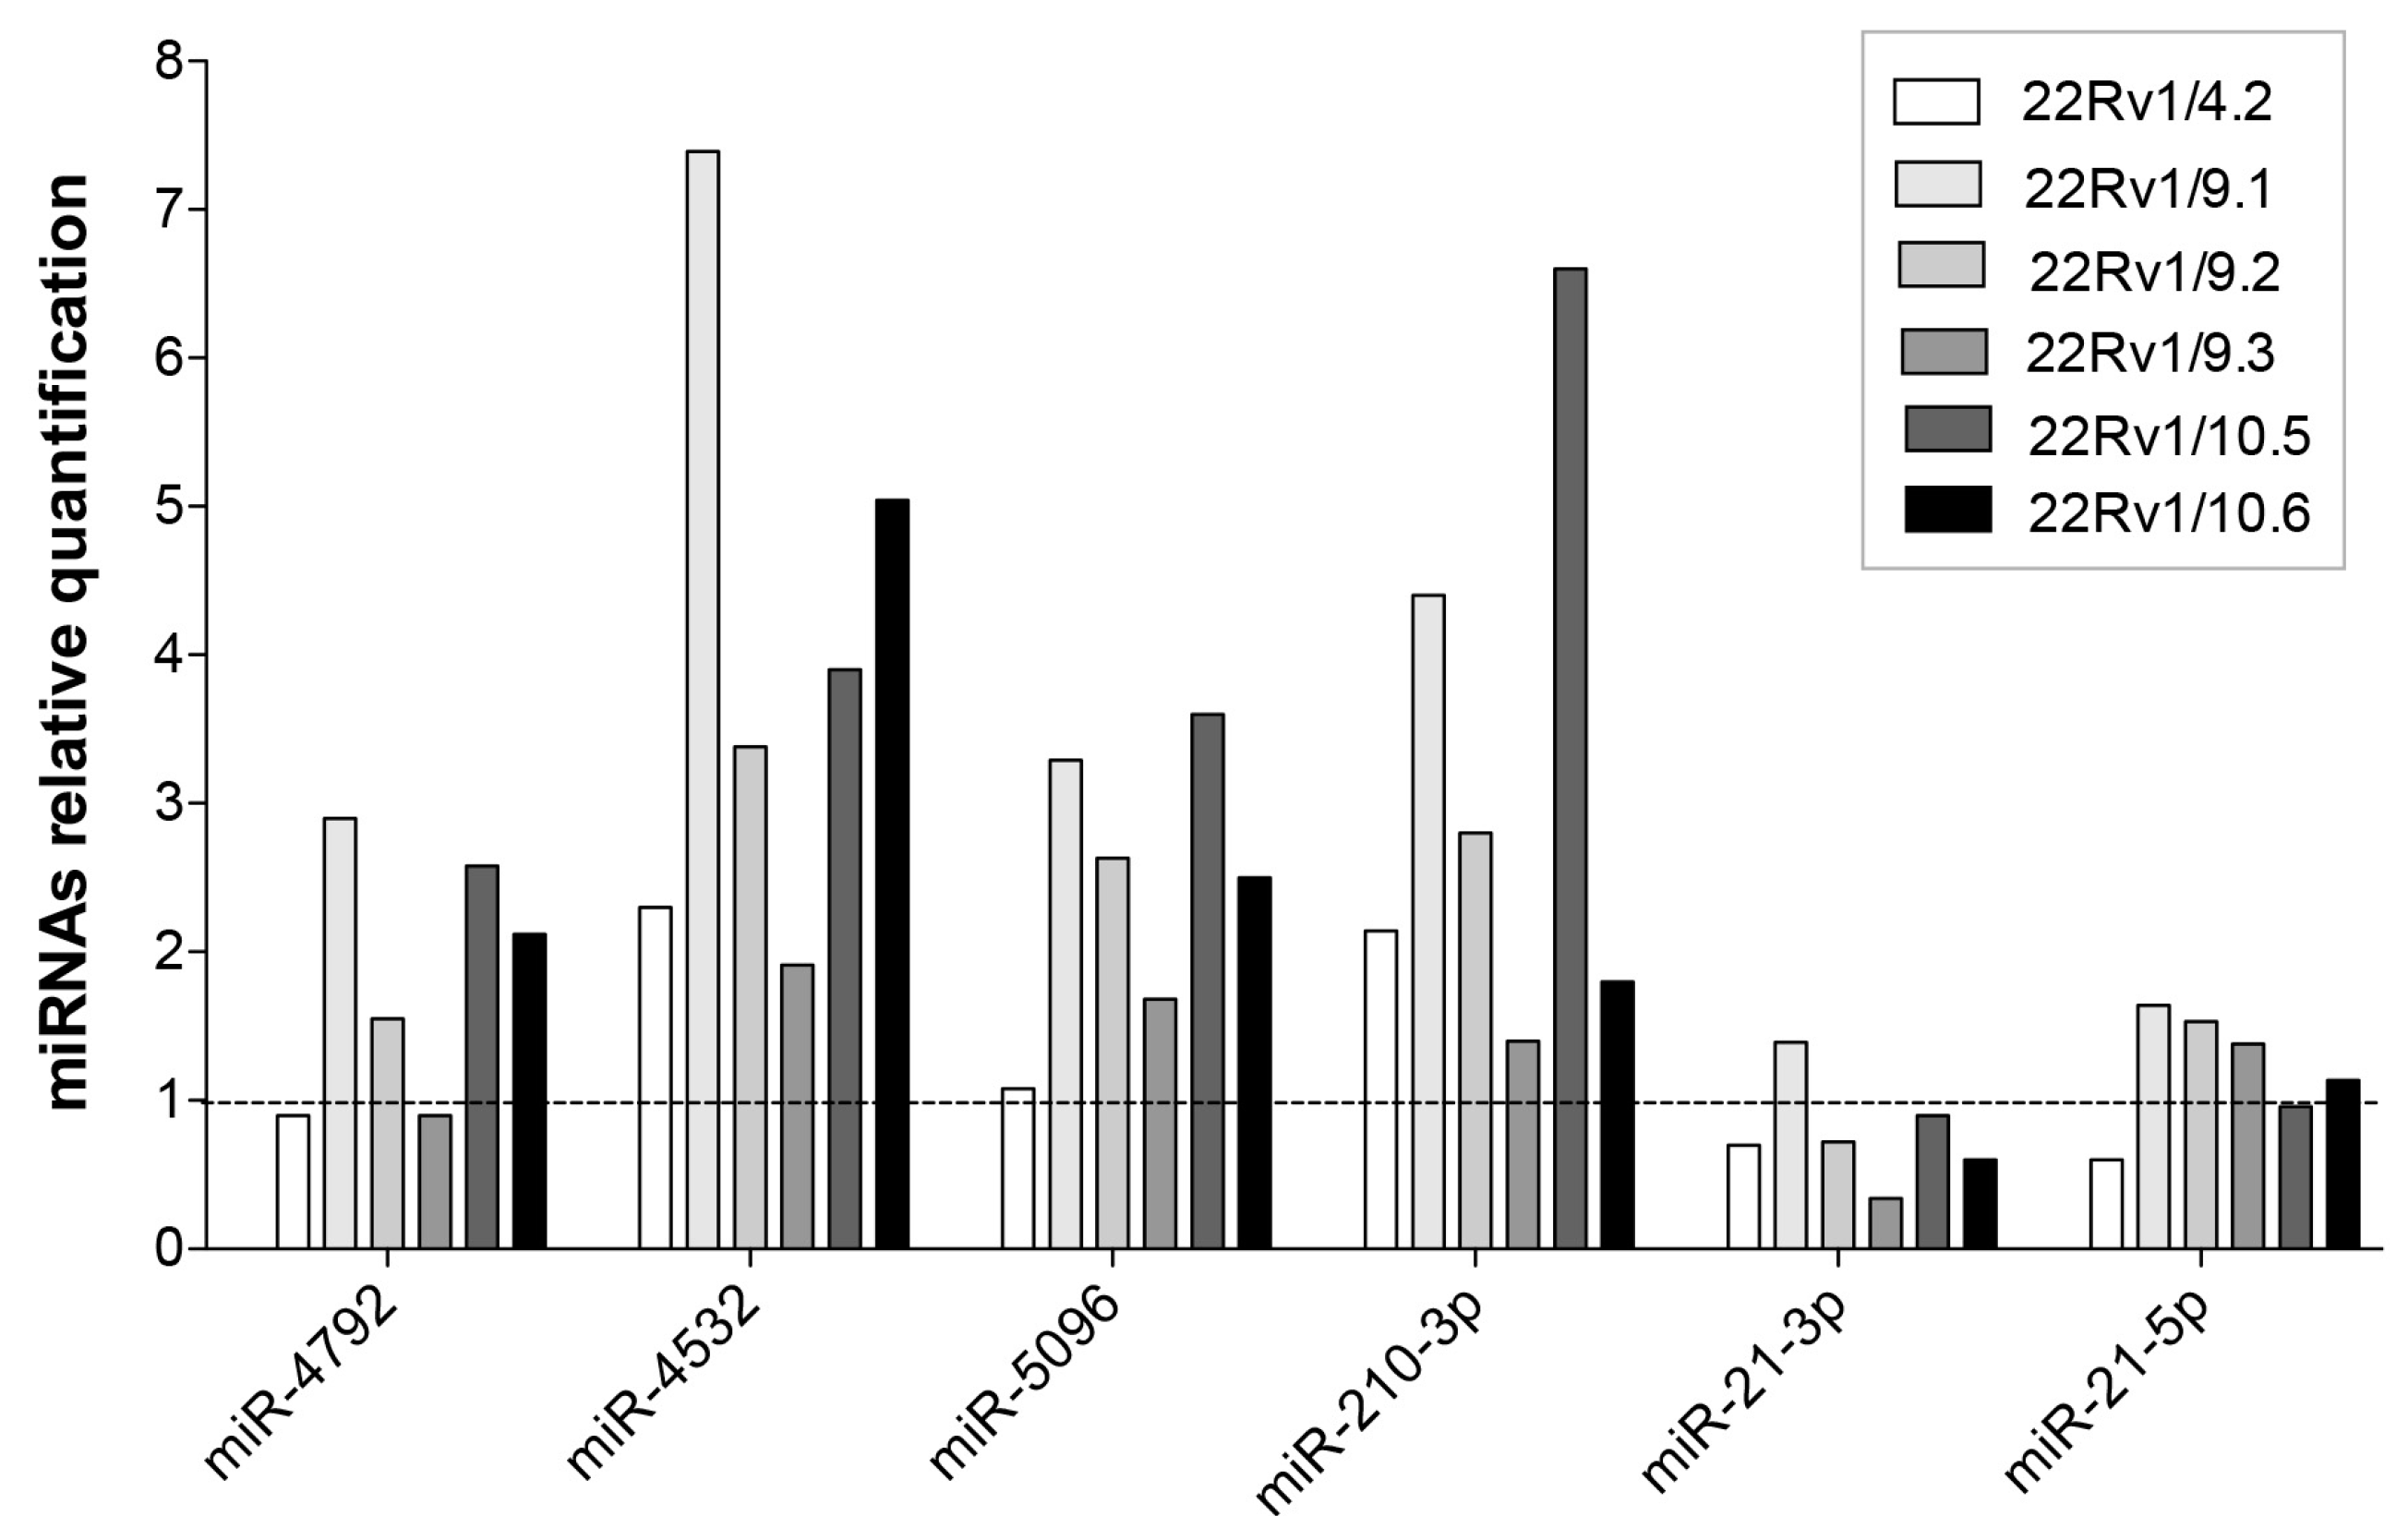
2.3. DCTR-miRNAs as Possible Biomarkers of DCT Resistance

To evaluate whether the level of the DCTR-miRNAs was affected by DCT, we measured by qRT-PCR the level of the 12 DCTR-miRNAs in the growth medium of parental cells (22Rv1 or DU-145) treated for three days with DCT and we calculated the fold change of these miRNAs in comparison to that found in the growth medium of untreated cells (column B, Table 1). Then, we evaluated the mean fold change of the DCTR-miRNAs (measured by qRT-PCR) in the growth medium of 22Rv1/DCTR or DU-145/DCTR clones with respect to that of the corresponding parental cells line (column A, Table 1). Finally, for each DCTR-miRNAs, we calculate the ratio between the fold change value of DCT-treated versus untreated cells and the mean fold change of DCTR-miRNA in 22Rv1/DCTR or DU-145/DCTR clones versus parental cells (column A/column B, Table 1). We observed that the level of 6 DCTR-miRNAs was similar in cells either resistant to or treated with DCT, whereas the level of the remaining 6 DCTR-miRNAs was higher (more than 2-fold) in cells resistant to DCT versus cells treated with DCT (Table 1, miRNAs underlined and in bold), suggesting that their differential release was specific of the DCT-resistant phenotype.

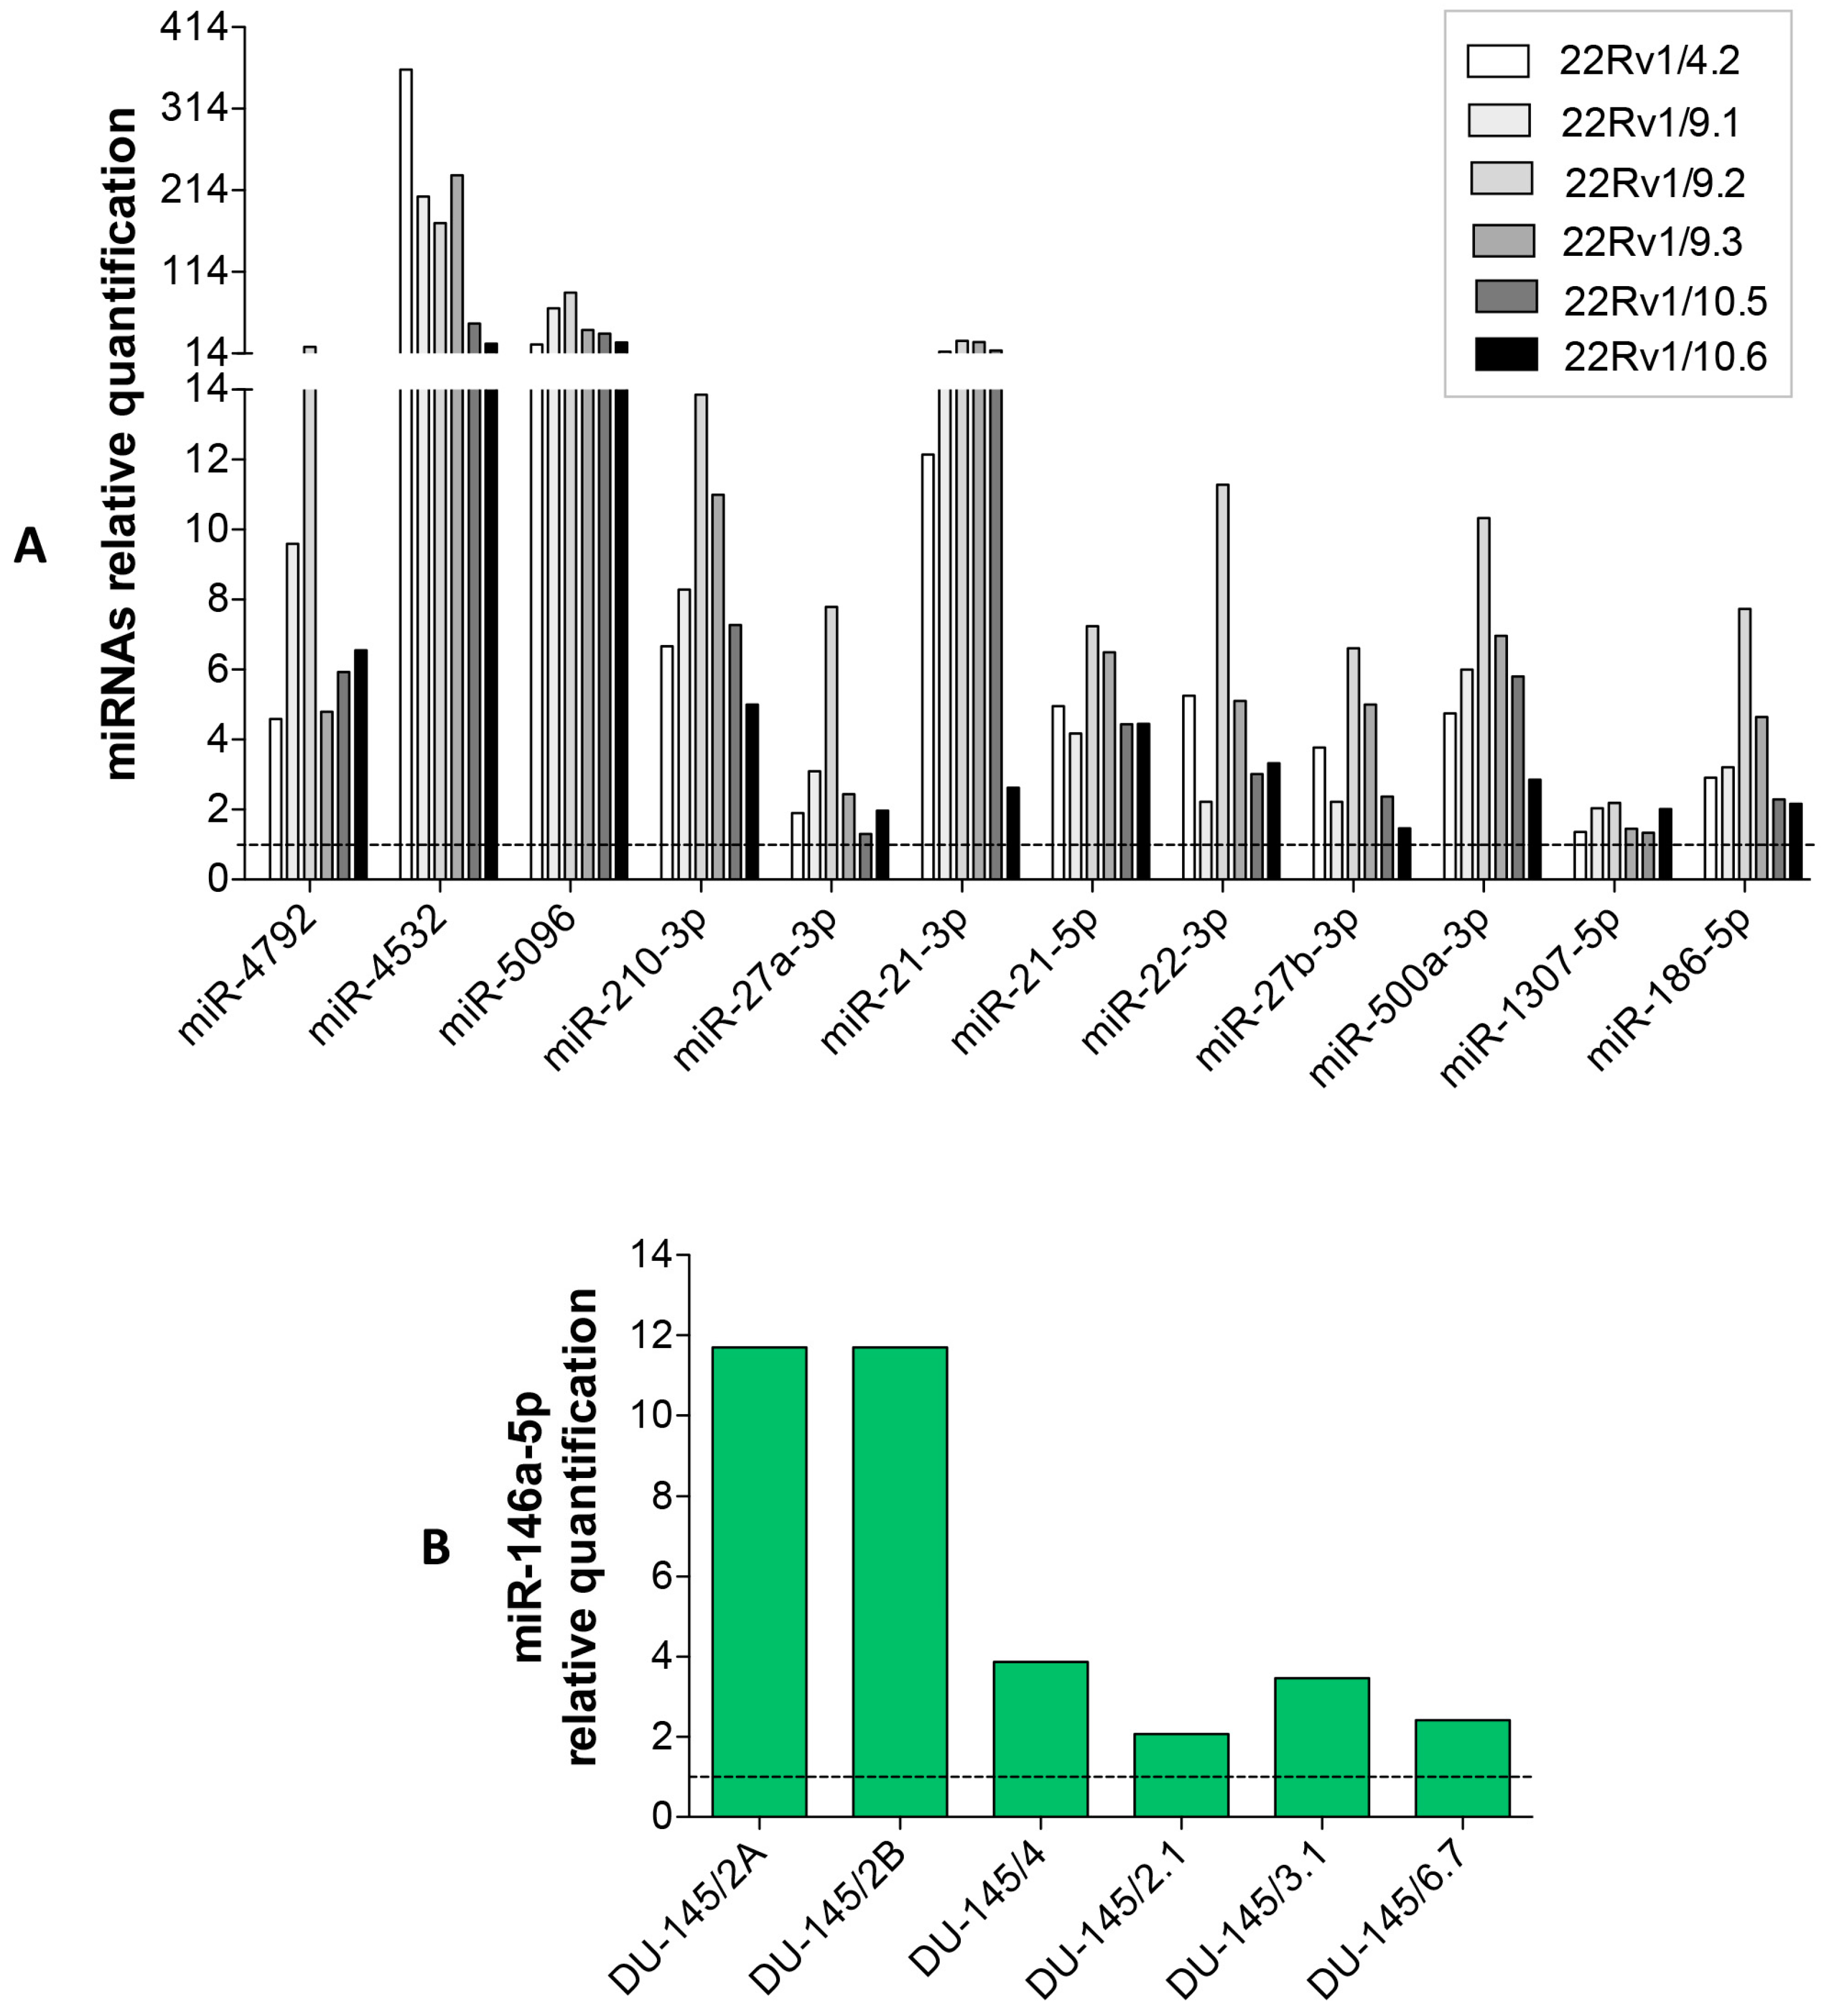
2.4. Expression Level of Selected DCTR-miRNAs in DCTR Clones

To gain more insight into the differential release of the DCTR-miRNAs by the DCTR clones we measured the intracellular level of the DCTR-miRNAs specifically associated with DCT-resistant phenotype (Table 1, underlined and in bold) in 22Rv1/DCTR clones with respect to parental cell lines (Figure 6). We found that DCTR-miRNAs were upregulated in 22Rv1/DCTR clones (particularly miR-4532, miR-5096 and miR-210-3p) except for miR-21-3p and miR-21-5p whose level did not change significantly, suggesting that the release of DCTR-miRNAs by DCTR PCa cells could be mediated by both active or passive mechanisms.

3. Discussion

Docetaxel (DCT) is the first line chemotherapy for patients who become insensitive to androgen deprivation therapy (castration-resistant prostate cancer, CRPC). Unfortunately, the DCT therapy frequently favors the development of DCT resistance in metastatic CRPC patients [2]. Hence, the discovery of biomarkers that indicate in advance the onset of DCT resistance could allow the early switch to other effective treatment options such as abiraterone acetate and enzalutamide [10,11]. While the detection of circulating miRNAs (c-miRNAs) in tumor patients is widely applied in clinical research [12,13,14], the detection of c-miRNAs in cancer patients under medical treatment is under-investigated, especially in PCa patients as confirmed by the poor availability of published data. So far, the change of miR-21 [5] and miR-210 [6] levels in the blood of PCa patients under DCT treatment have been associated with the clinical outcome. In addition, miR-141 [15,16], miR-146b-3p and miR-194 [16] have been shown to predict PCa clinical progression after therapies. Finally, in a recent work Lin et al. [17,18] demonstrated that miR-200a, miR-200b, miR-200c, miR-132, miR-375, miR-429 were associated with overall survival after DCT treatment.
In this work, we detected the miRNAs released by clones of 22Rv1 and DU-145 PCa cells resistant to DCT with the aim to identify those preferentially released by the DCT-resistant cells. The decision to isolate DCTR clones from the androgen-dependent (22Rv1) and androgen-independent (DU-145) cell lines was due to the fact that DCT-based chemotherapy has become a therapeutic option not only for CRPC patients but also for those who have not yet reached the full androgen-independence [19]. In line with other data [20,21], we showed that the main molecular mechanism at the basis of the resistance of the DCTR clones was the increase in the activity of the ABC membrane transporters, a family of ATP-dependent membrane-bound drug efflux pump that protects the tumor cells by cytotoxic drugs. In addition, we showed that both 22Rv1/DCTR and DU-145/DCTR clones had a generation time longer than those of the parental cell line. These data were in line with those obtained by Corcoran et al. [22]. We cannot exclude that the reduced growth rate of the DCTR clones may contribute to the DCT-resistant phenotype.
Once the DCTR clones were obtained, we detected miRNAs differentially released in the growth medium and selected those that passed several filters. First, we considered the miRNAs differentially released by all DCTR clones derived from each cell line and this increased the probability that they could be those really released by DCT-resistant cells. Second, we focused on miRNAs that were more released and on these miRNAs we imposed a cut-off on normalized reads (NR > 100) as we believe that this level was adequate for an easier detection. Third, we selected miRNAs whose level were significantly different between DCTR clones and parental cells by selecting not only the miRNAs more released by a |log2FC| > 1, but also the miRNAs whose level between the DCTR clone with the lower NR and the parental line replicate with the highest NR was greater than 10 (∆ > 10). At the end, we selected 12 DCTR-miRNAs and 1 DCTR-miRNA released by 22Rv1/DCTR and DU-145/DCTR clones respectively. In our opinion, the low abundance of DU-145/DCTR-miRNAs in comparison with 22Rv1/DCTR-miRNAs depends on the fact that DU-145/DCTR clones are more heterogeneous than 22Rv1/DCTR clones as suggested by the molecular data (BLC2 and βIII tubulin expression levels) and the different levels of MDR1 activation. Another observation is that 22Rv1/DCTR and DU-145/DCTR clones did not release the same miRNAs. This finding is not completely surprising given that DCTR clones derived from different tumor contexts and therefore the resistant phenotype may be different. As DCT resistance in PCa patients may arise from different tumor context as well, this observation underlines the importance of using more PCa cell lines to have a higher chance of identifying miRNAs which could potentially predict DCT resistance.
We then examined whether DCTR-miRNAs could be potential biomarkers of DCT resistance. In particular, we evaluated whether the release of the DCTR-miRNAs was affected also by the DCT treatment. We obtained promising results from the comparison of the DCTR-miRNAs released in the growth medium by DCTR clones and by parental cells treated with DCT for 3 days. We showed that the release of miR-4792, miR-4532, miR-5096, miR-210-3p, miR-21-3p and miR-21-5p were higher in the growth medium of DCTR clones than in DCT-treated cells thus rendering these miRNAs specific of DCT-resistant cells and then promising putative biomarkers of DCT resistance.
To be a good biomarker, a miRNA should be highly released before the onset of the DCT resistance. So far, many c-miRNAs diagnostic/prognostic of PCa have been identified, but it is still unclear if these c-miRNAs are useful in the management of PCa patients under DCT therapy. At the moment, only two c-miRNAs (miR-21, miR-210) have been associated to the outcome of DCT therapy [5,6] and, as such, have characteristics of predicting the DCT resistance of PCa patients. It has been shown that miR-21 level was elevated in CRPC patients, especially in those who developed resistance after DCT chemotherapy [5]. In the same way, it was demonstrated that the serum levels of miR-210 was higher in patients whose disease was resistant to DCT treatment as assessed by change in prostate specific antigen (PSA) [6]. It is worth noticing that both miR-21 and miR-210 belong to the 6 DCTR-miRNAs that were highly released only by cells resistant to DCT, suggesting that our approach to isolate DCTR PCa cells and to select the differentially released miRNAs not affected by DCT treatment could represent a manner to discover miRNAs to be tested as predictive biomarkers of the DCT resistance. As a consequence, the other DCTR-miRNAs specifically released by DCTR cells (miR-4792, miR-4532, miR-5096), and not yet tested in PCa patients, represent promising candidates to be tested as DCT predictive biomarkers in PCa patients.
Finally, we considered the intracellular level of the 6 DCTR-miRNAs in DCTR clones to gain more insight on the miRNA release mechanism. We found that not all DCTR-miRNAs were upregulated in all 22Rv1/DCTR clones suggesting that the release of these miRNAs by DCT-resistant PCa cells may be also mediated by an active mechanism. There are several reports in favor of either a specific or non-specific secretion of miRNAs by the cells (for review see [23,24]).
Among the miRNAs that were more upregulated (i.e., miR-210-3p, miR-4532 and miR-5096), miR-210 has been found to be transcriptionally activated by the hypoxia-inducible factor 1 α (HIF-1α) [25]. In particular, Cheng et al. [6] demonstrated that the treatment of PCa cells with hypoxic conditions determined the upregulation and the release of miR-210 in the growth medium. In addition, they demonstrated that high miR-210 serum level is associated with therapy (hormone therapy in combination with chemotherapy) resistance in CRPC patients. Given that it is known that tumor hypoxia is associated with therapy resistance [26], the author suggested that an increased hypoxia response signaling is present in a subset of CRPC patients, leading to increased miR-210 level and therapy resistance. So, the upregulation/release of miR-210-3p by 22Rv1/DCTR clones is in line with these data: we can only speculate that an increased hypoxia signaling could be associated with DCT resistance mechanism of 22Rv1/DCTR clones. However, miR-210 has a central role in promoting cancer-associated fibroblast (CAF) formation in PCa [27], hence in cancer progression, suggesting that it may act as a signal molecule in tumor microenvironment. Regarding miR-5096 and miR-4532, since they have been recently discovered, there are no reports on their biological functions. However, there are two studies that demonstrated that the transfer of miR-5096 through the gap junctions from glioma cells to astrocyte [28] or to human microvascular endothelial cells [29] promotes the glioma invasion with an unknown mechanism suggesting an oncogenic role of this miRNA, in line with its upregulation in 22Rv1/DCTR clones.
In conclusion, we showed that DCT resistant PCa cells release in the growth medium miRNAs whose level change in PCa patients resistant to DCT therapy, suggesting that clones resistant to DCT represent a good in vitro model to identify potential DCT predictive miRNAs to be tested as c-miRNA in PCa patients during DCT treatment. In addition, we showed that not all miRNA specifically released by DCTR clones were upregulated, suggesting that the miRNAs release may be mediated also by an active mechanism. In perspective, this in vitro approach for discovering miRNAs predictive of the onset of drug resistance may be applied to other tumor types as well as other anticancer drugs.

4. Materials and Methods

4.1. Cells and Culture Conditions

DU-145 and 22Rv1 cell lines were grown in RPMI 1640 medium added of 10% fetal bovine serum, 1% penicillin/streptomycin 2 mM and 1% l-glutammine 2 mM (Euroclone, Milan, Italy). Cells were incubated at 37 °C in a humidified atmosphere containing 6% CO2. For DCT treatment, cells were grown for 24 h and treated with DCT (Taxotere, 20 mg/mL, Sanofi Aventis, Milan, Italy) for 3 days.

4.2. Dose Response Curves

2 × 10⁵ cells were seeded per well (6 wells multiplate) and exposed to increasing concentration of DCT (Taxotere, 20 mg/mL, Sanofi Aventis). At specified time points, cells were fixed in 2% paraformaldehyde in PBS (Oxoid, Altrincham, Cheshire, UK), and subsequently stained with 0.1% crystal violet (SIGMA, St. Louis, MO, USA) dissolved in 20% methanol (SIGMA) and let dry at room temperature. Cells were then lysed with 10% acetic acid and the optical density (OD 590 nm) of the solution, detected with ChroMate Microtetraplate Reader apparatus (Awareness Technology, Westport, CT, USA), was used to measure cell proliferation.

4.3. Isolation and Characterization of DCT-Resistant (DCTR) Clones

To obtain DCTR clones, 5 × 10⁵ cells/100 mm diameter dish were grown in presence of DCT of either 3 nM (22Rv1) or 4 nM (DU-145). Each 3–4 days, the medium was removed and replaced with fresh selective medium until colonies formation (30–50 days). Thereafter, independent colonies were isolated and expanded to clonal populations. To verify whether clones were still resistant to DCT, cells were seeded at density of 2 × 10⁴ cells/cm2 and 24 h later exposed at increasing concentrations of DCT (range 1–20 nM). After 72 h exposure, cell proliferation was determined as reported above. The generation times were calculated dividing the hours in culture by the number of cell doublings calculated as [lg2 (final cell number/initial cell number)/lg2 2].

4.4. Rhodamine 123 Exclusion Assay

The assay was performed as previously described [30] with some modifications. Briefly, for each sample of DU-145 or 22Rv1 cells and DCTR clones, 2 aliquots of 4 × 10⁴ cells/mL were incubated at 37 °C with 1 μL of Rhodamine 123 (Rh123) (1 mM, SIGMA) and with or without 1 μL of Verapamil (50 mM, SIGMA). After 30 min, cells were harvested and centrifuged and each aliquot was split into two aliquots and analyzed with FACScalibur cytofluorimeter (BD Biosciences, San Jose, CA, USA) immediately (aliquot 1) and after 1 h (aliquot 2). Rh123 green was recorded on FL1 channel and the gate was set to exclude fluorescence of both aliquot 1 samples and verapamil minus aliquot 2 sample. The Rh123 extrusion was detected in the verapamil plus aliquot 2 sample and expressed as percentage of cells with a fluorescence different from the one excluded from the gate.

4.5. Total RNA Isolation

Intracellular total RNA was extracted with miRNeasy mini kit (Qiagen, Hilden, Germany) following the manufacturer’s instructions. For NGS experiment, extracellular total RNA was isolated from 2 mL growth medium with QIAamp circulating nucleic acid kit (Qiagen), following the manufacturer’s instructions. For qRT-PCR analysis, extracellular total RNA extraction was performed as previously described [7].

4.6. miRNAs and mRNA Quantification

miRNAs and mRNAs quantification were performed as previously described [7]. Transcripts values were normalized to those obtained from the amplification of the internal control (GAPDH, HPRT1, β-actin for mRNAs and U6, sno-44, sno-55, sno-110 for intracellular miRNA and cel-miR-39 for extracellular miRNAs).

4.7. miRNA Profiling with Next-Generation Sequencing (NGS) Technology (Small RNA-Seq)

The small RNA libraries were constructed using TruSeq Small RNA kit (Illumina, San Diego, CA, USA) according to the manufacturer’s suggestions. cDNA libraries were loaded at six-plex level of multiplexing (~4 million reads per samples) into a flow cell V3, and sequenced in a single-reads mode (50 bp) on a MiSeq sequencer (Illumina). Raw reads were analyzed as described in Barsanti et al. [31]. Briefly, raw sequences were de-multiplexed using the Illumina pipline CASAVA v.1.8.2. software (Illumina). FastQC was used for quality check and primary reads were trimmed of adapters sequence using Cutadapt v1.2.1 [32]. Remaining reads, with a minimum length of 17 bzp and maximum 35 bp after trimming, were clustered for unique hits and mapped to pre-miRNA sequences present into the miRBase (rel. 21) employing miRExpress tool v 2.1.3 [33].

4.8. Statistical Analysis

Data are expressed as mean ± SD of at least three independent experiments, and analyzed with Student’s t-test.
The differential analysis was performed using two different statistical methods implemented in the two packages, edgeR [34] and DESeq2 [35] of the R Bioconductor repository. Exact p-values were adjusted for multiple testing according to Benjamini–Hochberg procedure. In order to control the batch effect of the two sequencing runs of the DU-145/DCTR clones experiment, the analysis was corrected for baseline differences between the batches using an additive model in the design formula of both edgeR and DESeq2 approaches.
The hierarchical clustering was performed using the mean centered Log2 normalized reads, the Euclidean distance and complete agglomerative method.

Supplementary Materials

Supplementary materials can be found at www.mdpi.com/1422-0067/18/7/1512/s1.

Acknowledgments

We would like to thank Stefania Biagini (Fondazione Toscana Gabriele Monasterio, FTGM, Pisa) for giving us taxotere and Giuseppe Rainaldi for critical reading of the manuscript. This work was supported by the Istituto Toscano Tumori (grant 2010-Giuseppe Rainaldi; grant 2013-Milena Rizzo).

Author Contributions

Milena Rizzo conceived and designed the experiments. Lorenzo Bascetta, Monica Evangelista, Arianna Oliviero and Milena Rizzo performed the experiments. Milena Rizzo, Lorenzo Bascetta, Arianna Oliviero analyzed the data. Romina D’Aurizio and Alberto Mercatanti analyzed the NGS data. Milena Rizzo wrote the paper. Sergio Bracarda, Marco Pellegrini, Francesca Marrocolo revised the manuscript.

Conflicts of Interest

The authors declare no conflict of interest.

References

  1. Schurko, B.; Oh, W.K. Docetaxel chemotherapy remains the standard of care in castration-resistant prostate cancer. Nat. Clin. Pract. Oncol. 2008, 5, 506–507. [Google Scholar] [CrossRef] [PubMed]
  2. Petrylak, D.P.; Tangen, C.M.; Hussain, M.H.; Lara, P.N., Jr.; Jones, J.A.; Taplin, M.E.; Burch, P.A.; Berry, D.; Moinpour, C.; Kohli, M.; et al. Docetaxel and estramustine compared with mitoxantrone and prednisone for advanced refractory prostate cancer. N. Engl. J. Med. 2004, 351, 1513–1520. [Google Scholar] [CrossRef] [PubMed]
  3. Endzelins, E.; Melne, V.; Kalnina, Z.; Lietuvietis, V.; Riekstina, U.; Llorente, A.; Line, A. Diagnostic, prognostic and predictive value of cell-free miRNAs in prostate cancer: A systematic review. Mol. Cancer 2016, 15, 41. [Google Scholar] [CrossRef] [PubMed]
  4. Filella, X.; Foj, L. miRNAs as novel biomarkers in the management of prostate cancer. Clin. Chem. Lab. Med. 2017, 55, 715–736. [Google Scholar] [CrossRef] [PubMed]
  5. Zhang, H.L.; Yang, L.F.; Zhu, Y.; Yao, X.D.; Zhang, S.L.; Dai, B.; Zhu, Y.P.; Shen, Y.J.; Shi, G.H.; Ye, D.W. Serum miRNA-21: Elevated levels in patients with metastatic hormone-refractory prostate cancer and potential predictive factor for the efficacy of docetaxel-based chemotherapy. Prostate 2011, 71, 326–331. [Google Scholar] [CrossRef] [PubMed]
  6. Cheng, H.H.; Mitchell, P.S.; Kroh, E.M.; Dowell, A.E.; Chery, L.; Siddiqui, J.; Nelson, P.S.; Vessella, R.L.; Knudsen, B.S.; Chinnaiyan, A.M.; et al. Circulating microRNA profiling identifies a subset of metastatic prostate cancer patients with evidence of cancer-associated hypoxia. PLoS ONE 2013, 8, e69239. [Google Scholar] [CrossRef] [PubMed]
  7. Lucotti, S.; Rainaldi, G.; Evangelista, M.; Rizzo, M. Fludarabine treatment favors the retention of miR-485-3p by prostate cancer cells: Implications for survival. Mol. Cancer 2013, 12, 52. [Google Scholar] [CrossRef] [PubMed]
  8. Yamanaka, K.; Rocchi, P.; Miyake, H.; Fazli, L.; So, A.; Zangemeister-Wittke, U.; Gleave, M.E. Induction of apoptosis and enhancement of chemosensitivity in human prostate cancer LNCaP cells using bispecific antisense oligonucleotide targeting Bcl-2 and Bcl-xL genes. BJU Int. 2006, 97, 1300–1308. [Google Scholar] [CrossRef] [PubMed]
  9. Terry, S.; Ploussard, G.; Allory, Y.; Nicolaiew, N.; Boissiere-Michot, F.; Maille, P.; Kheuang, L.; Coppolani, E.; Ali, A.; Bibeau, F.; et al. Increased expression of class III beta-tubulin in castration-resistant human prostate cancer. Br. J. Cancer 2009, 101, 951–956. [Google Scholar] [CrossRef] [PubMed]
  10. Sartor, O.; Gillessen, S. Treatment sequencing in metastatic castrate-resistant prostate cancer. Asian J. Androl. 2014, 16, 426–431. [Google Scholar] [CrossRef] [PubMed]
  11. Hathaway, A.R.; Baker, M.K.; Sonpavde, G. Emerging agents for the therapy of advanced prostate cancer. Future Oncol. 2015, 11, 2775–2787. [Google Scholar] [CrossRef] [PubMed]
  12. Cheng, G. Circulating miRNAs: Roles in cancer diagnosis, prognosis and therapy. Adv. Drug Deliv. Rev. 2015, 81, 75–93. [Google Scholar] [CrossRef] [PubMed]
  13. Larrea, E.; Sole, C.; Manterola, L.; Goicoechea, I.; Armesto, M.; Arestin, M.; Caffarel, M.M.; Araujo, A.M.; Araiz, M.; Fernandez-Mercado, M.; et al. New concepts in cancer biomarkers: Circulating miRNAs in liquid biopsies. Int. J. Mol. Sci. 2016, 17, 627. [Google Scholar] [CrossRef] [PubMed]
  14. Armand-Labit, V.; Pradines, A. Circulating cell-free microRNAs as clinical cancer biomarkers. Biomol. Concepts 2017, 8, 61–81. [Google Scholar] [CrossRef] [PubMed]
  15. Gonzales, J.C.; Fink, L.M.; Goodman, O.B., Jr.; Symanowski, J.T.; Vogelzang, N.J.; Ward, D.C. Comparison of circulating MicroRNA 141 to circulating tumor cells, lactate dehydrogenase, and prostate-specific antigen for determining treatment response in patients with metastatic prostate cancer. Clin. Genitourin. Cancer 2011, 9, 39–45. [Google Scholar] [CrossRef] [PubMed]
  16. Selth, L.A.; Townley, S.L.; Bert, A.G.; Stricker, P.D.; Sutherland, P.D.; Horvath, L.G.; Goodall, G.J.; Butler, L.M.; Tilley, W.D. Circulating microRNAs predict biochemical recurrence in prostate cancer patients. Br. J. Cancer 2013, 109, 641–650. [Google Scholar] [CrossRef] [PubMed]
  17. Lin, H.M.; Castillo, L.; Mahon, K.L.; Chiam, K.; Lee, B.Y.; Nguyen, Q.; Boyer, M.J.; Stockler, M.R.; Pavlakis, N.; Marx, G.; et al. Circulating microRNAs are associated with docetaxel chemotherapy outcome in castration-resistant prostate cancer. Br. J. Cancer 2014, 110, 2462–2471. [Google Scholar] [CrossRef] [PubMed]
  18. Lin, H.M.; Mahon, K.L.; Spielman, C.; Gurney, H.; Mallesara, G.; Stockler, M.R.; Bastick, P.; Briscoe, K.; Marx, G.; Swarbrick, A.; et al. Phase 2 study of circulating microRNA biomarkers in castration-resistant prostate cancer. Br. J. Cancer 2017, 116, 1002–1011. [Google Scholar] [CrossRef] [PubMed]
  19. James, N.D.; Sydes, M.R.; Clarke, N.W.; Mason, M.D.; Dearnaley, D.P.; Spears, M.R.; Ritchie, A.W.; Parker, C.C.; Russell, J.M.; Attard, G.; et al. Addition of docetaxel, zoledronic acid, or both to first-line long-term hormone therapy in prostate cancer (STAMPEDE): Survival results from an adaptive, multiarm, multistage, platform randomised controlled trial. Lancet 2016, 387, 1163–1177. [Google Scholar] [CrossRef]
  20. O’Neill, A.J.; Prencipe, M.; Dowling, C.; Fan, Y.; Mulrane, L.; Gallagher, W.M.; O’Connor, D.; O’Connor, R.; Devery, A.; Corcoran, C.; et al. Characterisation and manipulation of docetaxel resistant prostate cancer cell lines. Mol. Cancer 2011, 10, 126. [Google Scholar] [CrossRef] [PubMed]
  21. Zhu, Y.; Liu, C.; Nadiminty, N.; Lou, W.; Tummala, R.; Evans, C.P.; Gao, A.C. Inhibition of ABCB1 expression overcomes acquired docetaxel resistance in prostate cancer. Mol. Cancer Ther. 2013, 12, 1829–1836. [Google Scholar] [CrossRef] [PubMed]
  22. Corcoran, C.; Rani, S.; O’Brien, K.; O’Neill, A.; Prencipe, M.; Sheikh, R.; Webb, G.; McDermott, R.; Watson, W.; Crown, J.; et al. Docetaxel-resistance in prostate cancer: Evaluating associated phenotypic changes and potential for resistance transfer via exosomes. PLoS ONE 2012, 7, e50999. [Google Scholar] [CrossRef] [PubMed]
  23. Makarova, J.A.; Shkurnikov, M.U.; Wicklein, D.; Lange, T.; Samatov, T.R.; Turchinovich, A.A.; Tonevitsky, A.G. Intracellular and extracellular microRNA: An update on localization and biological role. Prog. Histochem. Cytochem. 2016, 51, 33–49. [Google Scholar] [CrossRef] [PubMed]
  24. Turchinovich, A.; Tonevitsky, A.G.; Burwinkel, B. Extracellular miRNA: A collision of two paradigms. Trends Biochem. Sci. 2016, 41, 883–892. [Google Scholar] [CrossRef] [PubMed]
  25. Huang, X.; Le, Q.T.; Giaccia, A.J. MiR-210-micromanager of the hypoxia pathway. Trends Mol. Med. 2010, 16, 230–237. [Google Scholar] [CrossRef] [PubMed]
  26. Bertout, J.A.; Patel, S.A.; Simon, M.C. The impact of O2 availability on human cancer. Nat. Rev. Cancer 2008, 8, 967–975. [Google Scholar] [CrossRef] [PubMed]
  27. Taddei, M.L.; Cavallini, L.; Comito, G.; Giannoni, E.; Folini, M.; Marini, A.; Gandellini, P.; Morandi, A.; Pintus, G.; Raspollini, M.R.; et al. Senescent stroma promotes prostate cancer progression: The role of miR-210. Mol. Oncol. 2014, 8, 1729–1746. [Google Scholar] [CrossRef] [PubMed]
  28. Hong, X.; Sin, W.C.; Harris, A.L.; Naus, C.C. Gap junctions modulate glioma invasion by direct transfer of microRNA. Oncotarget 2015, 6, 15566. [Google Scholar] [CrossRef] [PubMed]
  29. Thuringer, D.; Boucher, J.; Jego, G.; Pernet, N.; Cronier, L.; Hammann, A.; Solary, E.; Garrido, C. Transfer of functional microRNAs between glioblastoma and microvascular endothelial cells through gap junctions. Oncotarget 2016, 7, 73925–73934. [Google Scholar] [CrossRef] [PubMed]
  30. Touil, Y.; Zuliani, T.; Wolowczuk, I.; Kuranda, K.; Prochazkova, J.; Andrieux, J.; Le Roy, H.; Mortier, L.; Vandomme, J.; Jouy, N.; et al. The PI3K/AKT signaling pathway controls the quiescence of the low-Rhodamine123-retention cell compartment enriched for melanoma stem cell activity. Stem Cells 2013, 31, 641–651. [Google Scholar] [CrossRef] [PubMed]
  31. Barsanti, C.; Trivella, M.G.; D’Aurizio, R.; El Baroudi, M.; Baumgart, M.; Groth, M.; Caruso, R.; Verde, A.; Botta, L.; Cozzi, L.; et al. Differential regulation of microRNAs in end-stage failing hearts is associated with left ventricular assist device unloading. BioMed Res. Int. 2015, 2015, 592512. [Google Scholar] [CrossRef] [PubMed]
  32. Martin, M. Cutadapt removes adapter sequences from high-throughput sequencing reads. EMBnet. J. 2011, 17, 10–12. [Google Scholar] [CrossRef]
  33. Wang, W.C.; Lin, F.M.; Chang, W.C.; Lin, K.Y.; Huang, H.D.; Lin, N.S. miRExpress: Analyzing high-throughput sequencing data for profiling microRNA expression. BMC Bioinform. 2009, 10, 328. [Google Scholar] [CrossRef] [PubMed]
  34. McCarthy, D.J.; Chen, Y.; Smyth, G.K. Differential expression analysis of multifactor RNA-Seq experiments with respect to biological variation. Nucleic Acids Res. 2012, 40, 4288–4297. [Google Scholar] [CrossRef] [PubMed]
  35. Love, M.I.; Huber, W.; Anders, S. Moderated estimation of fold change and dispersion for RNA-seq data with DESeq2. Genome Biol. 2014, 15, 550. [Google Scholar] [CrossRef] [PubMed]
Figure 1. Effect of docetaxel (DCT) on DU-145 cell proliferation. Relative cell proliferation of 22Rv1 cells (A), 22Rv1/DCTR clones (B), DU-145 cells (C) and DU-145/DCTR clones (D) exposed to increasing concentrations of docetaxel for 72 h.
Ijms 18 01512 g001
Figure 2. Characterization of DCTR clones. Generation times (calculated dividing the hours in culture by the number of cell doublings) (A,B), percentage of cells which extruded Rh123 (C,D), MDR1 mRNA relative quantification with qRT-PCR (E,F) in 22Rv1/DCTR or DU-145/DCTR clones with respect to parental cells (dotted line). Data were shown as mean ± SD from three independent experiments (* p < 0.05, ** p < 0.01, *** p < 0.001, unpaired t-test).
Ijms 18 01512 g002
Figure 3. Characterization of DCTR clones. BCL2 (A,B) and βIII tubulin (C,D) mRNA relative quantification with qRT-PCR in 22Rv1/DCTR or DU-145/DCTR clones with respect to parental cells (dotted line). Data were shown as mean ± SD from three independent experiments (* p < 0.05, *** p < 0.001, unpaired t-test).
Ijms 18 01512 g003
Figure 4. Extracellular miRNA profile of DCTR clones. (A) Schematic representation of the selective criteria used to identify DCTR-miRNAs in both 22Rv1/DCTR and DU-145/DCTR clones (+, more released; −, retained/less released); (B) Heatmap representing the result of DCTR-miRNAs in 22Rv1/DCTR clones and parental cells biological replicates (22Rv1WT1-3); (C) Normalized reads of miR-146a-5p in DU-145/DCTR clones (red spots) and parental cells biological replicates (blue spots) of DU-145/2A, /2B and /4 clones (see Figure S2 for DU-145/2.1, /3.1 and /6.7 clones).
Ijms 18 01512 g004
Figure 5. DCTR-miRNAs validation. Relative quantification with qRT-PCR of DCTR-miRNAs in the growth medium of 22Rv1/ (A) or DU-145/ (B) DCTR clones with respect to parental cells (dotted line).
Ijms 18 01512 g005
Figure 6. Intracellular level of selected DCTR-miRNAs in 22Rv1/DCTR clones. Relative quantification by qRT-PCR of DCTR-miRNAs in the growth medium of 22Rv1/DCTR clones with respect to parental cells (dotted line).
Ijms 18 01512 g006
Table 1. DCTR-miRNAs level in the growth medium of DCTR clones or DCT-treated cells.
DCTR/miRNAsColumn A *.
DCTR-miRNAs Level in DCTR Clones Versus Parental Cells Growth Medium
Column B **.
DCTR-miRNAs Level in DCT-Treated Versus Untreated Cells Growth Medium
Column A/Column BUnpaired t-Test Pvalue (A Versus B)
miR-4792 ***8.94 ± 2.751.69 ± 0.115.27p < 0.05
miR-4532175.20 ± 50.662.10 ± 0.4883.42p < 0.01
miR-509648.61 ± 10.001.28 ± 0.0337.97p < 0.001
miR-210-3p8.80 ± 1.132.28 ± 0.193.86p < 0.001
miR-27a-3p3.48 ± 0.852.13 ± 0.21.63NS
miR-21-3p17.7 ± 4.123.9 ± 0.494.53p < 0.01
miR-21-5p5.18 ± 0.432.49 ± 0.392.07p < 0.001
miR-22-3p5.22 ± 1.213.86 ± 0.321.35NS
miR-27b-3p3.52 ± 0.774.29 ± 0.250.82NS
miR-500a-3p6.11 ± 1.013.78 ± 0.031.61p < 0.05
miR-186-5p3.82 ± 0.863.64 ± 0.431.05NS
miR-146a-5p ****5.87 ± 1.8610.21 ± 1.460.57NS
* Each value represents the mean ± SD of the DCTR/miRNAs level in the DCTR clones. ** Each value represents the mean ± SD of the DCTR/miRNAs level in six biological replicates. *** DCTR-miRNAs whose column A/column B value was higher than 2 are underlined and in bold. **** miR-146a-5p was the only miRNA selected from DU-145/DCTR clones. NS, not significant.

