
Meta-Analyses of QTLs Associated with Protein and Oil Contents and Compositions in Soybean [Glycine max (L.) Merr.] Seed

1
Department of Horticulture and Crop Science, The Ohio State University, Columbus, OH 43210, USA
2
Center for Soybean Research, The Ohio State University, Columbus, OH 43210, USA
3
Center for Applied Plant Sciences, The Ohio State University, Columbus, OH 43210, USA
*
Author to whom correspondence should be addressed.
Int. J. Mol. Sci. 2017, 18(6), 1180; https://doi.org/10.3390/ijms18061180
Submission received: 30 April 2017
/
Revised: 23 May 2017
/
Accepted: 24 May 2017
/
Published: 1 June 2017
(This article belongs to the Special Issue Pulses)
Abstract
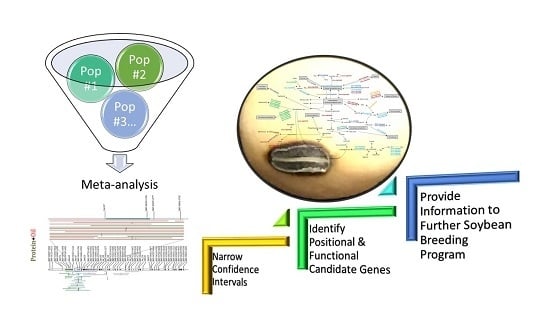
:Soybean [Glycine max (L.) Merr.] is a valuable and nutritious crop in part due to the high protein meal and vegetable oil produced from its seed. Soybean producers desire cultivars with both elevated seed protein and oil concentrations as well as specific amino acid and fatty acid profiles. Numerous studies have identified quantitative trait loci (QTLs) associated with seed composition traits, but validation of these QTLs has rarely been carried out. In this study, we have collected information, including genetic location and additive effects, on each QTL for seed contents of protein and oil, as well as amino acid and fatty acid compositions from over 80 studies. Using BioMercator V. 4.2, a meta-QTL analysis was performed with genetic information comprised of 175 QTLs for protein, 205 QTLs for oil, 156 QTLs for amino acids, and 113 QTLs for fatty acids. A total of 55 meta-QTL for seed composition were detected on 6 out of 20 chromosomes. Meta-QTL possessed narrower confidence intervals than the original QTL and candidate genes were identified within each meta-QTL. These candidate genes elucidate potential natural genetic variation in genes contributing to protein and oil biosynthesis and accumulation, providing meaningful information to further soybean breeding programs.
1. Introduction
Although significant crop improvements have been made internationally, there is still demand for increased food supply and quality [1]. In addition to traditional phenotypic selection, molecular breeding, often facilitated by genome sequence analysis, has been a primary tool for development of new cultivars to increase food security [1]. Like many other legumes, the demand for soybean has increased due to its nutritional importance in animal feed, potential use as an industrial raw material, for its benefits to human health [2], and use as a fuel feedstock [3].
Because soybean seed contains approximately 40% protein and 71% of the world’s meal consumption is reliant on soybean, a percentage which is increasing [4], total protein content has been one of the primary quality traits on which soybean breeding has focused. Both human and animal consumption of soybean is predicted to increase as the demand for plant and animal protein as well as the world population grows [5]. About 77% of animal meal consumption is dependent on soybean meal, used as a source of protein and specific amino acids. Thus, soybean breeding programs have initiated development of new soybean cultivars which possess essential and balanced amino acid compositions, such as increased levels of cysteine (Cys), methionine (Met), lysine (Lys) and threonine (Thr) [5].
With 61% of the world’s oilseed production dependent on soybean [4], oil accumulation in soybean seeds has also been a critical focal point of breeding efforts for soybean grain quality. Efforts towards the genetic analyses of oil content and composition in soybean seed have been increasing due to the high demand of vegetable oils and its role in human health [6]. Due to the relatively short shelf life of soybean oil, the development of cultivars with modified oils possessing decreased linolenic acid and elevated oleic acid has become a critical breeding goal [7]. Additional modified oil targets have also been proposed, potentially resulting in high-value soybean oils [8,9]. Thus, knowledge of the genetic control of total protein and oil content as well as specific compositions can be important for the development of prescriptive soybean cultivars.
Over the past 25 years, mapping studies utilizing biparental populations have been carried out for the identification of quantitative trait loci (QTL) for soybean seed composition. Through these studies, hundreds of loci contributing to the protein and oil contents and compositions of seed have been identified, as well as few molecular markers which have been successfully applied in marker-assisted breeding [5,10,11,12,13]. Of the more than 700 QTLs identified from over 60 studies mapping protein and oil seed contents, only 57 QTLs have been confirmed (available online: http://soybase.org). To gain the official designation of a confirmed QTL, the QTL must be evaluated in an independent set of meiotic events sharing at least one parent with the original population, in independent environments, and at an experiment-wise error rate of less than 0.01 (available online: http://soybase.org). While the criteria to confirm a QTL are not always met, there are frequently overlapping QTLs that have been identified from different genetic sources and or at an experiment-wise error rate of greater than 0.01. However, it is not always simple to identify common QTL regions for specific traits due to various factors, including the marker sets, statistical methods, parents, size and generation of populations, experimental design, and environment which can each influence the detection, location, and level of significance of QTLs. Thus, meta-analyses, which utilizes a maximum likelihood estimation with consideration of population size and QTL positions and effects, have been applied to consolidate and refine locations of robust QTLs identified for the same trait [14].
Meta-analysis has been used for studying QTLs for various traits in many major crops; drought tolerance in rice [15], yield-related traits in wheat [16], agronomic traits in cotton [17], flowering time in maize [18] and abiotic stress tolerance in barley [19]. Several meta-QTL analyses have been carried out in soybean and have included traits such as resistance to soybean cyst nematode [20], plant height [21], 100-seed weight [22] and delayed-canopy-wilting [23]. Contents of soybean seed protein [24] and oil [25] have also been previously studied by meta-analysis with 107 and 121 QTLs, respectively. However, in recent years numerous additional QTL mapping studies for these two traits have rapidly accumulated [10,11,12,13,26,27,28,29,30,31,32,33,34,35,36], as well as, QTL studies on the amino acid and fatty acid compositions of soybean seed protein and oil [37,38,39,40,41,42,43]. Thus, with a nearly three-fold increase in the number of QTL available, a new meta-analysis for seed protein and oil contents which includes recent QTLs for seed protein and oil content as well as seed amino acid and fatty acids profiles is timely.
In this study, we collected the information related to the genetic location and effects of QTLs for seed contents of protein and oil and the respective profiles of amino acids and fatty acids from over 80 studies. Using BioMercator V. 4.2 (Versailles, France), meta-QTL analyses were performed with the genetic information from over 600 QTLs (175 QTLs for protein, 205 QTLs for oil, 156 QTLs for amino acids and 113 QTLs for fatty acids), allowing for identification of meta-QTLs, which represent robust QTLs identified in multiple studies and with narrowed confidence intervals (CI) relative to the original QTLs. Candidate genes were identified for each of the meta-QTLs. Findings from these meta-QTL analyses along with identified candidate genes provide insight into soybean’s naturally varying genes involved in the biosynthesis and accumulation of protein and oil in the seed and will be useful for marker-assisted soybean breeding.
2. Results
2.1. Collection of QTLs for Soybean Seed Protein and Oil Contents and Compositions
SoyBase (available online: http://soybase.org) and recent literature were mined up to 2016, inclusive, to identify all map and QTL information for soybean seed protein and oil contents and amino acid and fatty acid profiles. A total of 84 studies were identified (Table S1) which reported a total of 1320 QTLs for protein, oil, amino acids and fatty acids, 648 QTLs with no R2 value and no genetic map information were excluded (Table S2). Thus, a total of 672 QTLs (184 for protein, 212 for oil, 156 for amino acids and 120 for fatty acids) were used in our meta-analyses (Table S2). Of these QTLs, 23 had LOD scores below 2.0, as suggested by Qi et al. [24] these were removed and separate meta-QTL analyses were conducted with only “high confidence” QTLs, which consisted of 649 QTLs (175 QTLs for protein, 205 QTLs for oil, 156 QTLs for amino acids and 113 QTLs for fatty acids) with LOD scores > 2.0 (Table S2).
2.2. QTL Projection on a Soybean Consensus Map and Meta-Analysis of Seed Compositions QTL
The soybean consensus map 4.0 [44] was used as a reference map for the projection of QTLs. Of the 672 QTLs (649 high confidence QTLs), 284 QTLs (263 high confidence QTLs) were able to be projected on the reference map. Though not evenly distributed, projected QTLs were positioned on all 20 chromosomes. With 38 (35 high confidence) projected QTLs, chromosome (Chr) 20 had the largest number of projected QTLs, whereas only three QTLs were projected on Chr 11 (Table S3). Overall, more than half of the QTLs were not projected on the reference map. Failure to project a QTL is caused by a lack of common marker pairs which flank the QTL in the original and soybean reference maps. For example, meta-analysis of amino acid QTLs was initiated with 156 QTLs which were primarily mapped with SNP markers which were largely unique to these studies, thus, only 9 QTLs were able to be projected (Chrs 1, 6, 9 and 20; Table S3).
Using BioMercator v4.2, meta-analyses were performed for seed protein and oil content separately. Meta-analyses of amino acid composition and fatty acid composition were carried out in two groups, respectively. Soybean seed protein and oil contents have a well-established negative correlation [10,45,46] and seed protein versus Cys concentration and seed protein versus Met concentration have also been reported as displaying positive or negative correlations depending on the study [5,11,38,42,47,48]. Therefore, meta-analyses of QTL for these traits known to co-vary were also carried out in predetermined combinations of protein and oil (protein+oil) and protein, Cys and Met (protein+Cys+Met).
In the first step of meta-analysis (Meta-Analysis step 1 of 2) [49], for each chromosome and trait, the best meta-QTL models with K consensus QTLs was selected according to the minimum Akaike Information Criterion (AIC) (Tables S3 and S4). With the model chosen, meta-QTLs were successfully generated from six chromosomes with the most likely positions and CIs calculated in the second step of meta-analysis (Meta-Analysis step 2 of 2) (Tables S3 and S4) [49].
A total of 55 meta-QTLs (43 high confidence meta-QTLs) were identified for all traits and trait combinations (Table 1). The meta-QTLs represented 284 projected QTLs (263 high confidence projected QTLs). While the majority of meta-QTLs were identified only when the meta-analysis was carried out across traits and included both protein and oil QTLs (Figure 1 and Table S4), Chr 20 possessed high confidence meta-QTLs for protein, oil, protein+oil and protein+Cys+Met (designated as mP20-#, mPO20-#, and mPCM20-#, respectively) (Figure 2 and Table S4). Twelve meta-QTLs on Chrs 9, 14, and 15 were identified only when QTLs with LOD scores < 2.0 were included in the analysis (Table 1). Meta-analysis reduced the CI of meta-QTLs relative to the projected QTLs by a wide margin, with the projected QTLs spanning an average of 21.77 cM (30.07 cM for high confidence QTLs) and meta-QTLs spanning an average of only 3.88 cM (4.30 cM for high confidence meta-QTLs).
2.3. Identification of Candidate Genes for Each Meta-QTL
In order to identify positional candidate genes potentially contributing to the meta-QTLs for each trait, the physical and genetic positions of the left and right markers of each meta-QTL’s CI were obtained for those markers found on both the consensus map 4.0 [44] and G. max genome assembly, version Glyma.Wm82.a2.v1 (Gmax2.0) (available online: http://soybase.org). For those markers not positioned on either the soybean consensus map 4.0 or Gmax2.0, the next nearest marker located on both the consensus map and Gmax2.0 was selected. The meta-QTLs encompassed a total of 7412 positional candidate genes (5440 positional candidate genes for high confidence meta-QTLs), with each meta-QTL encompassing an average of 135 positional candidate genes (127 positional candidate genes for high confidence meta-QTLs) (Table 1). Meta-QTL mPO20-2 contained the smallest number of positional candidate genes, with 14 genes within the CI of 1.83 cM (24.07–25.90 cM on Chr 20, Figure S2), whereas there were an immense 590 positional candidate genes encompassed by mPO7-6 with a CI of 17.41 cM (57.99–75.40 cM on Chr 7). While, generally, a small number of positional candidate genes were detected if the CI of the meta-QTL was small, the CIs of mP20-3, mO20-4, mPO20-4 and mPCM20-3 were only 0.61, 0.01, 0.00 and 0.14 cM, respectively; however, 49 positional candidate genes were identified within each of these meta-QTL. This was largely due to the closest marker being located at least 4 cM away on the reference map from the CI boundaries (Table 1). Thus, while the CIs of meta-QTL are generally narrower than the projected QTL from which they are synthesized, the advantage of this narrowed region in identifying positional candidate genes can only be observed when the markers can be easily translated to the genome sequences (Gmax2.0).
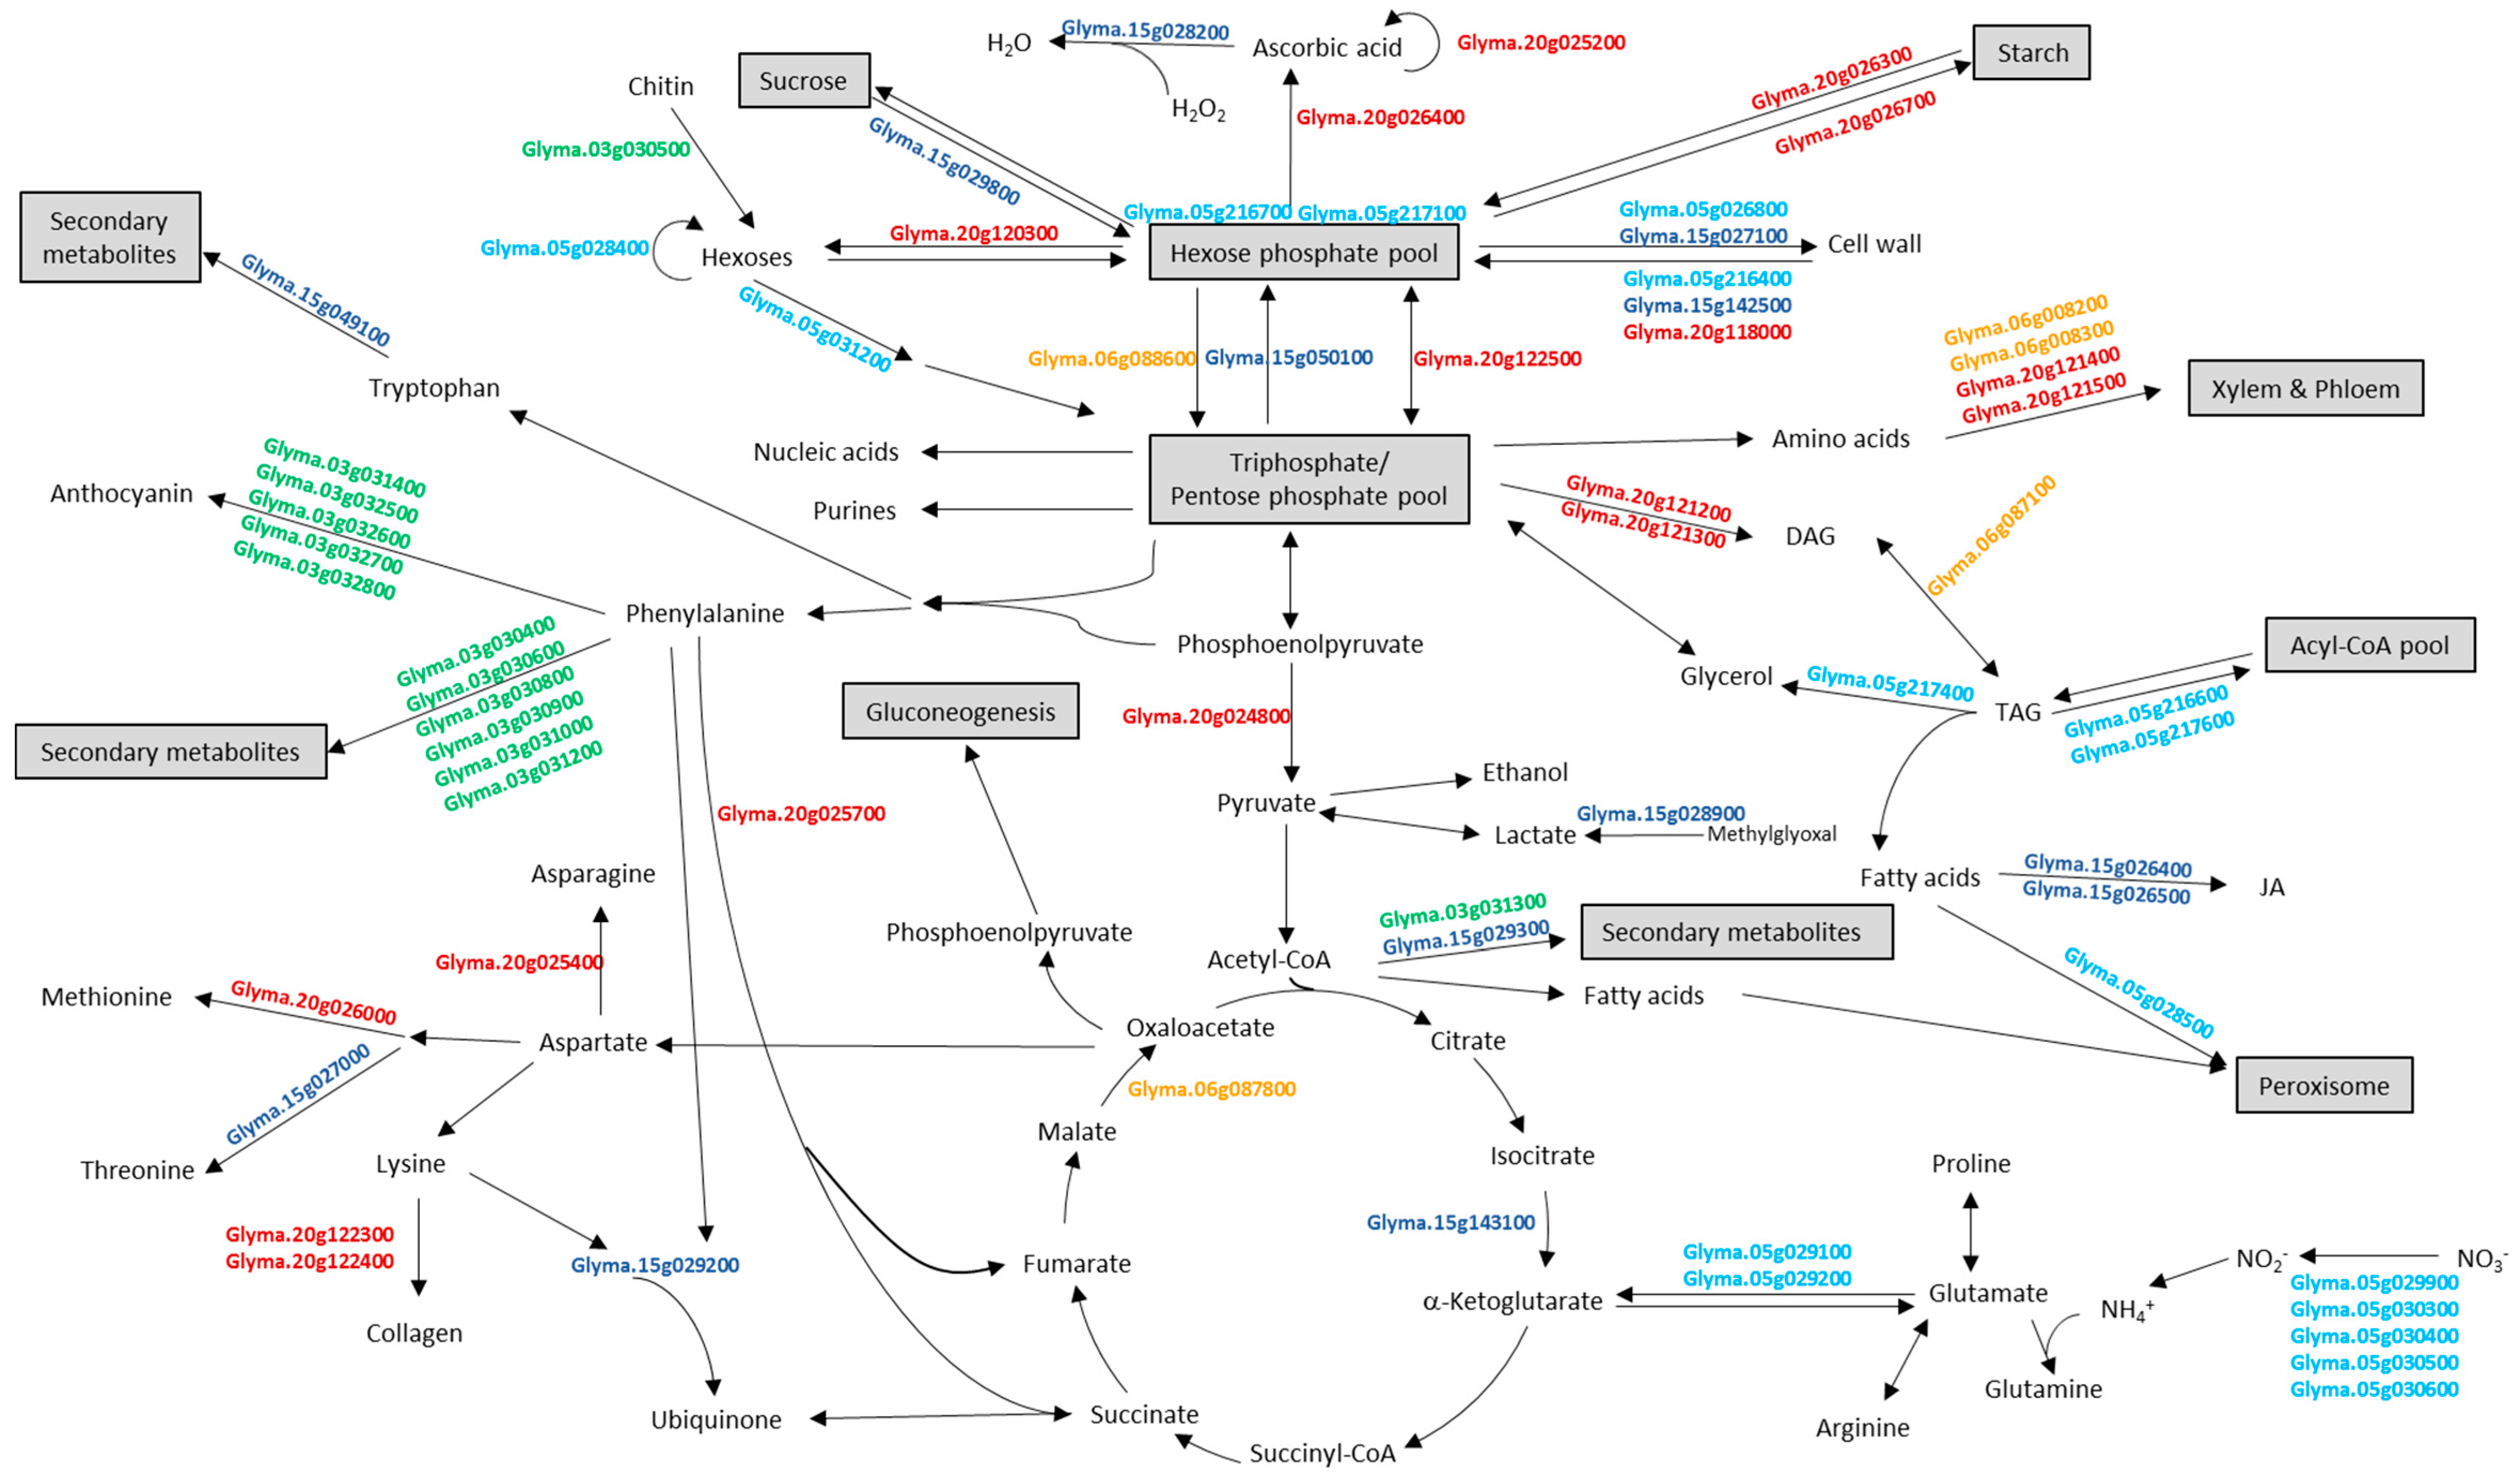
For the 14 meta-QTLs having less than 50 positional candidate genes, detailed functional information of candidate genes from each meta-QTL were obtained from Phytozome v. 12.0 (available online: http://www.phytozome.net; Table S5). Interestingly, each meta-QTL encompassed at least one positional candidate gene annotated with potential metabolic functions relating to protein and oil biosynthesis and/or accumulation, such as sucrose biosynthesis, glycolysis, gluconeogenesis, amino acids biosynthesis/degradation, etc. (Table 2 and Figure 2).
3. Discussion
3.1. Meta-Analysis Aids in the Identification of Robust QTLs and Narrowing of Confidence Intervals
Meta-analysis of QTLs was developed by Goffinet and Gerber [14] in order to assist in identification of consistent and robust QTLs and to improve the precision of their genetic locations. The composition of soybean seed is a well-studied trait with numerous genetic studies having been carried out to identify QTLs for protein and oil contents and amino acid and fatty acid compositions (Table S1). A meta-analysis can aid in the synthesis of these myriad QTLs in order to identify the genetic regions robustly associated with each trait in multiple environments and genetic backgrounds. Previously, two studies have carried out meta-analyses related to QTLs for soybean seed protein and oil contents. The previous meta-analysis of protein content QTLs identified 23 meta-QTLs on 13 chromosomes with CIs of meta-QTLs ranging from 1.52 to 14.31 cM [24]. In the previous meta-analysis of oil content, 20 meta-QTLs were detected on 13 chromosomes and their CIs ranged from 1.3 to 12.35 cM [25]. The meta-analyses carried out in this study integrate the locations of hundreds of QTLs for seed protein and oil contents and amino acid and fatty acid compositions using maximum likelihood estimation with consideration of population size and additional QTL information. We have projected 284 of 672 QTLs for these traits onto a single reference map and integrated these into 55 meta-QTLs for protein, oil, protein+oil, and protein+Cys+Met to provide a genetic framework for seed protein and oil contents (Table 1).
No meta-QTLs were synthesized for fatty acids or amino acids when analyzed as independent traits. This may be due to the limited number of studies as compared to protein and oil as well as the minimal overlap of QTLs detected among those studies. However, genes which contribute to environmentally stable changes in fatty acid composition in multiple genetic backgrounds have been cloned, such as 3-keto-acyl-ACP synthase II gene (KAS II) [50], ω-3 fatty-acid desaturase gene (FAD3) [51], microsomal oleate desaturase gene (FAD2) [52] and Δ9-stearoyl-ACP-desaturase gene (SACPD-C) gene [53]. Thus, it is known that at least a portion of the QTL for fatty acid composition are robust.
In Chr 20, meta-QTLs consistently possessed narrower CIs than the projected QTLs from which they were synthesized. Meta-QTLs for protein, oil, protein+oil, and protein+Cys+Met decreased CI by 13.56 (73.3%), 21.69 (81.1%), 28.63 (89.6%) and 18.67 (88.7%) cM, respectively, as compared to the projected QTL. The translation of genetic distances to the identification of positional candidate genes on a physical map is dependent on the ability to locate the physical positions of flanking genetic markers from the reference map. Accordingly, we found that the decreased confidence intervals often, but not always (e.g., mP20-3, mO20-4, mPO20-4 and mPCM20-3), correlated with a decrease in the number of positional candidate genes encompassed by the meta-QTLs in comparison to the projected QTLs. Meta-QTLs for protein, oil, protein+oil, and protein+Cys+Met decreased the average number of positional candidate genes by 367 (480 to 113), 686 (815 to 129), 526 (702 to 176) and 461 (527 to 66), respectively, as compared to the projected QTLs.
Traditionally, QTL positions are refined through the tedious process of fine-mapping which can include selecting for recombination in targeted regions and evaluating those individuals (e.g., [35]), increasing marker density (e.g., [54]), and/or “mendelizing” the QTL by generating near-isogenic lines [35,55]. In some cases, meta-analysis of QTLs may replace or strengthen these methods. For example, mPO15-2, formed from eight projected QTL is coincident with the confirmed seed protein QTL cqSeed protein-001 (available online: http://soybase.org) [56]. Satt384 (at 19.62 cM on the soybean consensus map) is positioned within the mPO15-2 CI. Satt384 was the key marker in the fine-mapping of cqSeed protein-001 and fine-mapping had previously served to decrease the interval to 535 kb based on Gmax2.0 [35]. Though the positioning of the mPO15-2 flanking markers on the reference genome are inverted relative to the reference map, making a direct interpretation of results difficult, mPO15-2 coincided with the 535 kb interval identified by fine-mapping and even further narrowed this region (Table 1).
3.2. Meta-QTLs Can Be Further Defined and Refined Through the Combined Analysis of Correlated Traits
We found that combining QTLs identified from correlated traits in a meta-analysis resulted in the identification of additional meta-QTLs and further narrowed CIs. Most of the meta-QTLs identified in this study were for combined protein and oil contents. However, on Chr 20, meta-QTLs were detected when projected QTLs from protein and oil traits were analyzed separately, in combination, as well as for combined projected QTLs from the correlated traits protein, Cys and Met (Figure 1 and Table 1). Many studies have demonstrated Chr 20 (LG I) has QTLs with a strong effect on protein content and a lesser effect on oil content in soybean seed [46,57,58]. In our study, six meta-QTL regions were identified on Chr 20. Three meta-QTL regions were identified in all four meta-analyses, protein, oil, protein+oil and protein+Cys+Met. These meta-QTL spanned from approximately 13 to 18 cM (mP20-1, mO20-1, mPO20-1 and mPCM20-1), 22 to 27 cM (mP20-2, mO20-2, mPO20-2 and mPCM20-2), and 49 to 50 cM (mP20-3, mO20-4, mPO20-4 and mPCM20-3). The remaining two meta-QTL regions were only found in some subset of the four meta-analyses (approximately 29 to 41 cM for mO20-3 and mPO20-3, approximately 54 to 67 cM for mP20-4 and mO20-5, and 75.05 to 78.48 cM for mPCM20-4). Thus, there were meta-QTL regions that were identified both only for QTL from a single trait and only for QTL from combined, correlated traits.
By combining the negatively correlated traits of seed protein and oil contents, CIs for Chr 20 meta-QTLs were reduced by an average of 3.32 cM in comparison to meta-analysis of each trait separately (Figure 1 and Figure S2). This narrowing of CIs resulted in a decrease in the number of positional candidate genes encompassed by each meta-QTL. This is exemplified by mP20-2, mO20-2, and mPO20-2 where the number of positional candidate genes was reduced from 26 and 63, to only 14, respectively (Table 1). Thus, our study suggested that meta-analysis of QTLs from not only single traits but also of correlated traits can be used to identify meta-QTLs with potential pleiotropic effects and result in narrowed CIs.3.3 The incorporation of QTLs with low LODs score into meta-analysis does not hinder analysis and provides confirmation.
Qi et al. [24] suggested the removal of reported QTLs with LOD scores < 2.0 in order to avoid false positives in meta-analysis. However, a number of QTL mapping studies have routinely reported QTLs with lower LOD scores, as in, for example, the application of a chromosome-wide threshold in order to identify “suggestive” QTLs [59,60]. We posited that a meta-analysis of QTLs would provide the opportunity to validate these “suggestive” QTLs. The inclusion of 23 QTLs with LOD scores below 2.0 resulted in the detection of an additional 12 meta-QTLs: four, three and five clusters on Chrs 9, 14 and 15, respectively (Table 1 and Figure S1). Meta-QTLs mPO9-1~4, mPO14-1~3 and mPO15-1~5 were synthesized from 17, 16 and 21 projected QTLs, respectively. As the projected QTL contributing to these meta-QTL were from each from multiple studies [10,11,13,26,27,29,30,31,33,34,57,61,62,63,64,65,66,67,68,69,70,71,72,73,74,75], these QTL with LOD scores below 2.0 have been identified in multiple environments and genetic backgrounds, indicating that they are, indeed, reliable QTL. Thus, meta-analysis can be applied to identify robust QTL from “suggestive” QTL.
3.3. Putative Functional Candidate Genes Were Identified from the Positional Candidates Encompassed by Meta-QTLs
Of the 55 meta-QTLs identified, 14 encompassed a limited number (<50) of positional candidate genes. For these 14 meta-QTLs, representing nine distinct regions on Chrs 3, 5, 6, 15 and 20, the positional candidate gene lists were mined for functional candidates based on their gene annotation (Table 2). While functional candidates may include, for example, transcription factors and unannotated genes, here we have focused on metabolic activities that may influence seed protein and oil biosynthesis and accumulation. This lead to the identification of 69 functional candidate genes for these nine meta-QTL regions.
Meta-QTL mPO3-1 possessed 35 positional candidate genes, among which included putative phenylacetaldoxime monooxygenases and anthocyanidin 3-O-glucosyltransferases involved in anthocyanin biosynthesis [76] (Table 2 and Figure 2). Phenylacetaldoxime monooxygenase has been shown to be involved in the production of volatile organic compounds, especially phenylpropanoids and benzenoids [77]. Both enzymes have been shown to participate in pathways starting from phenylalanine, generated from Calvin cycle via shikimic acid pathway (Figure 2). Thus, if metabolic flux is toward production of anthocyanin and other secondary metabolites, pull from the phenylalanine pool may lead to a concomitant decrease in oil accumulation.
Among the 49 positional candidate genes encompassed by mPO5-1, 11 candidate genes had predicted functions related to protein and oil accumulation and/or biosynthesis (Figure 2 and Table 2). Of potential functional interest were the candidate genes annotated as transporters of either fatty acids (Glyma.05g028500) or nitrate. Fatty acids are transported across most membrane systems for modification and lipid assembly following synthesis in plastids [78]. Glyma.05g028500 may contribute to the transportation of chloroplast produced fatty acids into the peroxisome, where they can be incorporated into β-oxidation. Nitrate uptake from the soil is transcriptionally controlled by both nitrate and photosynthate availability. De Jong et al. [79] showed nitrate uptake and assimilation was closely coordinated with glucose to supply amino acids and protein for plant growth. Thus, the five candidate genes annotated as nitrate transporters may play a role in production of amino acids and total protein.
For mPO5-5, six of 27 positional candidates had predicted functions contributing to either the carbohydrate metabolic process or fatty acid activation and biosynthesis (Table 2 and Figure 2). Proteins coded by Glyma.05g216400, Glyma.05g216700 and Glyma.05g217100 are putatively involved in increasing the hexose phosphate pool, which is the backbone of the main metabolic pathways and exchange between cellular compartments [80,81,82]. The remaining three candidate genes encoded proteins for fatty acid activation and biosynthesis via triacylglycerol (TAG) degradation. Oil crops, such as soybean, oilseed rape and sunflower, store 20–60% of dry weight oil in the form of TAG [83]. These three candidate genes involved in TAG degradation may contribute to changes of oil accumulation in the seed.
Of the 23 positional candidate genes within mPO6-3, five putatively encode proteins involved in major metabolic processes, such as TAG degradation (Glyma.06g087100), gluconeogenesis (Glyma.06g087800), amino acid transportation (Glyma.06g088200 and Glyma.06g088300) and glycolysis (Glyma.06g088600) (Table 2 and Figure 2). As noted for several candidate genes in mPO5-5 (see as above), Glyma.06g087100 may control oil content in seed by TAG degradation. Glyma.06g087800 putatively encoded a malate dehydrogenase. Malate is oxidized and the resulting oxaloacetate is converted into hexoses by gluconeogenesis, so this candidate gene may contribute to increasing the hexose pool for production of amino acids, polysaccharides, other metabolic intermediates, and energy [84].
Meta-QTL mPO15-1 encompassed 49 positional candidate genes. Seven of these candidate genes putatively encode contributing factors to the biosynthesis of jasmonic acid, threonine, cell wall and alkaloid as well as degradation of protein and sucrose (Table 2 and Figure 2). Glyma.15g028200 annotated as a peroxidase is involved in active oxygen species-scavenging systems [85] and methylglyoxal degradation by Glyma.15g028900 may serve to increase the level of pyruvate [86].
Meta-QTL mPO15-2 encompassed positional 14 candidate genes, including Glyma.15g049100 and Glyma.15g050100 (Table 2 and Figure 2). Glyma.15g049100 putatively encodes a vinorine synthase, playing a role in alkaloid biosynthesis. Glyma.15g050100 putatively encodes a fructose-bisphosphatase, a key enzyme in glycolysis/sucrose biosynthesis [87,88]. Thus, this gene might be involved in carbon partitioning and further regulating protein and oil content in soybean.
Among the 12 positional candidate genes encompassed by mPO15-5, notable functional candidates are Glyma.15g142500 and Glyma.15g143100, which are putatively involved in cell wall degradation and acetyl-CoA biosynthesis, respectively (Table 2 and Figure 2). Enzymes in cell wall degradation of cell wall including glucan endo-1,3-β-d-glucosidase (Glyma.15g142500) involved in the complete hydrolysis of polysaccharides to glucose can lead to protein and oil accumulation [89].
Among the 26 positional candidate genes within mP20-2 and mPCM20-2 were eight functional candidates (Figure 2 and Table 2); however, only three functional candidate genes were within the further narrowed region defined by mPO20-2. Encompassed by these three meta-QTL, is Glyma.20g024800 which putatively encodes a pyruvate kinase, the key enzyme of glycolysis. Pyruvate kinase leads to the tricarboxylic acid (TCA) cycle and provides pyruvate for the fatty acid biosynthesis in seeds [90]. In addition there are two functional candidate genes also encompassed by these three meta-QTL. Glyma.20g025200 has a putative function in ascorbic acid biosynthesis and degradation, potentially influencing the hexose phosphate pool [91], whereas Glyma.20g025400 has a putative function in asparagine biosynthesis, potentially influencing flux through the TCA cycle as well as the pool of Aspartate (Asp), a precursor to the Met and other Asp family amino acids [92].
Among the 49 positional candidates within the region of mP20-3, mO20-4, mPO20-4, and mPCM20-3 were nine putative functional candidate genes. These candidates genes putatively encode precursors to TAG biosynthesis (Glyma.20g121200, Glyma.20g121300), contributed to metabolic flux from the hexose phosphate pool (Glyma.20g120300, Glyma.20g118000, Glyma.20g122500), involved in amino acid transport (Glyma.20g121400, Glyma.20g121500), and collagen biosynthesis from its precursor, an ASP family amino acid, Lys (Glyma.20g122300, Glyma20g.122400) [92] (Table 2 and Figure 2).
4. Materials and Methods
4.1. Collection of Mapping and QTL Information for Soybean Protein, Oil, Amino Acids and Fatty Acids
Literature including scientific journals and available theses and dissertations were mined for QTL mapping studies conducted on soybean seed contents and compositions of protein and oil. Recent literature published up to and including 2016 were mined for relevant QTL mapping studies by search of Google Scholar using key words. In addition, mapping studies identified from SoyBase (available online: http://soybase.org) were also included in the study. Parents, size, crossing type and generation of population and genetic map information of each population were collected. For each QTL, name, trait, experiment location, year of experiment, names of chromosome and linkage group, LOD score, R2 value (proportion of phenotypic variance explained), most likely position of QTL (in cM) and confidence interval (CI, in cM) were collected. If the CI of a QTL was not provided, the formula proposed by [93] was used for calculation of a 95% of CI,
where N is the size of population. CI of both backcross and F2 populations were calculated using equation (1), equation (2) was applied to QTL studies carried out using recombinant inbred line populations. The formula derived from [94] was used for the estimation of LOD, which is the explanatory power of a QTL, if the LOD value was not reported,
All information was arranged by the name of the originating map. QTL information were discarded if R2 value is unavailable from the original study.
CI = 530/(N × R2)
CI = 163/(N × R2)
R2 = 1 − 10(−2 LOD/N)
4.2. Meta-QTL Analysis
Using the soybean consensus map [44] as a reference map, QTLs for protein content, amino acid composition, oil content and fatty acid composition were projected on the reference map by BioMercator V4.2 [95]. For QTL projection on the soybean reference map, two default parameters were considered; (i) 0.25 was applied as the minimum value of the ratio of the flanking marker interval distance and (ii) 0.5 was applied as the minimum P value threshold for testing homogeneity of the flanking marker interval distances between original and consensus maps. If any QTL was not projected on the newly built map, it was excluded.
Meta-analyses were performed to validate and refine confidence intervals of QTLs from those QTLs projected onto the reference map. This was done using BioMercator V4.2, including algorithms from MetaQTL [49]. In Meta-analysis step 1/2 [49], the projected QTLs were clustered by each chromosome using default parameters and traits for protein, oil, amino acid, fatty acid and combined, correlated traits. A total of five criteria, which are Akaike information criterion (AIC), corrected Akaike information criterion (AICc and AIC3), Bayesian information criterion (BIC) and approximate weight of evidence (AWE), were used for examination of potential meta-QTL models with the output from ClustQTL suggesting the best model for the next step. In Meta-analysis step 2/2, Meta-QTLs were generated in accordance with the best model [49].
4.3. Identification of Candidate Genes
Flanking/closest left or right markers of the CI of each meta-QTL were selected, only if these markers were presented on both the reference map and G. max genome assembly version Glyma.Wm82.a2.v1 (available online: http://soybase.org). Detailed information of each candidate gene was obtained from SoyBase (available online: http://soybase.org) and Phytozome v12.0 (available online: http://www.phytozome.net) for those meta-QTLs encompassing 50 or fewer positional candidate genes.
5. Conclusions
Comparisons of QTLs across multiple populations can be difficult due in part to the limited number of common markers shared across the populations. Our meta-analyses were able to integrate and project over 250 QTLs for seed composition onto a reference map, the soybean consensus map 4.0 [44]. Meta-analysis of QTLs helps to extricate robust loci which have been identified in multiple studies and defines an, often narrower, CI for those robust loci. In our study, the CIs for meta-QTLs were further narrowed through the incorporation of QTLs from multiple, correlated traits. In combination with a physical map (Gmax2.0), the flanking markers defining the meta-QTLs were used to identify a limited list of positional candidate genes from which functional candidates for seed composition traits could be selected based on putative functional annotations of the candidate genes. These genes provide potential targets for marker-assisted selection, fine mapping and positional cloning.
Supplementary Materials
Supplementary materials can be found at www.mdpi.com/1422-0067/18/6/1180/s1.
Acknowledgments
Salaries and research support were provided by the United Soybean Board and The Ohio State University/Ohio Agricultural Research and Development Center.
Author Contributions
Leah K. McHale conceived of and Kyujung Van carried out the data collection and analysis. Both authors wrote and approved of the final manuscript.
Conflicts of Interest
The authors declare no conflict of interest.
Abbreviations
| AIC | Akaike information criterion |
| AICc | Corrected Akaike information criterion |
| AIC3 | Corrected Akaike information criterion |
| Asp | Aspartate |
| AWE | Approximate weight of evidence |
| BIC | Bayesian information criterion |
| Chr | Chromosome |
| CI | Confidence interval |
| cM | Centimorgan |
| Cys | Cysteine |
| FAD2 | Microsomal oleate desaturase |
| FAD3 | ω-3 fatty-acid desaturase |
| Gmax2.0 | Glyma.Wm82.a2.v1 |
| KAS II | 3-keto-acyl-ACP synthase II |
| kb | Kilobase |
| LOD | Logarithm (base 10) of odds |
| LG | Linkage group |
| Lys | Lysine |
| Met | Methionine |
| mO | Meta-QTL for oil |
| mP | Meta-QTL for protein |
| mPO | Meta-QTL for protein and oil in combination |
| mPCM | Meta-QTL for protein, cysteine, and methionine in combination |
| PTHR | Protein analysis through evolutionary relationships |
| QTL | Quantitative trait loci |
| SACPD-C | Δ9-stearoyl-acyl-carrier-protein-desaturase |
| SoyBase | SoyBase and the Soybean Breeder’s Toolbox |
| SoyCys7.0 | Soybean metabolic pathway reference database |
| TAG | Triacylglycerol |
| TCA | Tricarboxylic acid |
| Thr | Threonine |
References
- Foyer, C.H.; Lam, H.-M.; Nguyen, H.T.; Siddique, K.H.M.; Varshney, R.K.; Colmer, T.D.; Cowling, W.; Bramley, H.; Mori, T.A.; Hodgson, J.M.; et al. Neglecting legumes has compromised human health and sustainable food production. Nat. Plants 2016, 2, 16112. [Google Scholar] [CrossRef] [PubMed]
- Jones, S.J.; Vodkin, L.O. Using RNA-Seq to profile soybean seed development from fertilization to maturity. PLoS ONE 2013, 8, e59270. [Google Scholar] [CrossRef] [PubMed]
- Solomon, B.D.; Banerjee, A.; Acevedo, A.; Halvorsen, K.E.; Eastmond, A. Policies for the sustainable development of biofuels in the Pan American region: A review and synthesis of five countries. Environ. Manag. 2015, 56, 1276–1294. [Google Scholar] [CrossRef] [PubMed]
- Soystats. Available online: http://www.soystats.com/ (accessed on 7 June 2015).
- Warrington, C.V.; Abdel-Haleem, H.; Hyten, D.L.; Cregan, P.B.; Orf, J.H.; Killam, A.K.; Bajjalieh, N.; Li, Z.; Boerma, H.R. QTL for seed protein and amino acids in the Benning x Danbaekkong soybean population. Theor. Appl. Genet. 2015, 128, 839–850. [Google Scholar] [CrossRef] [PubMed]
- Guschina, I.A.; Everard, J.D.; Kinney, A.J.; Quant, P.A.; Harwood, J.L. Studies on the regulation of lipid biosynthesis in plants: Application of control analysis to soybean. Biochim. Biophys. Acta 2014, 1838, 1488–1500. [Google Scholar] [CrossRef] [PubMed]
- Reinprecht, Y.; Pauls, K.P. Microsomal ω-3 fatty acid desaturase genes in low linolenic acid soybean line RG10 and validation of major linolenic acid QTL. Front. Genet. 2016, 7, 38. [Google Scholar] [CrossRef] [PubMed]
- Clemente, T.E.; Cahoon, E.B. Soybean oil: Genetic approaches for modification of functionality and total content. Plant Physiol. 2009, 151, 1030–1040. [Google Scholar] [CrossRef] [PubMed]
- Cahoon, E.B.; Clemente, T.E.; Damude, H.G.; Kinney, A.J. Modifying vegetable oils for food and non-food purposes. In Handbook of Plant Breeding, Vol. 4, Oil Crops; Vollmann, J., Rajcan, I., Eds.; Springer: New York, NY, USA, 2010; pp. 31–56. [Google Scholar]
- Wang, X.; Jiang, G.L.; Green, M.; Scott, R.A.; Song, Q.; Hyten, D.L.; Cregan, P.B. Identification and validation of quantitative trait loci for seed yield, oil and protein contents in two recombinant inbred line populations of soybean. Mol. Genet. Genom. 2014, 289, 935–949. [Google Scholar] [CrossRef] [PubMed]
- Wang, J.; Chen, P.; Wang, D.; Shannon, G.; Zeng, A.; Orazaly, M.; Wu, C. Identification and mapping of stable QTL for protein content in soybean seeds. Mol. Breed. 2015, 35, 92. [Google Scholar] [CrossRef]
- Zhang, Y.H.; Liu, M.F.; He, J.B.; Wang, Y.F.; Xing, G.N.; Li, Y.; Yang, S.P.; Zhao, T.J.; Gai, J.Y. Molecular-assisted breeding for transgressive seed protein content in soybean [Glycine max (L.) Merr.]. Theor. Appl. Genet. 2015, 128, 1061–1072. [Google Scholar] [CrossRef] [PubMed]
- Leite, D.C.; Pinheiro, J.B.; Campos, J.B.; Di Mauro, A.O.; Uneda-Trevisoli, S.H. QTL mapping of soybean oil content for marker-assisted selection in plant breeding program. Genet. Mol. Res. 2016, 15, 1–11. [Google Scholar] [CrossRef] [PubMed]
- Goffinet, B.; Gerber, S. Quantitative trait loci: A meta-analysis. Genet 2000, 155, 463–473. [Google Scholar]
- Khowaja, F.; Norton, G.; Courtois, B.; Price, A. Improved resolution in the position of drought-related QTLs in a single mapping population of rice by meta-analysis. BMC Genom. 2009, 10, 276. [Google Scholar] [CrossRef] [PubMed]
- Zhang, L.Y.; Liu, D.C.; Guo, X.L.; Yang, W.L.; Sun, J.Z.; Wang, D.W.; Zhang, A. Genomic distribution of quantitative trait loci for yield and yield-related traits in common wheat. J. Integr. Plant Biol. 2010, 52, 996–1007. [Google Scholar] [CrossRef] [PubMed]
- Said, J.; Song, M.; Wang, H.; Lin, Z.; Zhang, X.; Fang, D.; Zhang, J. A comparative meta-analysis of QTL between intraspecific Gossypium hirsutum and interspecific G. hirsutum x G. barbadense populations. Mol. Genet. Genom. 2015, 290, 1003–1025. [Google Scholar] [CrossRef] [PubMed]
- Wang, Y.; Xu, J.; Deng, D.; Ding, H.; Bian, Y.; Yin, Z.; Wu, Y.; Zhou, B.; Zhao, Y. A comprehensive meta-analysis of plant morphology, yield, stay-green, and virus disease resistance QTL in maize (Zea mays L.). Planta 2016, 243, 459–471. [Google Scholar] [CrossRef] [PubMed]
- Zhang, X.; Shabala, S.; Koutoulis, A.; Shabala, L.; Zhou, M. Meta-analysis of major QTL for abiotic stress tolerance in barley and implications for barley breeding. Planta 2017, 245, 283–295. [Google Scholar] [CrossRef] [PubMed]
- Guo, B.; Sleper, D.A.; Lu, P.; Shannon, J.G. QTLs associated with resistance to soybean cyst nematode in soybean: Meta-analysis of QTL location. Crop Sci. 2006, 46, 595–602. [Google Scholar] [CrossRef]
- Sun, Y.; Luan, H.; Qi, Z.; Shan, D.; Liu, C.; Hu, G.; Chen, Q. Mapping and meta-analysis of height QTLs in soybean. Legum. Genom. Genet. 2012, 3, 1–7. [Google Scholar] [CrossRef]
- Sun, Y.N.; Pan, J.B.; Shi, X.L.; Du, X.Y.; Wu, Q.; Qi, Z.M.; Jiang, H.W.; Xin, D.W.; Liu, C.Y.; Hu, G.H.; Chen, Q.S. Multi-environment mapping and meta-analysis of 100-seed weight in soybean. Mol. Biol. Rep. 2012, 39, 9435–9443. [Google Scholar] [CrossRef] [PubMed]
- Hwang, S.; King, C.A.; Chen, P.; Ray, J.D.; Cregan, P.B.; Carter, T.E., Jr.; Li, Z.; Abdel-Haleem, H.; Matson, K.W.; Schapaugh, W., Jr.; et al. Meta-analysis to refine map position and reduce confidence intervals for delayed-canopy-wilting QTLs in soybean. Mol. Breed. 2016, 36, 1–14. [Google Scholar] [CrossRef]
- Qi, Z.M.; Sun, Y.N.; Wu, Q.; Liu, C.Y.; Hu, G.H.; Chen, Q.S. A meta-analysis of seed protein concentration QTL in soybean. Can. J. Plant Sci. 2011, 91, 221–230. [Google Scholar] [CrossRef]
- Qi, Z.M.; Wu, Q.; Han, X.; Sun, Y.N.; Du, X.Y.; Liu, C.Y.; Jiang, H.W.; Hu, G.H.; Chen, Q.S. Soybean oil content QTL mapping and integrating with meta-analysis method for mining genes. Euphytica 2011, 179, 499–514. [Google Scholar] [CrossRef]
- Eskandari, M.; Cober, E.R.; Rajcan, I. Genetic control of soybean seed oil: II. QTL and genes that increase oil concentration without decreasing protein or with increased seed yield. Theor. Appl. Genet. 2013, 126, 1677–1687. [Google Scholar] [CrossRef] [PubMed]
- Yao, D.; Wang, P.W.; Zhang, J.; Liu, Z.Z.; Guan, S.Y.; Liu, S.Y.; Qu, J. Inheritance analysis and mapping QTL on fat content trait in soybean. J. S. China Agric. Univ. 2012, 33, 438–443. [Google Scholar] [CrossRef]
- Lu, W.; Wen, Z.; Li, H.; Yuan, D.; Li, J.; Zhang, H.; Huang, Z.; Cui, S.; Du, W. Identification of the quantitative trait loci (QTL) underlying water soluble protein content in soybean. Theor. Appl. Genet. 2013, 126, 425–433. [Google Scholar] [CrossRef] [PubMed]
- Mao, T.; Jiang, Z.; Han, Y.; Teng, W.; Zhao, X.; Li, W. Identification of quantitative trait loci underlying seed protein and oil contents of soybean across multi-genetic backgrounds and environments. Plant Breed. 2013, 132, 630–641. [Google Scholar] [CrossRef]
- Pathan, S.M.; Vuong, T.; Clark, K.; Lee, J.D.; Shannon, J.G.; Roberts, C.A.; Ellersieck, M.R.; Burton, J.W.; Cregan, P.B.; Hyten, D.L.; et al. Genetic mapping and confirmation of quantitative trait loci for seed protein and oil contents and seed weight in soybean. Crop Sci. 2013, 53, 765–774. [Google Scholar] [CrossRef]
- Rossi, M.E.; Orf, J.H.; Liu, L.J.; Dong, Z.; Rajcan, I. Genetic basis of soybean adaptation to North American vs. Asian mega-environments in two independent populations from Canadian x Chinese crosses. Theor. Appl. Genet. 2013, 126, 1809–1823. [Google Scholar] [CrossRef] [PubMed]
- Yesudas, C.R.; Bashir, R.; Geisler, M.B.; Lightfoot, D.A. Identification of germplasm with stacked QTL underlying seed traits in an inbred soybean population from cultivars Essex and Forrest. Mol. Breed. 2013, 31, 693–703. [Google Scholar] [CrossRef]
- Akond, M.; Liu, S.; Boney, M.; Kantartzi, S.K.; Meksem, K.; Bellaloui, N.; Lightfoot, D.A.; Kassem, M.A. Identification of quantitative trait loci (QTL) underlying protein, oil, and five major fatty acids' contents in soybean. Am. J. Plant Sci. 2014, 5, 158–167. [Google Scholar] [CrossRef]
- Wang, J.; Chen, P.; Wang, D.; Shannon, G.; Shi, A.; Zeng, A.; Orazaly, M. Identification of quantitative trait loci for oil content in soybean seed. Crop Sci. 2015, 55, 23–34. [Google Scholar] [CrossRef]
- Kim, M.; Schultz, S.; Nelson, R.L.; Diers, B.W. Identification and fine mapping a soybean seed protein QTL from PI 407788A on chromosome 15. Crop Sci. 2016, 56, 219–225. [Google Scholar] [CrossRef]
- Qi, Z.; Pan, J.; Han, X.; Qi, H.; Xin, D.; Li, W.; Mao, X.; Wang, Z.; Jiang, H.; Liu, C.; et al. Identification of major QTLs and epistatic interactions for seed protein concentration in soybean under multiple environments based on a high-density map. Mol. Breed. 2016, 36, 1–16. [Google Scholar] [CrossRef]
- Xie, D.; Han, Y.; Zeng, Y.; Chang, W.; Teng, W.; Li, W. SSR- and SNP-related QTL underlying linolenic acid and other fatty acid contents in soybean seeds across multiple environments. Mol. Breed. 2012, 30, 169–179. [Google Scholar] [CrossRef]
- Fallen, B.D.; Hatcher, C.N.; Allen, F.L.; Kopsell, D.A.; Saxton, A.M.; Chen, P.; Kantartzi, S.K.; Cregan, P.B.; Hyten, D.L.; Pantalone, V.R. Soybean seed amino acid content QTL detected using universal soy linkage panel 1.0 with 1,536 SNPs. J. Plant Genome Ser. 2013, 1, 68–79. [Google Scholar] [CrossRef]
- Ha, B.K.; Kim, H.J.; Velusamy, V.; Vuong, T.D.; Nguyen, H.T.; Shannon, J.G.; Lee, J.D. Identification of quantitative trait loci controlling linolenic acid concentration in PI83463 (Glycine soja). Theor. Appl. Genet. 2014, 127, 1501–1512. [Google Scholar] [CrossRef] [PubMed]
- Ramamurthy, R.K.; Jedlicka, J.; Graef, G.L.; Waters, B.M. Identification of new QTLs for seed mineral, cysteine, and methionine concentrations in soybean [Glycine max (L.) Merr.]. Mol. Breed. 2014, 34, 431–445. [Google Scholar] [CrossRef]
- Wang, X.Z.; Jiang, G.L.; Green, M.; Scott, R.A.; Hyten, D.L.; Cregan, P.B. Quantitative trait locus analysis of unsaturated fatty acids in a recombinant inbred population of soybean. Mol. Breed. 2014, 33, 281–296. [Google Scholar] [CrossRef]
- Khandaker, L.; Akond, M.; Liu, S.; Kantartzi, S.K.; Meksem, K.; Bellaloui, N.; Lightfoot, D.A.; Kassem, M.A. Mapping of QTL associated with seed amino acids content in “MD96-5722” by “Spencer” RIL population of soybean using SNP markers. Food Nut. Sci. 2015, 6, 974–984. [Google Scholar] [CrossRef]
- Yan, L.; Deng, Y.; Song, Q.; Cregan, P.B.; Chen, P.; Lei, Y.; Yang, C.; Chen, Q.; Di, R.; Liu, B.; et al. Identifying and validating a quantitative trait locus on chromosome 14 underlying stearic acid in a soybean landrace. J. Crop Improv. 2016, 30, 152–164. [Google Scholar] [CrossRef]
- Hyten, D.L.; Choi, I.Y.; Song, Q.; Specht, J.E.; Carter, T.E., Jr.; Shoemaker, R.C.; Hwang, E.Y.; Matukumalli, L.K.; Cregan, P.B. A high density integrated genetic linkage map of soybean and the development of 1536 universal soy linkage panel for quantitative trait locus mapping. Crop Sci. 2010, 50, 1–9. [Google Scholar] [CrossRef]
- Burton, J.W. Quantitative genetics: Results relevant to soybean breeding. In Soybeans: Improvement, Production and Uses, 2nd ed.; Wilcox, J.R., Ed.; Agron. Monogr. 16; ASA, CSSA, and SSSA: Madison, WI, USA, 1987; pp. 211–247. [Google Scholar]
- Chung, J.; Babka, H.L.; Graef, G.L.; Staswick, P.E.; Lee, D.J.; Cregan, P.B.; Shoemaker, R.C.; Specht, J.E. The seed protein, oil, and yield QTL on soybean linkage group I. Crop Sci. 2003, 43, 1053–1067. [Google Scholar] [CrossRef]
- Panthee, D.R.; Pantalone, V.R.; Sams, C.E.; Saxton, A.M.; West, D.R.; Orf, J.H.; Killam, A.S. Quantitative trait loci controlling sulfur containing amino acids methionine and cysteine in soybean seeds. Theor. Appl. Genet. 2006, 112, 546–553. [Google Scholar] [CrossRef] [PubMed]
- Panthee, D.R.; Pantalone, V.R.; Saxton, A.M.; West, D.R.; Sams, C.E. Genomic regions associated with amino acid composition in soybean. Mol. Breed. 2006, 17, 79–89. [Google Scholar] [CrossRef]
- Veyrieras, J.; Goffinet, B.; Charcosset, A. MetaQTL: A package of new computational methods for the meta-analysis of QTL mapping experiments. BMC Bioinform. 2007, 8, 49–64. [Google Scholar] [CrossRef] [PubMed]
- Aghoram, K.; Wilson, R.F.; Burton, J.W.; Dewey, R.E. A mutation in a 3-keto-acyl-ACP synthase II gene is associated with elevated palmitic acid levels in soybean seeds. Crop Sci. 2006, 46, 2453–2459. [Google Scholar] [CrossRef]
- Bilyeu, K.D.; Palavalli, L.; Sleper, D.A.; Beuselinck, P.R. Three microsomal ω-3 fatty-acid desaturase genes contribute to soybean linolenic acid levels. Crop Sci. 2003, 43, 1833–1838. [Google Scholar] [CrossRef]
- Li, L.; Wang, X.; Gai, J.; Yu, D. Molecular cloning and characterization of a novel microsomal oleate desaturase gene from soybean. J. Plant Physiol. 2007, 164, 1516–1526. [Google Scholar] [CrossRef] [PubMed]
- Zhang, P.; Burton, J.W.; Upchurch, R.G.; Whittle, E.; Shanklin, J.; Dewey, R.E. Mutations in a Δ9-stearoyl-ACP-desaturase gene are associated with enhanced stearic acid levels in soybean seeds. Crop Sci. 2008, 48, 2305–2313. [Google Scholar] [CrossRef]
- Stasko, A.K.; Wickramasinghe, D.; Nauth, B.J.; Acharya, B.; Ellis, M.L.; Taylor, C.G.; McHale, L.K.; Dorrance, A.E. High-density mapping of resistance QTL toward Phytophthora sojae, Pythium irregulare, and Fusarium graminearum in the same soybean population. Crop Sci. 2016, 56, 2476–2492. [Google Scholar] [CrossRef]
- Salvi, S.; Tuberosa, R. To clone or not to clone plant QTLs: Present and future challenges. Trend. Plant Sci. 2005, 10, 297–304. [Google Scholar] [CrossRef] [PubMed]
- Fasoula, V.A.; Harris, D.K.; Boerma, H.R. Validation and designation of quantitative trait loci for seed protein, seed oil, and seed weight from two soybean populations. Crop Sci. 2004, 44, 1218–1225. [Google Scholar] [CrossRef]
- Diers, B.W.; Kein, P.; Shoemaker, R.C.; Fehr, W.R. RFLP analysis of soybean seed protein and oil content. Theor. Appl. Genet. 1992, 83, 608–612. [Google Scholar] [CrossRef] [PubMed]
- Nichols, D.M.; Glover, K.D.; Carlson, S.R.; Specht, J.E.; Diers, B.W. Fine mapping of a seed protein QTL on soybean linkage group I and its correlated effects on agronomic traits. Crop Sci. 2006, 46, 834–839. [Google Scholar] [CrossRef]
- Lander, E.; Kruglyak, L. Genetic dissection of complex traits: Guidelines for interpreting and reporting linkage results. Nat. Genet. 1995, 11, 241–247. [Google Scholar] [CrossRef] [PubMed]
- Ooijen, J.W. LOD significance thresholds for QTL analysis in experimental populations of diploid species. Hered. 1999, 83, 613–624. [Google Scholar] [CrossRef]
- Brummer, E.C.; Graef, G.L.; Orf, J.H.; Wilcox, J.R.; Shoemaker, R.C. Mapping QTL for seed protein and oil content in eight soybean populations. Crop Sci. 1997, 37, 370–378. [Google Scholar] [CrossRef]
- Csanadi, G.; Vollmann, J.; Stift, G.; Lelley, T. Seed quality QTLs identified in a molecular map of early maturing soybean. Theor. Appl. Genet. 2001, 103, 912–919. [Google Scholar] [CrossRef]
- Specht, J.E.; Chase, K.; Macrander, M.; Graef, G.L.; Chung, J.; Markwell, J.P.; Germann, M.; Orf, J.H.; Lark, K.G. Soybean response to water: A QTL analysis of drought tolerance. Crop Sci. 2001, 41, 493–509. [Google Scholar] [CrossRef]
- Tajuddin, T.; Watanabe, S.; Yamanaka, N.; Harada, K. Analysis of quantitative trait loci for protein and lipid contents in soybean seeds using recombinant inbred lines. Breed. Sci. 2003, 53, 133–140. [Google Scholar] [CrossRef]
- Hyten, D.L.; Pantalone, V.R.; Sams, C.E.; Saxton, A.M.; Landau-Ellis, D.; Stefaniak, T.R.; Schmidt, M.E. Seed quality QTL in a prominent soybean population. Theor. Appl. Genet. 2004, 109, 552–561. [Google Scholar] [CrossRef] [PubMed]
- Zhang, W.K.; Wang, Y.J.; Luo, G.Z.; Zhang, J.S.; He, C.Y.; Wu, X.L.; Gai, J.Y.; Chen, S.Y. QTL mapping of ten agronomic traits on the soybean (Glycine max L. Merr.) genetic map and their association with EST markers. Theor. Appl. Genet. 2004, 108, 1131–1139. [Google Scholar] [CrossRef] [PubMed]
- Reinprecht, Y.; Poysa, V.; Yu, K.; Rajcan, I.; Ablett, G.; Pauls, K. Seed and agronomic QTL in low linolenic acid, lipoxygenase-free soybean (Glycine max (L.) Merrill) germplasm. Genome 2006, 49, 1510–1527. [Google Scholar] [PubMed]
- Chen, Q.S.; Zhang, Z.C.; Liu, C.Y.; Xin, D.W.; Qiu, H.M.; Shan, D.P.; Shan, C.Y.; Hu, G.H. QTL analysis of major agronomic traits in soybean. Agric. Sci. China 2007, 6, 399–405. [Google Scholar] [CrossRef]
- Li, H.; Zhao, T.; Wang, Y.; Yu, D.; Chen, S.; Zhou, R.; Gai, J. Genetic structure composed of additive QTL, epistatic QTL pairs and collective unmapped minor QTL conferring oil content and fatty acid components of soybeans. Euphytica 2011, 182, 117–132. [Google Scholar] [CrossRef]
- Akond, A.S.M.G.; Ragin, B.; Bazzelle, R.; Kantartzi, S.K.; Meksem, K.; Kassem, M.A. Quantitative trait loci associated with moisture, protein, and oil content in soybean [Glycine max (L.) Merr.]. J. Agric. Sci. 2012, 4, 16–25. [Google Scholar] [CrossRef]
- Wang, X.Z.; Jiang, G.L.; Green, M.; Scott, R.A.; Hyten, D.L.; Cregan, P.B. Quantitative trait locus analysis of saturated fatty acids in a population of recombinant inbred lines of soybean. Mol. Breed. 2012, 30, 1163–1179. [Google Scholar] [CrossRef]
- Jedlicka, J. Evaluation of Four Biparental Soybean Populations for Identification of Seed Oil QTL, Cytoplasmic Effects, and Genotype x Environment Interactions. Ph.D. Thesis, University of Nebraska, Lincoln, NE, USA, August 2014. [Google Scholar]
- Qi, Z.; Hou, M.; Han, X.; Liu, C.; Jiang, H.; Xin, D.; Hu, G.; Chen, Q. Identification of quantitative trait loci (QTLs) for seed protein concentration in soybean and analysis for additive effects and epistatic effects of QTLs under multiple environments. Plant Breed. 2014, 133, 499–507. [Google Scholar] [CrossRef]
- Fan, S.; Li, B.; Yu, F.; Han, F.; Yan, S.; Wang, L.; Sun, J. Analysis of additive and epistatic quantitative trait loci underlying fatty acid concentrations in soybean seeds across multiple environments. Euphytica 2015, 206, 689–700. [Google Scholar] [CrossRef]
- Asekova, S.; Kulkarni, K.P.; Kim, M.; Kim, J.H.; Song, J.T.; Shannon, J.G.; Lee, J.D. Novel quantitative trait loci for forage quality traits in a cross between PI 483463 and 'Hutcheson' in soybean. Crop Sci. 2016, 56, 2600–2611. [Google Scholar] [CrossRef]
- Zhang, Y.; Butelli, E.; Martin, C. Engineering anthocyanin biosynthesis in plants. Curr. Opin. Plant Biol. 2014, 19, 81–90. [Google Scholar] [CrossRef] [PubMed]
- Niinemets, U.; Kannaste, A.; Copolovici, L. Quantitative patterns between plant volatile emissions induced by biotic stresses and the degree of damage. Front. Plant Sci. 2013, 4, 262. [Google Scholar] [CrossRef] [PubMed]
- Li, M.; Xu, C.; Li-Beisson, Y.; Philippar, K. Fatty acid and lipid transport in plant cells. Trends Plant Sci. 2016, 21, 145–158. [Google Scholar] [CrossRef] [PubMed]
- De Jong, F.; Thodey, K.; Lejay, L.V.; Bevan, M.W. Glucose elevates NITRATE TRANSPORTER2.1 protein levels and nitrate transport activity independently of its HEXOKINASE1-mediated stimulation of NITRATE TRANSPOTER2.1 expression. Plant Physiol. 2014, 164, 308–320. [Google Scholar] [CrossRef] [PubMed]
- Li, C.; Wang, Y.; Liu, L.; Hu, Y.; Zhang, F.; Mergen, S.; Wang, G.; Schlappi, M.R.; Chu, C. A rice plastidial nucleotide sugar epimerase is involved in galactolipid biosynthesis and improves photosynthetic efficiency. PLoS Genet. 2011, 7, e1002196. [Google Scholar] [CrossRef] [PubMed]
- Valliyodan, B.; Nguyen, H.T. Biological mechanisms that influence soy protein concentration and composition. In Designing Soybeans for 21st Century Markets; Wilson, R.L., Ed.; Elsevier: Urbana, IL, USA, 2012; pp. 129–157. [Google Scholar]
- Dieuaide-Noubhani, M.; Alonso, A.P. Application of metabolic flux analysis to plants. In Plant Metabolic Flux Analysis, Methods and Protocols; Dieuaide-Noubhani, M., Alonso, A.P., Eds.; Humana Press: New York, NY, USA, 2014; pp. 1–17. [Google Scholar]
- Schwender, J.; Hebbelmann, J.; Heinzel, N.; Hildebrandt, T.; Rogers, A.; Naik, D.; Klapperstuck, M.; Braun, H.P.; Schreiber, F.; Denolf, P.; et al. Quantitative multilevel analysis of central metabolism in developing oilseeds of oilseed rape during in vitro culture. Plant Physiol. 2015, 168, 828–848. [Google Scholar] [CrossRef] [PubMed]
- Selinski, J.; Konlg, N.; Wellmeyer, B.; Hanke, G.T.; Linke, V.; Neuhaus, H.E.; Scheibe, R. The plastid-localized NAD-dependent malate dehydrogenase in crucial for energy homeostasis in developing Arabidopsis thaliana seeds. Mol. Plant 2014, 7, 170–186. [Google Scholar] [CrossRef] [PubMed]
- Das, P.; Nutan, K.K.; Singla-Pareek, S.L.; Pareek, A. Oxidative environment and redox homeostasis in plants: Dissecting out significant contribution of major cellular organelles. Front. Environ. Sci. 2015, 2, 1–10. [Google Scholar] [CrossRef]
- Hoque, T.S.; Hossain, M.A.; Mostofa, M.G.; Burritt, D.J.; Fujita, M.; Tran, L.S.P. Methylglycoxal; An emerging signaling molecule in plant abiotic stress responses and tolerance. Front. Plant Sci. 2016, 7, 1341. [Google Scholar] [CrossRef] [PubMed]
- Daie, J. Cytosolic fructose-1,6-bisphosphatase: A key enzyme in the sucrose biosynthetic pathway. Photo. Res. 1993, 38, 5–14. [Google Scholar] [CrossRef] [PubMed]
- Yang, J.T.; Preiser, A.L.; Li, Z.; Weise, S.E.; Sharkey, T.D. Triose phosphate use limitation of photosynthesis: Short-term and long-term effects. Planta 2016, 243, 687–698. [Google Scholar] [CrossRef] [PubMed]
- Jamar, C.; du Jardin, P.; Fauconnier, M.L. Cell wall polysaccharides hydrolysis of malting barley (Hordeum vulgare L.): A review. Biotechnol. Agron. Soc. Environ. 2011, 15, 301–313. [Google Scholar]
- Troncoso-Ponce, M.A.; Nikovics, K.; Marchive, C.; Lepiniec, L.; Baud, S. New insights on the organization and regulation of the fatty acid biosynthetic network in the model higher plant Arabidopsis thaliana. Biochimie 2016, 120, 3–8. [Google Scholar] [CrossRef] [PubMed]
- Barata-Soares, A.D.; Gomez, M.L.P.A.; de Mesquita, C.H.; Lajolo, F.M. Ascorbic acid biosynthesis: A precursor study on plants. Braz. J. Plant Physiol. 2004, 16, 147–154. [Google Scholar] [CrossRef]
- Buchanan, B.B.; Gruissem, W.; Jones, R.L. Biochemistry & Molecular Biology of Plants; Wiley: Rockville, MD, USA, 2000; pp. 358–361, 498–517, 630–636. [Google Scholar]
- Darvasi, A.; Soller, M. A simple method to calculate resolving power and confidence interval of QTL map location. Behav. Genet. 1997, 27, 125–132. [Google Scholar] [CrossRef] [PubMed]
- Nagelkerke, N.J.D. A note on a general definition of the coefficient of determination. Biometrika 1991, 78, 691–692. [Google Scholar] [CrossRef]
- Sosnowski, O.; Charcosset, A.; Joets, J. BioMercator V3: An upgrade of genetic map compilation and quantitative trait loci meta-analysis algorithms. Bioinformatics 2012, 28, 2082–2083. [Google Scholar] [CrossRef] [PubMed]
Figure 1.
Comparisons among protein, oil, protein+oil and protein+Cys+Met meta-quantitative trait loci (meta-QTLs) on Chromosome (Chr) 20 (Linkage group I; LG I). Projected QTL are displayed to the left of Chr 20 for each trait or trait combination. A 95% of confidence interval of each meta-QTL is represented as filled colors on the chromosome arm, with four, five, four and four meta-QTLs identified for protein, oil, protein+oil and protein+Cys+Met, respectively. A detailed view of the projected QTL contributing to each meta-QTL cluster #2 of Chr 20 (Table 1) are also shown on the right of the chromosome. In the detailed view, each bar represents a projected QTL and is color-coded for each trait (protein, khaki; oil, red; cysteine, green; and methionine, blue).

Figure 2.
Overview of metabolic processes involved by positional and functional candidate genes. Candidate genes names from Glyma.Wm82.a2.v1 (Gmax2.0) (available online: http://soybase.org) are shown in bold and color-coded by chromosomes.
Figure 2.
Overview of metabolic processes involved by positional and functional candidate genes. Candidate genes names from Glyma.Wm82.a2.v1 (Gmax2.0) (available online: http://soybase.org) are shown in bold and color-coded by chromosomes.

Table 1.
Meta-Analysis results of quantitative trait loci (QTL) clusters of trait by chromosomes.
| Chr (LG) a | Meta-QTL | Meta-QTL Position (cM) | CI b (cM) | Weight c | Number of Projected QTL d | CI of Projected QTL (cM) | Left Markere | Right Marker e | Physical Distance (bp) | Number of Candidate Genes f | |||||
|---|---|---|---|---|---|---|---|---|---|---|---|---|---|---|---|
| Name | Map Position (cM) | Physical Position f (bp) | Name | Map Position (cM) | Physical Position f (bp) | ||||||||||
| 3 | Protein+Oil | ||||||||||||||
| (N) | mPO3-1 | 20.41 | 18.33–22.49 | 0.13 | 3 | 2.41–29.89 | Satt152 | 17.36 | 3,366,405 | Satt009 | 22.59 | 3,932,012 | 565,607 | 35 | |
| mPO3-2 | 25.09 | 24.63–25.55 | 0.41 | 6 | 12.41–57.02 | BARC-064081-18547 | 23.85 | 4,802,477 | Satt530 | 25.97 | 5,664,735 | 862,258 | 56 | ||
| mPO3-3 | 31.05 | 30.22–31.88 | 0.21 | 5 | 12.41–57.02 | BARC-065251-19285 | 29.93 | 19,028,238 | BARC-011565-00290 | 32.46 | 29,807,303 | 10,779,065 | 268 | ||
| mPO3-4 | 58.97 | 58.49–59.46 | 0.24 | 3 | 34.68–69.21 | Satt549 | 57.27 | 37,342,774 | BARC-010211-00550 | 59.65 | 37,823,900 | 481,126 | 54 | ||
| 5 | Protein+Oil | ||||||||||||||
| (A1) | mPO5-1 | 4.84 | 2.43–7.25 | 0.08 | 1 | 2.57–7.12 | BARC-040651-07808 | 2.45 | 2,295,488 | BARC-019485-03631 | 7.66 | 2,748,936 | 453,448 | 49 | |
| mPO5-2 | 14.61 | 10.52–18.71 | 0.08 | 2 | 10.51–27.99 | BARC-044997-08863 | 9.48 | 3,924,139 | Satt276 | 18.91 | 5,158,700 | 1,234,561 | 123 | ||
| mPO5-3 | 21.36 | 18.80–23.92 | 0.17 | 3 | 10.51–27.65 | Satt276 | 18.91 | 5,158,700 | BARC-014883-01912 | 24.07 | 5,758,793 | 600,093 | 51 | ||
| mPO5-4 | 55.73 | 54.18–57.28 | 0.50 | 6 | 47.87–62.84 | BARC-037207-06739 | 53.77 | 35,375,747 | BARC-040033-07641 | 57.47 | 35,961,573 | 585,826 | 65 | ||
| mPO5-5 | 80.34 | 80.20–80.49 | 0.17 | 2 | 76.61–82.00 | Satt200 | 80.04 | 39,622,009 | BARC-058653-17430 | 80.63 | 39,819,839 | 197,830 | 27 | ||
| 6 | Protein+Oil | ||||||||||||||
| (C2) | mPO6-1 | 5.35 | 3.38–7.33 | 0.07 | 1 | 3.37–7.33 | BARC-041825-08108 | 2.22 | 1,226,605 | BARC-035239-07157 | 11.62 | 1,673,727 | 447,122 | 59 | |
| mPO6-2 | 31.28 | 29.23–33.35 | 0.20 | 3 | 23.02–38.62 | BARC-016957-02165 | 26.08 | 3,823,755 | BARC-059985-16274 | 34.40 | 5,449,370 | 1,625,615 | 209 | ||
| mPO6-3 | 40.84 | 40.28-41.40 | 0.27 | 5 | 23.02–43.44 | BARC-027948-06704 | 40.25 | 6,712097 | BARC-056271-14211 | 41.46 | 6,919,465 | 207,368 | 23 | ||
| mPO6-4 | 48.43 | 46.56–50.31 | 0.13 | 2 | 45.45–51.30 | Satt291 | 42.94 | 7,326,519 | Satt457 | 52.51 | 8,788,659 | 1,462,140 | 161 | ||
| mPO6-5 | 68.48 | 65.44–71.52 | 0.20 | 3 | 61.33–78.84 | BARC-029937-06757 | 65.04 | 10,929,259 | BARC-018663-03235 | 71.60 | 11,925,180 | 995,921 | 133 | ||
| mPO6-6 | 122.19 | 121.81–122.58 | 0.13 | 2 | 117.73-137.09 | Sat_252 | 116.34 | 48,211,060 | BARC-016969-02170 | 126.94 | 49,267,136 | 1,057,076 | 98 | ||
| 7 | Protein+Oil | ||||||||||||||
| (M) | mPO7-1 | 13.43 | 10.83–16.03 | 0.09 | 2 | 12.88–47.24 | BARC-029703-06326 | 10.60 | 1,630781 | Satt150 | 16.86 | 2,434,308 | 755,784 | 96 | |
| mPO7-2 | 20.99 | 18.76–23.23 | 0.10 | 3 | 18.90–47.24 | Sat_316 | 18.67 | 2,722,475 | BARC-054347-12492 | 24.46 | 3,320,310 | 597,835 | 57 | ||
| mPO7-3 | 29.17 | 21.97–36.38 | 0.11 | 2 | 18.90–47.24 | Sat_316 | 18.67 | 2,722,475 | BARC-028455-05917 | 36.98 | 5,937,694 | 3,215,219 | 314 | ||
| mPO7-4 | 37.57 | 33.84–41.30 | 0.22 | 5 | 18.90–55.03 | Satt567 | 32.75 | 4,559,651 | BARC-039195-07465 | 41.37 | 6,567,400 | 2,007,749 | 199 | ||
| mPO7-5 | 44.44 | 41.84–47.04 | 0.39 | 5 | 18.90–55.03 | BARC-042815-08424 | 41.37 | 6,443,468 | BARC-048517-10647 | 47.38 | 8,461,619 | 2,018,151 | 194 | ||
| mPO7-6 | 66.69 | 57.99–75.40 | 0.09 | 1 | 58.99–74.40 | Sat_003 | 57.84 | 12,303,557 | BARC-013407-01480 | 75.42 | 31,260,765 | 18,957,208 | 590 | ||
| 9 g | Protein+Oil | ||||||||||||||
| (K) | mPO9-1 | 14.40 | 8.70–20.10 | 0.09 | 1 | 8.70–20.11 | BARC-051589-11168 | 8.77 | 1,434,250 | BARC-039923-07610 | 21.43 | 3,136,549 | 1,702,299 | 190 | |
| mPO9-2 | 30.67 | 29.23–32.11 | 0.20 | 4 | 21.47–43.20 | BARC-022201-04296 | 28.04 | 4,266,665 | BARC-014659-01609 | 34.03 | 5,901,485 | 1,634,820 | 130 | ||
| mPO9-3 | 40.46 | 39.83–41.10 | 0.61 | 8 | 21.47–52.13 | BARC-062013-17617 | 39.77 | 7,779,719 | BARC-058145-15142 | 41.31 | 21,880,468 | 14,100,749 | 370 | ||
| mPO9-4 | 51.49 | 50.49–52.49 | 0.10 | 2 | 39.00–54.41 | Satt725 | 49.08 | 31,346,707 | Sat_044 | 53.24 | 36,759,518 | 5,412,811 | 214 | ||
| 14 g | Protein+Oil | ||||||||||||||
| (B2) | mPO14-1 | 17.66 | 14.72–20.60 | 0.27 | 3 | 6.09–31.73 | BARC-051559-11161 | 14.48 | 2,598,423 | BARC-021353-04044 | 21.73 | 4,395,242 | 1,796,819 | 201 | |
| mPO14-2 | 48.70 | 46.81–50.60 | 0.62 | 7 | 38.63–61.78 | BARC-064873-18956 | 45.46 | 8,132,273 | BARC-055677-13598 | 53.92 | 9,110,441 | 978,168 | 74 | ||
| mPO14-3 | 57.12 | 55.44–58.80 | 0.11 | 6 | 38.63–61.78 | BARC-014309-01312 | 54.51 | 9,434,565 | Sat_182 | 59.99 | 31,281,020 | 21,846,455 | 482 | ||
| 15 g | Protein+Oil | ||||||||||||||
| (E) | mPO15-1 | 11.68 | 10.09–13.27 | 0.26 | 5 | 5.56–26.90 | BARC-025493-06513 | 9.97 | 2,127,717 | Satt411 | 13.66 | 2,517,428 | 389,711 | 49 | |
| mPO15-2 | 18.98 | 17.96–20.01 | 0.40 | 8 | 5.56–31.24 | BARC-008231-00112 | 17.95 | 3,964,389 | BARC-042857-08439 | 20.04 | 3,846,538 | (117,851)h | 14 | ||
| mPO15-3 | 43.58 | 40.57–46.59 | 0.13 | 2 | 38.22–49.90 | BARC-027480-06591 | 40.00 | 8,304,621 | BARC-018901-03270 | 47.29 | 9,840,775 | 1,536,154 | 179 | ||
| mPO15-4 | 53.21 | 52.75–53.68 | 0.13 | 2 | 48.84–54.45 | BARC-017283-02257 | 53.29 | 10,562,976 | BARC-052667-11557 | 53.77 | 11,139,595 | 576,619 | 57 | ||
| mPO15-5 | 58.03 | 57.93–58.13 | 0.07 | 1 | 57.17–58.89 | BARC-028607-05972 | 57.24 | 11,651,285 | BARC-017755-03124 | 59.38 | 11,818,830 | 167,545 | 12 | ||
| 19 | Protein+Oil | ||||||||||||||
| (L) | mPO19-1 | 15.29 | 12.28–18.31 | 0.27 | 4 | 7.40–35.02 | Satt446 | 10.42 | 1,678,524 | Satt388 | 21.14 | 4,244,178 | 2,565,654 | 165 | |
| mPO19-2 | 34.96 | 31.80–37.83 | 0.15 | 3 | 18.01–53.17 | Satt497 | 31.39 | 33,865,280 | BARC-013203-00448 | 39.34 | 37,425,576 | 3,560,296 | 220 | ||
| mPO19-3 | 50.85 | 48.42–53.28 | 0.24 | 4 | 36.20–62.21 | BARC-016181-02303 | 46.51 | 38,087,635 | BARC-007554-00101 | 54.93 | 39,579,279 | 1,491,644 | 121 | ||
| mPO19-4 | 58.94 | 57.31–60.58 | 0.17 | 3 | 36.20–62.21 | BARC-059657-15973 | 56.99 | 40,154,846 | Satt678 | 61.40 | 43,032,497 | 2,877,651 | 295 | ||
| mPO19-5 | 82.98 | 81.99–83.97 | 0.17 | 2 | 68.81–87.22 | Satt664 | 81.33 | 46,227,991 | BARC-014655-01607 | 84.05 | 46,596,334 | 368,343 | 54 | ||
| 20 | Protein | ||||||||||||||
| (I) | mP20-1 | 15.02 | 12.82–17.23 | 0.20 | 3 | 10.81–22.49 | BARC-055857-13795 | 11.35 | 677,408 | BARC-057033-14543 | 17.68 | 1,738,862 | 1,061,454 | 105 | |
| mP20-2 | 25.43 | 24.37–26.50 | 0.60 | 10 | 10.81–39.24 | Satt367 | 24.01 | 2,615,668 | BARC-040841-07852 | 27.14 | 2,946,641 | 330,973 | 26 | ||
| mP20-3 | 49.47 | 49.17–49.78 | 0.13 | 3 | 47.33–67.38 | BARC-055423-13277 | 44.95 | 36,055,353 | BARC-050455-09643 | 49.92 | 36,575,544 | 520,191 | 49 | ||
| mP20-4 | 60.48 | 54.19–66.77 | 0.07 | 1 | 53.58–67.38 | BARC-025987-05207 | 53.77 | 37,350,343 | Sat_418 | 66.82 | 39,876,415 | 2,526,072 | 270 | ||
| Oil | |||||||||||||||
| mO20-1 | 15.86 | 13.56–18.16 | 0.19 | 5 | 11.13–34.78 | BARC-055857-13795 | 11.35 | 677,408 | BARC-021887-04232 | 18.51 | 1,900,702 | 1.223.294 | 111 | ||
| mO20-2 | 24.08 | 21.90–26.27 | 0.36 | 8 | 13.93–48.44 | BARC-052017-11314 | 19.96 | 2,103,067 | BARC-040841-07852 | 27.14 | 2,946,641 | 843,574 | 63 | ||
| mO20-3 | 35.26 | 29.44–41.09 | 0.14 | 3 | 14.28–48.44 | BARC-057867-14973 | 29.16 | 28,540,212 | BARC-039921-07608 | 42.13 | 35,080,674 | 6,540,462 | 307 | ||
| mO20-4 | 49.47 | 49.47–49.48 | 0.16 | 3 | 29.23–49.64 | BARC-055423-13277 | 44.95 | 36,055,353 | BARC-050455-09643 | 49.92 | 36,575,544 | 520,191 | 49 | ||
| mO20-5 | 64.99 | 62.63–67.36 | 0.15 | 2 | 54.48–75.56 | BARC-017939-02461 | 60.30 | 38,750,487 | BARC-021323-04037 | 67.42 | 39,876,415 | 1,125,928 | 115 | ||
| Protein+Oil | |||||||||||||||
| mPO20-1 | 15.40 | 13.82–16.98 | 0.19 | 9 | 10.81–29.58 | BARC-055857-13795 | 11.35 | 677,408 | BARC-057041-14548 | 17.03 | 1,666,918 | 989,510 | 100 | ||
| mPO20-2 | 24.98 | 24.07–25.90 | 0.46 | 19 | 10.81–48.44 | Satt367 | 24.01 | 2,615,668 | BARC-065829-19777 | 26.05 | 2,795,596 | 179,928 | 14 | ||
| mPO20-3 | 34.29 | 30.15–38.43 | 0.09 | 5 | 14.28–48.44 | BARC-039387-07311 | 30.14 | 27,997,262 | BARC-020713-04700 | 38.61 | 34,052,339 | 6,055,077 | 201 | ||
| mPO20-4 | 49.47 | 49.47–49.47 | 0.26 | 8 | 29.23–66.48 | BARC-055423-13277 | 44.95 | 36,055,353 | BARC-050455-09643 | 49.92 | 36,575,544 | 520,191 | 49 | ||
| Protein+Cys+Met | |||||||||||||||
| mPCM20-1 | 15.03 | 12.84–17.22 | 0.17 | 3 | 10.81–22.49 | BARC-055857-13795 | 11.35 | 677,408 | BARC-057033-14543 | 17.68 | 1,738,862 | 1,061,454 | 105 | ||
| mPCM20-2 | 26.09 | 25.28–26.90 | 0.56 | 11 | 10.81–39.24 | Satt367 | 24.01 | 2,615,668 | BARC-040841-07852 | 27.14 | 2,946,641 | 330,973 | 26 | ||
| mPCM20-3 | 49.47 | 49.40–49.54 | 0.17 | 3 | 47.33–67.38 | BARC-055423-13277 | 44.95 | 36,055,353 | BARC-050455-09643 | 49.92 | 36,575,544 | 520,191 | 49 | ||
| mPCM20-4 | 76.75 | 75.05–78.46 | 0.11 | 2 | 69.83–93.95 | Satt292 | 74.78 | 40,623,844 | Satt162 | 78.82 | 41,416,130 | 792,286 | 85 | ||
* Grey highlighting indicates meta-QTLs with less than 50 positional candidate genes. a Chr, chromosome; LG, linkage group b The 95% confidence interval of meta-QTL c The weights of each cluster (i.e. the mixing proportions in the mixture model) d Projected QTLs for the indicated meta-QTL e Flanking/closest left or right marker of the CI of the meta-QTL presented on both the soybean consensus map 4.0 [39] and G. max genome assembly version Glyma.Wm82.a2.v1 (Gmax2.0) (available online: http://soybase.org) f Physical positions and candidate genes are based on Gmax2.0. g Additional meta-QTLs were detected, if QTLs having a LOD score below 2.0 were also included for meta-analysis. h The orders of left and right markers were reversed on Gmax2.0.
Table 2.
List of selected positional and functional candidate genes by meta-QTL.
| Chr | Meta-QTL | Gene Name | Start (bp) | Stop (bp) | Annotation a | Metabolism b |
|---|---|---|---|---|---|---|
| 3 | mPO3-1 | 3,366,405 | 3,932,012 | |||
| Glyma.03g030400 | 3,372,331 | 3,374,781 | Phenylacetaldoxime monooxygenase | Glucosinolate biosynthesis from phenylalanine | ||
| Glyma.03g030500 | 3,402,824 | 3,403,934 | Chitinase | Chitinase degradation | ||
| Glyma.03g030600 | 3,427,088 | 3,429,159 | Phenylacetaldoxime monooxygenase | Glucosinolate biosynthesis from phenylalanine | ||
| Glyma.03g030800 | 3,458,451 | 3,463,303 | Phenylacetaldoxime monooxygenase | Glucosinolate biosynthesis from phenylalanine | ||
| Glyma.03g030900 | 3,462,650 | 3,465,320 | Phenylacetaldoxime monooxygenase | Glucosinolate biosynthesis from phenylalanine | ||
| Glyma.03g031000 | 3,483,334 | 3,486,055 | Phenylacetaldoxime monooxygenase | Glucosinolate biosynthesis from phenylalanine | ||
| Glyma.03g031200 | 3,503,057 | 3,504,917 | Phenylacetaldoxime monooxygenase | Glucosinolate biosynthesis from phenylalanine | ||
| Glyma.03g031300 | 3,515,990 | 3,517,595 | Costunolide synthase | Constunolide biosynthesis | ||
| Glyma.03g031400 | 3,522,165 | 3,527,021 | Anthocyanidin 3-O-glucosyltransferase | Flavonoid biosynthesis | ||
| Glyma.03g032500 | 3,716,149 | 3,718,912 | Anthocyanidin 3-O-glucosyltransferase | Flavonoid biosynthesis | ||
| Glyma.03g032600 | 3,738,632 | 3,739,843 | Anthocyanidin 3-O-glucosyltransferase | Flavonoid biosynthesis | ||
| Glyma.03g032700 | 3,740,621 | 3,743,020 | Anthocyanidin 3-O-glucosyltransferase | Flavonoid biosynthesis | ||
| Glyma.03g032800 | 3,786,702 | 3,789,334 | Anthocyanidin 3-O-glucosyltransferase | Flavonoid biosynthesis | ||
| 5 | mPO5-1 | 2,295,488 | 2,748,936 | |||
| Glyma.05g026800 | 2,301,052 | 2,303,249 | Xylogalacturonan β-1,3-xylosyltransferase | Xylogalacturonan biosynthesis | ||
| Glyma.05g028400 | 2,444,345 | 2,448,119 | Aldose 1-epimerase | Trehalose degradation II (trehalase) | ||
| Glyma.05g028500 | 2,449,777 | 2,459,772 | Lipid exporter ABCA1 and related proteins, ABC superfamily | Fatty acid transportation | ||
| Glyma.05g029100 | 2,501,803 | 2,508,656 | Aldehyde dehydrogenase family | Arginine degradation I (arginase pathway)/proline degradation | ||
| Glyma.05g029200 | 2,510,682 | 2,517,754 | Aldehyde dehydrogenase family | Arginine degradation I (arginase pathway)/proline degradation | ||
| Glyma.05g029900 | 2,565,716 | 2,569,741 | Nitrate transporter | Nitrate assimilation | ||
| Glyma.05g030300 | 2,603,033 | 2,605,522 | Nitrate transporter | Nitrate assimilation | ||
| Glyma.05g030400 | 2,609,893 | 2,613,480 | Nitrate transporter | Nitrate assimilation | ||
| Glyma.05g030500 | 2,615,166 | 2,618,849 | Nitrate transporter | Nitrate assimilation | ||
| Glyma.05g030600 | 2,626,715 | 2,629,668 | Nitrate transporter | Nitrate assimilation | ||
| Glyma.05g031200 | 2,712,680 | 2,715,373 | Glucose/Sorbosone dehydrogenase | Carbohydrate metabolic process | ||
| mPO5-5 | 39,622,009 | 39,819,839 | ||||
| Glyma.05g216400 | 39,673,239 | 39,678,762 | Cellulase/ENDO-1,4-BETA-GLUCANASE | Carbohydrate metabolic process | ||
| Glyma.05g216600 | 39,686,415 | 39,694,722 | Long-chain-fatty-acid-CoA ligase | D-myo-inositol (1,4,5)-trisphosphate biosynthesis/fatty acid activation | ||
| Glyma.05g216700 | 39,696,647 | 39,699,812 | Nucleoside-diphosphate kinase | UTP and CTP de novo biosynthesis | ||
| Glyma.05g217100 | 39,735,139 | 39,739,763 | UDP-glucose 4-epimerase | Galactose degradation I (Leloir pathway) | ||
| Glyma.05g217400 | 39,752,430 | 39,754,981 | Lipase (class 3) | Fatty acid biosynthesis | ||
| Glyma.05g217600 | 39,762,157 | 39,765,360 | 1-phosphatidylinositol 4-kinase | D-myo-inositol (1,4,5)-trisphosphate biosynthesis/3-phosphoinositide biosynthesis | ||
| 6 | mPO6-3 | 6,712,097 | 6,919,465 | |||
| Glyma.06g087100 | 6,750974 | 6,754,953 | Acylglycerol lipase | Triacylglycerol degradation | ||
| Glyma.06g087800 | 6,788436 | 6,793,747 | Malate dehydrogenase (oxaloacetate-decarboxylating) (NADP+) | Gluconeogenesis | ||
| Glyma.06g088200 | 6,824021 | 6,828,704 | Amino acid permease 1 | Amino acid transportation | ||
| Glyma.06g088300 | 6,838983 | 6,846,287 | Amino acid permease 8 | Amino acid transportation | ||
| Glyma.06g088600 | 6,865939 | 6,873,001 | 6-phosphofructokinase | Glycolysis | ||
| 15 | mPO15-1 c | 2,127,717 | 2,517,428 | |||
| Glyma.15g026400 | 2,130531 | 2,134,563 | Linoleate 9S-lipoxygenase | Jasmonic acid biosynthesis | ||
| Glyma.15g026500 | 2,142191 | 2,147,489 | Linoleate 9S-lipoxygenase | Jasmonic acid biosynthesis | ||
| Glyma.15g027000 | 2,171688 | 2,174,398 | Threonine synthase | Threonine biosynthesis | ||
| Glyma.15g027100 | 2,177956 | 2,179,285 | Glucuronosyl-N-acetylglucosaminyl-proteoglycan 4-α-N-acetylglucosaminyltransferase | Cell wall synthesis | ||
| Glyma.15g028200 | 2,254166 | 2,256,553 | Peroxidase | Active oxygen species-scavenging systems | ||
| Glyma.15g028900 | 2,325622 | 2,329,211 | Hydroxyacylglutathione hydrolase | Methylglyoxal degradation | ||
| Glyma.15g029200 | 2,356317 | 2,366,181 | Electron-transferring-flavoprotein dehydrogenase | Protein degradation | ||
| Glyma.15g029300 | 2,366688 | 2,369,189 | Strictosidine synthase | Alkaloid biosynthesis | ||
| Glyma.15g029800 | 2,387957 | 2,391,720 | Fructokinase | Sucrose degradation | ||
| mPO15-2 c | 3,846,538 | 3,964,389 | ||||
| Glyma.15g049100 | 3,869,436 | 3,870,986 | Vinorine synthase | Alkaloid biosynthesis | ||
| Glyma.15g050100 | 3,958,743 | 3,960,926 | Fructose-bisphosphatase | Glycolysis/Sucrose biosynthesis | ||
| mPO15-5 c | 11,651,285 | 11,818,830 | ||||
| Glyma.15g142500 | 11,655,353 | 11,656,913 | Glucan endo-1,3-β-d-glucosidase | Cell wall degradation | ||
| Glyma.15g143100 | 11,744,760 | 11,750,567 | Dihydrolipoyl dehydrogenase | Acetyl-CoA biosynthesis | ||
| 20 | mP20-2, | 2,615,668 | 2,946,641 | |||
| mPCM20-2 | Glyma.20g024800 | 2,679,571 | 2,683,022 | Pyruvate kinase | Glycolysis | |
| Glyma.20g025200 | 2,743,092 | 2,745,282 | l-ascorbate oxidase | Ascorbic acid biosynthesis/degradation | ||
| Glyma.20g025400 | 2,768,770 | 2,781,380 | Asparagine synthase (glutamine-hydrolyzing) | Asparagine biosynthesis | ||
| Glyma.20g025700 | 2,813,089 | 2,825,575 | 2-hydroxy-6-oxonona-2,4-dienedioate hydrolase | TCA cycle | ||
| Glyma.20g026000 | 2,856,949 | 2,863,351 | Sarcosine/dimethylglycine N-methyltransferase | Amino acid biosynthesis | ||
| Glyma.20g026300 | 2,894,580 | 2,905,241 | β-glucosidase | Starch degradation | ||
| Glyma.20g026400 | 2,909,731 | 2,912,529 | UDP-glucose 6-dehydrogenase | l-ascorbate biosynthesis | ||
| Glyma.20g026700 | 2,935,653 | 2,945,665 | Phosphorylase | Carbohydrate metabolism | ||
| mPO20-2 | 2,615,668 | 2,795,596 | ||||
| Glyma.20g024800 | 2,679,571 | 2,683,022 | Pyruvate kinase | Glycolysis | ||
| Glyma.20g025200 | 2,743,092 | 2,745,282 | l-ascorbate oxidase | Ascorbic acid biosynthesis/degradation | ||
| Glyma.20g025400 | 2,768,770 | 2,781,380 | Asparagine synthase (glutamine-hydrolyzing) | Asparagine biosynthesis | ||
| mP20-3, | 36,055,353 | 36,575,544 | ||||
| mO20-4, | Glyma.20g118000 | 36,083,279 | 36,091,841 | β-lactamase | Cell wall metabolism | |
| mPO20-4, | Glyma.20g120300 | 36,306,759 | 36,311,703 | Trehalose-phosphatase | Trehalose biosynthesis | |
| mPCM20-3 | Glyma.20g121200 | 36,384,081 | 36,391,030 | Diacylglycerol diphosphate phosphatase | Triacylglycerol biosynthesis | |
| Glyma.20g121300 | 36,395,415 | 36,400,718 | Diacylglycerol diphosphate phosphatase | Triacylglycerol biosynthesis | ||
| Glyma.20g121400 | 36,402,262 | 36,406,832 | Amino acid permease | Amino acid transportation | ||
| Glyma.20g121500 | 36,414,549 | 36,419,060 | Amino acid permease | Amino acid transportation | ||
| Glyma.20g122300 | 36,506,583 | 36,511,326 | Procollagen-lysine 5-dioxygenase | Collagen biosynthesis via Lysine | ||
| Glyma.20g122400 | 36,516,501 | 36,521,436 | Procollagen-lysine 5-dioxygenase | Collagen biosynthesis via Lysine | ||
| Glyma.20g122500 | 36,524,182 | 36,526,957 | Fructose-bisphosphate aldolase | Sucrose biosynthesis |
a Annotation by SoyCyc7.0 (available online: http://www.plantcyc.org) or PTHR (available online: http://www.patherdb.org); b Metabolism involved based on annotation; c Additional meta-QTLs were detected, if QTLs having a LOD score below 2.0 were also included for meta-analysis.
© 2017 by the authors. Licensee MDPI, Basel, Switzerland. This article is an open access article distributed under the terms and conditions of the Creative Commons Attribution (CC BY) license (http://creativecommons.org/licenses/by/4.0/).
Share and Cite
MDPI and ACS Style
Van, K.; McHale, L.K. Meta-Analyses of QTLs Associated with Protein and Oil Contents and Compositions in Soybean [Glycine max (L.) Merr.] Seed. Int. J. Mol. Sci. 2017, 18, 1180. https://doi.org/10.3390/ijms18061180
AMA Style
Van K, McHale LK. Meta-Analyses of QTLs Associated with Protein and Oil Contents and Compositions in Soybean [Glycine max (L.) Merr.] Seed. International Journal of Molecular Sciences. 2017; 18(6):1180. https://doi.org/10.3390/ijms18061180
Chicago/Turabian StyleVan, Kyujung, and Leah K. McHale. 2017. "Meta-Analyses of QTLs Associated with Protein and Oil Contents and Compositions in Soybean [Glycine max (L.) Merr.] Seed" International Journal of Molecular Sciences 18, no. 6: 1180. https://doi.org/10.3390/ijms18061180
Note that from the first issue of 2016, this journal uses article numbers instead of page numbers. See further details here.