
Structural Characterization of Core Region in Erwinia amylovora Lipopolysaccharide


 , and
, and
Abstract
:1. Introduction
2. Results and Discussion
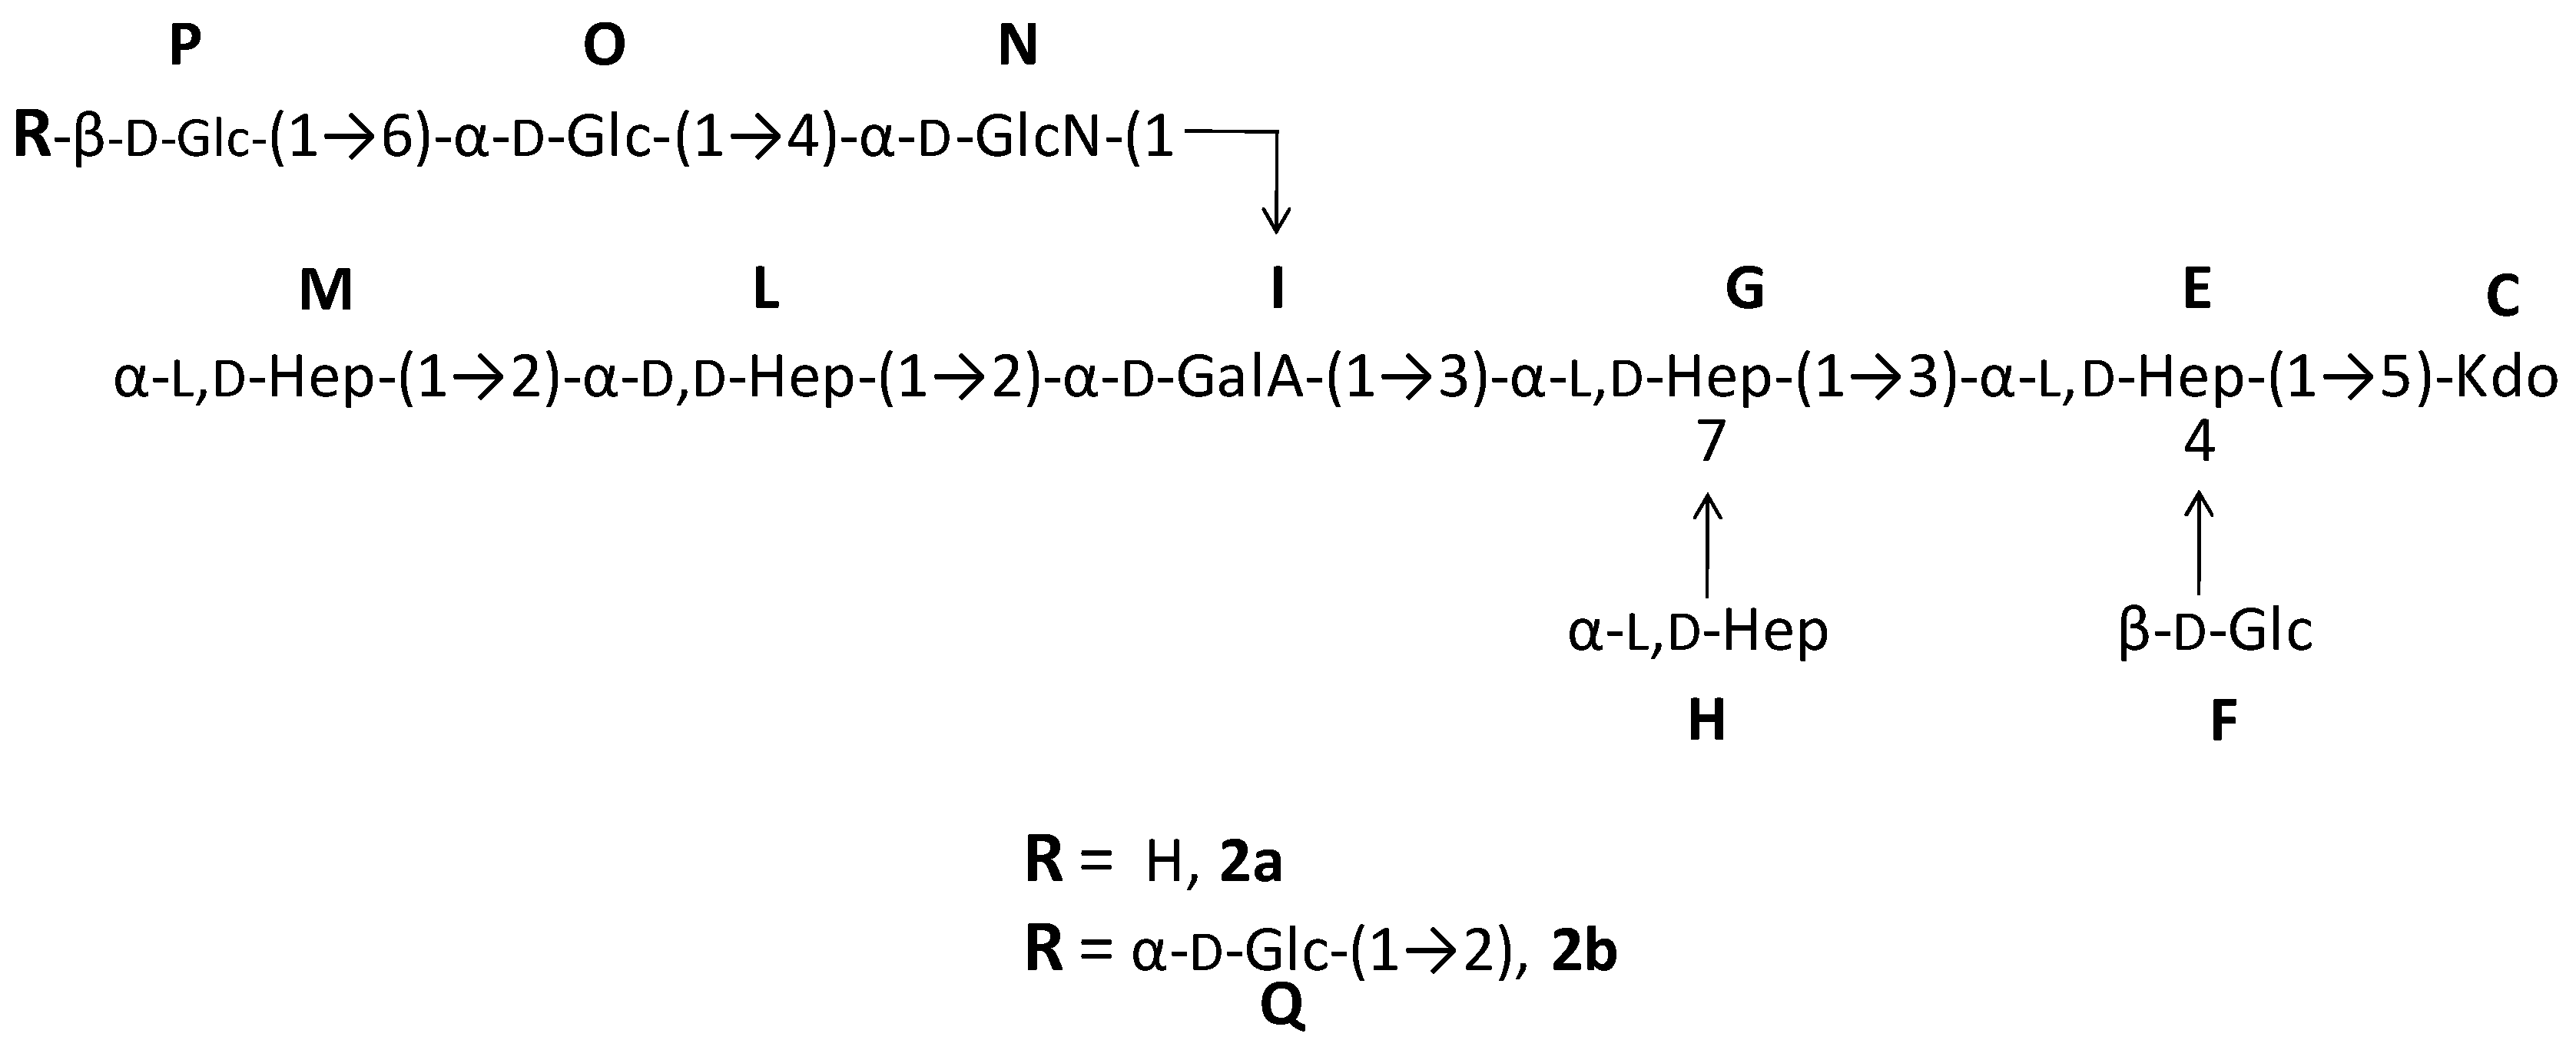
2.1. Preparation and Structural Characterization of Oligosaccharides from EaΔwaaL LPS
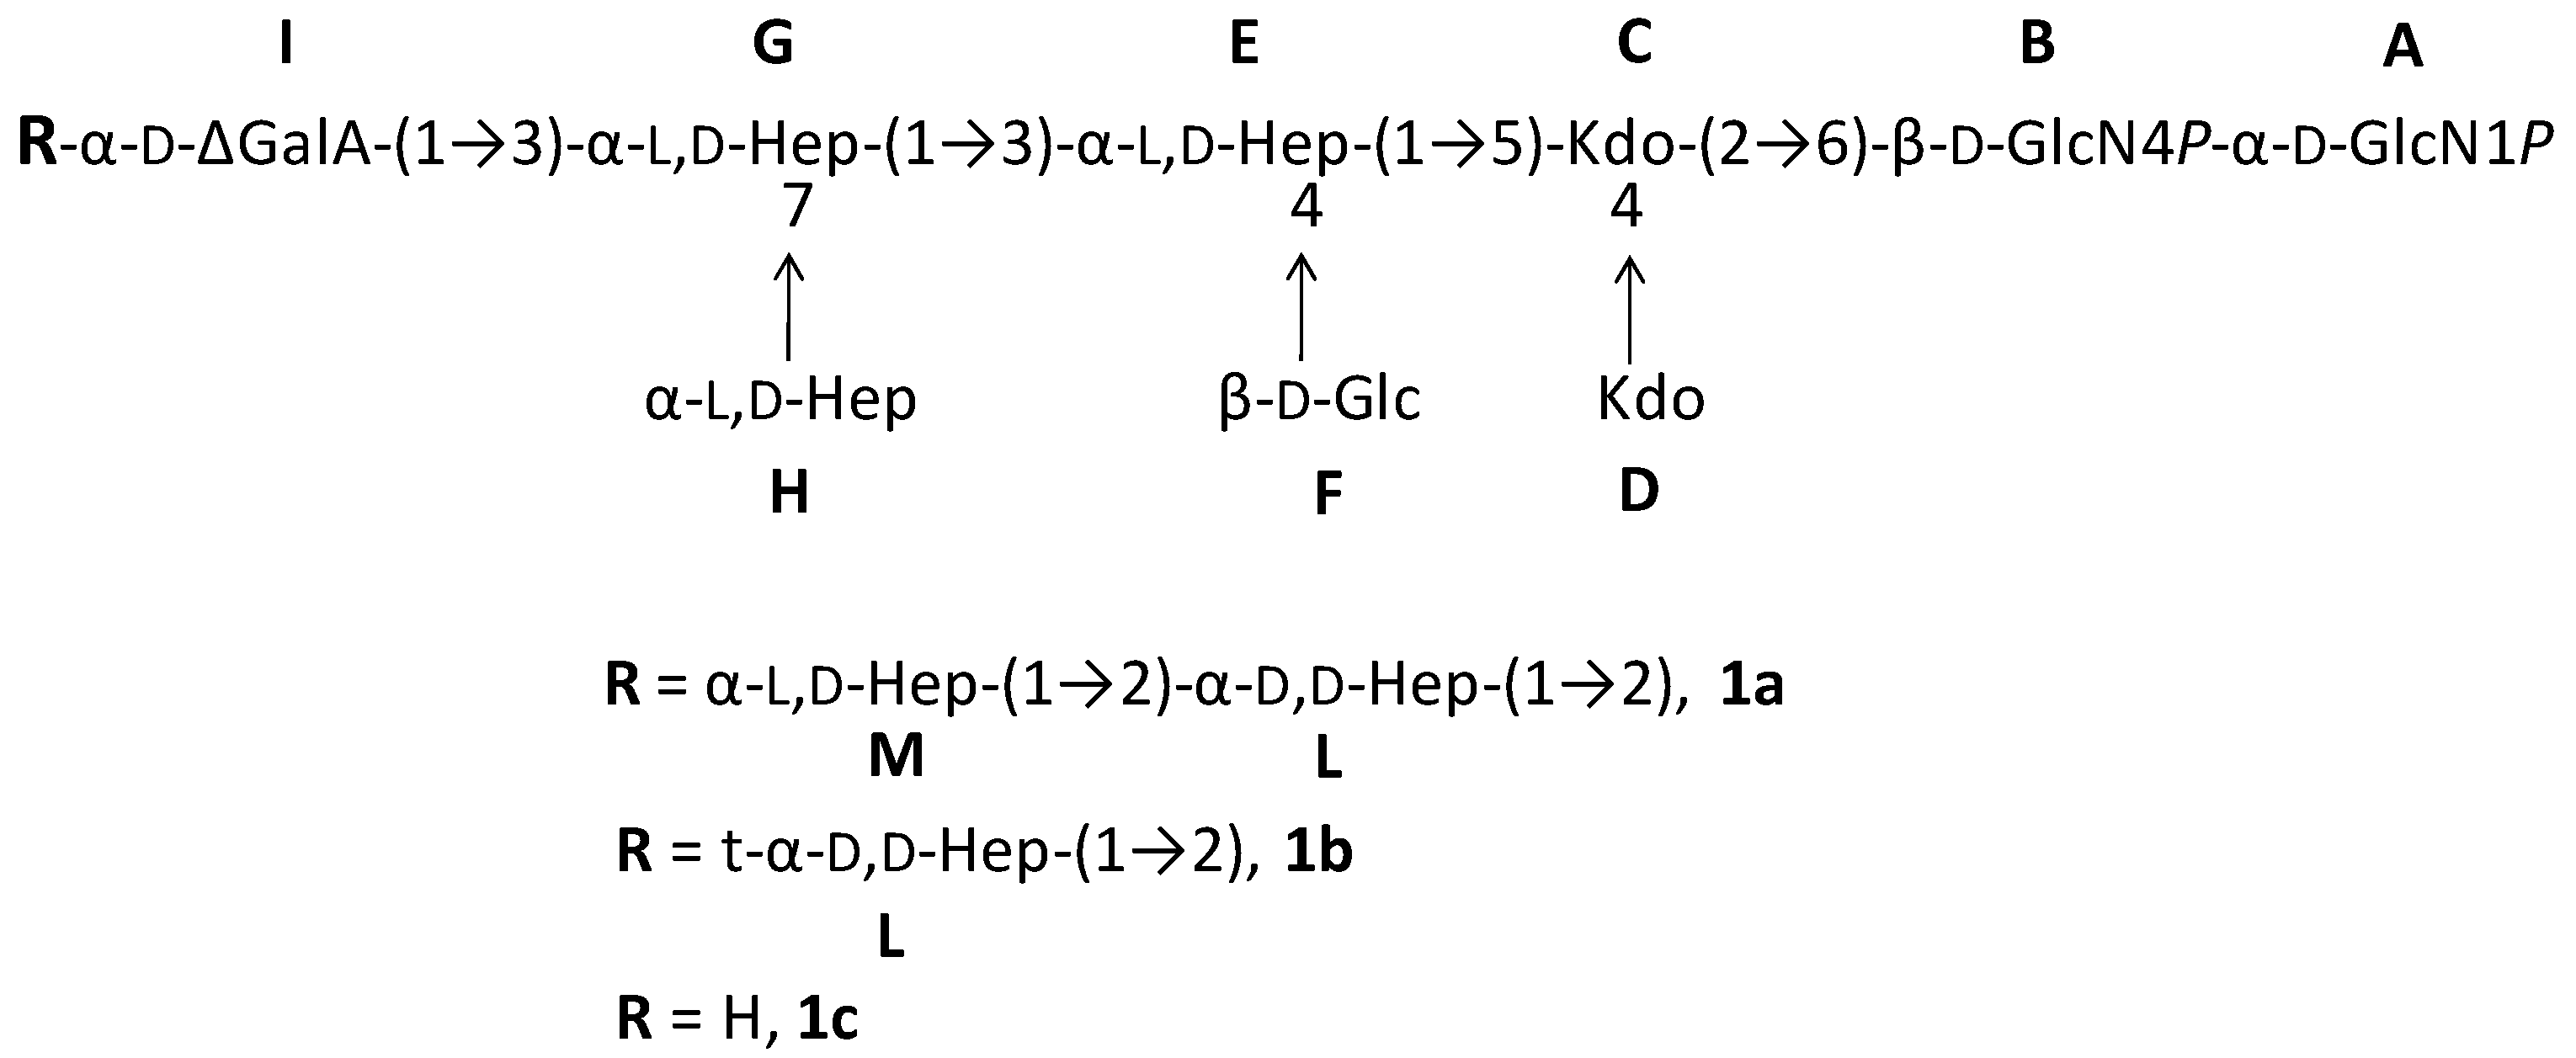
2.2. Preparation and Structural Characterization of Oligosaccharides from EaΔwabH and EaΔwabG LPSs
3. Experimental Section
3.1. Bacteria Growth and LPS Isolation
3.2. Sugar Analysis
3.3. Mild Acid Hydrolysis
3.4. Deacylation of the LOSs
3.5. Methylation Analysis
3.6. Mass Spectrometry Analysis
3.7. NMR Spectroscopy
4. Conclusions
Supplementary Materials
Acknowledgments
Author Contributions
Conflicts of Interest
References
- Oh, C.; Beer, S.V. Molecular genetics of Erwinia amylovora involved in the development of fire blight. FEMS Microbiol. Lett. 2005, 253, 185–192. [Google Scholar] [CrossRef] [PubMed]
- Thomoson, S.V. Epidemiology of Fire Blight. In Fire Blight: The Disease and Its Causative Agent, Erwinia Amylovora; Vanneste, J.L., Ed.; CABI: New York, NY, USA, 2000; pp. 9–36. [Google Scholar]
- Bellemann, P.; Geider, K. Localization of transposon insertions in pathogenicity mutants of Erwinia amylovora and their biochemical characterization. J. Gen. Microbiol. 1992, 138, 931–940. [Google Scholar] [CrossRef] [PubMed]
- Koczan, J.M.; McGrath, M.J.; Zhao, Y.; Sundin, G.W. Contribution of Erwinia amylovora exopolysaccharides amylovoran and levan to biofilm formation: Implications in pathogenicity. Phytopathology 2009, 99, 1237–1244. [Google Scholar] [CrossRef] [PubMed]
- Wilkinson, S.C. Composition and Structure of Bacterial Lipopolysaccharides. In Surface Carbohydrates of the Procaryotic Cell; Sutherland, I.W., Ed.; Academic Press Inc.: New York, NY, USA, 1977; pp. 97–105. [Google Scholar]
- Lüderitz, O.; Freudenberg, M.A.; Galanos, C.; Lehmann, V.; Rietschel, E.T.; Shaw, D.H. Lipopolysaccharides of Gram-Negative Bacteria. In Current Topics in Membranes and Transport; Razin, S., Rottem, S., Eds.; Academic Press Inc.: New York, NY, USA, 1982; pp. 79–151. [Google Scholar]
- Westphal, O.; Lüderitz, O.; Galanos, C.; Mayer, H.; Rietschel, E.T. The Story of Bacterial Endotoxin. In Advances in Immunopharmacology; Chedid, L., Hadden, J.W., Spreafico, F., Eds.; Pergamon Press: Oxford, UK, 1986; pp. 13–34. [Google Scholar]
- Carillo, S.; Pieretti, G.; Bedini, E.; Parrilli, M.; Lanzetta, R.; Corsaro, M.M. Structural investigation of the antagonist LPS from the cyanobacterium Oscillatoria planktothrix FP1. Carbohydr. Res. 2014, 388, 73–80. [Google Scholar] [CrossRef] [PubMed]
- Alexander, C.; Rietschel, E.T. Invited review: Bacterial lipopolysaccharides and innate immunity. J. Endotoxin Res. 2001, 7, 167–202. [Google Scholar] [CrossRef] [PubMed]
- Caroff, M.; Karibian, D. Structure of bacterial lipopolysaccharides. Carbohydr. Res. 2003, 338, 2431–2447. [Google Scholar] [CrossRef] [PubMed]
- Lüderitz, O.; Galanos, C.; Risse, H.J.; Ruschmann, E.; Schlecht, S.; Schmidt, G.; Schulte-Holthausen, H.; Wheat, R.; Westphal, O.; Schlosshardt, J. Structural relationship of Salmonella O and R antigens. Ann. N. Y. Acad. Sci. 1966, 133, 349–374. [Google Scholar] [CrossRef] [PubMed]
- Berry, M.C.; McGhee, G.C.; Zhao, Y.; Sundin, G.W. Effect of a waaL mutation on lipopolysaccharide composition, oxidative stress survival, and virulence in Erwinia amylovora. FEMS Microbiol. Lett. 2009, 291, 80–87. [Google Scholar] [CrossRef] [PubMed]
- Kao, C.C.; Sequeira, L. A gene cluster required for coordinated biosynthesis of lipopolysaccharide and extracellular polysaccharide also affects virulence of Pseudomonas solanacearum. J. Bacteriol. 1991, 173, 7841–7847. [Google Scholar] [CrossRef] [PubMed]
- Toth, I.K.; Thorpe, C.J.; Bentley, S.D.; Mulholland, V.; Hyman, L.J.; Perombelon, M.C.M.; Salmond, G.P.C. Mutation in a gene required for lipopolysaccharide and enterobacterial common antigen biosynthesis affects virulence in the plant pathogen Erwinia carotovora subsp. atroseptica. Mol. Plant Microbe Interact. 1999, 12, 499–507. [Google Scholar] [CrossRef] [PubMed]
- Aquilini, E.; Tomás, J.M. Lipopolysaccharides (Endotoxins). Ref. Modul. Biomed. Sci. 2015. [Google Scholar] [CrossRef]
- Pieretti, G.; Corsaro, M.M.; Lanzetta, R.; Parrilli, M.; Canals, R.; Merino, S.; Tomás, J.M. Structural studies of the O-chain polysaccharide from Plesiomonas shigelloides strain 302–73 (serotype O1). Eur. J. Org. Chem. 2008, 2008, 3149–3155. [Google Scholar] [CrossRef]
- Regué, M.; Izquierdo, L.; Fresno, S.; Piqué, N.; Corsaro, M.M.; Naldi, T.; de Castro, C.; Waidelich, D.; Merino, S.; Tomas, J. A second outer-core region in Klebsiella pneumoniae lipopolysaccharide. J. Bacteriol. 2005, 187, 4198–4206. [Google Scholar] [CrossRef] [PubMed]
- Holst, O.; Muller-Leonnies, S.; Lindner, B.; Brade, H. Chemical structure of the lipid A of Escherichia coli J-5. Eur. J. Biochem. 1993, 214, 695–701. [Google Scholar] [CrossRef] [PubMed]
- Vinogradov, E.; Lindner, B.; Seltmann, G.; Radziejewska-Lebrecht, J.; Holst, O. Lipopolysaccharides from Serratia marcescens possess one or two 4-Amino-4-deoxy-l-arabinopyranose 1-phosphate residues in the Lipid A and d-glycero-d-talo-Oct-2-ulopyranosonic Acid in the inner core region. Chem. Eur. J. 2006, 12, 6692–6700. [Google Scholar] [CrossRef] [PubMed]
- Süsskind, M.; Brade, L.; Brade, H.; Holst, O. Identification of a novel heptoglycan of α1→2-linked d-glycero-d-manno-heptopyranose. J. Biol. Chem. 1998, 273, 7006–7017. [Google Scholar] [PubMed]
- Galanos, C.; Lüderitz, O.; Westphal, O. A new method for the extraction of R lipopolysaccharides. Eur. J. Biochem. 1969, 9, 245–249. [Google Scholar] [CrossRef] [PubMed]
- Leontein, K.; Lindberg, B.; Lönngren, J. Assignment of absolute configuration of sugars by GLC of their acetylated glycosides formed from chiral alcohols. Carbohydr. Res. 1978, 62, 359–362. [Google Scholar] [CrossRef]
- Holst, O. Deacylation of Lipopolysaccharides and Isolation of Oligosaccharide Phosphates, In Bacterial Toxins: Methods and Protocols. Methods Mol. Biol. 2000, 145, 345–353. [Google Scholar] [PubMed]
- Ciucanu, I.; Kerek, F. A simple and rapid method for the permethylation of carbohydrates. Carbohydr. Res. 1984, 131, 209–217. [Google Scholar]
- Corsaro, M.M.; Pieretti, G.; Lindner, B.; Lanzetta, R.; Parrilli, E.; Tutino, M.L.; Parrilli, M. Highly phosphorylated core oligosaccaride structures from cold-adapted Psychromonas arctica. Chem. Eur. J. 2008, 14, 9368–9376. [Google Scholar] [CrossRef] [PubMed]


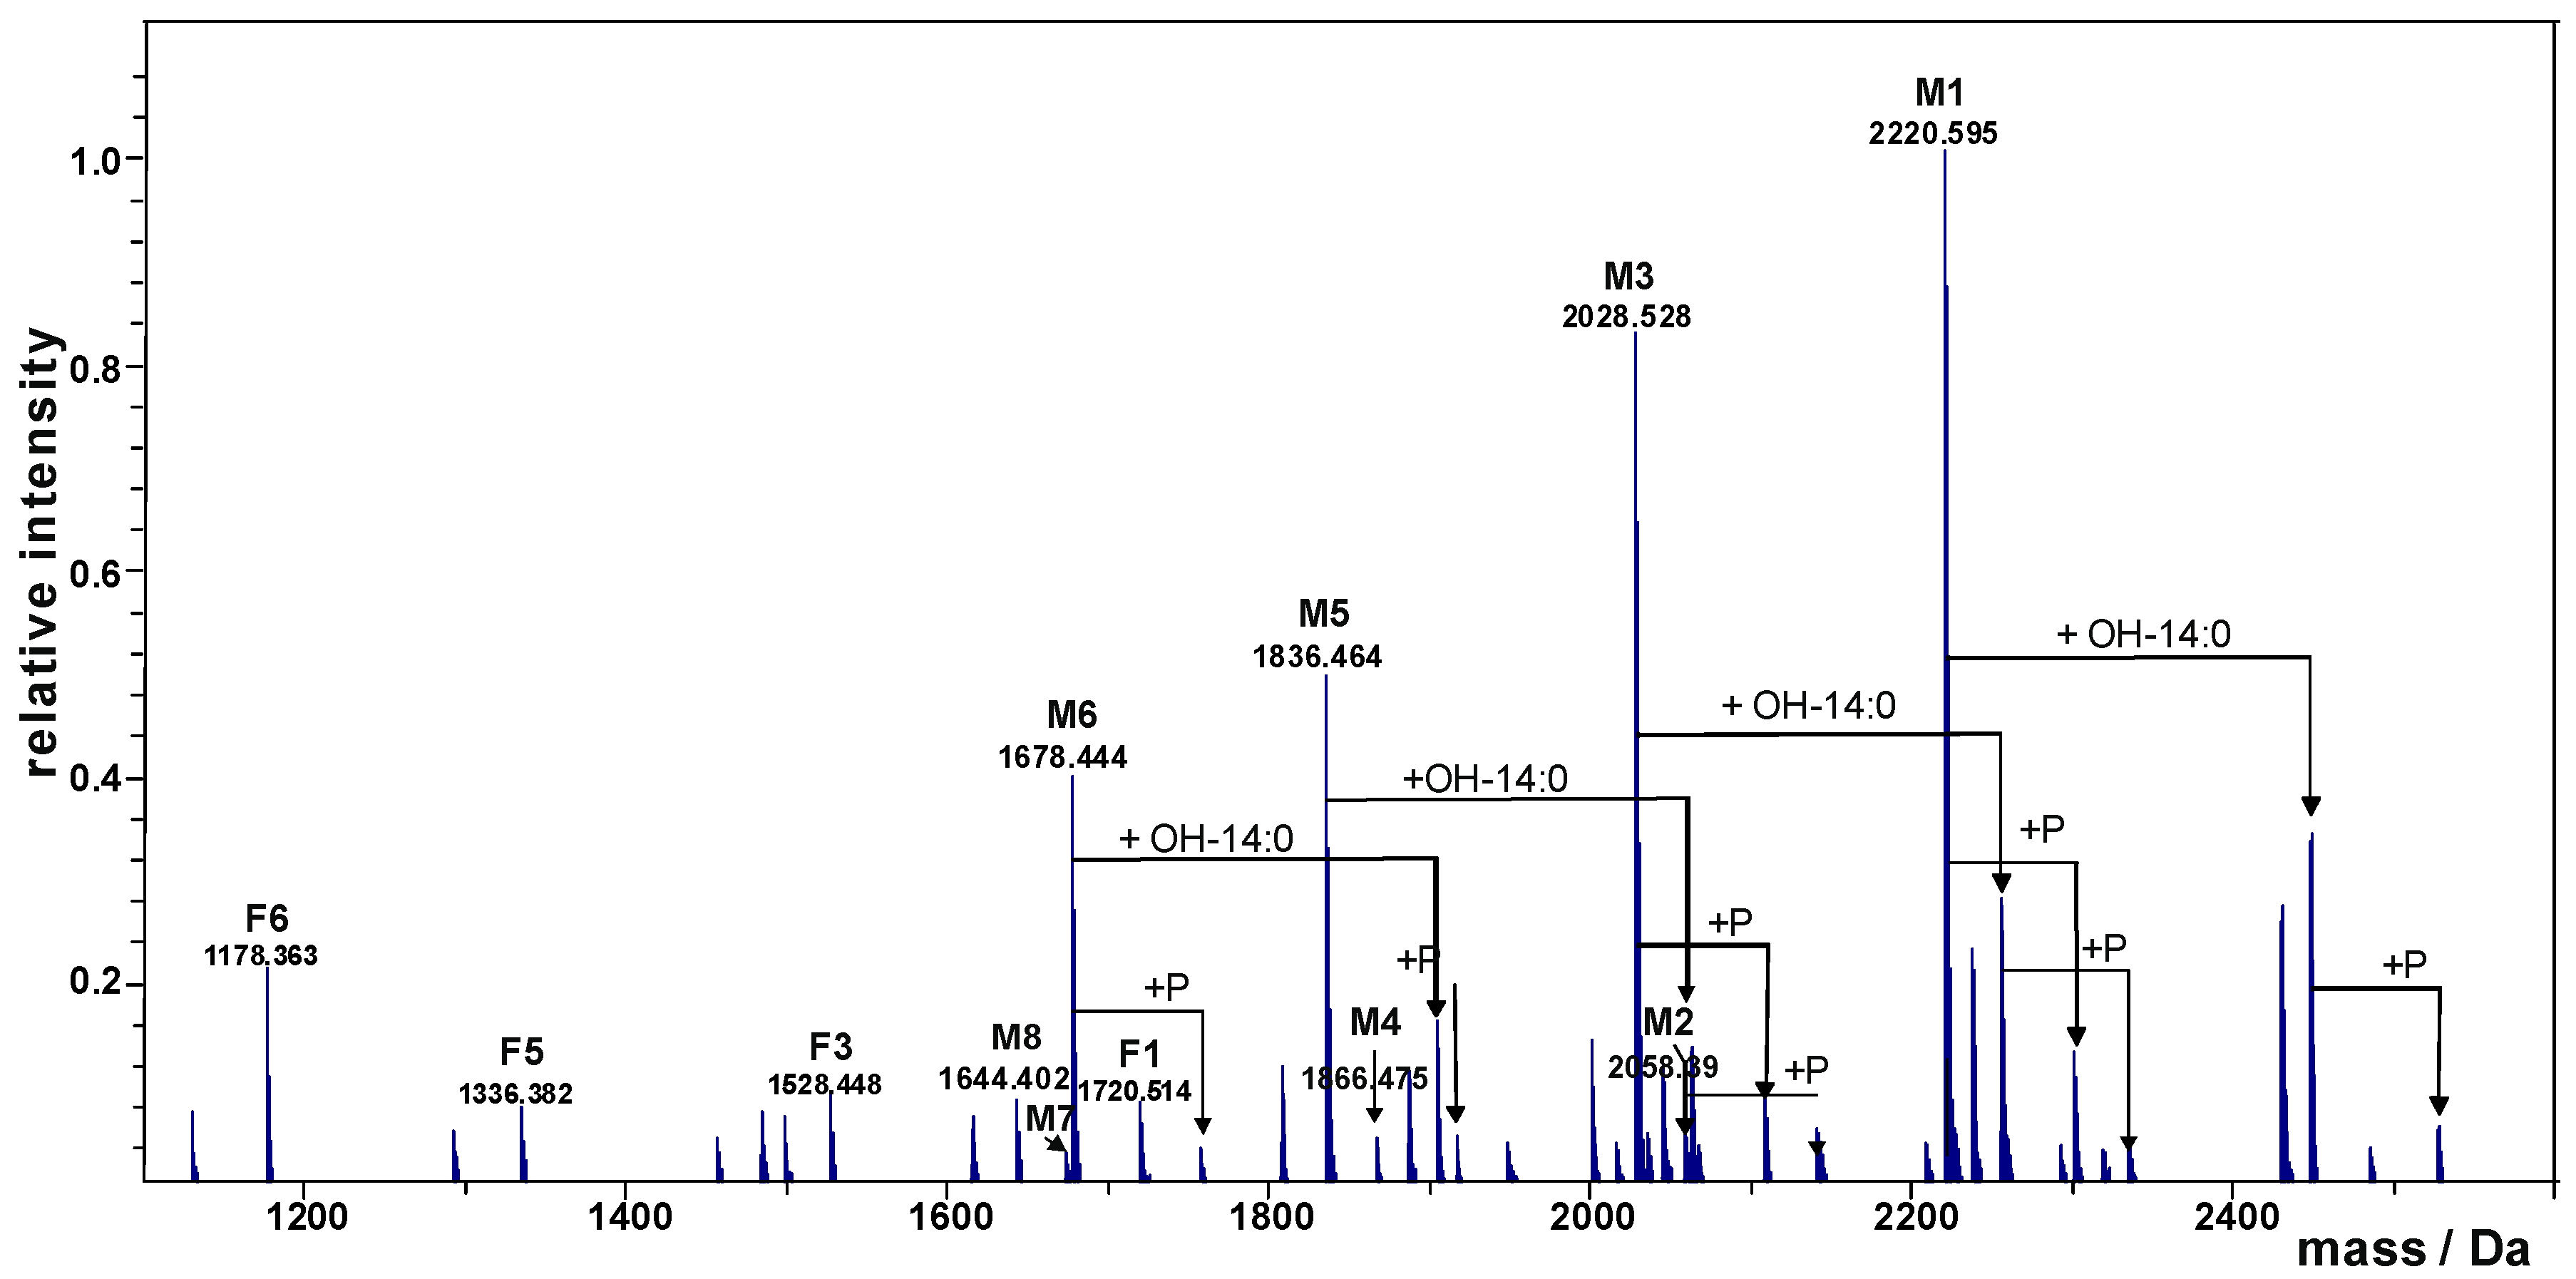
| Species | Observed Mass (Da) | Calculated Mass (Da) | Composition |
|---|---|---|---|
| M1 | 2220.595 | 2220.589 | GlcN2P2Kdo2Hep5Glc1ΔHexA |
| M2 | 2058.390 | 2058.536 | GlcN2P2Kdo2Hep5ΔHexA |
| M3 | 2028.528 | 2028.525 | GlcN2P2Kdo2Hep4Glc1ΔHexA |
| M4 | 1866.475 | 1866.473 | GlcN2P2Kdo2Hep4ΔHexA |
| M5 | 1836.464 | 1836.462 | GlcN2P2Kdo2Hep3Glc1ΔHexA |
| M6 | 1678.444 | 1678.440 | GlcN2P2Kdo2Hep3Glc1 |
| M7 | 1674.410 | 1674.409 | GlcN2P2Kdo2Hep3ΔHexA |
| M8 | 1644.402 | 1644.399 | GlcN2P2Kdo2Hep2Glc1ΔHexA |
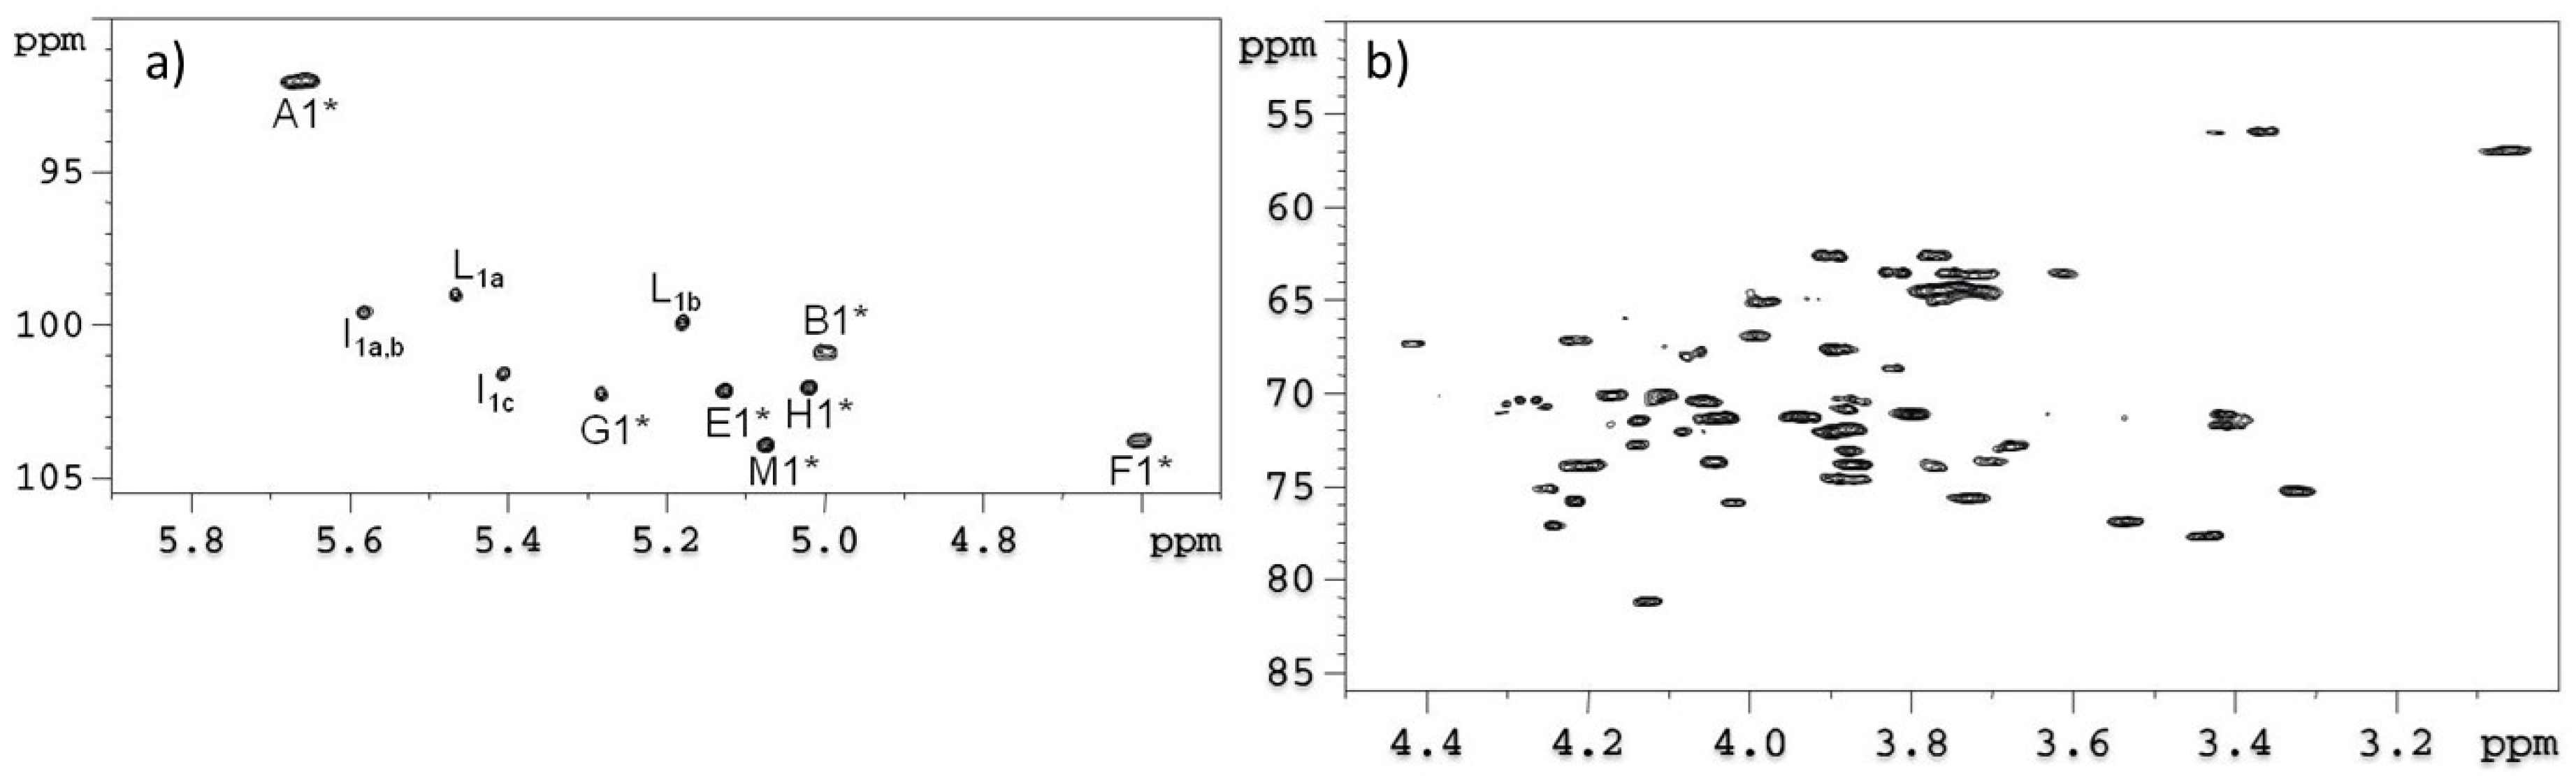
| Residue | Nucleus | H1 | H2 | H3 | H4 | H5 | H6 | H7 | H8 |
|---|---|---|---|---|---|---|---|---|---|
| C1 | C2 | C3 | C4 | C5 | C6 | C7 | C8 | ||
| α-GlcN1P A, 1a–c | 1H | 5.65 | 3.37 | 3.94 | 3.41 | 4.21 | 3.88/4.27 | ||
| 13C | 92.0 | 55.9 | 71.2 | 71.1 | 73.8 | 70.2 | |||
| α-GlcN1P A, 3 | 1H | 5.53 | 3.28 | 3.80 | 3.51 | 4.05 | 3.65/4.20 | ||
| 13C | 92.0 | 55.9 | 71.0 | 70.9 | 73.4 | 71.0 | |||
| α-GlcN1P A,4 | 1H | 5.54 | 3.30 | 3.80 | 3.51 | 4.04 | 3.65/4.19 | ||
| 13C | 92.0 | 57.1 | 71.0 | 71.1 | 73.6 | 71.3 | |||
| β-GlcN4P B, 1a–c | 1H | 4.99 | 3.06 | 3.88 | 3.88 | 3.72 | 3.62/3.75 | ||
| 13C | 100.9 | 56.9 | 73.1 | 74.6 | 75.6 | 63.5 | |||
| β-GlcN4P B, 3 | 1H | 4.72 | 2.93 | 3.73 | 3.72 | 3.60 | 3.35/3.57 | ||
| 13C | 100.9 | 56.9 | 70.9 | 74.0 | 72.3 | 63.7 | |||
| β-GlcN4P B, 4 | 1H | 4.73 | 2.94 | 3.72 | 3.73 | 3.63 | 3.35/3.60 | ||
| 13C | 100.9 | 57.1 | 70.9 | 73.8 | 75.3 | 64.0 | |||
| 4,5-Kdo C, 1a-c | 1H | n.d. | n.d. | 1.88/2.12 | 4.21 | 4.21 | 4.14 | 4.17 | 3.77/3.92 |
| 13C | 36.0 | 73.9 | 75.7 | 72.9 | 70.2 | 64.9 | |||
| 4,5-Kdo C, 3 | 1H | 175.6 | 100.7 | 1.81/1.98 | 4.03 | 4.17 | 3.83 | 3.51 | 3.62-3.87 |
| 13C | 36.0 | 71.6 | 70.1 | 74.0 | 73.4 | 64.3 | |||
| 4,5-Kdo C, 4 | 1H | 176.3 | 101.1 | 1.88/2.04 | 3.99 | 4.17 | 3.88 | 3.54 | 3.61-3.87 |
| 13C | 36.2 | 72.0 | 70.4 | 71.9 | 73.6 | 64.7 | |||
| t-Kdo D, 1a-c | 1H | n.d. | n.d. | 1.82/2.18 | 4.09 | 4.06 | 3.71 | 4.09 | 3.77/3.99 |
| 13C | 35.9 | 68.1 | 67.7 | 73.7 | 72.1 | 65.0 | |||
| t-Kdo D, 3 | 1H | 176.1 | 102.6 | 1.67/2.06 | 3.95 | 3.95 | 3.60 | 3.56 | 3.56/3.87 |
| 13C | 35.7 | 67.4 | 67.4 | 73.9 | 73.1 | 64.5 | |||
| t-Kdo D, 4 | 1H | 176.1 | 102.8 | 1.66/2.00 | 3.96 | 3.94 | 3.62 | 3.56 | 3.61/3.78 |
| 13C | 36.3 | 67.7 | 67.9 | 73.3 | 73.3 | 65.1 | |||
| 3,4-α-l,d-Hep E, 1a–c | 1H | 5.12 | 4.13 | 4.24 | 4.25 | 4.10 | 4.17 | 3.76 | |
| 13C | 102.2 | 71.5 | 77.1 | 75.1 | 70.1 | 70.2 | 64.5 | ||
| 3,4-α-l,d-Hep E, 2a,b | 1H | 5.12 | 4.07 | 4.23 | 4.23 | 4.10 | 4.15 | 3.75 | |
| 13C | 101.9 | 71.4 | 77.1 | 75.3 | 70.3 | 69.8 | 64.4 | ||
| 3,4-α-l,d-Hep E, 3 | 1H | 5.19 | 3.95 | 4.06 | 4.19 | 4.18 | 4.00 | 3.69 | |
| 13C | 100.1 | 71.8 | 75.1 | 74.4 | 72.2 | 70.2 | 65.1 | ||
| 3,4-α-l,d-Hep E, 4 | 1H | 5.16 | 4.00 | 3.99 | 4.15 | 4.12 | 3.98 | 3.68/3.89 | |
| 13C | 103.0 | 72.0 | 75.6 | 74.6 | 73.3 | 70.3 | 73.3 | ||
| t-β-Glc F, 1a-c | 1H | 4.60 | 3.33 | 3.53 | 3.41 | 3.42 | 3.77/3.90 | ||
| 13C | 103.8 | 75.3 | 77.0 | 71.7 | 77.7 | 62.5 | |||
| t-β-Glc F, 2a,b | 1H | 4.62 | 3.31 | 3.54 | 3.41 | 3.42 | 3.77/3.90 | ||
| 13C | 104.0 | 75.3 | 77.0 | 71.1 | 77.5 | 62.5 | |||
| t-β-Glc F, 3 | 1H | 4.46 | 3.18 | 3.41 | 3.26 | 3.30 | 3.63/3.78 | ||
| 13C | 103.2 | 75.0 | 76.5 | 71.1 | 77.3 | 62.7 | |||
| t-β-Glc F, 4 | 1H | 4.43 | 3.19 | 3.39 | 3.23 | 3.36 | 3.61-3.85 | ||
| 13C | 103.6 | 75.0 | 76.9 | 71.6 | 77.8 | 62.8 | |||
| 3,7-α-l,d-Hep G, 1a–c | 1H | 5.28 | 4.26 | 4.13 | 3.99 | 3.78 | 4.21 | 3.80 | |
| 13C | 102.1 | 70.8 | 81.1 | 66.9 | 74.0 | 67.1 | 71.2 | ||
| 3,7-α-l,d-Hep G, 2a,b | 1H | 5.26 | 4.12 | 4.03 | 4.01 | 3.90 | 4.17 | 3.77 | |
| 13C | 102.0 | 71.1 | 80.8 | 66.9 | 74.0 | 71.1 | 71.2 | ||
| 3,7-α-l,d-Hep G, 3 | 1H | 5.27 | 4.08 | 3.89 | 3.83 | 3.92 | n.d. | 3.69 | |
| 13C | 102.2 | 70.7 | 80.6 | 66.9 | 73.3 | 72.7 | |||
| t-α-l,d-Hep G, 4 | 1H | 5.16 | 4.06 | 3.77 | 3.77 | 3.56 | 3.95 | 3.55 | |
| 13C | 100.1 | 71.0 | 72.0 | 67.6 | 73.2 | 70.3 | 64.7 | ||
| t-α-l,d-Hep H, 1a–c | 1H | 5.02 | 4.04 | 3.90 | 3.89 | 3.67 | 4.06 | 3.72 | |
| 13C | 102.0 | 73.6 | 70.9 | 67.6 | 72.9 | 70.5 | 63.6 | ||
| t-α-l,d-Hep H, 2a,b | 1H | 4.94 | 4.02 | 4.02 | 3.87 | 3.64 | n.d | n.d | |
| 13C | 101.8 | 73.1 | 71.3 | 67.6 | 72.7 | ||||
| t-α-l,d-Hep H, 3 | 1H | 4.84 | 3.88 | 3.91 | 3.88 | 3.63 | 3.93 | 3.64 | |
| 13C | 102.9 | 71.3 | 70.3 | 67.0 | 73.4 | 64.6 | 62.9 | ||
| 2-Δ-GalA I, 1a,b | 1H | 5.58 | 4.02 | 4.53 | 5.82 | ||||
| 13C | 99.6 | 75.8 | 65.8 | 108.9 | |||||
| t-Δ-GalA I, 1c | 1H | 5.40 | 3.87 | 4.42 | n.d. | ||||
| 13C | 101.6 | 71.9 | 67.3 | ||||||
| 2,4-α-GalA I, 2a,b | 1H | 5.48 | 4.07 | 4.22 | 4.23 | 4.47 | |||
| 13C | 99.5 | 80.4 | 68.5 | 77.2 | 72.6 | 176.2 | |||
| 2-α-GalA I, 3 | 1H | 5.39 | 3.91 | 3.96 | 4.21 | 4.34 | |||
| 13C | 98.9 | 80.6 | 69.2 | 72.2 | 73.7 | 176.8 | |||
| 2-α-d,d-Hep L, 1a | 1H | 5.35 | 4.06 | 3.97 | 3.89 | n.d. | 4.12 | 3.61 | |
| 13C | 98.9 | 80.0 | 71.4 | 68.5 | n.d. | 72.1 | 63.5 | ||
| t-α-d,d-Hep L, 1b | 1H | 5.18 | 4.03 | 3.90 | 3.83 | 3.87 | 4.04 | 3.82 | |
| 13C | 99.9 | 71.3 | 72.1 | 68.7 | 73.9 | 71.4 | 63.5 | ||
| 2-α-d,d-Hep L, 2a,b | 1H | 5.28 | 3.99 | 3.99 | 3.81 | 3.99 | 4.05 | 3.84 | |
| 13C | 96.9 | 80.8 | 71.4 | 68.9 | 75.0 | 71.4 | 63.6 | ||
| 2-α-d,d-Hep L, 3 | 1H | 4.99 | 3.87 | 3.75 | 3.67 | 3.92 | 4.09 | 3.69 | |
| 13C | 98.3 | 80.6 | 71.7 | 68.7 | 73.3 | 73.1 | 63.1 | ||
| t-α-l,d-Hep M, 1a | 1H | 5.09 | 4.07 | 4.07 | 3.88 | 3.70 | n.d. | n.d. | |
| 13C | 103.5 | 71.3 | 73.7 | 67.7 | 73.1 | ||||
| t-α-l,d-Hep M, 2a,b | 1H | 5.05 | 4.05 | 4.06 | 3.86 | n.d. | n.d. | n.d. | |
| 13C | 103.5 | 71.4 | 73.8 | 67.7 | |||||
| t-α-l,d-Hep M, 3 | 1H | 5.21 | 3.89 | 3.75 | 3.83 | 4.18 | n.d. | 3.56/3.78 | |
| 13C | 101.9 | 71.5 | 70.1 | 66.8 | 72.1 | 64.8 | |||
| 4-α-GlcN N, 2a,b | 1H | 5.19 | 3.27 | 3.85 | 3.79 | 4.17 | 3.83 | ||
| 13C | 97.6 | 55.3 | 72.5 | 77.0 | 72.5 | 61.3 | |||
| 6-α-Glc O, 2a,b | 1H | 5.49 | 3.62 | 3.74 | 3.90 | 3.54 | 3.88/4.20 | ||
| 13C | 100.7 | 72.8 | 74.2 | 73.0 | 70.8 | 69.8 | |||
| t-β-Glc P, 2a | 1H | 4.50 | 3.33 | 3.51 | 3.42 | 3.47 | 3.74/3.92 | ||
| 13C | 103.9 | 74.5 | 77.0 | 71.0 | 77.3 | 62.3 | |||
| 2-β-Glc P, 2b | 1H | 4.62 | 4.47 | 3.59 | 3.45 | 3.46 | 3.74/3.92 | ||
| 13C | 103.9 | 78.9 | 75.9 | 70.9 | 77.3 | 62.3 | |||
| t-β-Glc Q, 2b | 1H | 4.36 | 3.61 | 3.75 | 3.47 | 4.17 | n.d. | ||
| 13C | 99.2 | 72.9 | 74.2 | 70.8 | 72.9 |
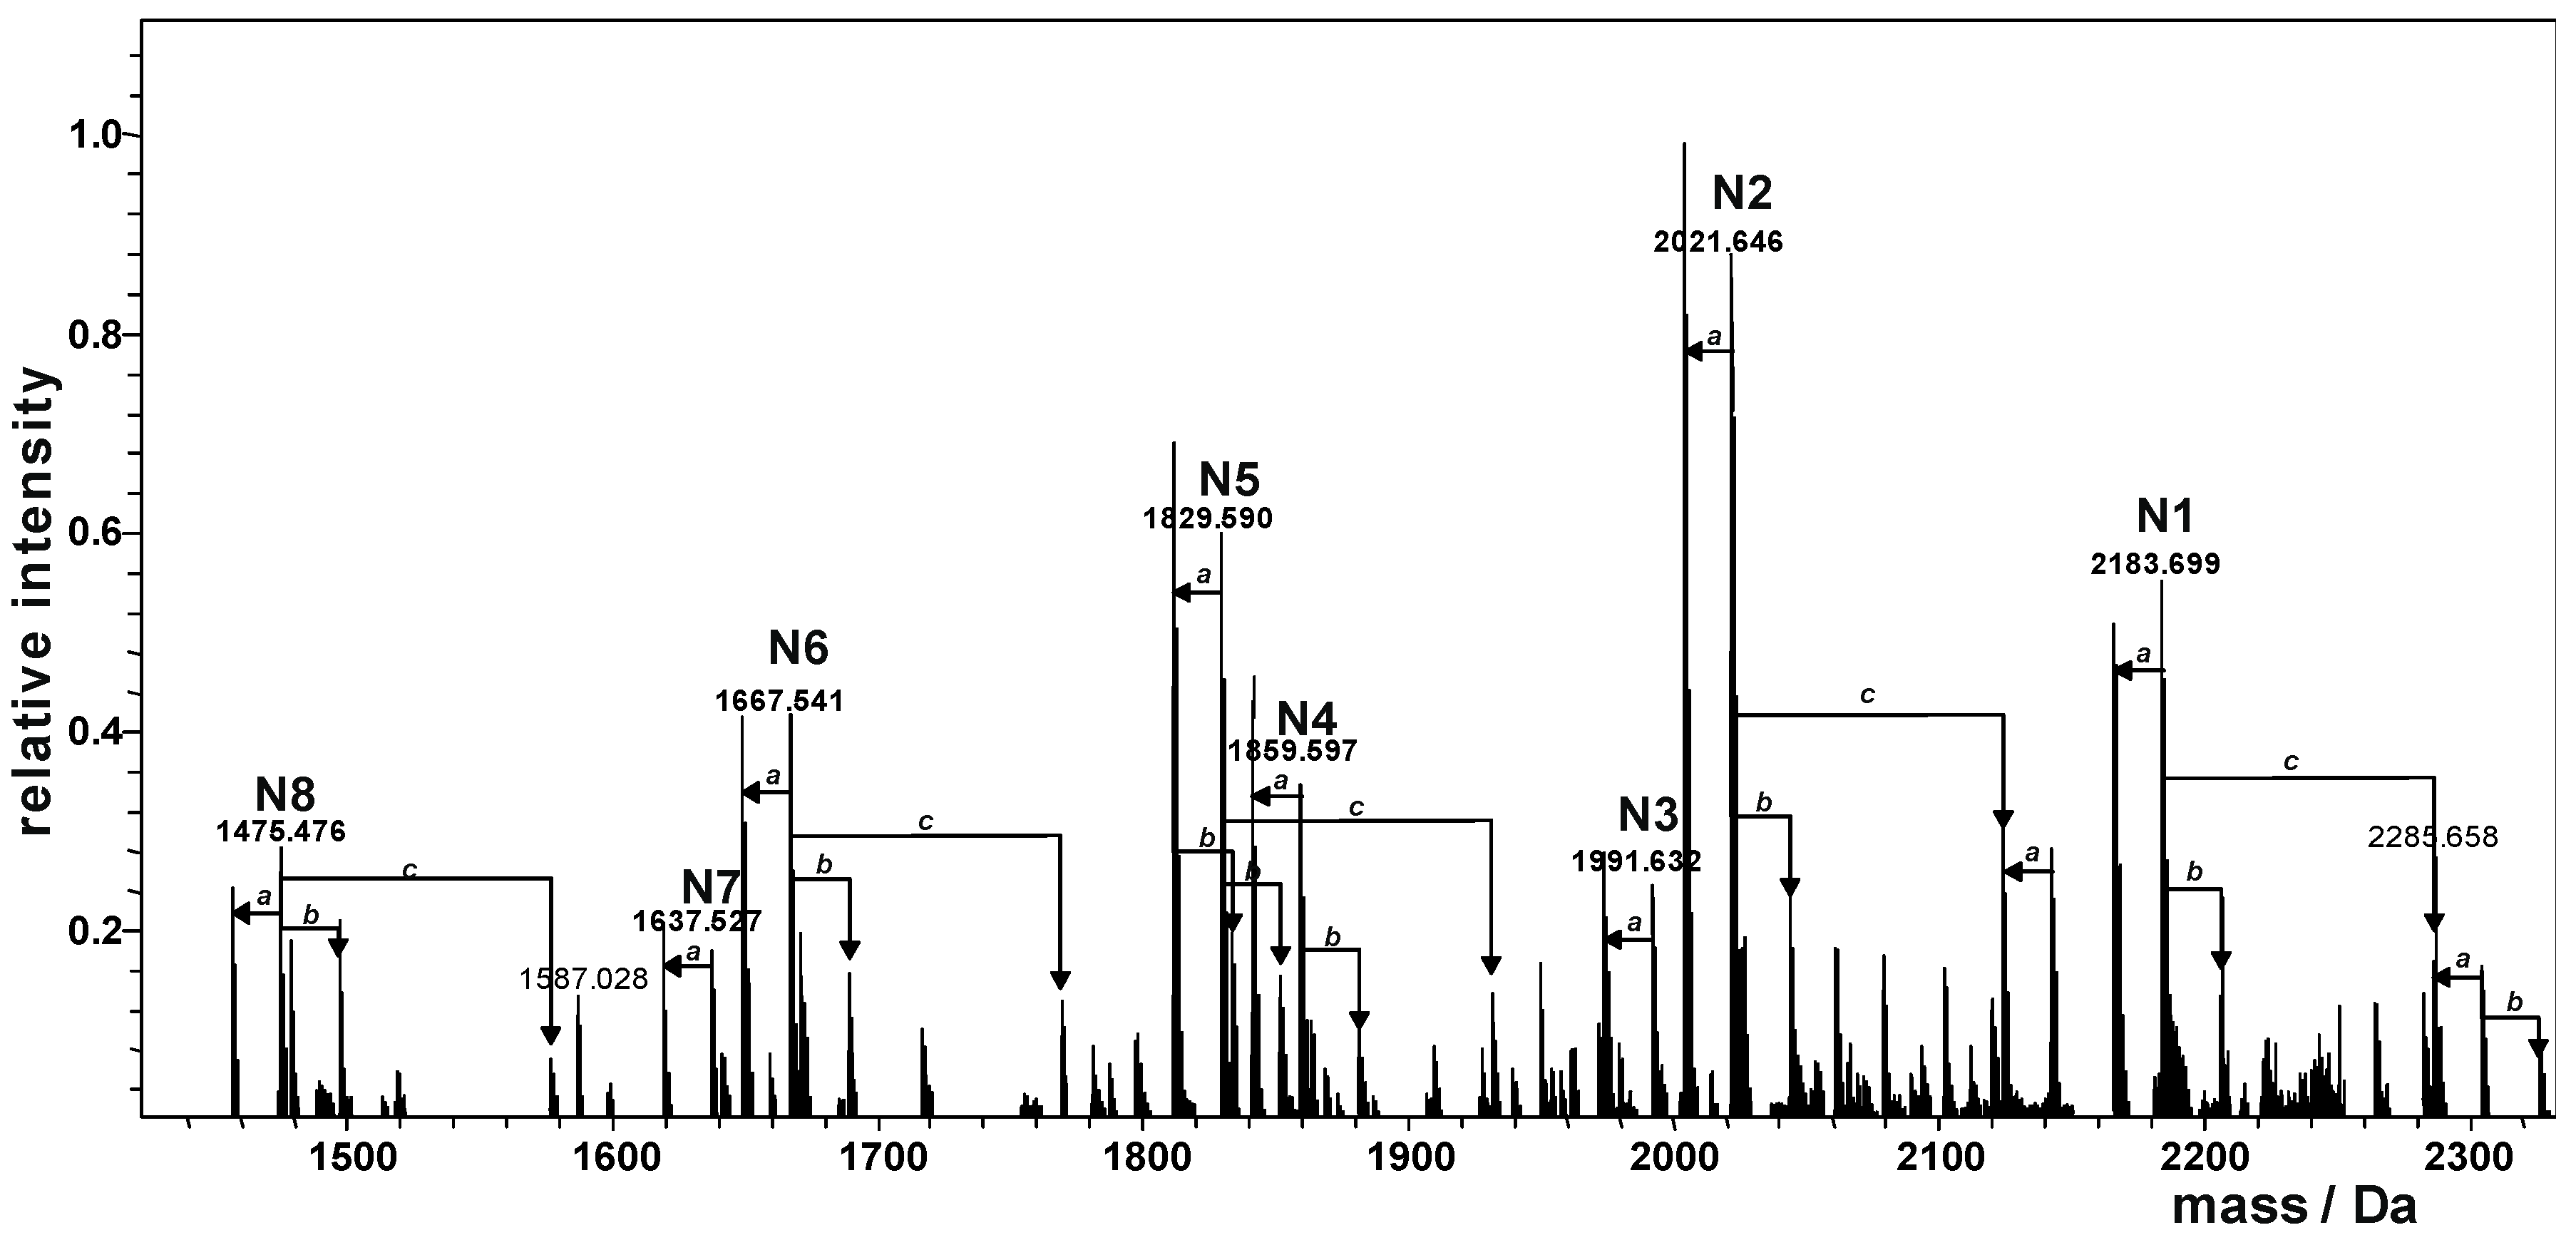
| Species | Observed Mass (Da) | Calculated Mass (Da) | Composition |
|---|---|---|---|
| N1 | 2183.699 | 2183.698 | Kdo1Hep5Glc4GalA1GlcN1 |
| N2 | 2021.646 | 2021.645 | Kdo1Hep5Glc3GalA1GlcN1 |
| N3 | 1991.632 | 1991.635 | Kdo1Hep4Glc4GalA1GlcN1 |
| N4 | 1859.597 | 1859.592 | Kdo1Hep5Glc2GalA1GlcN1 |
| N5 | 1829.590 | 1829.578 | Kdo1Hep4Glc3GalA1GlcN1 |
| N6 | 1667.541 | 1667.529 | Kdo1Hep4Glc2GalA1GlcN1 |
| N7 | 1637.527 | 1637.518 | Kdo1Hep3Glc3GalA1GlcN1 |
| N8 | 1475.476 | 1475.466 | Kdo1Hep3Glc2GalA1GlcN1 |
© 2017 by the authors. Licensee MDPI, Basel, Switzerland. This article is an open access article distributed under the terms and conditions of the Creative Commons Attribution (CC BY) license ( http://creativecommons.org/licenses/by/4.0/).
Share and Cite
Casillo, A.; Ziaco, M.; Lindner, B.; Merino, S.; Mendoza-Barberá, E.; Tomás, J.M.; Corsaro, M.M. Structural Characterization of Core Region in Erwinia amylovora Lipopolysaccharide. Int. J. Mol. Sci. 2017, 18, 559. https://doi.org/10.3390/ijms18030559
Casillo A, Ziaco M, Lindner B, Merino S, Mendoza-Barberá E, Tomás JM, Corsaro MM. Structural Characterization of Core Region in Erwinia amylovora Lipopolysaccharide. International Journal of Molecular Sciences. 2017; 18(3):559. https://doi.org/10.3390/ijms18030559
Chicago/Turabian StyleCasillo, Angela, Marcello Ziaco, Buko Lindner, Susana Merino, Elena Mendoza-Barberá, Juan M. Tomás, and Maria Michela Corsaro. 2017. "Structural Characterization of Core Region in Erwinia amylovora Lipopolysaccharide" International Journal of Molecular Sciences 18, no. 3: 559. https://doi.org/10.3390/ijms18030559