Review

Determination of the Relative Efficacy of Eicosapentaenoic Acid and Docosahexaenoic Acid for Anti-Cancer Effects in Human Breast Cancer Models

by
Laura VanderSluis
1,
Vera C. Mazurak
1,
Sambasivarao Damaraju
2 and
Catherine J. Field
1,*
1
Department of Agricultural, Food and Nutritional Science, Faculty of Agricultural, Life and Environmental Sciences, Li Ka Shing Center for Health Research Innovation, University of Alberta, Edmonton, AB T6G 2E1, Canada
2
Department of Laboratory Medicine and Pathology, Faculty of Medicine and Dentistry, University of Alberta, Edmonton, AB T6G 2R3, Canada
*
Author to whom correspondence should be addressed.
Int. J. Mol. Sci. 2017, 18(12), 2607; https://doi.org/10.3390/ijms18122607
Submission received: 30 October 2017 / Revised: 20 November 2017 / Accepted: 27 November 2017 / Published: 4 December 2017
(This article belongs to the Special Issue Omega-3 Fatty Acids in Health and Disease: New Knowledge)

Abstract

:
Epidemiological studies have associated high fish oil consumption with decreased risk of breast cancer (BC). n-3 long chain polyunsaturated fatty acids (n-3 LCPUFA), eicosapentaenoic acid (EPA) and docosahexaenoic acid (DHA) found in fish and fish oils exert anti-cancer effects. However, few studies have examined the relative efficacy of EPA and DHA alone and in mixtures on BC subtypes. This was the objective of the present review, as this research is a necessity for the translation of findings to human health and disease. The literature suggests that DHA has a greater anti-cancer effect in triple negative BC (TNBC). In estrogen positive (ER+) BC, DHA has a greater effect on cell viability, while both fatty acids have similar effects on apoptosis and proliferation. These effects are associated with preferential uptake of DHA into TNBC lipid rafts and EPA in ER+ BC. EPA:DHA mixtures have anti-cancer activity; however, the ratio of EPA:DHA does not predict the relative incorporation of these two fatty acids into membrane lipids as EPA appears to be preferentially incorporated. In summary, DHA and EPA should be considered separately in the context of BC prevention. The elucidation of optimal EPA:DHA ratios will be important for designing targeted n-3 LCPUFA treatments.

Graphical Abstract

1. Introduction

Breast cancer (BC) is the most commonly diagnosed form of cancer in North American women [1] and accounts for 26% of new diagnoses in Canadian women [2]. Fish and fish oil supplements are sources of the 20 and 22 hydrocarbon n-3 long chain polyunsaturated fatty acids (n-3 LCPUFA) eicosapentaenoic acid (EPA) and docosahexaenoic acid (DHA) [3]. Epidemiological evidence has found that increased consumption of EPA and DHA from fish oil is associated with a decreased risk of BC [4,5]; however, a meta-analysis of 21 prospective studies concluded that there was insufficient evidence for an association with fish intake and BC risk [4]. EPA and DHA have anti-cancer effects in human BC cell lines and rodents implanted with established mammary tumours or human BC cells. BC is a heterogeneous disease that can be classified into five different subtypes based on the expression of estrogen (ER), progesterone (PR), and human epidermal growth factor 2 (HER2) receptors related to cell growth and survival [6]. Researchers use different human BC cell lines to represent these subtypes, which vary in aggressiveness and prognosis [6]. The mechanisms responsible for anti-cancer effects are multiple and considering all n-3 LCPUFA as acting the same across BC subtypes could limit the effective translation of targeted dietary recommendations for BC prevention in humans (reviewed by [7,8]).
The mechanisms by which EPA and DHA exert anti-cancer effects have been hypothesized to be related to their effect at the cell membrane (reviewed in [7,9,10]). It is well established that EPA and DHA are readily incorporated into membrane phospholipids (PL) [11,12,13,14,15,16] and the lipid microdomains in the membrane (lipid raft [13,17]) of BC tumour cells. This has been shown to disrupt the structural integrity of the lipid bilayer [18] and, as a result, leads to the displacement or sequestration of membrane proteins [13,19,20] involved in cell survival (reviewed in [8,21]). The epidermal growth factor receptor (EGFR) is of particular importance in BC as it is often truncated or overexpressed and is found in lipid rafts [8,22]. When DHA and EPA are incorporated into lipid rafts and membrane PL, the localization and phosphorylation of EGFR has been altered [23,24,25].
Current literature regarding BC prevention seldom considers the effects of EPA and DHA separately and refers to them collectively as n-3 LCPUFA, even though dietary sources of n-3 LCPUFA from whole foods or supplements differ dramatically in the concentrations and ratios of EPA:DHA (reviewed in [10]). The structural differences between EPA and DHA (reviewed in [26]), suggest that there may be differences in membrane incorporation and subsequent effects on membrane fluidity and function. There is evidence that these fatty acids (FA) have different biological effects in markers of cardiovascular disease risk [27] and neurological and neurodegenerative diseases (reviewed in [28]). Despite this, there are a limited number of studies that have explored the relative efficacy of DHA compared to EPA and how mixtures compare in vitro and in feeding models of BC. The objective of the present manuscript is to review the literature to determine, in BC models, the relative anti-cancer effect of EPA and DHA alone and in mixtures on tumour cell viability, apoptosis, proliferation and incorporation into cellular lipids.

2. Methods

2.1. Search Criteria

The present review took a systematic approach to analyzing the literature and included studies that met the following criteria: (1) in vitro studies that compared the effect of DHA to EPA and/or different EPA:DHA mixtures on anti-cancer outcomes in human BC cell lines, or (2) feeding studies that compared the effect of supplementing the diet with EPA, DHA, or different EPA:DHA mixtures in rats with induced mammary carcinogenesis or mice bearing human BC tumours. A literature search of in vitro and feeding studies was conducted in Medline/OVID database on 20 June 2017 and Elton B. Stephens (EBSCO) host database on 1–4 July 2017 using the following terms including: “fatty acids, omega-3, polyunsaturated fatty acids, docosahexaenoic acids, DHA, eicosapentaenoic acid, EPA, marine oil, fish oil(s)”. Keywords including “anticancer; anti-cancer; breast or mammary neoplasms; experimental; carcinoma, ductal; triple negative breast neoplasms; cell line, tumour; MCF-7 cells; SK-BR-3; MDA-MB-231; neoplasms; heterografts; triple negative or HER2 positive; Mammary Neoplasms, Experimental”/ci [Chemically Induced]; rats, transgenic or Sprague Dawley; mice, transgenic or nude or knockout or athymic” were used to capture relevant BC literature. No restriction was made on publication date. The search was rerun on 26 September 2017 in both databases to ensure relevant articles were included.

2.2. Characteristics of Included Studies

In total, 21 studies met the search criteria including 16 in vitro studies and 5 feeding studies. Of the included in vitro studies, 15 directly compared EPA to DHA [11,12,17,23,24,25,29,30,31,32,33,34,35,36,37], while 3 analyzed different EPA:DHA mixtures [13,29,32]. Of the three studies that used EPA:DHA mixtures, none of these compared the effect of these combination treatments to EPA and DHA alone. FA concentrations used in these studies are of physiological relevance as fish oil supplementation in non-small cell lung cancer patients resulted in plasma PL EPA levels equivalent to approximately 88 μM [38]. Of the included feeding studies, three compared the effect of feeding EPA and DHA [14,15,39], while 2 compared mixtures [16,40]. One of the studies comparing a EPA alone diet and DHA alone diet also examined a 1:1 EPA:DHA diet [39].

2.3. Data Extraction and Standardization

For each of the studies included, data was extracted on study design (BC subtype, BC model, treatment groups, concentration of EPA and/or DHA, exposure period, assays) and effect on anti-cancer outcome measures (plasma membrane incorporation, cell growth and viability, EGFR, apoptosis, and phosphoinositide-3-kinase/protein kinase B (PI3K/Akt) signaling). To synthesize the literature in a clear, concise, and consistent manner, data from included studies was standardized after analysis of reported tables and graphs. To standardize the method of reporting concentrations of EPA and/or DHA, concentrations were standardized to micromolar (µM) from in vitro studies and g/100 g diet (w/w) for feeding studies. To standardize the data related to anti-cancer outcome measures, data from in vitro and feeding studies were standardized to fold change or percent change, as appropriate.

3. The Incorporation of Eicosapentaenoic Acid (EPA) and Docosahexaenoic Acid (DHA) into Tumour Cell Lipids

EPA and DHA are readily incorporated into tumour lipids, [32], PL [11,12,13,17,24] and plasma membrane raft PL [13,17] of triple negative (ER−, PR−, HER2−) MDA-MB-231 [11,12,13,17,24,32] and ER+ MCF-7 BC cells [11,12,17,24,32]. An increase in EPA and/or DHA into tumour cell lipids and PL was found to decrease cell survival, as determined by decreased cell viability [11,13,29,32,33,36,37] and proliferation [12,23,24,25,30,31,32,34,35] as well as increased apoptosis [12,23,24,25,29,34,35,37].
The relative increase of EPA and DHA with EPA:DHA mixtures into the plasma membrane has been assessed in MDA-MB-231 [13,32] and MCF-7 [32] BC cells exposed to a 1.5:1 EPA:DHA ratio. The fold increase in EPA was more than DHA in whole cell PL and lipid raft PL [13,32]. If EPA and DHA were equally incorporated, it could be predicted that the amount of EPA in the membrane would be approximately 1.5 times that of DHA in a 1.5:1 EPA:DHA mixture. However, researchers found that the fold increase in EPA was at least twice that of DHA in whole cell and lipid raft PL in both BC subtypes, showing that there is preferential uptake of EPA (Table 1). The fold increase in DHA in MDA-MB-231 BC membrane lipids was reported to be higher than EPA when arachidonic acid (AA) was provided at 140 μM in the media [32]. EPA and AA compete for D5-desaturase [41] and PL uptake into the plasma membrane [42], which may explain why EPA was not preferentially taken up in the presence of a high concentration of AA. Additionally, in this study the fold increase of EPA in MCF-7 BC membrane lipids was greater than that of MDA-MB-231 BC cells with the same EPA:DHA mixtures [32].
A feeding study by Yuri et al. [39] with a 1:1 EPA:DHA mixture found the fold increase of DHA was approximately double of EPA (23 vs. 14 fold increase), which is higher than what would be predicted if equivalent uptake into the membrane occurred. However, when a n-3 LCPUFA diet with more EPA than DHA (1:0.75 EPA:DHA) was fed to rats with induced mammary carcinogenesis, the fold increase in EPA in tumour lipids was greater than what would be predicted [16]. Wei et al. [40] compared the effects of feeding five EPA:DHA diets to rats with induced mammary carcinogenesis. All diets had a 1:5.5 EPA:DHA ratio, but varied in the total concentration (w/w) of EPA and DHA (Table 2). When the total concentration of EPA + DHA (w/w) was low, the amount of EPA in tumour lipids was greater than predicted [40], whereas feeding the diet with the highest concentration of EPA + DHA (w/w) resulted in more DHA in tumour lipids. Collectively, these studies suggests that EPA is preferentially incorporated with EPA:DHA mixtures. It is likely that Yuri et al. [39] and Wei et al. [40] saw more DHA in the membrane due to a concentration effect, as these researchers used much higher concentrations of EPA and DHA (w/w) in their EPA:DHA diets than other studies included in the present review (9.5 g/100 g and 6.6 g/100 g w/w, respectively) (Table 2).
When comparing EPA and DHA directly at the same concentration, preferential uptake into tumour lipids or PL differs between tumour cell membrane location (whole cell lipids or lipid raft) and BC subtype (Table 3). In MDA-MB-231 BC cells, more EPA was found in whole cell lipids [24] and PL [11,12], while DHA appears to be more concentrated into lipid rafts [17]. In MCF-7 BC cells, the fold increase of EPA is similar to DHA in whole cell lipids [24] and PL [11], while the amount of EPA is greater than DHA in lipid rafts [17]. This shows that there are distinctions between BC subtypes and that measurement of whole cell PL may not be reflective of changes in lipid raft PL. In feeding studies, the amount of DHA found in tumour cell lipids is greater than that of EPA at the same concentration [14,15] (Table 4). DHA has also been shown to increase to a greater extent than EPA in tumour PL after long-term feeding (13 weeks), but this was not apparent in short-term feeding (1 week) [15], showing that the exposure period to DHA and EPA is an important consideration to determine the relative efficacy of fold increases into tumour PL. EPA and DHA are enzymatically cleaved from the plasma membrane by phospholipase A2 under inflammatory stimuli [42]. EPA’s hydrocarbon backbone is the same length as that of AA (C20:5 n-3) [42]; therefore, EPA acts as a substrate for cyclooxygenase (COX) in the eicosanoid synthesis pathway and produces prostaglandin (PGE3) [7,43]. DHA is a longer n-3 LCPUFA than EPA (C22:6 n-3) and cannot act as a substrate for COX, although it is able to bind and inhibit COX [7]. Therefore, it could be hypothesized that since EPA, and not DHA, is readily cleaved and used as a substrate for eicosanoid synthesis there appears to be less EPA than DHA in tumour PL.
In summary, in vitro studies with strictly controlled environmental conditions show that the fold increase of EPA in plasma membrane is greater than DHA when provided as a single n-3 LCPUFA and in EPA:DHA mixtures, providing mechanistic evidence for preferential incorporation. In feeding studies, DHA appears to increase to a greater extent into tumour lipid and PL fractions, while EPA is preferentially incorporated in mixtures. It is possible that in feeding studies when EPA is combined with DHA, EPA’s effect on membrane-mediated processes is altered.

4. Effect of DHA and EPA on Tumour Cell Survival

4.1. Cell Growth and Viability

There is considerable evidence that exposing BC cells to EPA and DHA significantly reduces survival (Table 5). In these studies, growth and viability was measured using a number of different methods, including trypan blue exclusion [11,25,29,36] colony formation assays [37], and changes in MTS [31], MTT [12,23,24,32,34,35], and WST-1 [30] measures of metabolic activity, which likely contributes to the wide range in efficacy reported. Studies have also reported decreases in the activation of the PI3K/Akt proliferative signaling pathway [23,25] and phosphorylation of EGFR [24,25]. EPA and DHA also increase proteins involved in apoptotic signaling [12,23,24,37].
Although both EPA and DHA alter viability, their incorporation into tumours is not the same and likely their mechanisms are different. Few researchers have attempted to find the ratio and concentration of EPA and DHA that optimally reduces BC cell survival (Table 5). Mansara et al. [32] and Schley et al. in 2005 and 2007 [13,29] examined the effect of EPA and DHA at a ratio of 1.5:1 (EPA:DHA). Both studies reported decreases in BC cell viability in experiments that ensured a sufficient n-6 FA supply by providing either linoleic acid (LA) [13,29] or AA [32] in the media.
The majority of studies directly comparing the relative efficacy of DHA to EPA have shown that DHA decreases cell viability to a greater extent in MDA-MB-231 [12,25,31,33], MCF-7 [11,24,29,34,35,37], SK-BR-3 [30] and 4HT1 [35] BC cells (Table 6). No studies found that DHA and EPA increase cell viability [24,32,36]. The greater anti-cancer effect of DHA occurred in most of these studies despite EPA being incorporated into tumour lipids and PL fractions to a greater extent than DHA in MDA-MB-231 BC cells [11,12,24] and similar incorporation to that of EPA in MCF-7 BC cells [11,24]. This suggests that DHA alters tumour cell survival differently than EPA and that simply measuring the relative amount that is incorporated into lipids does not explain the difference in efficacy. EPA and DHA are established precursors for anti-inflammatory lipid mediators [7,10,43]. Lipoxygenase and COX pathways use EPA as a substrate for the synthesis of E-series resolvins and DHA is used to produce D-series resolvins, protectins, and maresins [7,42]. These lipid mediators are cytoprotective in normal cells [7,44]. The role of resolvin and protectins in cancer has not been fully elucidated [45,46]. Due to their potent anti-inflammatory properties, it has been hypothesized that resolvins attenuate inflammation-related carcinogenesis [45]. Although not yet investigated in BC [47], it is possible that in E- and D-series resolvins may have distinct effects on cytotoxicity and may account for differences in cell viability.
There is conflicting evidence surrounding the relative efficacy of DHA and EPA on BC cell survival. Das et al. [36] showed that EPA decreases cell viability to a significantly greater extent than DHA after 3 days in luminal B (ER+ PR−/+ HER2+) ZR-75-1 BC cells. DHA and EPA have been shown to be equally efficacious in MDA-MB-231 BC cells using an oleic/LA FA background mixture [11]. Researchers have observed concentration dependent effects of EPA and DHA on survival in MDA-MB-231 [24,30,34], MDA-MB-435s [34], and MCF-7 BC cells [23,30]. Ewaschuk et al. [30] identified a concentration gradient in MCF-7 cells, where DHA decreased cell viability to a greater extent at lower concentrations and EPA was more efficacious at killing BC cells at higher concentrations [24,30]. However, Ewaschuk et al. [30] did not statistically examine the differences in the effects of DHA and EPA. More efficacious killing was observed when DHA was provided in low amounts, suggesting that DHA is more potent. Triple negative BC (TNBC) cells have also been reported to have concentration gradients; however, there is conflicting evidence on the relative efficacy of EPA and DHA at high and low concentrations [24,30,32,34]. The difference in the relative efficacy seen in these studies is likely due to the way EPA and DHA were delivered to the tumour cells as some deliver the n-3 LCPUFA bound to either bovine serum albumin (BSA) [11,30], delipidated endotoxin free BSA [32], or dissolved in ethanol [12,23,24,25,29,33,34,36]. FA that are dissolved in ethanol are not bound to protein and are more readily accessible for incorporation into BC cells, which may induce cytotoxic effects [48].
In summary, EPA and DHA when provided alone or in a mixture, reduce survival of triple negative, ER+, luminal B, and HER2+ BC cells in vitro, although when compared at the same dose, DHA appears to be more efficacious. This might be explained by the structural differences between DHA and EPA. DHA (C22:6 n-3) has one more double bond than EPA (C20:5 n-3) and a longer hydrocarbon chain, giving DHA a distinct three-dimensional conformation that may disrupt the highly ordered cellular membrane to a greater extent [20,26].

4.2. Epidermal Growth Factor Receptor (EGFR)

Of the many receptors involved in growth, the EGFR has been studied the most in n-3 LCPUFA studies. The EGFR is an important membrane receptor that regulates growth and possibly apoptosis in BC cells [13,23,24,25]. EGFR is activated by phosphorylation [22] and both EPA and DHA have been shown to alter EGFR phosphorylation in human BC cells [24]. A study conducted by Schley et al. [13] reported that EPA:DHA mixtures increased whole cell phosphorylated EGFR (pEGFR) and decreased lipid raft EGFR. There was no significant change in whole cell EGFR, implying that EPA:DHA mixtures changed the activation and translocation of EGFR but not total levels of EGFR (Table 7). Increased pEGFR is typically associated with increases in proliferation [50]; however, Schley et al. [13] also observed a decrease in cell viability and an increase in phosphorylated p38 MAPK in cells incubated with this EPA:DHA mixture, which is proposed to promote apoptosis by phosphorylating BimEL, a pro-apoptotic Bcl-2 protein [51,52].
In Corsetto et al. [24], treatment with DHA decreased whole cell EGFR and pEGFR to a greater extent than EPA in MDA-MB-231 BC cells [24]. When 0.01 μM epidermal growth factor (EGF) was added to the media with EPA or DHA treatments, EPA decreased pEGFR to a greater extent and the effect of DHA on EGFR was blunted (Table 8). Lee et al. [25] compared the effect of DHA and EPA on whole cell EGFR in MDA-MB-231 BC cells. Western Blot Analysis showed that DHA decreased amount of EGFR, while EPA did not have a visible effect. Unfortunately, these researchers did not quantify the effect on EGFR. Collectively, this data suggests that DHA is more efficacious than EPA when provided as a single FA in TNBC. In MCF-7 BC cells, treatment with either DHA or EPA did not significantly change the ratio of whole cell pEGFR:EGFR [23].
To summarize, EPA:DHA mixtures significantly increase whole cell pEGFR and decrease lipid raft EGFR in MDA-MB-231 BC cells. DHA decreases whole cell EGFR and pEGFR to a greater extent than EPA when provided as a single FA in these BC cells, suggesting that the effects of EPA:DHA mixtures are attributable to the presence of DHA. The EGFR typically partitions into the lipid raft; however, changes in the lipid bilayer are associated with decreases in EGFR [53]. Since MDA-MB-231 BC cells favour incorporation of DHA into the lipid raft, it is plausible that DHA disrupts the structural integrity of the lipid raft and affects EGFR localization and phosphorylation status. In ER+ MCF-7 BC cells, DHA and EPA act differently and there is not an effect in ER+ cells (MCF-7) on EGFR. This could be attributed to the preferential uptake of EPA into lipid rafts compared to DHA [17], which does not have the same spatial conformation as DHA [26] and, as a result, may not affect receptors found in the lipid raft.

5. Effect of DHA and EPA on Tumour Cell Death

5.1. Apoptosis

EPA and/or DHA have pro-apoptotic effects in both triple negative [12,24] and ER+ [23,24,37] BC subtypes. The pro-apoptotic effects occur with increases in plasma membrane incorporation [12,24] and decreases in cell viability [12,23,24,37], PI3K/Akt activation, [23], and pEGFR activation [24]. These data suggest that EPA and DHA may affect multiple steps in apoptosis.
Mixtures of EPA and DHA with or without LA have been shown to significantly increase apoptosis of MDA-MB-231 BC cells as indicated by an increase in activated caspases [29] (Table 9). The presence of LA in the media blunted the observed increase in activated caspases as well as decreases in cell viability and Akt phosphorylation, suggesting that the efficacy of EPA:DHA combination treatments is dependent upon the presence of other FA.
In TNBC cell lines, DHA caused greater decreases in total amounts of Bcl-2 and procaspase 8 [24] as well as larger increases in single stranded DNA when compared to EPA [12] (Table 10). These data suggest that DHA is a more efficacious inducer of apoptosis, which may be related to the preferential incorporation of DHA into lipid rafts and its more potent effect on decreasing cell viability and whole cell EGFR [25] and pEGFR [24].
In Corsetto et al. [24], researchers examined changes in Bcl-2 and procaspase 8 in ER+ MCF-7 BC cells. DHA had more of an effect on decreasing procaspase 8 and EPA had a larger effect on decreasing Bcl-2. Of note, these endpoints are not valid markers of apoptosis in MCF-7 BC cells, which do not express caspase-3 [54], a critical effector caspase in the apoptosis signaling cascade [55]. These BC cells rely on caspases 6, 7, and 9 to initiate apoptosis [54]; therefore, procaspase 8 is not a central part in the initiation of MCF-7 BC cells. In addition, MCF-7 BC cells are associated with increased total Bcl-2; therefore, it may be easier to see differences than with a cell line that does not overexpress this protein [56]. Chamras et al. [37] found significant increases in the number of apoptotic cells with EPA and DHA treatments when provided alone in MCF-7 BC cells; however, these increases were not different between treatment groups.
In summary, the published data suggests that DHA and EPA have similar effects on apoptotic signaling in ER+ BC cells. This phenomenon may also be explained by previous work conducted in BC cells with DHA, and cell death receptors. In Ewaschuk et al. [30], treatment of MDA-MB-231 BC cells with DHA caused the CD95 death receptor to be translocated to lipid rafts for apoptosis induction. This demonstrates that DHA regulates membrane-associated proteins associated with extrinsic apoptosis. The reliance of MCF-7 BC cells on the intrinsic pathway through the initiation of capsase-9 suggest that the effect of DHA on the membrane and subsequent effects on cell death membrane receptors in TNBC would not impact apoptosis to the same extent in ER+ BC.
Researchers have yet to compare and contrast the effect of DHA and EPA on autophagy, a conserved process that involves the sequestration and degradation of cellular components [57]. Jing et al. [57] reported that in MCF-7 BC cells, DHA induces AMPK phosphorylation, and a decrease in p53 expression and mTOR signaling. mTOR is a negative regulator of autophagy; therefore, DHA promotes autophagy, decreases cell viability, and increases tumour cell susceptibility to apoptosis [57].
A decrease in pAkt is reported upon incubation of MCF-7 BC cells with DHA (see Section 5.2). When Akt is activated, it removes the inhibition of TSC1/2 on Rheb, facilitating the activation of the mTORC1 complex (Raptor and mTOR), which promotes protein synthesis and cell growth [58]. It is plausible that the observed decrease in Akt activation with DHA is a consequence of inhibition of the activation of mTOR in the mTORC1 complex through p53 (as seen in Jing et al. [57]). Increases in apoptosis and decreases in cell viability were also found in MCF-7 BC cells, consistent with the induction of autophagy and promotion of apoptosis as reported by Jing et al. [57].

5.2. The Phosphoinositide-3-Kinase/Protein Kinase B (PI3K/Akt) Pathway

The PI3K/Akt signaling pathway is a proliferative signaling pathway that has been implicated in BC pathogenesis [59]. EPA and DHA have been investigated for their ability to regulate the phosphorylation and activation of Akt, a serine/threonine kinase that regulates cell survival, growth, and transcription [60,61]. One study by Schley et al. [29] examined the effect of a EPA:DHA mixture on the PI3K/Akt pathway (Table 11). Researchers compared the effects of EPA and DHA with or without LA in the media on phosphorylated Akt (pAkt) and Akt in MDA-MB-231 BC cells. They observed a 47% decrease of pAkt; however, this decrease was blunted by the presence of LA. This demonstrates that the presence of n-6 FA may decrease the effect of EPA and DHA on Akt phosphorylation. No significant changes in Akt were observed, suggesting that the combination of DHA and EPA decreases phosphorylation but not total Akt.
Lee et al. [25] saw a decrease in total Akt with DHA and not EPA in MDA-MB-231 BC cells. This may be due to higher lipid raft PL incorporation of DHA [17], a greater decrease in cell viability [12,25,29,31,33], higher apoptosis [12,24], and lower levels of pEGFR [24] and EGFR [25] in tumour cells with DHA treatment compared to MDA-MB-231 BC cells treated with EPA. It is likely that higher lipid raft PL incorporation of DHA decreased EGFR and resulted in a decreased activation of the downstream PI3K/Akt pathway. This may have blunted or removed Akt’s inhibitory effect on Bad and the intrinsic apoptotic signaling cascade [55].
Cao et al. [23] found that EPA and DHA decrease the ratio of pAkt:Akt in MCF-7 BC cells to the same extent, albeit statistical analysis was not performed in this study (Table 12). Western blot analysis showed that EPA and DHA decrease the pAkt:Akt ratio by decreasing pAkt and had no effect on total Akt [23]. This may be explained by the lack of effect of EPA and DHA on total EGFR in these BC cells [23]. PI3K and Akt are kinases that are subsequently activated in a signaling cascade upon binding of EGF to EGFR, receptor dimerization, and EGFR activation by phosphorylation [62]. In controlled in vitro conditions, if EGFR phosphorylation status does not change with exposure to EPA and/or DHA, neither will Akt unless activated by another stimuli.
The effect of feeding EPA and DHA on Akt phosphorylation status has been examined by Chen et al. [63]. These authors intragastrically delivered either a low EPA:DHA diet (0.42 g/100 g diet EPA and 0.38 g/100 g diet DHA) or a high EPA:DHA diet (3.12 g/100 g diet EPA and 1.58 g/100 g diet DHA) to Sprague Dawley Rats bearing N-Nitroso-N-methylurea (MNU) induced mammary carcinogenesis. Rats provided the high EPA:DHA diet experienced a decrease in tumour size and multiplicity compared to the low EPA:DHA group, albeit no statistical analysis was conducted [63]. Western blot analysis revealed no significant differences in Akt between groups; however, a significantly lower level of pAkt (S473) was observed in the tumours of rats fed the high EPA:DHA diet [63]. Researchers did not find a significant difference between groups on the phosphorylation status of the T308 residue of Akt [63]. Phosphorylation of both S473 and T308 are required for full Akt activation [64]; therefore, the decrease in S473 observed with the high n-3 diet most likely affected the function of pAkt, but did not inhibit pAkt activation. The results of this study demonstrating that feeding DHA and EPA can decrease Akt activation in tumours is consistent with the results of the in vitro BC cell studies. This study also shows that western blot analysis of membrane receptors and phosphorylation status of a single residue may not directly translate to protein activity; therefore, functional assays should also be considered.

6. Summary, Conclusions and Future Directions

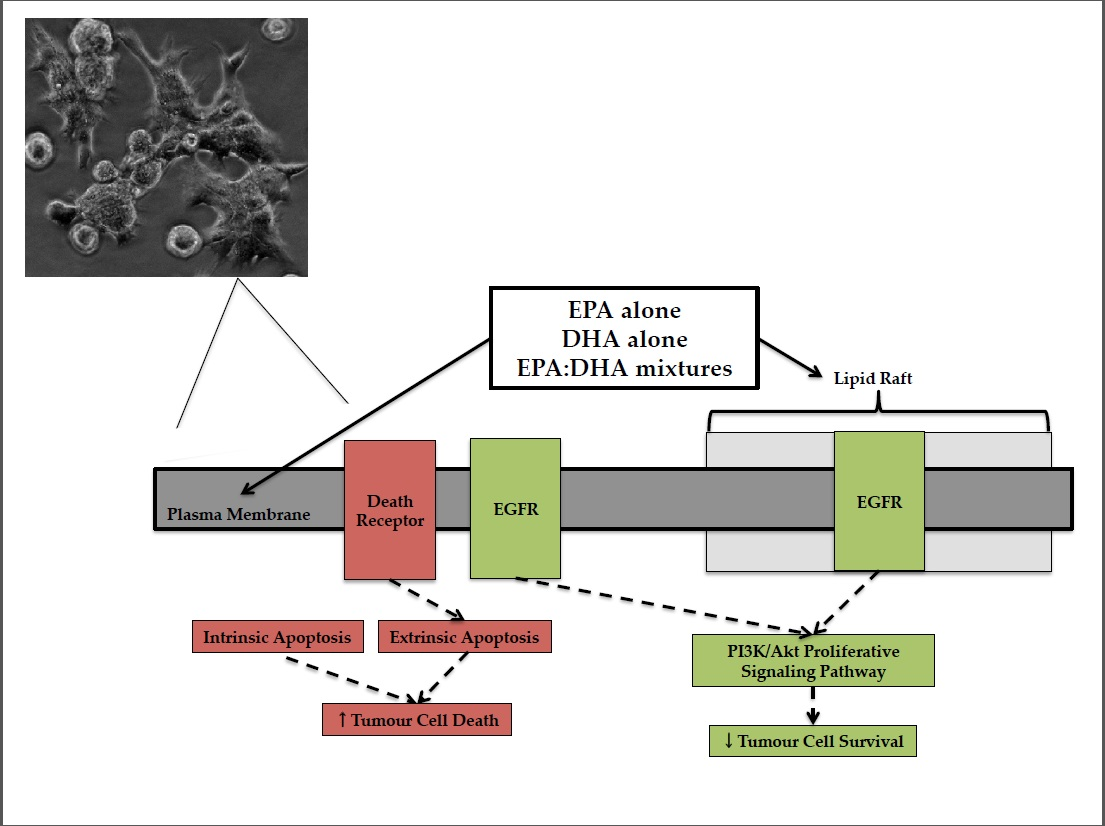
EPA and DHA have demonstrated anti-cancer effects across a variety of cancer types (reviewed in [7]). Currently, it is not known if EPA and DHA have similar effects on BC tumours and if mixtures alter their effect on tumour cell viability, apoptosis, proliferation and incorporation into cellular lipids. Research conducted in BC cell lines and animal models provide essential evidence for changing BC treatments. However, the findings from these studies need to be validated in clinical trials before they can be used to change recommendations or treatment of BC patients.
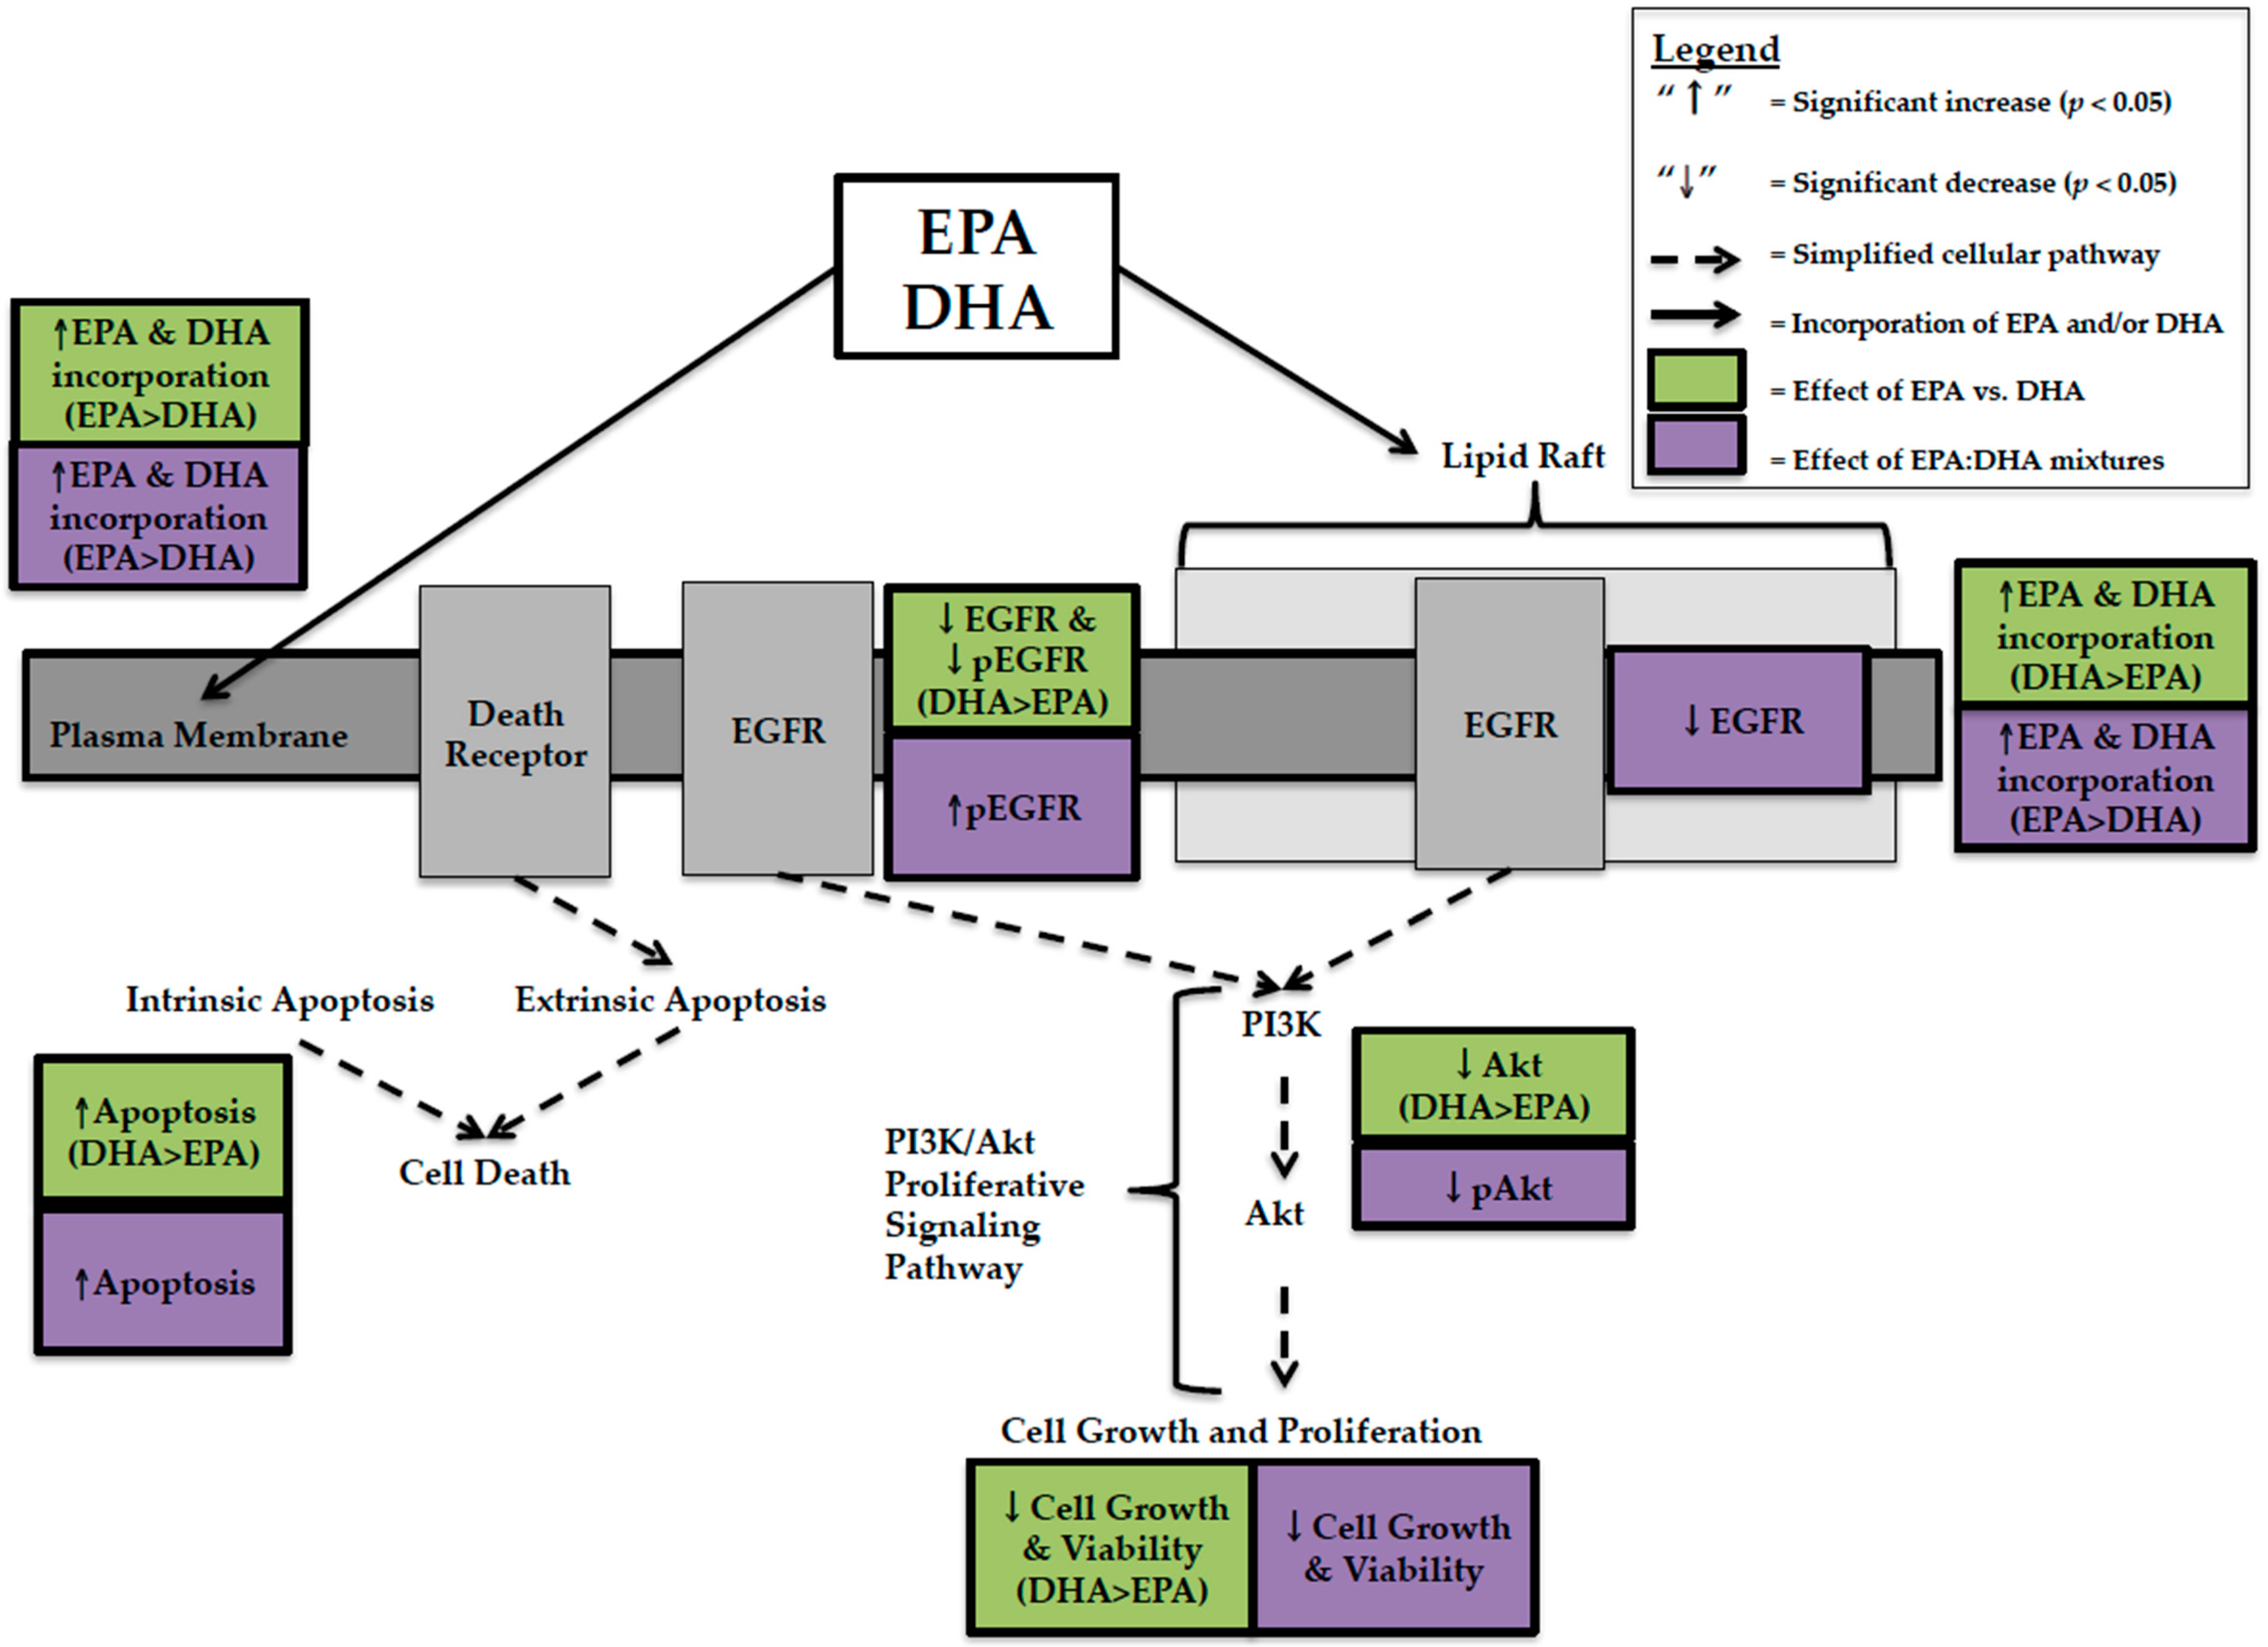
In the present review, EPA and DHA were compared at the same concentration, DHA had higher anti-cancer activity in TNBC cells. This was explained by greater decreases in cell viability [12,25,29,31,33], EGFR [24,25], pEGFR [24], Akt [25], and greater increases in apoptosis [12,24] with DHA compared to EPA (Figure 1). This effect was not predicted by whole cell lipid incorporation as EPA was incorporated more [24], but is related to lipid raft incorporation where DHA was preferentially incorporated over EPA [17]. The data suggests that DHA’s spatial conformation disrupts the organization and fluidity of the lipid raft bilayer in BC cells, effecting membrane receptors involved in proliferative signaling pathways. In MCF-7 BC cells, DHA caused greater decreases in cell viability than EPA when provided at the same concentration. However, unlike TNBC this could not be explained by changes in EGFR, pEGFR [23], Akt [23], or apoptosis [23]. We hypothesized that this was due to preferential incorporation of EPA into lipid rafts of MCF-7 BC cells [17]. EPA has a smaller, more rigid spatial conformation [26] and, as a result, may not affect receptors and proteins involved in proliferative and apoptotic signaling to the same extent as DHA but may affect other proteins. The production of distinct lipid mediators from EPA and DHA (E- and D-series resolvins) may also account for differences in cytotoxicity; however, this remains to be tested in human BC cells representing distinct BC subtypes.
Few studies have attempted to compare and contrast the effect of feeding EPA and DHA alone [14,15,39]. In contrast to in vitro studies, feeding diets supplemented with DHA, compared to EPA resulted in higher membrane incorporation of DHA [14,15,39]. This discrepancy between preferential incorporation of EPA in vitro and DHA in feeding studies may be due either to an interaction between EPA and DHA at the level of the membrane, decreasing availability for membrane uptake or it could be due to inherent differences between cells in vitro and tumour models in animals. In vitro studies allow for the strict control of experimental conditions as well as the precise and accurate delivery of EPA and/or DHA. The presence of the gastrointestinal and hepatic portal vein systems in feeding trials effects how n-3 LCPUFA are absorbed and distributed, therefore; the concentrations of EPA and DHA presented to the tumour in feeding studies may differ compared to what is in the experimental diet.
EPA:DHA mixtures have been studied at a ratio of 1.5:1 and decrease cell viability in both MDA-MB-231 and MCF-7 BC cells [13,32]. There was more EPA in vitro than predicted by this 1.5:1 ratio into whole cell lipids, PL, and lipid raft PL [13,32], again demonstrating that the ratio of EPA:DHA provided in the diet does not predict membrane incorporation. EPA:DHA mixtures in feeding studies [16,39,40] also did not predict membrane incorporation. Despite this, in MDA-MB-231 BC cells, 1.5:1 EPA:DHA mixtures decreased proliferative signaling by decreasing Akt activation [29] and increased apoptosis through caspase activation [29] and phosphorylation of whole cell EGFR [13]. In vitro studies [13,32] have not compared mixtures to EPA and DHA alone on proliferative and apoptotic signaling pathways, making it difficult to determine if the anti-cancer effect of mixtures can be predicted on these endpoints. However, a feeding study conducted by Yuri et al. [39] found that a 1:1 EPA:DHA diet and EPA alone decreased tumour multiplicity (number of carcinomas per effective rat) to a similar extent (1.59 and 1.67, respectively) but to a lesser extent than DHA alone (0.23). This study also found that DHA was preferentially incorporated into mammary tissue lipids to a greater extent than predicted, confirming that the dietary ratio does not predict the relative amount of DHA in the membrane or changes in tumour cell proliferation [39].
Presently there is a great deal of heterogeneity in the literature that makes it challenging for researchers to directly compare and contrast findings from various studies. The exposure period, ratios, and concentrations of EPA and/or DHA used in vitro and in feeding studies differ between studies. Few in vitro studies include a control FA condition [11,13,29] or use background FA that are of physiological relevance [11,13,29,32]. Similarly, few feeding studies used a basal diet to compare the effects of EPA and/or DHA diets [14,15]. In addition, a wide range of assays each with their unique set of strengths and limitations are used across studies to determine the effect of EPA and/or DHA on BC cell viability (Table 6) and apoptosis (Table 10).
Oftentimes, feeding studies did not record food intake [15,16,39], which is critical to determine if animals consumed a sufficient amount of the experimental diet to be exposed to the intended concentration of EPA and DHA. In the present review, feeding studies either induced mammary carcinogenesis by administering MNU [39,40,63] or implanted MDA-MB-435 human BC cell lines in the mammary fat pad of rodents [14,15,16]. Both of these models have inherent limitations. The carcinogenicity of MNU can vary based on the route of administration, timing of exposure, and dose [65], which varied between studies. Xenograft models that inject human BC cells into the mammary tissue more closely represent the tumour microenvironment and BC tumour progression; however, the MDA-MB-435 cells used by Rose et al. [14,15,16] originated from a melanoma cell line and are spontaneously metastatic [6] and, as a result, may not accurately represent BC pathogenesis.
Several knowledge gaps exist in the current literature that need to be addressed before the pleiotropic effects and relative efficacy of EPA and DHA in BC subtypes are fully characterized. In the present review, studies that investigated the anti-cancer effects of EPA, DHA, or EPA:DHA mixtures in vitro were primarily studied in MDA-MB-231 and MCF-7 BC cells. Other BC subtypes including HER2+ and luminal B BC have not been studied. There is also a lack of feeding studies that verify the mechanistic data from in vitro studies. The present review showed that preferential incorporation of EPA and DHA differed between in vitro and some feeding models. Further, membrane changes (fluidity) maybe important in driving the mechanism(s) of cellular phenotypes (apoptosis, proliferation etc.). It would be beneficial to further examine EPA, DHA, and EPA:DHA mixtures in well-designed pre-clinical models. This could include either: (1) in vitro models that mimic the in vivo tumour microenvironment (such as three-dimensional cell culture; reviewed in [66,67]) or (2) animal models that represent the heterogeneity of human tumours (such as patient derived xenografts implanted into mammary tissue; reviewed in [68,69]). HER2 is another ErbB receptor that is commonly truncated or overexpressed in BC [22,70]. Evidence exists for a beneficial effect of DHA [25,71,72] on HER2. However, to date, there are no studies that have systematically compared and contrasted the effect of EPA, DHA, and EPA:DHA mixtures in HER2 overexpressing human BC cell lines, warranting further research. Lastly, the effect of EPA and DHA on autophagy should be examined in MCF-7 BC cells as DHA has been shown to promote autophagy and apoptosis through p53 in these cells [57]. Research could also be done to identify if there is an effect of EPA and/or DHA on autophagy in MDA-MB-231 BC cells, a cell line with a mutated p53 gene [73].

Acknowledgments

This research was supported by the Alberta Canola Producers Association and the Canadian Institute for Health Research. Laura VanderSluis has a scholarship from the Canadian Institutes of Health Research (CIHR).

Author Contributions

Laura VanderSluis and Catherine J. Field designed the review; Laura VanderSluis wrote the draft of the manuscript; Vera C. Mazurak, Sambasivarao Damaraju and Catherine J. Field reviewed drafts and edited the manuscript.

Conflicts of Interest

The authors declare no conflict of interest.

Abbreviations

BCBreast Cancer
n-3 LCPUFAn-3 Long Chain Polyunsaturated Fatty Acids
DHADocosahexaenoic acid
EPAEicosapentaenoic acid
EGFREpidermal Growth Factor Receptor
PLPhospholipid
EREstrogen Receptor
PRProgesterone Receptor
HER2Human Epidermal Growth Factor Receptor
FAFatty Acid
LALinoleic Acid
AAArachidonic Acid
PI3K/AktPhosphoinositide-3-kinase/protein kinase B
TNBCTriple Negative Breast Cancer

References

  1. Ferlay, J.; Soerjomataram, I.; Dikshit, R.; Eser, S.; Mathers, C.; Rebelo, M.; Parkin, D.M.; Forman, D.; Bray, F. Cancer incidence and mortality worldwide: Sources, methods and major patterns in GLOBOCAN 2012. Int. J. Cancer 2015, 136, E359–E386. [Google Scholar] [CrossRef] [PubMed]
  2. Canadian Cancer Society’s Advisory Committee on Cancer Statistics. Canadian Cancer Statistics 2017. Available online: http://www.cancer.ca/~/media/cancer.ca/CW/publications/Canadian%20Cancer%20Statistics/Canadian-Cancer-Statistics-2017-EN.pdf (accessed on 28 September 2017).
  3. Stulnig, T.M.; Huber, J.; Leitinger, N.; Imre, E.M.; Angelisova, P.; Nowotny, P.; Waldhausl, W. Polyunsaturated eicosapentaenoic acid displaces proteins from membrane rafts by altering raft lipid composition. J. Biol. Chem. 2001, 276, 37335–37340. [Google Scholar] [CrossRef] [PubMed]
  4. Zheng, J.S.; Hu, X.J.; Zhao, Y.M.; Yang, J.; Li, D. Intake of fish and marine n-3 polyunsaturated fatty acids and risk of breast cancer: Meta-analysis of data from 21 independent prospective cohort studies. BMJ 2013, 346. [Google Scholar] [CrossRef] [PubMed]
  5. Murff, H.J.; Shu, X.O.; Li, H.; Yang, G.; Wu, X.; Cai, H.; Wen, W.; Gao, Y.T.; Zheng, W. Dietary polyunsaturated fatty acids and breast cancer risk in Chinese women: A prospective cohort study. Int. J. Cancer 2011, 128, 1434–1441. [Google Scholar] [CrossRef] [PubMed]
  6. Holliday, D.L.; Speirs, V. Choosing the right cell line for breast cancer research. Breast Cancer Res. 2011, 13, 215. [Google Scholar] [CrossRef] [PubMed]
  7. D’Eliseo, D.; Velotti, F. Omega-3 Fatty Acids and Cancer Cell Cytotoxicity: Implications for Multi-Targeted Cancer Therapy. J. Clin. Med. 2016, 5, 15. [Google Scholar] [CrossRef] [PubMed]
  8. Babina, I.S.; Donatello, S.; Nabi, I.R.; Hopkins, A.M. Lipid rafts as master regulators of breast cancer cell function. In Breast Cancer—Carcinogenesis, Cell Growth and Signalling Pathways; Mehmet Gunduz, E.G., Ed.; InTech Open Publications: London, UK, 2011; pp. 401–428. [Google Scholar]
  9. Calder, P.C. Functional Roles of Fatty Acids and Their Effects on Human Health. J. Parenter. Enter. Nutr. 2015, 39 (Suppl. S1), 18S–32S. [Google Scholar] [CrossRef] [PubMed]
  10. Fabian, C.J.; Kimler, B.F.; Hursting, S.D. Omega-3 fatty acids for breast cancer prevention and survivorship. Breast Cancer Res. 2015, 17, 62. [Google Scholar] [CrossRef] [PubMed]
  11. Yu, H.M. Bypassing the D6-desaturase enzyme and directly providing n-3 and n-6 PUFA pathway intermediates reduces the survival of two human breast cancer cell lines. Eur. J. Lipid Sci. Technol. 2015, 117, 1378–1390. [Google Scholar] [CrossRef]
  12. Barascu, A.; Besson, P.; Le Floch, O.; Bougnoux, P.; Jourdan, M.L. CDK1-cyclin B1 mediates the inhibition of proliferation induced by omega-3 fatty acids in MDA-MB-231 breast cancer cells. Int. J. Biochem. Cell Biol. 2006, 38, 196–208. [Google Scholar] [CrossRef] [PubMed]
  13. Schley, P.D.; Brindley, D.N.; Field, C.J. (n-3) PUFA alter raft lipid composition and decrease epidermal growth factor receptor levels in lipid rafts of human breast cancer cells. J. Nutr. 2007, 137, 548–553. [Google Scholar] [PubMed]
  14. Rose, D.P.; Connolly, J.M.; Rayburn, J.; Coleman, M. Influence of diets containing eicosapentaenoic or docosahexaenoic acid on growth and metastasis of breast cancer cells in nude mice. J. Natl. Cancer Inst. 1995, 87, 587–592. [Google Scholar] [CrossRef] [PubMed]
  15. Rose, D.P.; Connolly, J.M.; Coleman, M. Effect of omega-3 fatty acids on the progression of metastases after the surgical excision of human breast cancer cell solid tumors growing in nude mice. Clin. Cancer Res. 1996, 2, 1751–1756. [Google Scholar] [PubMed]
  16. Rose, D.P.; Rayburn, J.; Hatala, M.A.; Connolly, J.M. Effects of dietary fish oil on fatty acids and eicosanoids in metastasizing human breast cancer cells. Nutr. Cancer 1994, 22, 131–141. [Google Scholar] [CrossRef] [PubMed]
  17. Corsetto, P.A.; Cremona, A.; Montorfano, G.; Jovenitti, I.E.; Orsini, F.; Arosio, P.; Rizzo, A.M. Chemical-physical changes in cell membrane microdomains of breast cancer cells after omega-3 PUFA incorporation. Cell Biochem. Biophys. 2012, 64, 45–59. [Google Scholar] [CrossRef] [PubMed]
  18. Chapkin, R.S.; Wang, N.; Fan, Y.Y.; Lupton, J.R.; Prior, I.A. Docosahexaenoic acid alters the size and distribution of cell surface microdomains. Biochim. Biophys. Acta 2008, 1778, 466–471. [Google Scholar] [CrossRef] [PubMed]
  19. Stillwell, W.; Shaikh, S.R.; Zerouga, M.; Siddiqui, R.; Wassall, S.R. Docosahexaenoic acid affects cell signaling by altering lipid rafts. Reprod. Nutr. Dev. 2005, 45, 559–579. [Google Scholar] [CrossRef] [PubMed]
  20. Calder, P.C. The DHA content of a cell membrane can have a significant influence on cellular behaviour and responsiveness to signals. Ann. Nutr. Metab. 2016, 69 (Suppl. S1), 8–21. [Google Scholar] [CrossRef] [PubMed]
  21. Liu, J.; Ma, D.W. The role of n-3 polyunsaturated fatty acids in the prevention and treatment of breast cancer. Nutrients 2014, 6, 5184–5223. [Google Scholar] [CrossRef] [PubMed]
  22. Nahta, R.; Hortobagyi, G.N.; Esteva, F.J. Growth factor receptors in breast cancer: Potential for therapeutic intervention. Oncologist 2003, 8, 5–17. [Google Scholar] [CrossRef] [PubMed]
  23. Cao, W.; Ma, Z.; Rasenick, M.M.; Yeh, S.; Yu, J. N-3 poly-unsaturated fatty acids shift estrogen signaling to inhibit human breast cancer cell growth. PLoS ONE 2012, 7, e52838. [Google Scholar] [CrossRef] [PubMed]
  24. Corsetto, P.A.; Montorfano, G.; Zava, S.; Jovenitti, I.E.; Cremona, A.; Berra, B.; Rizzo, A.M. Effects of n-3 PUFAs on breast cancer cells through their incorporation in plasma membrane. Lipids Health Dis. 2011, 10. [Google Scholar] [CrossRef] [PubMed]
  25. Lee, E.J.; Yun, U.J.; Koo, K.H.; Sung, J.Y.; Shim, J.; Ye, S.K.; Hong, K.M.; Kim, Y.N. Down-regulation of lipid raft-associated onco-proteins via cholesterol-dependent lipid raft internalization in docosahexaenoic acid-induced apoptosis. Biochim. Biophys. Acta 2014, 1841, 190–203. [Google Scholar] [CrossRef] [PubMed]
  26. Gorjao, R.; Azevedo-Martins, A.K.; Rodrigues, H.G.; Abdulkader, F.; Arcisio-Miranda, M.; Procopio, J.; Curi, R. Comparative effects of DHA and EPA on cell function. Pharmacol. Ther. 2009, 122, 56–64. [Google Scholar] [CrossRef] [PubMed]
  27. Asztalos, I.B.; Gleason, J.A.; Sever, S.; Gedik, R.; Asztalos, B.F.; Horvath, K.V.; Dansinger, M.L.; Lamon-Fava, S.; Schaefer, E.J. Effects of eicosapentaenoic acid and docosahexaenoic acid on cardiovascular disease risk factors: A randomized clinical trial. Metabolism 2016, 65, 1636–1645. [Google Scholar] [CrossRef] [PubMed]
  28. Dyall, S.C. Long-chain omega-3 fatty acids and the brain: A review of the independent and shared effects of EPA, DPA and DHA. Front. Aging Neurosci. 2015, 7. [Google Scholar] [CrossRef] [PubMed]
  29. Schley, P.D.; Jijon, H.B.; Robinson, L.E.; Field, C.J. Mechanisms of omega-3 fatty acid-induced growth inhibition in MDA-MB-231 human breast cancer cells. Breast Cancer Res. Treat. 2005, 92, 187–195. [Google Scholar] [CrossRef] [PubMed]
  30. Ewaschuk, J.B.; Newell, M.; Field, C.J. Docosahexanoic acid improves chemotherapy efficacy by inducing CD95 translocation to lipid rafts in ER(−) breast cancer cells. Lipids 2012, 47, 1019–1030. [Google Scholar] [CrossRef] [PubMed]
  31. Rahman, M.M.; Veigas, J.M.; Williams, P.J.; Fernandes, G. DHA is a more potent inhibitor of breast cancer metastasis to bone and related osteolysis than EPA. Breast Cancer Res. Treat. 2013, 141, 341–352. [Google Scholar] [CrossRef] [PubMed]
  32. Mansara, P.P.; Deshpande, R.A.; Vaidya, M.M.; Kaul-Ghanekar, R. Differential Ratios of Omega Fatty Acids (AA/EPA + DHA) Modulate Growth, Lipid Peroxidation and Expression of Tumor Regulatory MARBPs in Breast Cancer Cell Lines MCF7 and MDA-MB-231. PLoS ONE 2015, 10, e0136542. [Google Scholar] [CrossRef] [PubMed]
  33. Rose, D.P.; Connolly, J.M. Effects of fatty acids and inhibitors of eicosanoid synthesis on the growth of a human breast cancer cell line in culture. Cancer Res. 1990, 50, 7139–7144. [Google Scholar] [PubMed]
  34. Kang, K.S.; Wang, P.; Yamabe, N.; Fukui, M.; Jay, T.; Zhu, B.T. Docosahexaenoic acid induces apoptosis in MCF-7 cells in vitro and in vivo via reactive oxygen species formation and caspase 8 activation. PLoS ONE 2010, 5, e10296. [Google Scholar] [CrossRef] [PubMed]
  35. Xue, M.; Wang, Q.; Zhao, J.; Dong, L.; Ge, Y.; Hou, L.; Liu, Y.; Zheng, Z. Docosahexaenoic acid inhibited the Wnt/β-catenin pathway and suppressed breast cancer cells in vitro and in vivo. J. Nutr. Biochem. 2014, 25, 104–110. [Google Scholar] [CrossRef] [PubMed]
  36. Das, U.N. Tumoricidal action of cis-unsaturated fatty acids and their relationship to free radicals and lipid peroxidation. Cancer Lett. 1991, 56, 235–243. [Google Scholar] [CrossRef]
  37. Chamras, H.; Ardashian, A.; Heber, D.; Glaspy, J.A. Fatty acid modulation of MCF-7 human breast cancer cell proliferation, apoptosis and differentiation. J. Nutr. Biochem. 2002, 13, 711–716. [Google Scholar] [CrossRef]
  38. Murphy, R.A.; Mourtzakis, M.; Chu, Q.S.; Baracos, V.E.; Reiman, T.; Mazurak, V.C. Supplementation with fish oil increases first-line chemotherapy efficacy in patients with advanced nonsmall cell lung cancer. Cancer 2011, 117, 3774–3780. [Google Scholar] [CrossRef] [PubMed]
  39. Yuri, T.; Danbara, N.; Tsujita-Kyutoku, M.; Fukunaga, K.; Takada, H.; Inoue, Y.; Hada, T.; Tsubura, A. Dietary docosahexaenoic acid suppresses N-methyl-N-nitrosourea-induced mammary carcinogenesis in rats more effectively than eicosapentaenoic acid. Nutr. Cancer 2003, 45, 211–217. [Google Scholar] [CrossRef] [PubMed]
  40. Wei, N.; Wang, B.; Zhang, Q.Y.; Mi, M.T.; Zhu, J.D.; Yu, X.P.; Yuan, J.L.; Chen, K.; Wang, J.; Chang, H. Effects of different dietary fatty acids on the fatty acid compositions and the expression of lipid metabolic-related genes in mammary tumor tissues of rats. Nutr. Cancer 2008, 60, 810–825. [Google Scholar] [CrossRef] [PubMed]
  41. Calder, P.C. Omega-3 polyunsaturated fatty acids and inflammatory processes: Nutrition or pharmacology? Br. J. Clin. Pharmacol. 2013, 75, 645–662. [Google Scholar] [CrossRef] [PubMed]
  42. Calder, P.C. Marine omega-3 fatty acids and inflammatory processes: Effects, mechanisms and clinical relevance. Biochim. Biophys. Acta 2015, 1851, 469–484. [Google Scholar] [CrossRef] [PubMed]
  43. Serhan, C.N. Resolution phase of inflammation: Novel endogenous anti-inflammatory and proresolving lipid mediators and pathways. Annu. Rev. Immunol. 2007, 25, 101–137. [Google Scholar] [CrossRef] [PubMed]
  44. Das, U.N.; Madhavi, N. Effect of polyunsaturated fatty acids on drug-sensitive and resistant tumor cells in vitro. Lipids Health Dis. 2011, 10. [Google Scholar] [CrossRef] [PubMed]
  45. Moro, K.; Nagahashi, M.; Ramanathan, R.; Takabe, K.; Wakai, T. Resolvins and omega three polyunsaturated fatty acids: Clinical implications in inflammatory diseases and cancer. World J. Clin. Cases 2016, 4, 155–164. [Google Scholar] [CrossRef] [PubMed]
  46. Greene, E.R.; Huang, S.; Serhan, C.N.; Panigrahy, D. Regulation of inflammation in cancer by eicosanoids. Prostaglandins Other Lipid Mediat. 2011, 96, 27–36. [Google Scholar] [CrossRef] [PubMed]
  47. Das, U.N. Lipoxins, resolvins, protectins, maresins and nitrolipids, and their clinical implications with specific reference to cancer: Part I. Clin. Lipidol. 2013, 8, 437–463. [Google Scholar] [CrossRef]
  48. Schaffer, J.E. Lipotoxicity: When tissues overeat. Curr. Opin. Lipidol. 2003, 14, 281–287. [Google Scholar] [CrossRef] [PubMed]
  49. Yun, E.J.; Song, K.S.; Shin, S.; Kim, S.; Heo, J.Y.; Kweon, G.R.; Wu, T.; Park, J.I.; Lim, K. Docosahexaenoic acid suppresses breast cancer cell metastasis by targeting matrix-metalloproteinases. Oncotarget 2016, 7, 49961–49971. [Google Scholar] [CrossRef] [PubMed]
  50. Wee, P.; Wang, Z. Epidermal Growth Factor Receptor Cell Proliferation Signaling Pathways. Cancers 2017, 9, 52. [Google Scholar]
  51. Cai, B.; Chang, S.H.; Becker, E.B.; Bonni, A.; Xia, Z. p38 MAP kinase mediates apoptosis through phosphorylation of BimEL at Ser-65. J. Biol. Chem. 2006, 281, 25215–25222. [Google Scholar] [CrossRef] [PubMed]
  52. Fukazawa, H.; Noguchi, K.; Masumi, A.; Murakami, Y.; Uehara, Y. BimEL is an important determinant for induction of anoikis sensitivity by mitogen-activated protein/extracellular signal-regulated kinase kinase inhibitors. Mol. Cancer Ther. 2004, 3, 1281–1288. [Google Scholar] [PubMed]
  53. Pike, L.J.; Han, X.; Gross, R.W. Epidermal growth factor receptors are localized to lipid rafts that contain a balance of inner and outer leaflet lipids: A shotgun lipidomics study. J. Biol. Chem. 2005, 280, 26796–26804. [Google Scholar] [CrossRef] [PubMed]
  54. Liang, Y.; Yan, C.; Schor, N.F. Apoptosis in the absence of caspase 3. Oncogene 2001, 20, 6570–6578. [Google Scholar] [CrossRef] [PubMed]
  55. Ashkenazi, A. Directing cancer cells to self-destruct with pro-apoptotic receptor agonists. Nat. Rev. Drug Discov. 2008, 7, 1001–1012. [Google Scholar] [CrossRef] [PubMed]
  56. Hellemans, P.; van Dam, P.A.; Weyler, J.; van Oosterom, A.T.; Buytaert, P.; Van Marck, E. Prognostic value of bcl-2 expression in invasive breast cancer. Br. J. Cancer 1995, 72, 354–360. [Google Scholar] [CrossRef] [PubMed]
  57. Jing, K.; Song, K.S.; Shin, S.; Kim, N.; Jeong, S.; Oh, H.R.; Park, J.H.; Seo, K.S.; Heo, J.Y.; Han, J.; et al. Docosahexaenoic acid induces autophagy through p53/AMPK/mTOR signaling and promotes apoptosis in human cancer cells harboring wild-type p53. Autophagy 2011, 7, 1348–1358. [Google Scholar] [CrossRef] [PubMed]
  58. Mohseni, M.; Park, B.H. PIK3CA and KRAS mutations predict for response to everolimus therapy: Now that’s RAD001. J. Clin. Investig. 2010, 120, 2655–2658. [Google Scholar] [CrossRef] [PubMed]
  59. Paplomata, E.; O’Regan, R. The PI3K/AKT/mTOR pathway in breast cancer: Targets, trials and biomarkers. Ther. Adv. Med. Oncol. 2014, 6, 154–166. [Google Scholar] [CrossRef] [PubMed]
  60. Zhao, L.; Lee, J.Y.; Hwang, D.H. The phosphatidylinositol 3-kinase/Akt pathway negatively regulates Nod2-mediated NF-κB pathway. Biochem. Pharmacol. 2008, 75, 1515–1525. [Google Scholar] [CrossRef] [PubMed]
  61. Iacovides, D.C.; Johnson, A.B.; Wang, N.; Boddapati, S.; Korkola, J.; Gray, J.W. Identification and quantification of AKT isoforms and phosphoforms in breast cancer using a novel nanofluidic immunoassay. Mol. Cell. Proteom. 2013, 12, 3210–3220. [Google Scholar] [CrossRef] [PubMed]
  62. Fuller, S.J.; Sivarajah, K.; Sugden, P.H. ErbB receptors, their ligands, and the consequences of their activation and inhibition in the myocardium. J. Mol. Cell. Cardiol. 2008, 44, 831–854. [Google Scholar] [CrossRef] [PubMed]
  63. Chen, Z.; Zhang, Y.; Jia, C.; Wang, Y.; Lai, P.; Zhou, X.; Wang, Y.; Song, Q.; Lin, J.; Ren, Z.; et al. mTORC1/2 targeted by n-3 polyunsaturated fatty acids in the prevention of mammary tumorigenesis and tumor progression. Oncogene 2014, 33, 4548–4557. [Google Scholar] [CrossRef] [PubMed]
  64. Song, G.; Ouyang, G.; Bao, S. The activation of Akt/PKB signaling pathway and cell survival. J. Cell. Mol. Med. 2005, 9, 59–71. [Google Scholar] [CrossRef] [PubMed]
  65. Tsubura, A.; Lai, Y.C.; Miki, H.; Sasaki, T.; Uehara, N.; Yuri, T.; Yoshizawa, K. Review: Animal models of N-Methyl-N-nitrosourea-induced mammary cancer and retinal degeneration with special emphasis on therapeutic trials. In Vivo 2011, 25, 11–22. [Google Scholar] [PubMed]
  66. Vidi, P.A.; Bissell, M.J.; Lelievre, S.A. Three-dimensional culture of human breast epithelial cells: The how and the why. Methods Mol. Biol. 2013, 945, 193–219. [Google Scholar] [PubMed]
  67. Yamada, K.M.; Cukierman, E. Modeling tissue morphogenesis and cancer in 3D. Cell 2007, 130, 601–610. [Google Scholar] [CrossRef] [PubMed]
  68. DeRose, Y.S.; Gligorich, K.M.; Wang, G.; Georgelas, A.; Bowman, P.; Courdy, S.J.; Welm, A.L.; Welm, B.E. Patient-derived models of human breast cancer: Protocols for in vitro and in vivo applications in tumor biology and translational medicine. Curr. Protoc. Pharmacol. 2013. [Google Scholar] [CrossRef]
  69. Whittle, J.R.; Lewis, M.T.; Lindeman, G.J.; Visvader, J.E. Patient-derived xenograft models of breast cancer and their predictive power. Breast Cancer Res. 2015, 17, 17. [Google Scholar] [CrossRef] [PubMed]
  70. Zou, Z.; Bidu, C.; Bellenger, S.; Narce, M.; Bellenger, J. n-3 polyunsaturated fatty acids and HER2-positive breast cancer: Interest of the fat-1 transgenic mouse model over conventional dietary supplementation. Biochimie 2014, 96, 22–27. [Google Scholar] [CrossRef] [PubMed]
  71. Li, C.C.; Yao, H.T.; Cheng, F.J.; Hsieh, Y.H.; Lu, C.Y.; Wu, C.C.; Liu, K.L.; Chang, J.W. Docosahexaenoic Acid Downregulates EGF-Induced Urokinase Plasminogen Activator and Matrix Metalloproteinase 9 Expression by Inactivating EGFR/ErbB2 Signaling in SK-BR3 Breast Cancer Cells. Nutr. Cancer 2015, 67, 771–782. [Google Scholar] [CrossRef] [PubMed]
  72. Menendez, J.A.; Lupu, R.; Colomer, R. Exogenous supplementation with omega-3 polyunsaturated fatty acid docosahexaenoic acid (DHA; 22:6n-3) synergistically enhances taxane cytotoxicity and downregulates Her-2/neu (c-erbB-2) oncogene expression in human breast cancer cells. Eur. J. Cancer Prev. 2005, 14, 263–270. [Google Scholar] [CrossRef] [PubMed]
  73. Huovinen, M.; Loikkanen, J.; Myllynen, P.; Vahakangas, K.H. Characterization of human breast cancer cell lines for the studies on p53 in chemical carcinogenesis. Toxicol. In Vitro 2011, 25, 1007–1017. [Google Scholar] [CrossRef] [PubMed]
Figure 1. Schematic illustrating the pleiotropic effects and relative efficacy of eicosapentaenoic Acid (EPA) and/or docosahexaenoic Acid (DHA) in MDA-MB-231 human breast cancer cells. EGFR = Epidermal Growth Factor Receptor; pEGFR = Phosphorylated EGFR; PI3K = Phosphoinositide-3-kinase; Akt = Protein Kinase B; pAkt = Phosphorylated Akt.
Ijms 18 02607 g001
Table 1. Incorporation of EPA and DHA measured in the plasma membrane with EPA:DHA mixtures in human BC cell lines.
CitationCell LineConcentration of EPA or DHA (µM)Ratio EPA:DHALipid FractionFold Change in Incorporation *
EPADHA
Schley, Brindley and Field [13]MDA-MB-23160 EPA + 40 DHA1.5:1Whole cell PL↑157↓0.2
Lipid raft PL↑73↑8
45 EPA + 30 DHA + 75 LA1.5:1Whole cell PL↑49↑2
Lipid raft PL↑21↑3
Mansara, Deshpande, Vaidya and Kaul-Ghanekar [32]MDA-MB-23184 EPA + 56 DHA + 140 AA1.5:1Whole cell total lipids↑0↑1
120 EPA + 80 DHA + 80 AA↑1↑0.2
134 EPA + 90 DHA + 56 AA↑1↑1
140 EPA + 93 DHA + 47 AA↑2↑1
153 EPA + 102 DHA + 25 AA↑4↑1
MCF-784 EPA + 56 DHA + 140 AA1.5:1Whole cell total lipids↑1↑0.3
120 EPA + 80 DHA + 80 AA↑2↑1
134 EPA + 90 DHA + 56 AA↑3↑1
140 EPA + 93 DHA + 47 AA↑3↑1
153 EPA + 102 DHA + 25 AA↑5↑1
EPA = eicosapentaenoic acid, DHA = docosahexaenoic acid; LA = linoleic acid; AA = arachidonic acid; PL = phospholipid; FA = fatty acids; “↑” denotes significant increase (p < 0.05); “↓” denotes significant decrease (p < 0.05). * Fold change relative to control conditions.
Table 2. Incorporation of EPA and DHA measured in the plasma membrane when feeding EPA:DHA mixtures in rodent models of human BC.
CitationMethod Used to Induce Mammary CarcinogenesisExperimental DietsConcentration of EPA or DHA (w/w Diet, g/100 g) Ratio EPA:DHALipid FractionExposure (Weeks)Fold Change in Incorporation *
EPADHA
Yuri, Danbara, Tsujita-Kyutoku, Fukunaga, Takada, Inoue, Hada and Tsubura [39]MNU administration in ratsEPA9.5 EPA1:0Mammary tissue total lipids20310.5
DHA9.5 DHA 0:1230
EPA + DHA4.75 EPA + 4.75 DHA1:11423
Wei, Wang, Zhang, Mi, Zhu, Yu, Yuan, Chen, Wang and Chang [40]MNU administration in ratsSFA0 EPA + 0 DHA0:0Tumour total lipids18ND↑0.04
MUFA0 EPA + 0 DHA0:0ND↑0.5
n-6 PUFA0 EPA + 0 DHA0:0ND↓0.2
n-3 LCPUFA1 EPA + 5.6 DHA1:5.5↓0.3↑0.3
1:1 (n-6:n-3)0.5 EPA + 2.8 DHA↑0.04↓0.07
1:2:1 S/M/P 1:1 (n-6:n-3)0.2 EPA + 1.1 DHA↑0.1↑0.04
5:1 (n-6:n-3)0.16 EPA + 0.9 DHA↑0.5↓0.05
10:1 (n-6:n-3)0.09 EPA + 0.49 DHA↑0.07↓0.06
Rose, Rayburn, Hatala and Connolly [16]Xenograft in mammary fat pad using MDA-MB-435 in nude mice11.5% MO+ 11.5% CO0.42 EPA + 0.32 DHA1:0.75Tumour PL12↑1↑0.2
18% MO+ 5% CO0.66 EPA + 0.50 DHA↑3↑0.4
Italicized numbers represents fatty acid composition of the mammary tissue and not fold-increase in incorporation, as this study did not have a control group. MNU = N-methyl-N-nitrosourea; EPA = eicosapentaenoic acid, DHA = docosahexaenoic acid; SFA = saturated fatty acid; MUFA = monounsaturated fatty acid; PUFA = polyunsaturated fatty acid; S/M/P = saturated/monounsaturated/polyunsaturated; MO = menhaden oil; CO = corn oil; PL = phospholipid; “↑” denotes significant increase (p < 0.05); ND = not determined; “↓” denotes significant decrease (p < 0.05). * Fold change relative to control conditions.
Table 3. Incorporation of EPA and DHA measured in the plasma membrane when comparing EPA to DHA in human BC cell lines.
CitationCell LineConcentration of EPA or DHA (µM)Lipid FractionFold Change in Incorporation *
EPADHA
Corsetto, Montorfano, Zava, Jovenitti, Cremona, Berra and Rizzo [24]MDA-MB-231230 EPAWhole cell total lipids↑15↓0.2
200 DHAWhole cell total lipids↓0.8↑7
MCF-7230 EPA Whole cell total lipids↑10↑0.5
200 DHAWhole cell total lipids↓0.6↑9
Corsetto, Cremona, Montorfano, Jovenitti, Orsini, Arosio and Rizzo [17]MDA-MB-231230 EPALipid raft PL↑7↑1
200 DHALipid raft PL↑0.6↑11
MCF-7230 EPALipid raft PL↑16↑6
200 DHALipid raft PL↓0.3↑6
Yu [11]MDA-MB-231150 EPA + 40 OA + 40 LAWhole cell PL↑31↑1.5
150 DHA + 40 OA + 40 LAWhole cell PL↓0.5↑11
MCF-7150 EPA + 40 OA + 40 LAWhole cell PL↑10↑0.1
150 DHA + 40 OA + 40 LAWhole cell PL↓0.5↑7
Barascu, Besson, Le Floch, Bougnoux and Jourdan [12]MDA-MB-23130 EPAWhole cell PL↑13↑2
30 DHAWhole cell PL↑0.2↑3
EPA = eicosapentaenoic acid, DHA = docosahexaenoic acid; OA = oleic acid; LA = linoleic acid; FA = fatty acids; PL = phospholipid; “↑” denotes significant increase (p < 0.05); “↓” denotes significant decrease (p < 0.05). * Fold change relative to control conditions.
Table 4. Incorporation of EPA and DHA measured in the plasma membrane when comparing EPA to DHA in rodent models of human BC.
CitationMethod Used to Induce Mammary CarcinogenesisExperimental DietsConcentration of EPA or DHA (w/w Diet, g/100 g)Lipid FractionExposure Period (Weeks)Fold Change in Incorporation *
EPADHA
Rose, Connolly, Rayburn and Coleman [14]Xenograft in mammary fat pad using MDA-MB-435 in nude mice4% EPA0.7 EPATumour PL13↑54↑26
4% DHA0.7 DHA↑15↑107
8% EPA1.5 EPA↑104↑18
8% DHA1.5 DHA↑36↑127
Rose, Connolly and Coleman [15]Xenograft in mammary fat pad using MDA-MB-435 in nude mice4% EPA0.7 EPATumour PL1↑3↑1
4% DHA0.7 DHA ↑1↑5
8% EPA1.5 EPA↑5↑1
8% DHA1.5 DHA↑1↑5
EPA = eicosapentaenoic acid, DHA = docosahexaenoic acid; PL = phospholipid; “↑” denotes significant increase (p < 0.05). * Fold change relative to control conditions.
Table 5. Comparison of EPA:DHA mixtures on cell viability in human BC cell lines.
CitationCell LineConcentration of EPA or DHA (µM)Ratio EPA:DHAAssayChange in Cell Viability *Exposure (Hours)Form of n-3 LCPUFA
Schley, Jijon, Robinson and Field [29]MDA-MB-23160 EPA + 40 DHA1.5:1TBE↓40%72Dissolved in ethanol
45 EPA + 30 DHA + 75 LA↓31%
Schley, Brindley and Field [13]MDA-MB-23160 EPA + 40 DHA1.5:1TBE↓62%72Dissolved in ethanol
45 EPA + 30 DHA + 75 LA↓48%
Mansara, Deshpande, Vaidya and Kaul-Ghanekar [32]MDA-MB-23184–153 EPA + 56–102 DHA + 25–140 AA1.5:1TBE↓54%–↓82%24Conjugated to delipidated, endotoxin free BSA
MTT↓15%–↓30%
MCF-784–153 EPA + 56–102 DHA + 25–140 AA1.5:1TBE↓38%–↓81%24Conjugated to delipidated, endotoxin free BSA
MTT↓20%–↓30%
EPA = eicosapentaenoic acid, DHA = docosahexaenoic acid; AA = arachidonic acid; TBE = Trypan Blue Exclusion; MTT = 3-(4,5-dimethylthiazol-2-yl)-2,5-diphenyltetrazolium bromide; “↓” denotes significant decrease (p < 0.05); “%” = percent change from control condition; BSA = bovine serum albumin.; * Relative to control conditions.
Table 6. Comparison of EPA and DHA on cell growth & viability in human BC cell lines.
CitationCell LineConcentration of EPA or DHA (µM) AssayChange in Cell Viability *Exposure (Hours)Form of n-3 LCPUFAConclusion on Relative Efficacy
Schley, Jijon, Robinson and Field [29]MDA-MB-231100 EPATBE↓42%72Dissolved in ethanolDHA > EPA
75 EPA + 75 LA↓30%
100 DHA↓65%
75 DHA + 75 LA↓58%
Lee, Yun, Koo, Sung, Shim, Ye, Hong and Kim [25]MDA-MB-2315, 10, 30, & 50 EPAMTS↓15%–↓20%24Dissolved in ethanolDHA > EPA
5, 10, 30, & 50 DHA↓20%–↓45%
Corsetto, Montorfano, Zava, Jovenitti, Cremona, Berra and Rizzo [24]MDA-MB-23150–300 EPAMTTNS Δ–↓88%72Dissolved in ethanolDHA > EPA (200–260 μM) & EPA > DHA (>260 μM)
50–300 DHANS Δ–↓75%
MCF-750–300 EPAMTTNS Δ–↓75%72Dissolved in ethanolDHA > EPA
50–300 DHANS Δ–↓75%
Cao, Ma, Rasenick, Yeh and Yu [23]MCF-730, 60, 90, 140 EPAMTT↓2%–↓45%72Dissolved in ethanolDHA = EPA with exception of DHA > EPA (at 90 μM) ●
30, 60, 90, 140 DHA↓2%–↓45%
Ewaschuk, Newell and Field [30]MDA-MB-23150, 100 EPAWST-1↓5%–↓100%72Conjugated to BSADHA > EPA (<95 μM) & EPA > DHA (>95 μM) ●
50, 100, 150, 200 DHA↓45%–↓90%
MCF-750, 100 EPAWST-1↓25%–↓100%72Conjugated to BSADHA > EPA (<95 μM) & EPA > DHA (>95 μM) ●
50, 100, 150 DHA↓40%–↓100%
SK-BR-350, 100, 150 EPAWST-1↓5%–100%72Conjugated to BSADHA > EPA ●
50, 100 DHA↓80%–↓100%
Rahman, Veigas, Williams and Fernandes [31]MDA-MB-23150, 100 EPAMTSNS Δ–↓58%48No information givenDHA > EPA
50, 100 DHA↓26%–↓74%
Mansara, Deshpande, Vaidya and Kaul-Ghanekar [32]MDA-MB-23140–320 EPAMTTNS Δ24Conjugated to delipidated, endotoxin free BSADHA = EPA (<280 μM) & DHA > EPA (≥280 μM)
40–320 DHANS Δ–↓25%
MCF-740–320 EPAMTTNS Δ–↓20%24Conjugated to delipidated, endotoxin free BSADHA = EPA (<200 μM), DHA > EPA (≥200 μM)
40–320 DHANS Δ–↓22%
Rose and Connolly [33]MDA-MB-2311.7–8.3 EPA[3H] Inc.NS Δ–↓29%144Dissolved in ethanolDHA > EPA
1.5–7.6 DHANS Δ–↓64%
Barascu, Besson, Le Floch, Bougnoux and Jourdan [12]MDA-MB-23110–100 EPAMTTNS Δ–↓75%96Dissolved in ethanolDHA > EPA
10–100 DHANS Δ–↓85%
Kang, Wang, Yamabe, Fukui, Jay and Zhu [34]MDA-MB-23112.5–200 EPAMTT↓0%–↓17%72Dissolved in ethanolDHA = EPA (<50 μM) & DHA > EPA (>50 μM) ●
12.5–200 DHA↓0%–↓87%
MCF-76.25–200 EPAMTT↑5%–↓95%72Dissolved in ethanolDHA > EPA ●
6.25–200 DHA↓5%–↓95%
MDA-MB-435s12.5–200 EPAMTT↓0%–↓50%72Dissolved in ethanolDHA = EPA (<50 μM) & DHA > EPA (>50 μM) ●
12.5–200 DHA↓0%–↓87%
Xue, Wang, Zhao, Dong, Ge, Hou, Liu and Zheng [35]MCF-725, 50, 100 EPAMTT↓15%, ↓25%, ↓40%72No information givenDHA > EPA
25, 50, 100 DHA↓20%, ↓33%, ↓48%
4T125, 50, 100 EPAMTT↓20%, ↓35%, ↓55%72No information givenDHA > EPA
25, 50, 100 DHA↓25%, ↓45%, ↓83%
Yu [11]MDA-MB-231150 EPA + 40 OA + 40 LATBE↓40%48Conjugated to BSADHA = EPA
150 DHA + 40 OA + 40 LA ↓50%
MCF-7150 EPA + 40 OA + 40 LATBE↓45%48Conjugated to BSADHA > EPA
150 DHA + 40 OA + 40 LA↓58%
Das [36]ZR-75-166 EPATBE↓10%72Dissolved in ethanolEPA > DHA
61 DHANS Δ
Chamras, Ardashian, Heber and Glaspy [37]MCF-7100 EPACell count↓30%120No information givenDHA > EPA ●
100 DHA↓50%
MCF-71, 10, 100 EPAColony Formation↓18%, ↓35%, ↓75%2 weeksNo information givenDHA > EPA
1, 10, 100 DHA↓30%, ↓38%, ↓82%
Yun, et al. [49]MDA-MB-2311–50 EPAMTTNS–↓55%24No information givenDHA > EPA
1–50 DHANS–↓80%
MDA-MB-23125 EPAMTT↓25%36No information givenDHA > EPA ●
25 DHA↓60%
T47D1–50 EPAMTTNS–↓20%24No information givenDHA > EPA
1–50 DHANS–↓30%
EPA = eicosapentaenoic acid; DHA = docosahexaenoic acid; OA = oleic acid; LA = linoleic acid; TBE = Trypan Blue Exclusion; MTT = 3-(4,5-dimethylthiazol-2-yl)-2,5-diphenyltetrazolium bromide; MTS = (3-(4,5-dimethylthiazol-2-yl)-5-(3-carboxymethoxyphenyl)-2-(4-sulfophenyl)-2H-tetrazolium); [3H] Inc. = Thymidine Incorporation; WST-1 = Water-soluble Tetrazolium salt; PL = phospholipid; “↑” denotes significant increase (p < 0.05); “↓” denotes significant decrease (p < 0.05); NS Δ = no significant change; “●” = statistical significance was not assessed; “%” = percent change from control condition; BSA = bovine serum albumin; * Relative to control conditions.
Table 7. Change in total amounts of EGFR and pEGFR in whole cell lipids and lipid rafts with EPA:DHA mixtures in human BC cell lines.
CitationCell LineConcentration of EPA or DHA (µM)Exposure (Hours)Change in EGFR *
Schley, Brindley and Field [13]MDA-MB-23160 EPA + 40 DHA72NS Δ in whole cell EGFR **
↑50% whole cell pEGFR
↓lipid raft EGFR **
45 EPA + 30 DHA + 75 LANS Δ in whole cell EGFR **
↑21% whole cell pEGFR
↓lipid raft EGFR **
EPA = eicosapentaenoic acid; DHA = docosahexaenoic acid; LA = linoleic acid; EGFR = epidermal growth factor receptor; pEGFR = phosphorylated EGFR; NS Δ = no significant change; “↑” denotes significant increase (p < 0.05); “↓” denotes significant decrease (p < 0.05); “%” = percent change from control condition; * Relative to control conditions; ** Researchers did not quantify percent change in bands from control condition in Western Blot Analysis.
Table 8. Comparison of DHA and EPA on total amounts of EGFR and pEGFR in whole cell lipids and lipid rafts in human BC cell lines.
CitationCell LineConcentration of EPA or DHA (µM)Exposure (Hours)Change in EGFR *
Cao, Ma, Rasenick, Yeh and Yu [23]MCF-790 EPA24NS Δ in whole cell pEGFR:EGFR
90 DHANS Δ in whole cell pEGFR:EGFR
Corsetto, Montorfano, Zava, Jovenitti, Cremona, Berra and Rizzo [24]MDA-MB-231230 EPA72NS Δ in whole cell EGFR; ↓10% whole cell pEGFR
230 EPA + 0.01 EGFNS Δ in whole cell EGFR; ↓52% whole cell pEGFR
200 DHA↓20% whole cell EGFR; ↓100% whole cell pEGFR
200 DHA + 0.01 EGFNS Δ in whole cell EGFR; ↓100% whole cell pEGFR
Lee, Yun, Koo, Sung, Shim, Ye, Hong and Kim [25]MDA-MB-23130, 50 EPA24NS Δ in whole cell EGFR ●
30, 50 DHA↓whole cell EGFR ●
EPA = eicosapentaenoic acid, DHA = docosahexaenoic acid; EGF = epidermal growth factor; EGFR = epidermal growth factor receptor; pEGFR = phosphorylated EGFR; NS Δ = no significant change; “↓” denotes significant decrease (p < 0.05); “●” = statistical significance was not assessed; “%” = percent change from control condition; * Relative to control conditions.
Table 9. Change in apoptotic markers with EPA:DHA mixtures in human BC cells.
CitationCell LineConcentration of EPA or DHA (µM)AssayExposure (Hours)Effect on Markers of Apoptosis *
Schley, Jijon, Robinson and Field [29]MDA-MB-23160 EPA + 40 DHACaspase Detection Kit72↑29% activated caspases
45 EPA + 30 DHA + 75 LA↑22% activated caspases
EPA = eicosapentaenoic acid, DHA = docosahexaenoic acid; LA = linoleic acid; “↑” denotes significant increase (p < 0.05); “%” = percent change from control condition; * Relative to control condition.
Table 10. Comparison of EPA and DHA on changes in apoptotic markers in human BC cells.
CitationCell LineConcentration of EPA or DHA (µM)AssayExposure (Hours)Effect on Markers of Apoptosis *
Cao, Ma, Rasenick, Yeh and Yu [23]MCF-790 EPAFlow Cytometry (Annexin V/PI)12↑11% apoptotic cells ●
TUNEL↑11% TUNEL positive cells ●
90 DHAFlow Cytometry (Annexin V/PI)12↑10% apoptotic cells ●
TUNEL↑9% TUNEL positive cells ●
Corsetto, Montorfano, Zava, Jovenitti, Cremona, Berra and Rizzo [24]MDA-MB-231230 EPAWestern Blot72NS Δ in Bcl-2; NS Δ in procaspase 8
200 DHA↓100% Bcl-2; ↓45% procaspase 8
MCF-7230 EPAWestern Blot72↓100% Bcl-2; ↓20% procaspase 8
200 DHANS Δ in Bcl-2; ↓35% procaspase 8
Barascu, Besson, Le Floch, Bougnoux and Jourdan [12]MDA-MB-23110, 30, 50 EPAFlow Cytometry (ssDNA)24↑0.6%; ↑39%; ↑79%
10, 30, 50 DHA↑27%; ↑63%; ↑246%
Chamras, Ardashian, Heber and Glaspy [37]MCF-7100 EPADiff-Quik Stain Set120NS Δ in % apoptotic cells
100 DHANS Δ in % apoptotic cells
EPA = eicosapentaenoic acid; DHA = docosahexaenoic acid; PI = Propidium Iodide; TUNEL = Terminal deoxynucleotidyl transferase (TdT) dUTP Nick-End Labeling; ssDNA = single stranded DNA; NS Δ = no significant change; “↑” denotes significant increase (p < 0.05); “↓” denotes significant decrease (p < 0.05); “●” = statistical significance was not assessed; “%” = percent change from control condition; * Relative to control conditions.
Table 11. Change in Akt and pAkt with EPA:DHA mixtures in human BC cell lines.
CitationCell LineConcentration of EPA or DHA (µM) AssayExposure (Hours)Effect on Akt and pAkt *
Schley, Jijon, Robinson and Field [29]MDA-MB-23160 EPA + 40 DHAWestern Blot72↓47% pAkt
NS Δ in Akt
45 EPA + 30 DHA + 75 LA↓27% pAkt
NS Δ in Akt
EPA = eicosapentaenoic acid; DHA = docosahexaenoic acid; “↓” denotes significant decrease (p < 0.05); NS Δ = no significant change; “%” = percent change from control condition; Akt = protein kinase B; pAkt = phosphorylated Akt; * Relative to control conditions.
Table 12. Comparison of EPA and DHA on Akt and pAkt in human BC cell lines.
CitationCell Line Concentration of EPA or DHA (µM) AssayExposure (Hours)Effect on Akt and pAkt *
Cao, Ma, Rasenick, Yeh and Yu [23]MCF-790 EPAWestern Blot24↓27% pAkt:Akt ●
90 DHA↓33% pAkt:Akt ●
Lee, Yun, Koo, Sung, Shim, Ye, Hong and Kim [25]MDA-MB-23130, 50 EPAWestern Blot **24NS Δ in Akt ●
30, 50 DHA↓Akt ●
EPA = eicosapentaenoic acid, DHA = docosahexaenoic acid; “↓” denotes significant decrease (p < 0.05); “●” = statistical significance was not assessed; NS Δ = no significant change “%” = percent change from control condition; Akt = protein kinase B; pAkt = phosphorylated Akt. * Relative to control conditions. ** Researchers did not quantify percent change in bands from control condition in Western Blot Analysis.

