Characterization of Growth Hormone Resistance in Experimental and Ulcerative Colitis

 ,
,
Abstract
: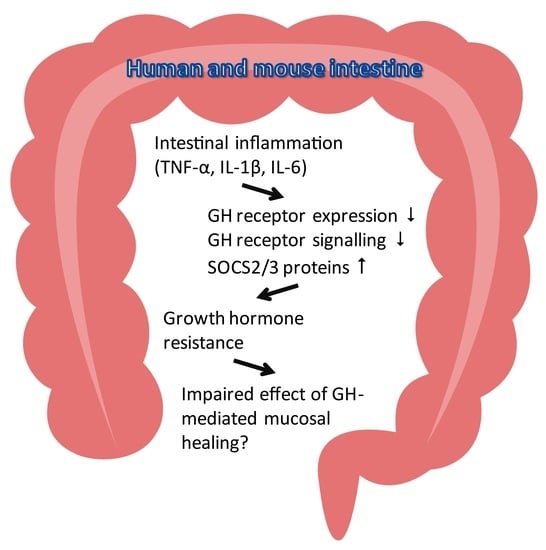
1. Introduction
2. Results
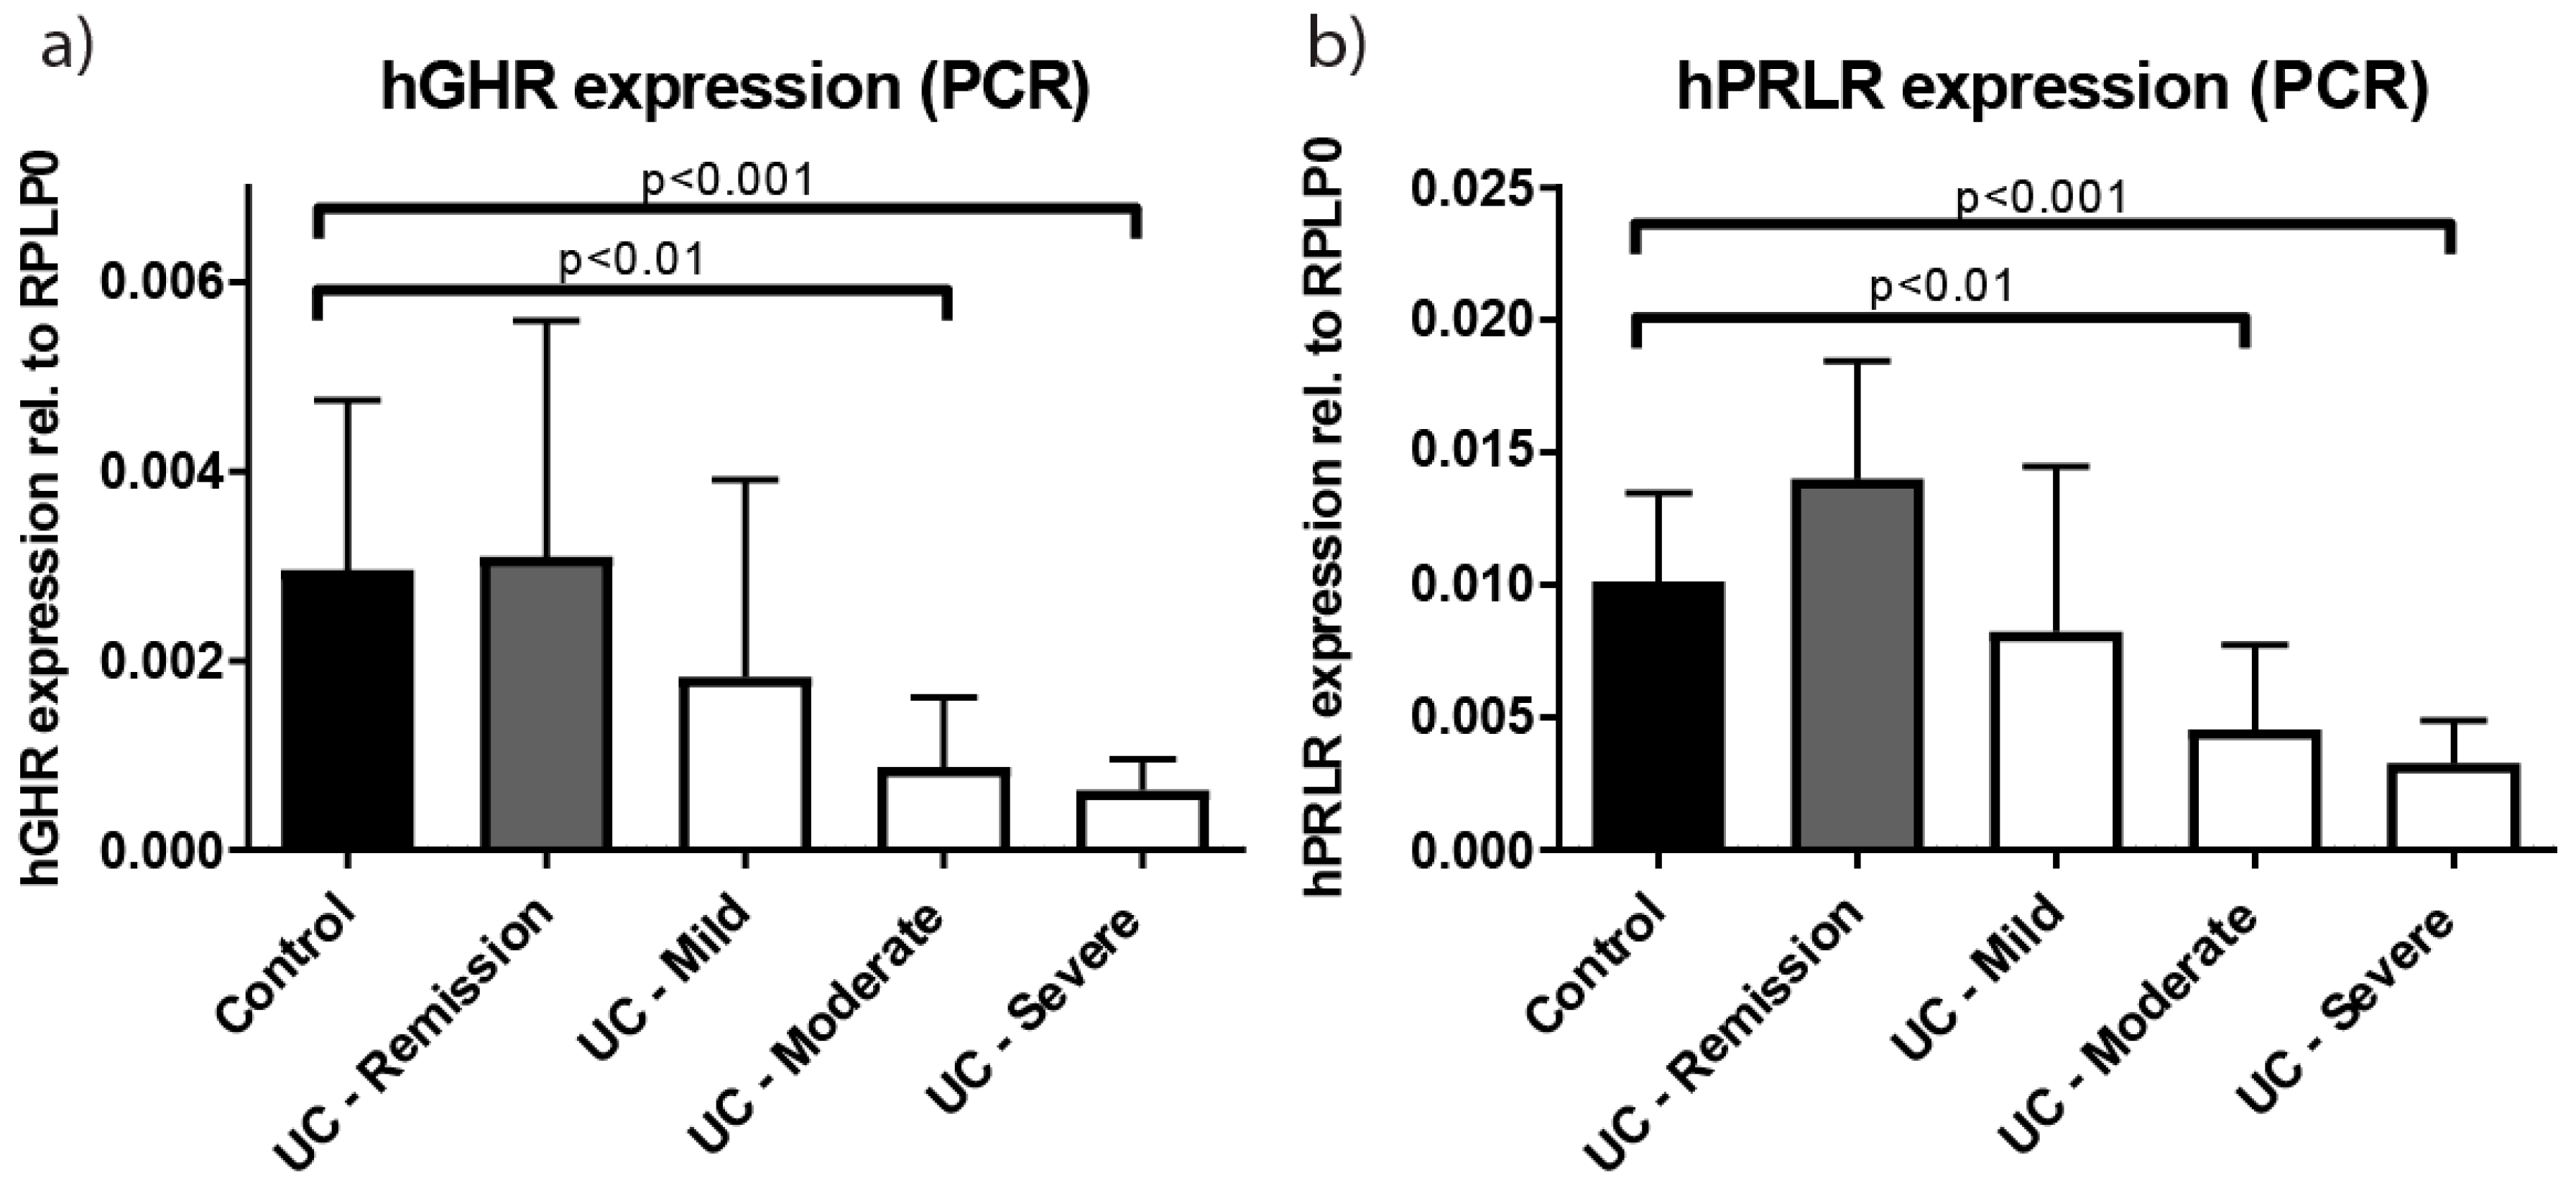
2.1. Growth Hormone Receptor (GHR) Expression Is Reduced in Patients with Active Ulcerative Colitis (UC)
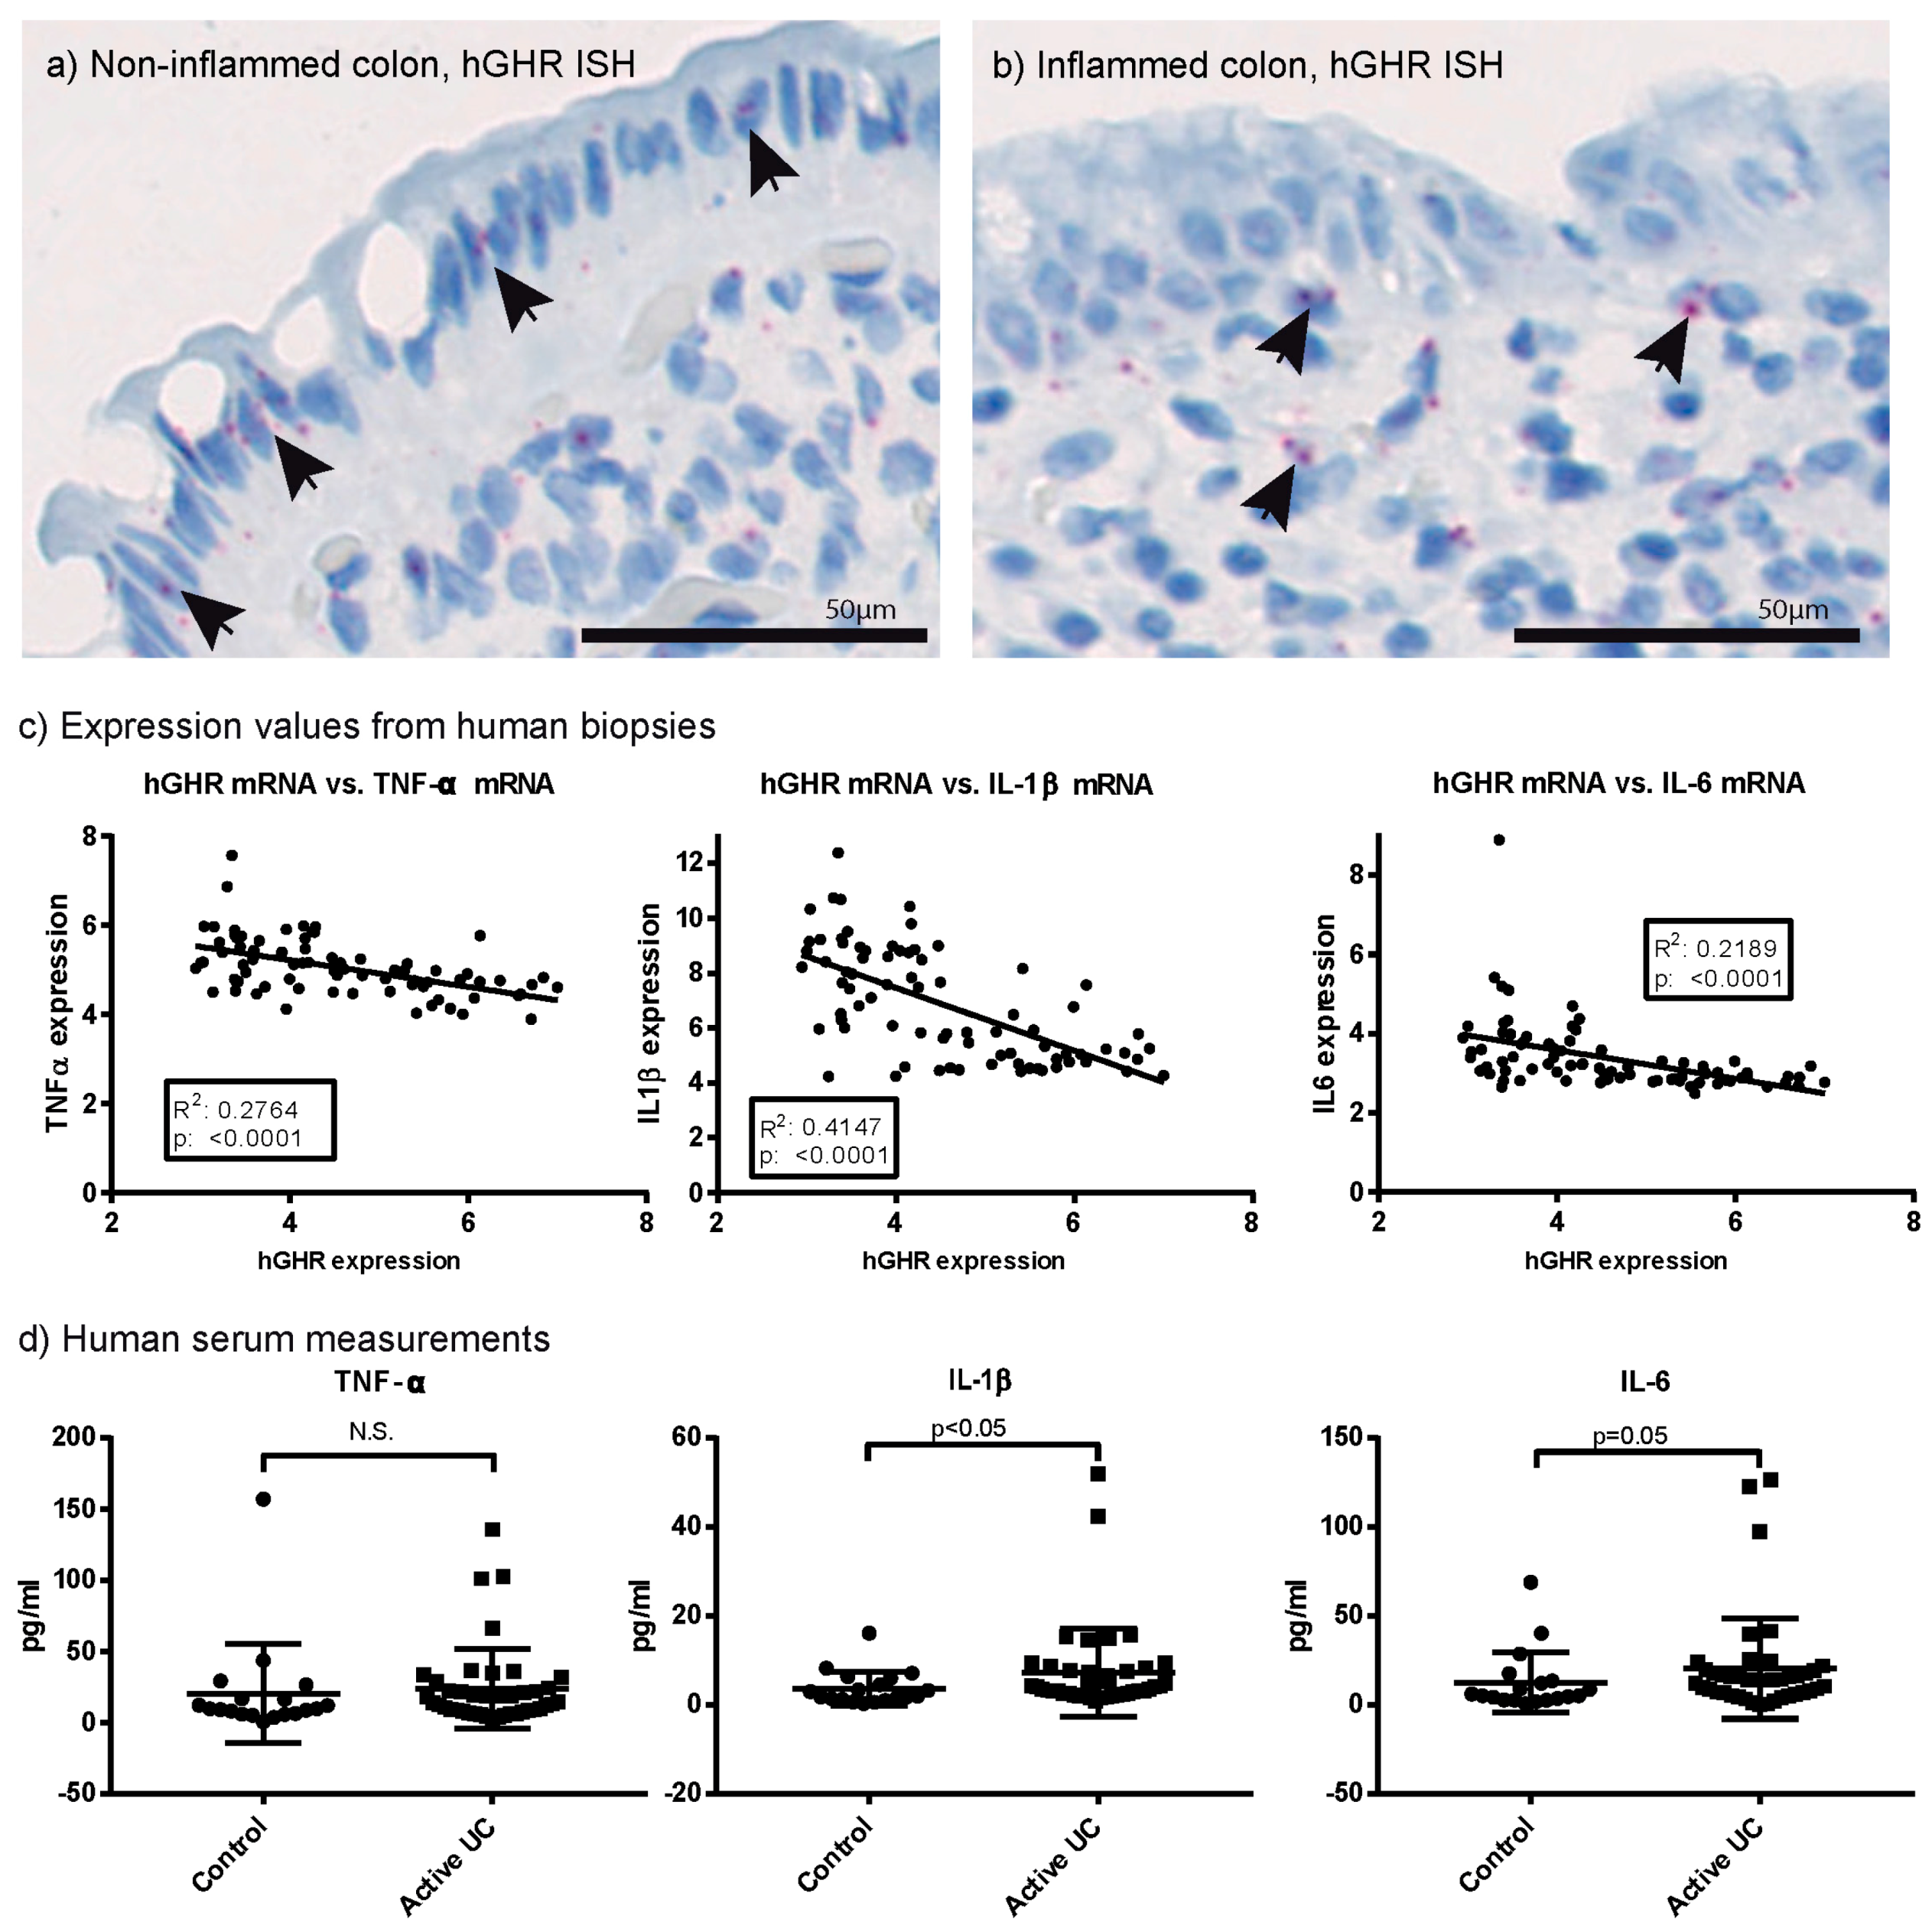
2.2. Systemic and Local Inflammatory Mediators Correlate Inversely with Colonic GHR Expression
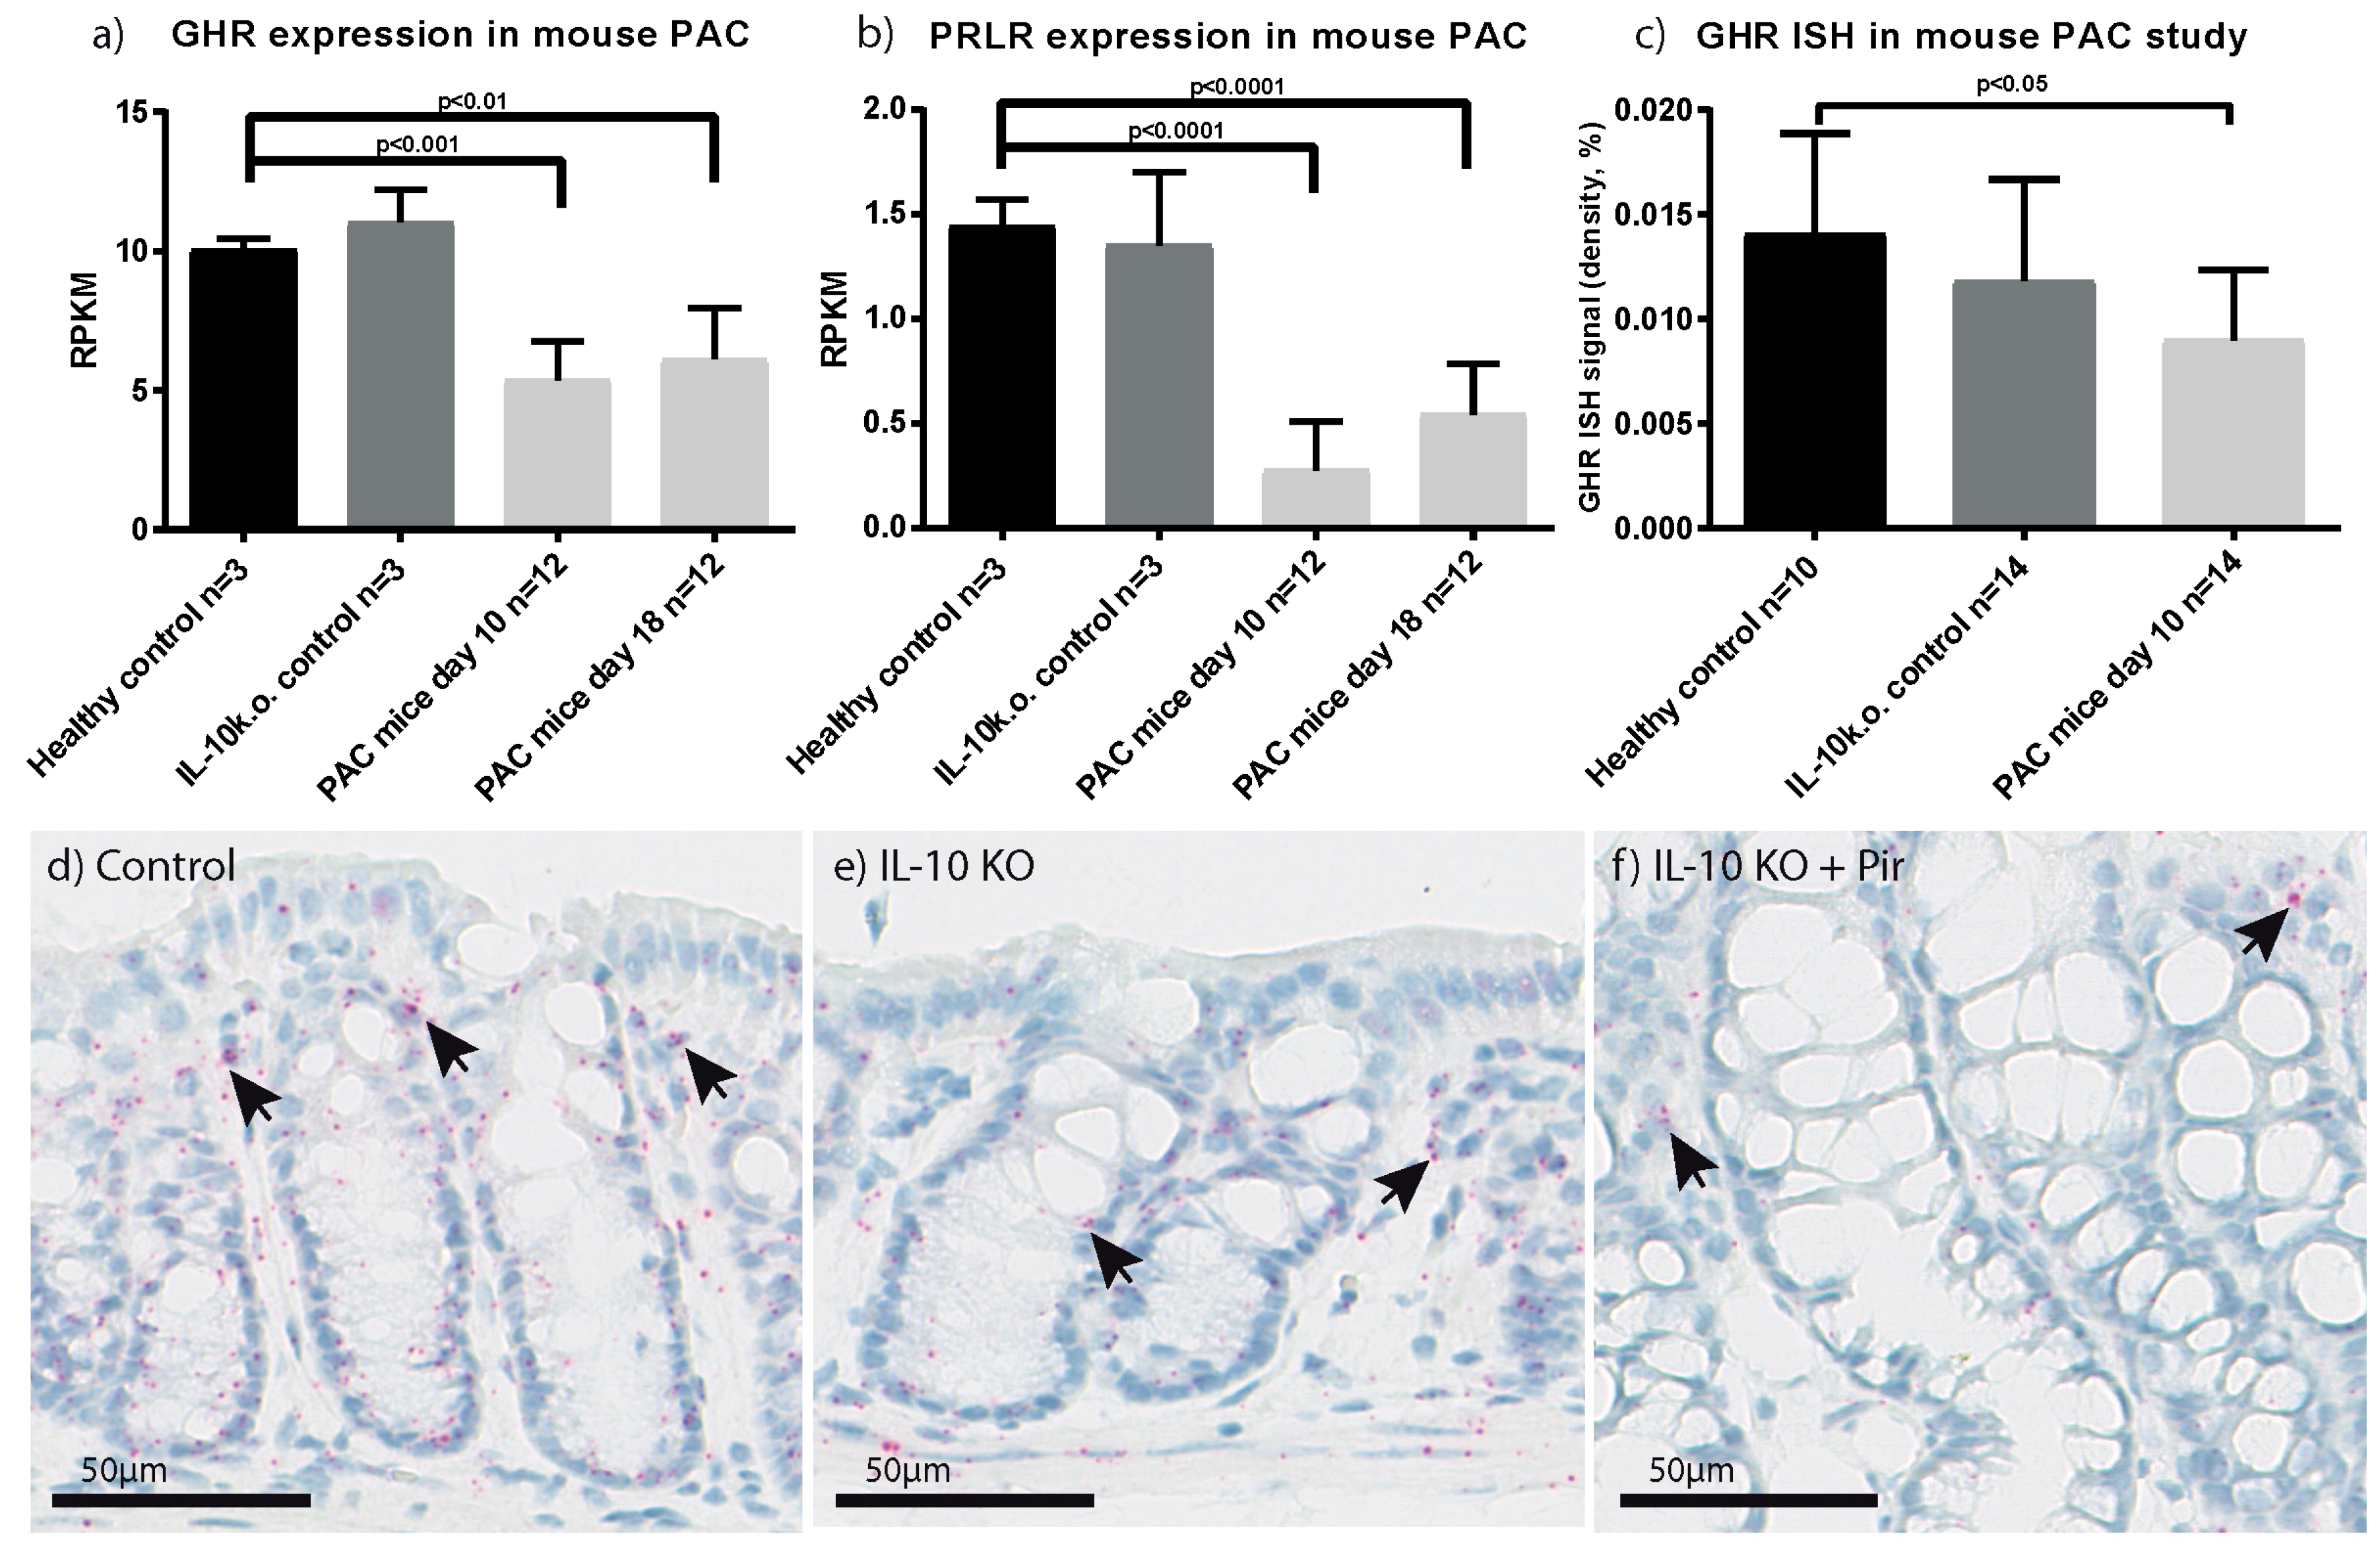
2.3. Characterisation of GHR Expression in Experimental Colitis
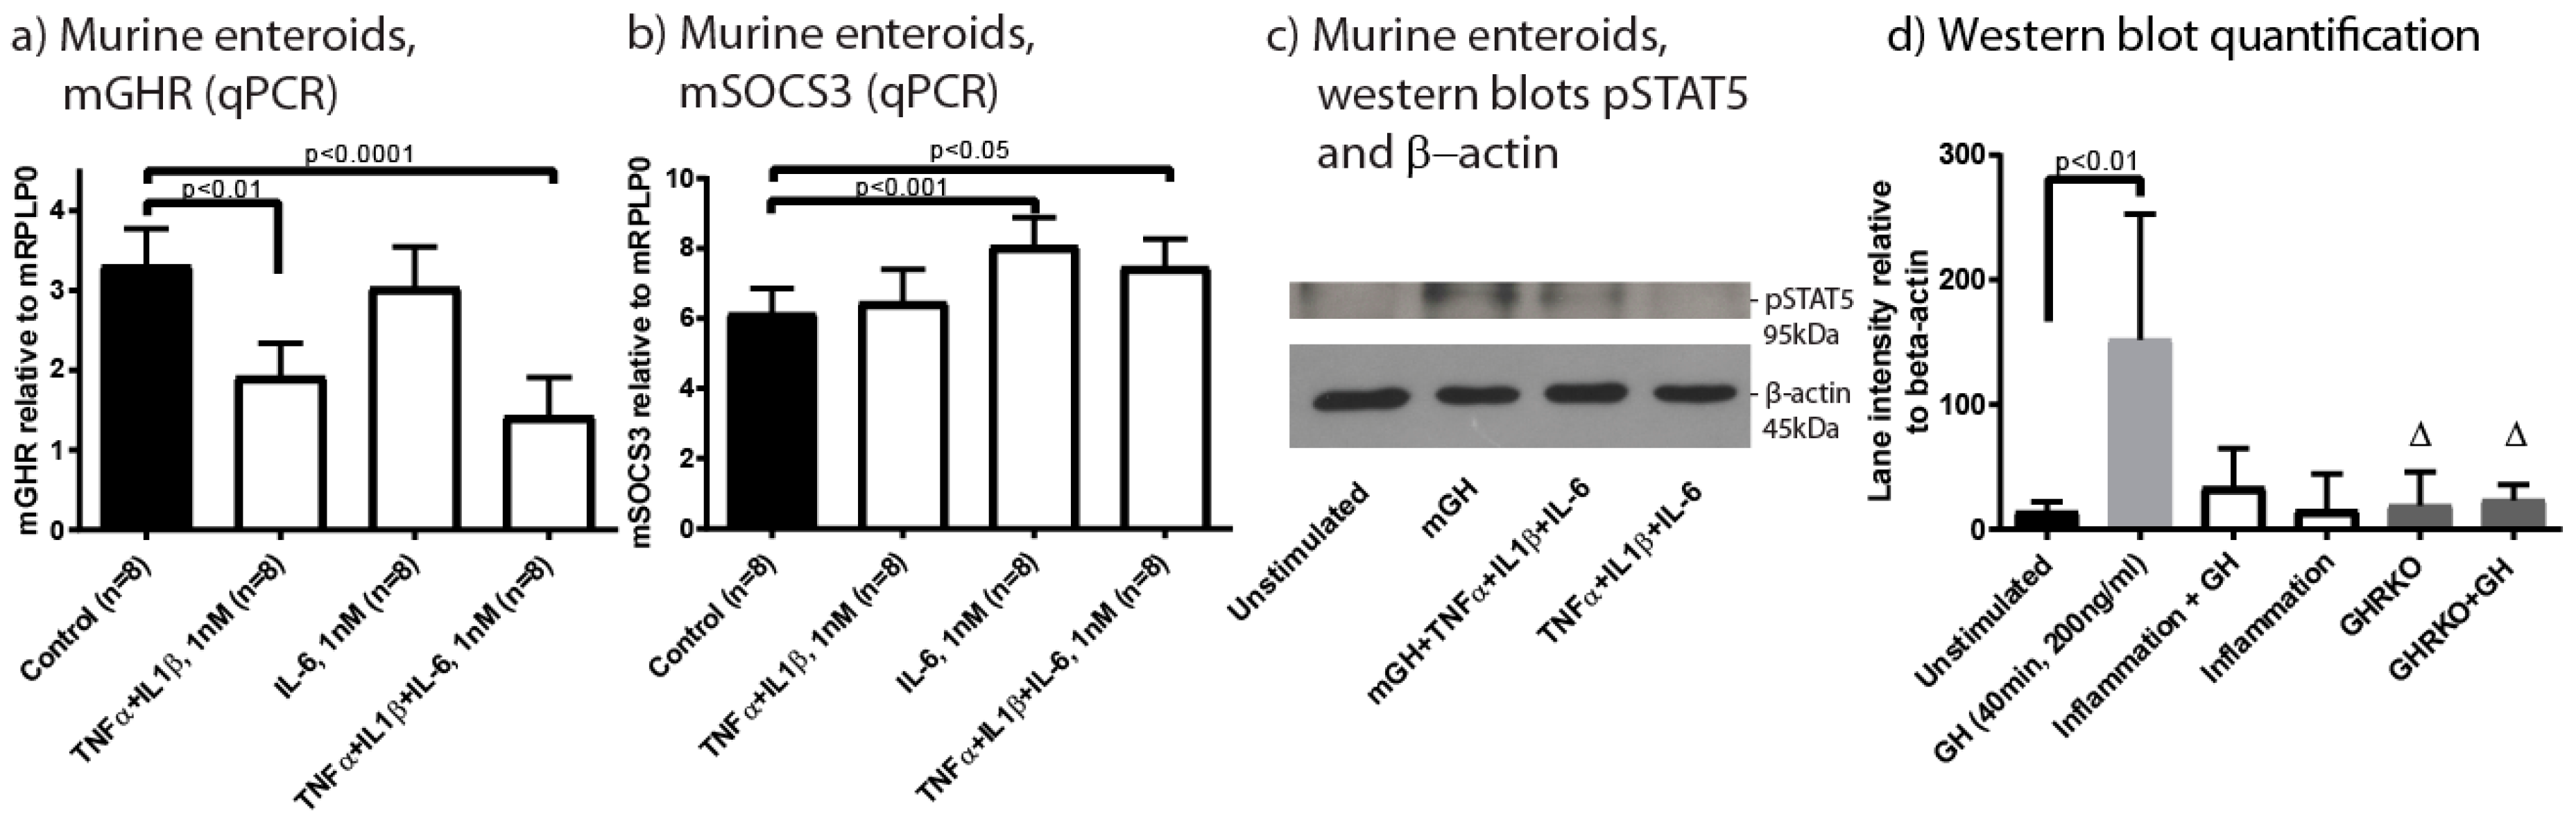
2.4. Inflammation Impacts Epithelial GHR Expression and Signalling
2.5. Gene Expression Signature Similarities between Human UC and Murine Experimental Colitis
2.6. Therapeutic Treatment with High Dose Mouse GH (mGH) in Piroxicam Accelerated Colitis
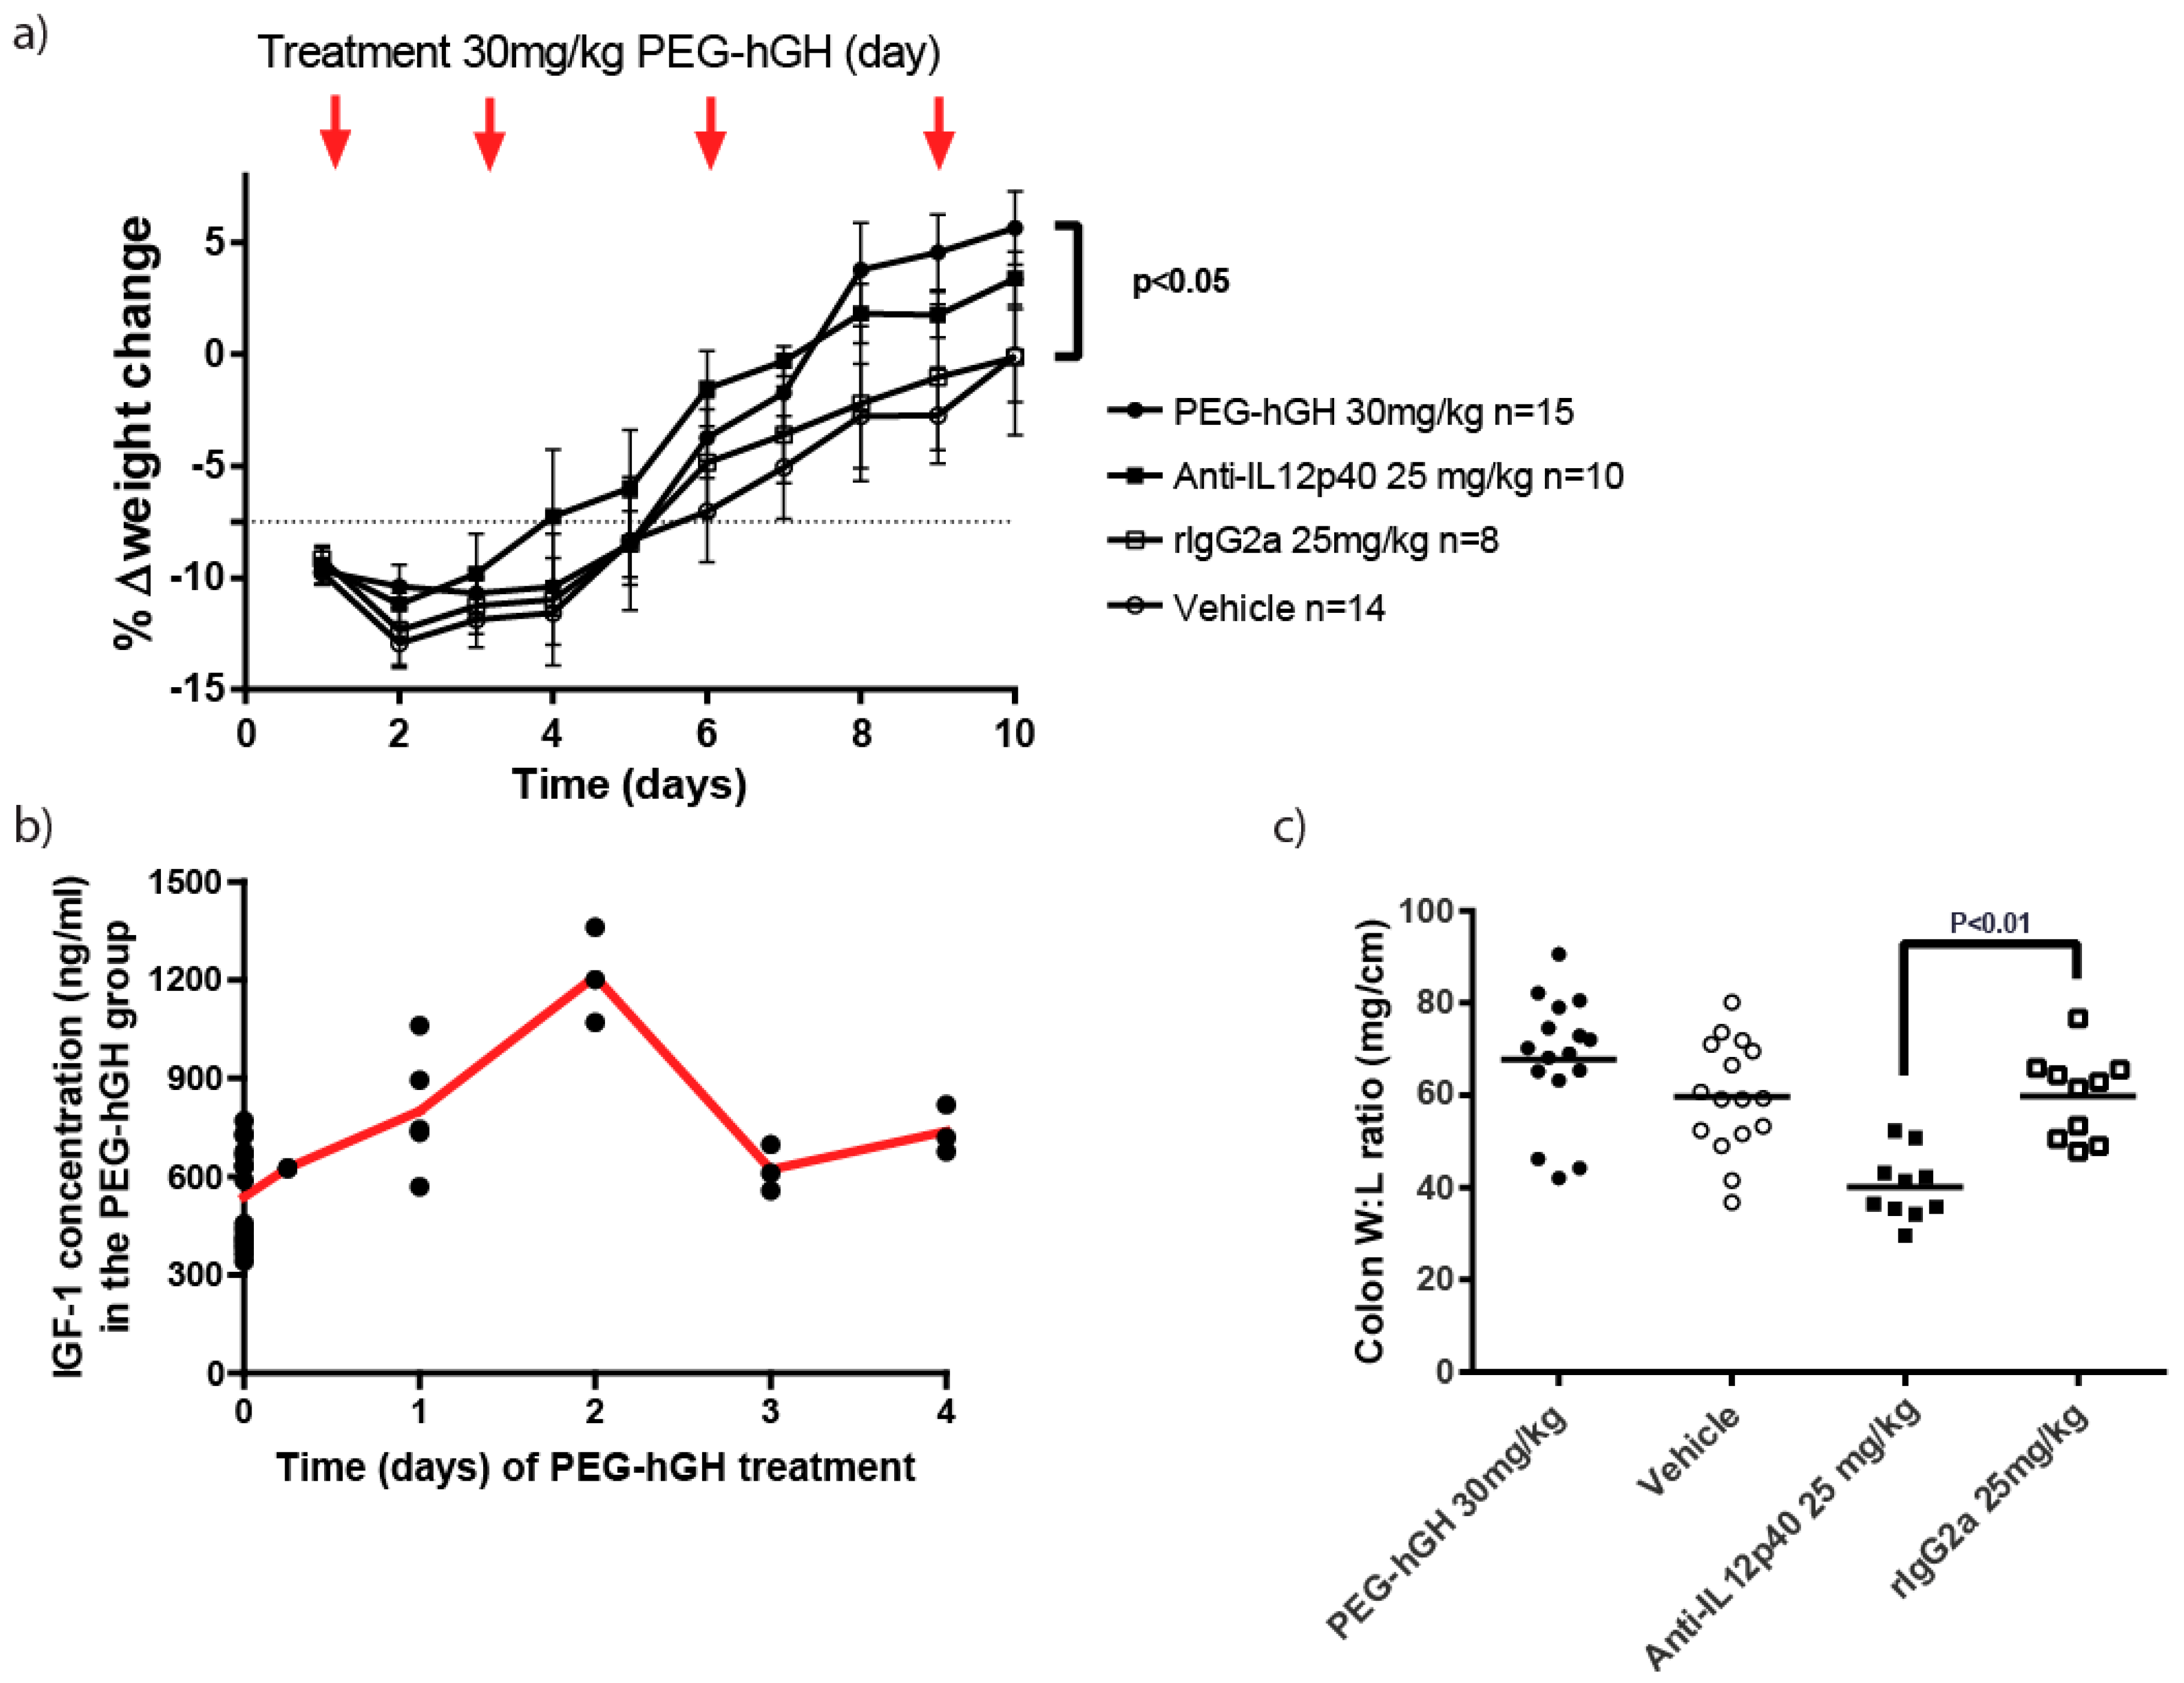
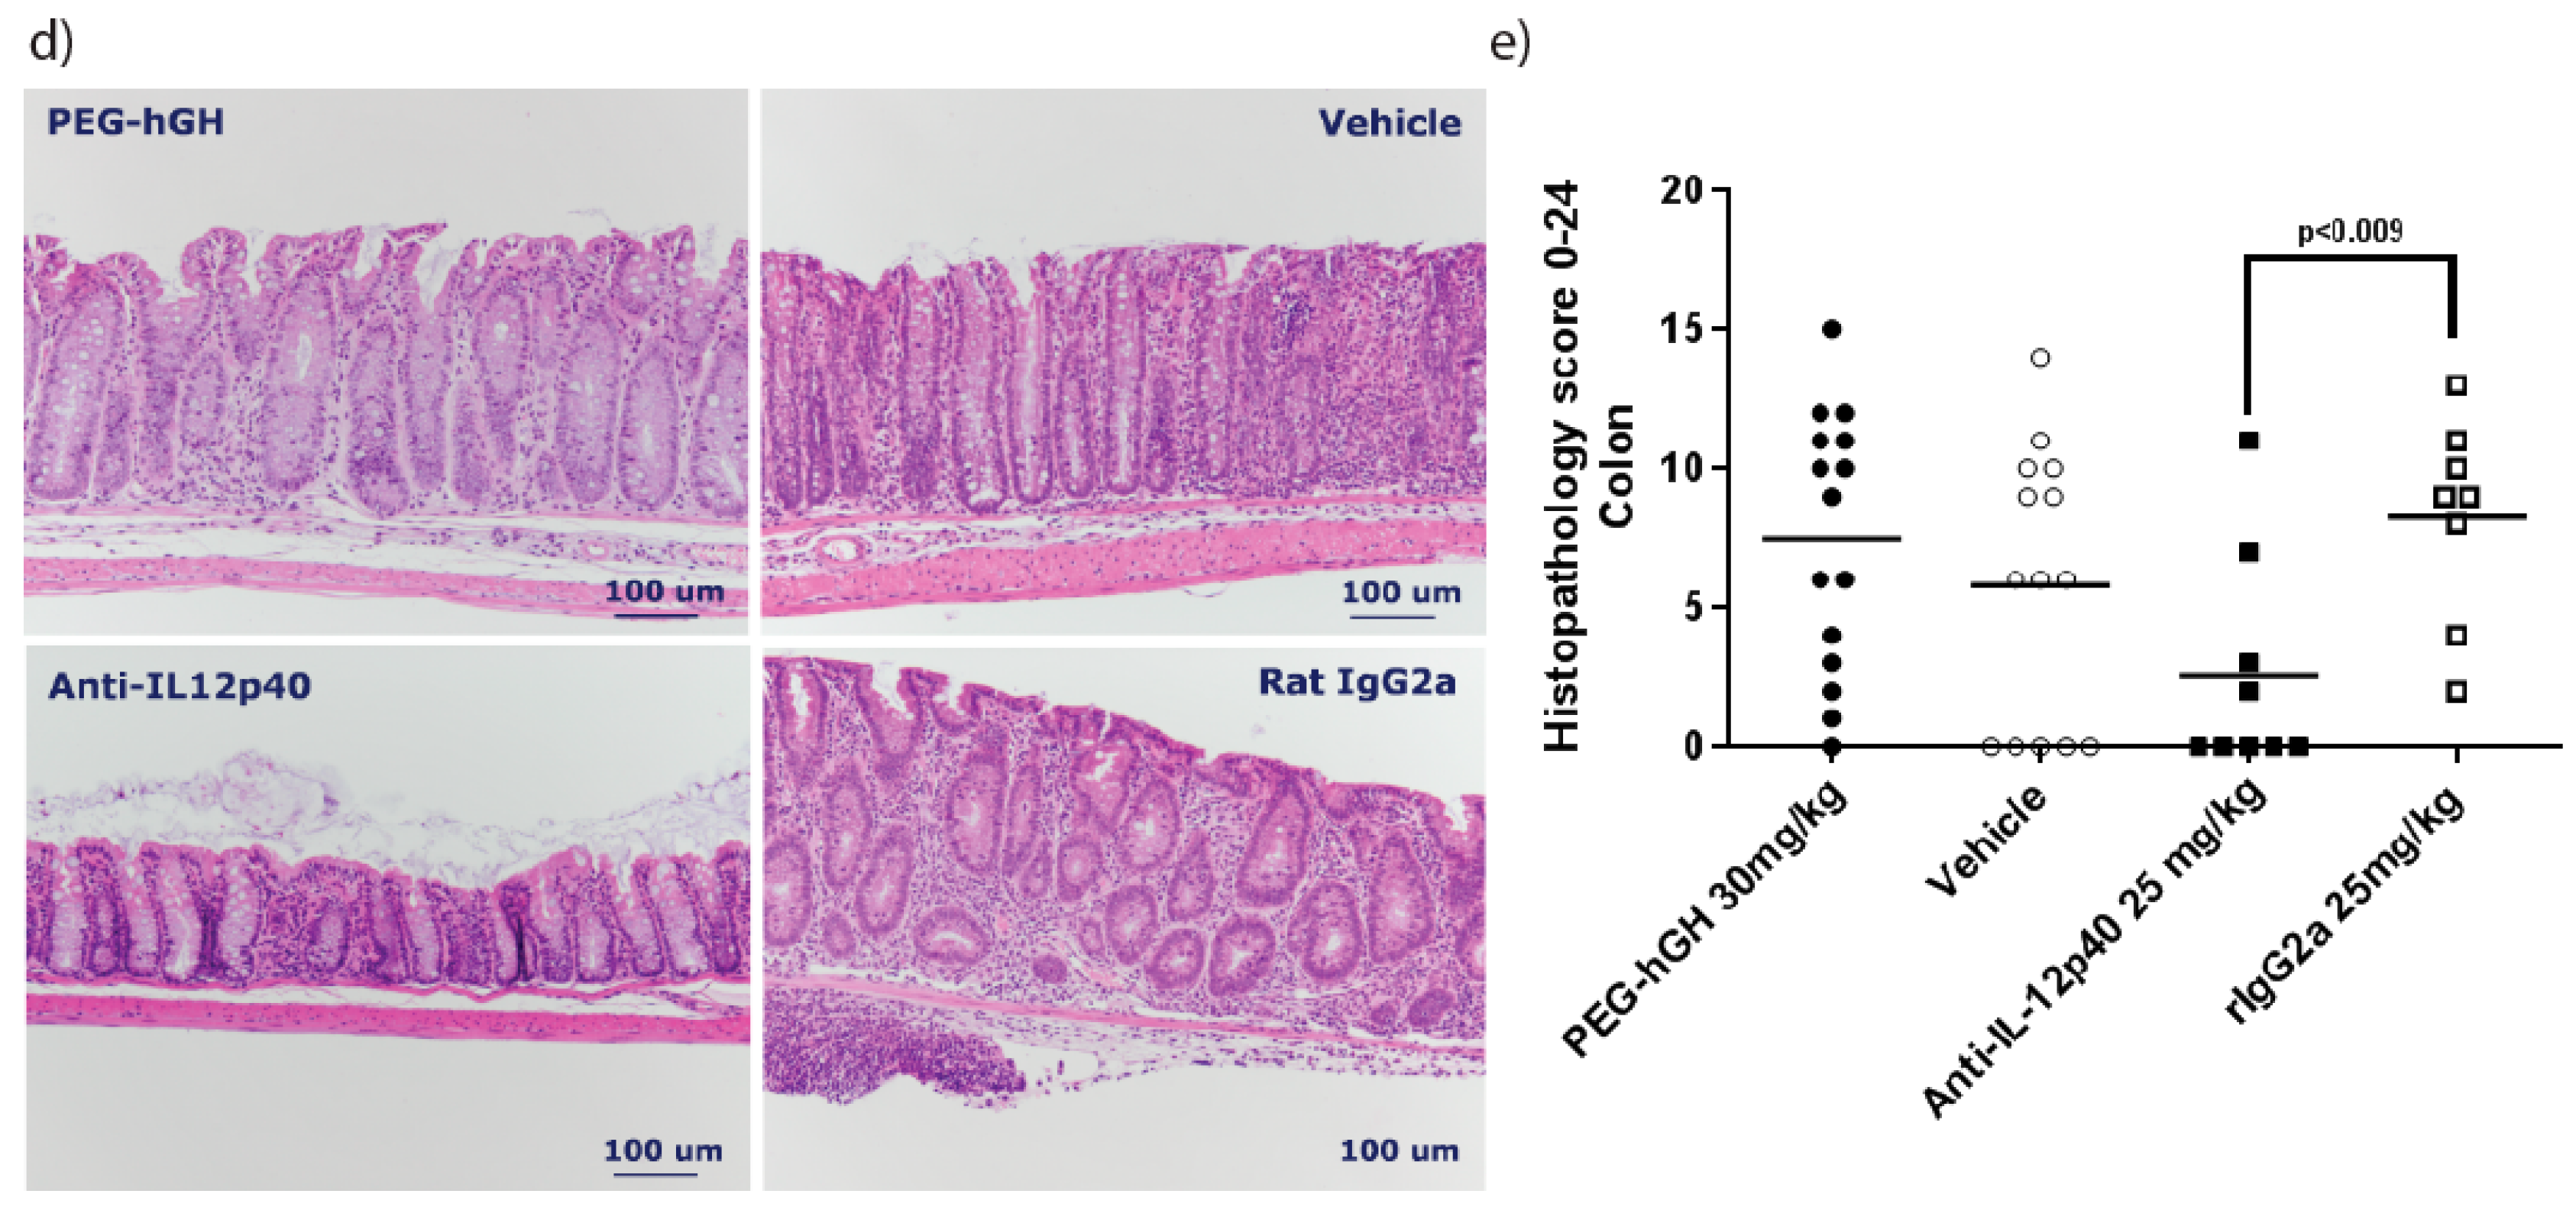
2.7. Therapeutic Treatment with a Long Acting PEG-hGH in Piroxicam Accelerated Colitis
3. Discussion
4. Materials and Methods
4.1. Bioethics
4.2. Patient Material and Ethical Considerations
4.3. Clinical Disease Scoring of IBD Patients
4.4. Animal Studies and Procedures
4.5. Induction of Piroxicam Accelerated Colitis (PAC)
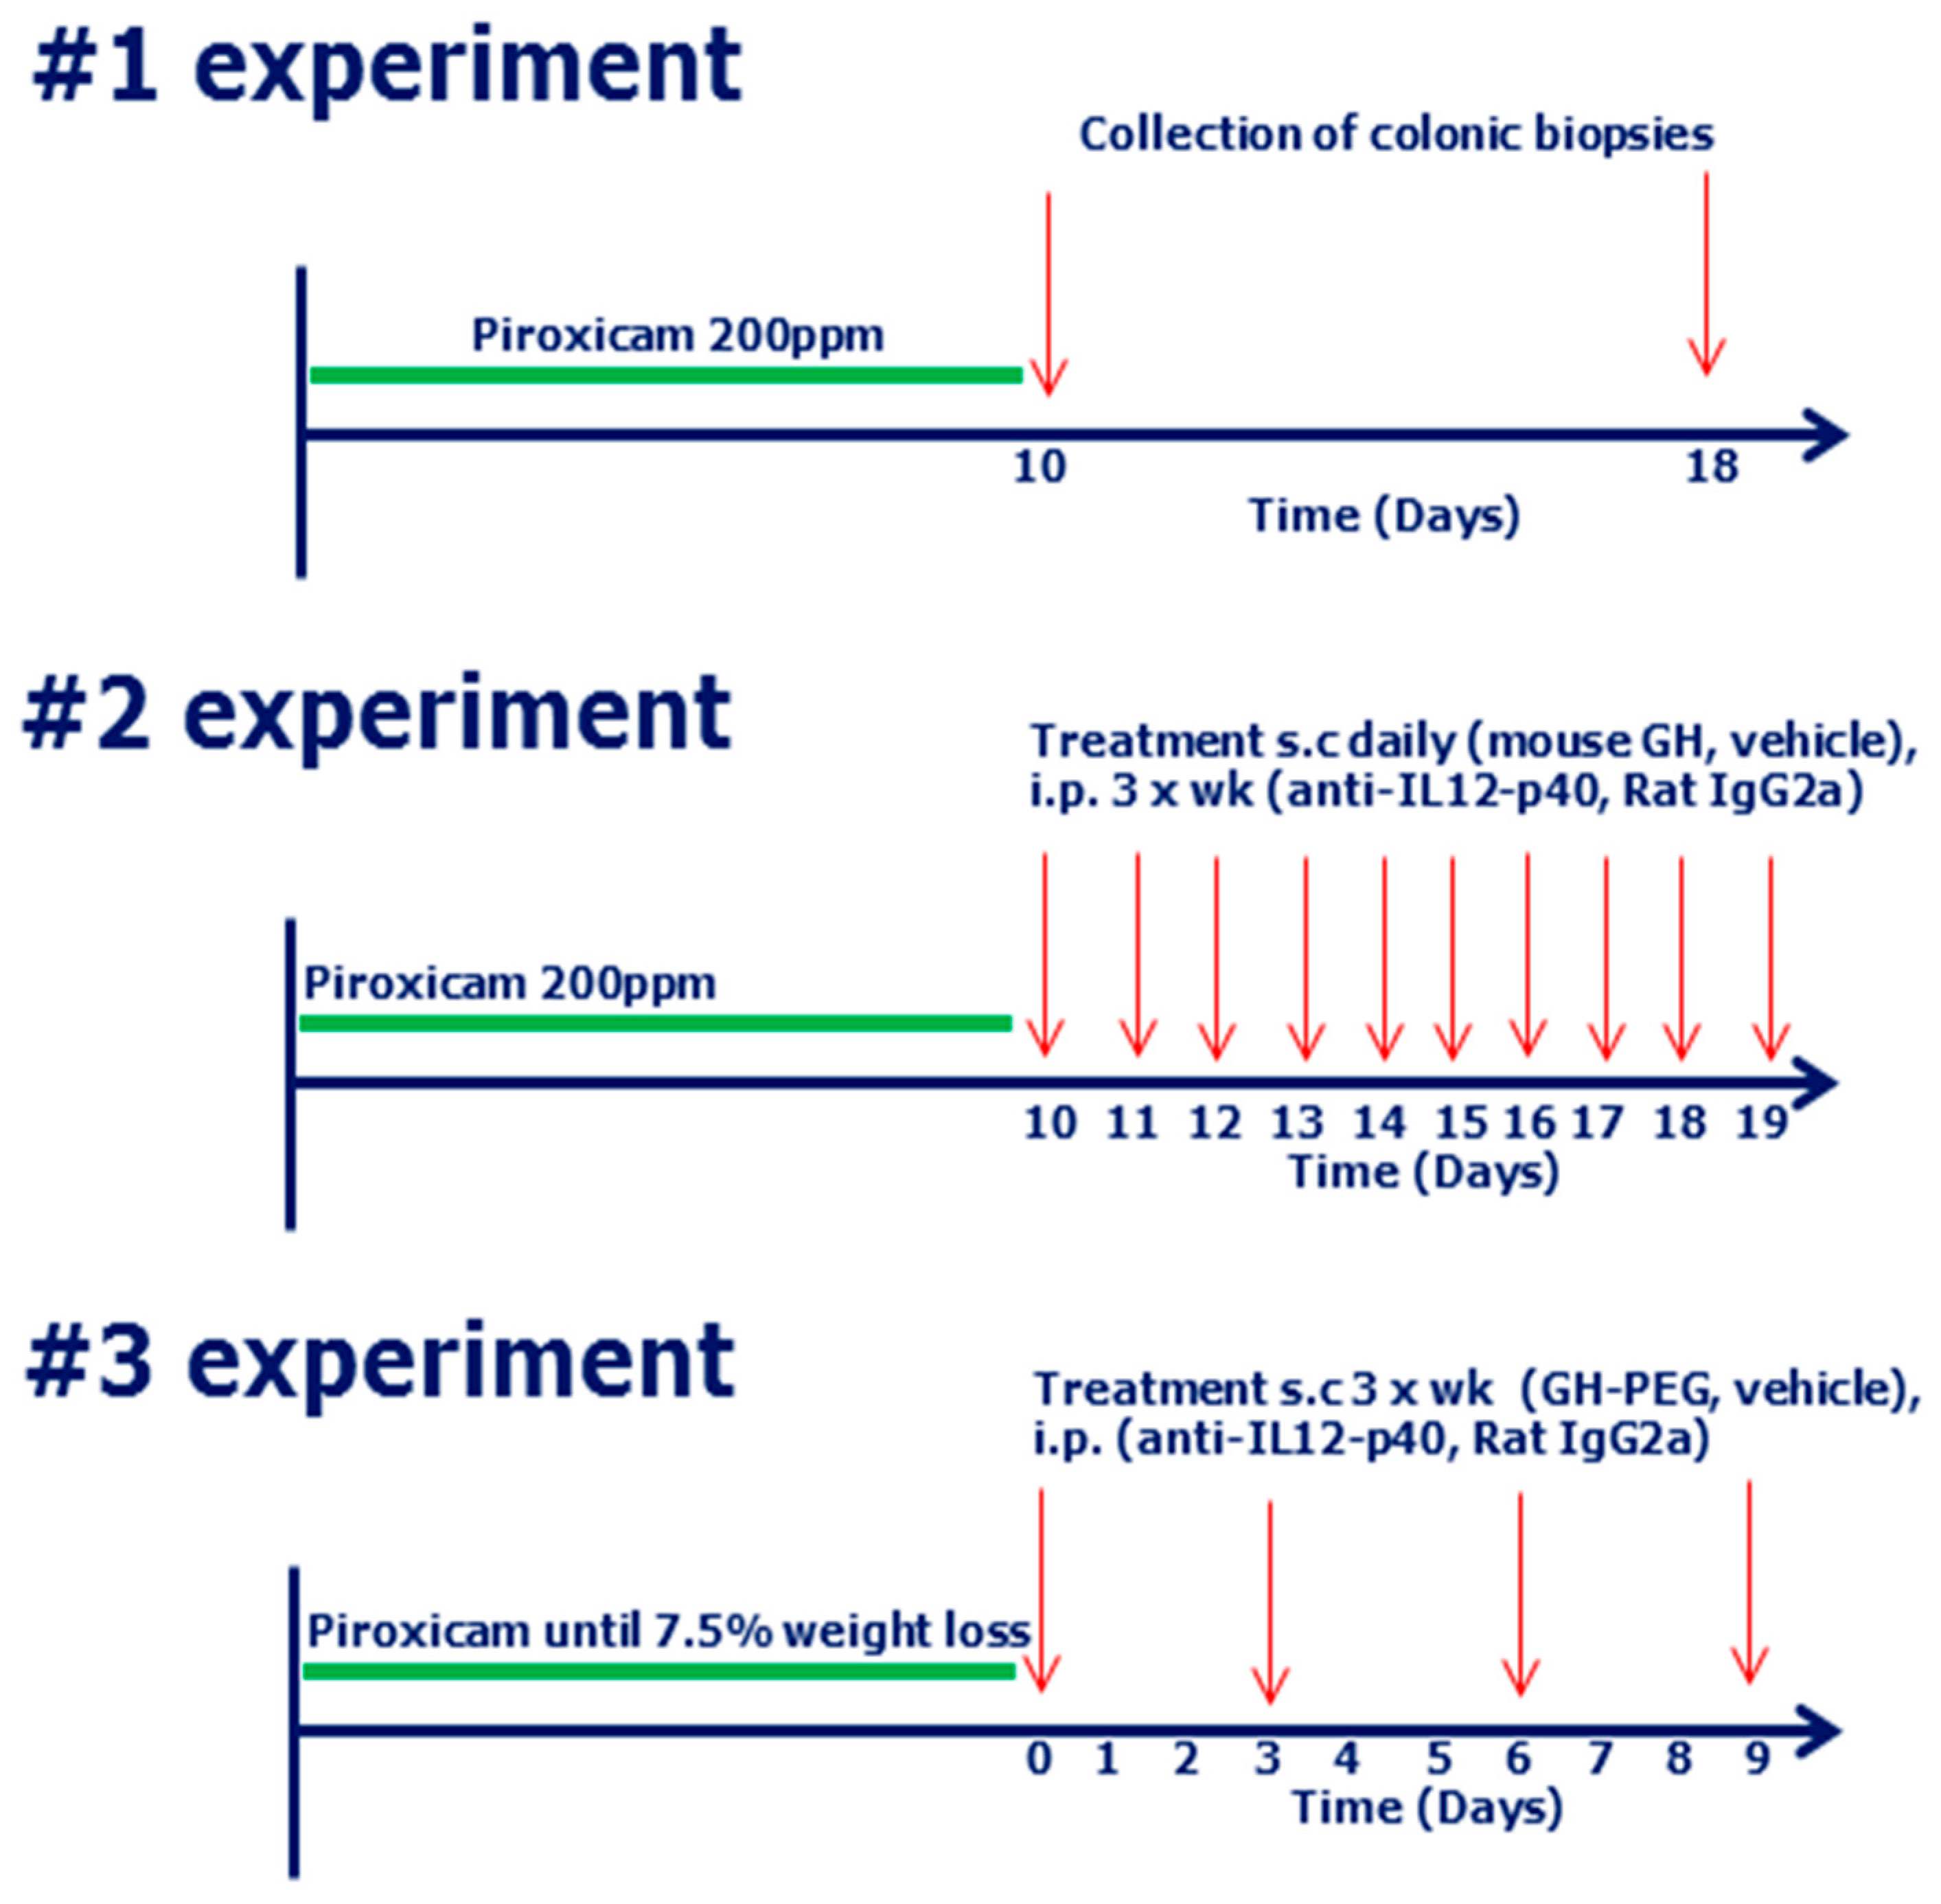
4.6. Study Design
4.7. Monitoring of Disease in Mice
4.8. IGF-1 Measurements in Mice
4.9. Post Mortem Analyses on Mouse Tissue
4.10. Histological Analysis of Tissues
4.11. In Situ Hybridization
4.12. Image Analysis and Quantification of Stains
4.13. RNA Extraction from Human Biopsies, Murine Intestine and Cell Cultures
4.14. mRNA Sequencing Analysis and qPCR (Murine)
4.15. mRNA qPCR and Array Analysis (Human)
4.16. Serum Measurements
4.17. Cell Culture Procedures and Western Blotting
4.18. Statistical Analyses
5. Conclusions
Supplementary Materials
Acknowledgments
Author Contributions
Conflicts of Interest
References
- Misra, M.; Klibanski, A. Endocrine consequences of anorexia nervosa. Lancet Diabetes Endocrinol. 2014, 2, 581–592. [Google Scholar] [CrossRef]
- Fazeli, P.K.; Lawson, E.A.; Prabhakaran, R.; Miller, K.K.; Donoho, D.A.; Clemmons, D.R.; Herzog, D.B.; Misra, M.; Klibanski, A. Effects of recombinant human growth hormone in anorexia nervosa: A randomized, placebo-controlled study. J. Clin. Endocrinol. Metab. 2010, 95, 4889–4897. [Google Scholar] [CrossRef] [PubMed]
- Bereket, A.; Lang, C.H.; Wilson, T.A. Alterations in the growth hormone-insulin-like growth factor axis in insulin dependent diabetes mellitus. Horm. Metab. Res. 1999, 31, 172–181. [Google Scholar] [CrossRef] [PubMed]
- Picardi, A.; Gentilucci, U.V.; Zardi, E.M.; Caccavo, D.; Petitti, T.; Manfrini, S.; Pozzilli, P.; Afeltra, A. TNF-α and growth hormone resistance in patients with chronic liver disease. J. Interferon Cytokine Res. 2003, 23, 229–235. [Google Scholar] [CrossRef] [PubMed]
- Dichtel, L.E.; Corey, K.E.; Misdraji, J.; Bredella, M.A.; Schorr, M.; Osganian, S.A.; Young, B.J.; Sung, J.C.; Miller, K.K. The association between IGF-1 levels and the histologic severity of nonalcoholic fatty liver disease. Clin. Transl. Gastroenterol. 2017, 8, e217. [Google Scholar] [CrossRef] [PubMed]
- Malemud, C.J. Growth hormone, VEGF and FGF: Involvement in rheumatoid arthritis. Clin. Chim. Acta 2007, 375, 10–19. [Google Scholar] [CrossRef] [PubMed]
- Wong, S.C.; Smyth, A.; McNeill, E.; Galloway, P.J.; Hassan, K.; McGrogan, P.; Ahmed, S.F. The growth hormone insulin-like growth factor 1 axis in children and adolescents with inflammatory bowel disease and growth retardation. Clin. Endocrinol. 2010, 73, 220–228. [Google Scholar] [CrossRef] [PubMed]
- Ballinger, A.B.; Azooz, O.; El-Haj, T.; Poole, S.; Farthing, M.J. Growth failure occurs through a decrease in insulin-like growth factor 1 which is independent of undernutrition in a rat model of colitis. Gut 2000, 46, 694–700. [Google Scholar] [CrossRef] [PubMed]
- Ungaro, R.; Mehandru, S.; Allen, P.B.; Peyrin-Biroulet, L.; Colombel, J.F. Ulcerative colitis. Lancet 2017, 389, 1756–1770. [Google Scholar] [CrossRef]
- Baumgart, D.C.; Sandborn, W.J. Crohn’s disease. Lancet 2012, 380, 1590–1605. [Google Scholar] [CrossRef]
- Molodecky, N.A.; Soon, I.S.; Rabi, D.M.; Ghali, W.A.; Ferris, M.; Chernoff, G.; Benchimol, E.I.; Panaccione, R.; Ghosh, S.; Barkema, H.W.; et al. Increasing incidence and prevalence of the inflammatory bowel diseases with time, based on systematic review. Gastroenterology 2012, 142, 46–54. [Google Scholar] [CrossRef] [PubMed]
- Seidelin, J.B.; Coskun, M.; Nielsen, O.H. Mucosal healing in ulcerative colitis: Pathophysiology and pharmacology. Adv. Clin. Chem. 2013, 59, 101–123. [Google Scholar] [PubMed]
- Neurath, M.F.; Travis, S.P. Mucosal healing in inflammatory bowel diseases: A systematic review. Gut 2012, 61, 1619–1635. [Google Scholar] [CrossRef] [PubMed]
- Flores, B.M.; O’Connor, A.; Moss, A.C. Impact of mucosal inflammation on risk of colorectal neoplasia in patients with ulcerative colitis: A systematic review and meta-analysis. Gastrointest. Endosc. 2017. [Google Scholar] [CrossRef] [PubMed]
- Soendergaard, C.; Young, J.A.; Kopchick, J.J. Growth hormone resistance-special focus on inflammatory bowel disease. Int. J. Mol. Sci. 2017, 18, 1019. [Google Scholar] [CrossRef] [PubMed]
- Denson, L.A.; Menon, R.K.; Shaufl, A.; Bajwa, H.S.; Williams, C.R.; Karpen, S.J. TNF-α downregulates murine hepatic growth hormone receptor expression by inhibiting Sp1 and Sp3 binding. J. Clin. Investig. 2001, 107, 1451–1458. [Google Scholar] [CrossRef] [PubMed]
- Yumet, G.; Shumate, M.L.; Bryant, P.; Lin, C.M.; Lang, C.H.; Cooney, R.N. Tumor necrosis factor mediates hepatic growth hormone resistance during sepsis. Am. J. Physiol. Endocrinol. Metab. 2002, 283, E472–E481. [Google Scholar] [CrossRef] [PubMed]
- Wang, P.; Li, N.; Li, J.S.; Li, W.Q. The role of endotoxin, TNF-α, and IL-6 in inducing the state of growth hormone insensitivity. World J. Gastroenterol. 2002, 8, 531–536. [Google Scholar] [CrossRef] [PubMed]
- Zhao, Y.; Xiao, X.; Frank, S.J.; Lin, H.Y.; Xia, Y. Distinct mechanisms of induction of hepatic growth hormone resistance by endogenous IL-6, TNF-α, and IL-1β. Am. J. Physiol. Endocrinol. Metab. 2014, 307, E186–E198. [Google Scholar] [CrossRef] [PubMed]
- Ahmed, T.A.; Buzzelli, M.D.; Lang, C.H.; Capen, J.B.; Shumate, M.L.; Navaratnarajah, M.; Nagarajan, M.; Cooney, R.N. Interleukin-6 inhibits growth hormone-mediated gene expression in hepatocytes. Am. J. Physiol. Gastrointest. Liver Physiol. 2007, 292, G1793–G1803. [Google Scholar] [CrossRef] [PubMed]
- Denson, L.A.; Held, M.A.; Menon, R.K.; Frank, S.J.; Parlow, A.F.; Arnold, D.L. Interleukin-6 inhibits hepatic growth hormone signaling via upregulation of cis and SOCS-3. Am. J. Physiol. Gastrointest. Liver Physiol. 2003, 284, G646–G654. [Google Scholar] [CrossRef] [PubMed]
- Linossi, E.M.; Nicholson, S.E. Kinase inhibition, competitive binding and proteasomal degradation: Resolving the molecular function of the suppressor of cytokine signaling (SOCS) proteins. Immunol. Rev. 2015, 266, 123–133. [Google Scholar] [CrossRef] [PubMed]
- Lobie, P.E.; Breipohl, W.; Waters, M.J. Growth hormone receptor expression in the rat gastrointestinal tract. Endocrinology 1990, 126, 299–306. [Google Scholar] [CrossRef] [PubMed]
- Lincoln, D.T.; Kaiser, H.E.; Raju, G.P.; Waters, M.J. Growth hormone and colorectal carcinoma: Localization of receptors. In Vivo 2000, 14, 41–49. [Google Scholar] [PubMed]
- Gilbert, S.; Zhang, R.; Denson, L.; Moriggl, R.; Steinbrecher, K.; Shroyer, N.; Lin, J.; Han, X. Enterocyte STAT5 promotes mucosal wound healing via suppression of myosin light chain kinase-mediated loss of barrier function and inflammation. EMBO Mol. Med. 2012, 4, 109–124. [Google Scholar] [CrossRef] [PubMed]
- Han, X.; Ren, X.; Jurickova, I.; Groschwitz, K.; Pasternak, B.A.; Xu, H.; Wilson, T.A.; Hogan, S.P.; Denson, L.A. Regulation of intestinal barrier function by signal transducer and activator of transcription 5b. Gut 2009, 58, 49–58. [Google Scholar] [CrossRef] [PubMed]
- Han, X.; Sosnowska, D.; Bonkowski, E.L.; Denson, L.A. Growth hormone inhibits signal transducer and activator of transcription 3 activation and reduces disease activity in murine colitis. Gastroenterology 2005, 129, 185–203. [Google Scholar] [CrossRef] [PubMed]
- Han, X.; Benight, N.; Osuntokun, B.; Loesch, K.; Frank, S.J.; Denson, L.A. Tumour necrosis factor alpha blockade induces an anti-inflammatory growth hormone signalling pathway in experimental colitis. Gut 2007, 56, 73–81. [Google Scholar] [CrossRef] [PubMed]
- Mauras, N.; George, D.; Evans, J.; Milov, D.; Abrams, S.; Rini, A.; Welch, S.; Haymond, M.W. Growth hormone has anabolic effects in glucocorticosteroid-dependent children with inflammatory bowel disease: A pilot study. Metabolism 2002, 51, 127–135. [Google Scholar] [CrossRef] [PubMed]
- Henker, J. Therapy with recombinant growth hormone in children with crohn disease and growth failure. Eur. J. Pediatr. 1996, 155, 1066–1067. [Google Scholar] [CrossRef] [PubMed]
- Heyman, M.B.; Garnett, E.A.; Wojcicki, J.; Gupta, N.; Davis, C.; Cohen, S.A.; Gold, B.D.; Kirschner, B.S.; Baldassano, R.N.; Ferry, G.D.; et al. Growth hormone treatment for growth failure in pediatric patients with Crohn’s disease. J. Pediatr. 2008, 153, 651–658. [Google Scholar] [CrossRef] [PubMed]
- Denson, L.A.; Kim, M.O.; Bezold, R.; Carey, R.; Osuntokun, B.; Nylund, C.; Willson, T.; Bonkowski, E.; Li, D.; Ballard, E.; et al. A randomized controlled trial of growth hormone in active pediatric crohn disease. J. Pediatr. Gastroenterol. Nutr. 2010, 51, 130–139. [Google Scholar] [CrossRef] [PubMed]
- Wong, S.C.; Kumar, P.; Galloway, P.J.; Blair, J.C.; Didi, M.; Dalzell, A.M.; Hassan, K.; McGrogan, P.; Ahmed, S.F. A preliminary trial of the effect of recombinant human growth hormone on short-term linear growth and glucose homeostasis in children with Crohn’s disease. Clin. Endocrinol. 2011, 74, 599–607. [Google Scholar] [CrossRef] [PubMed]
- Slonim, A.E.; Bulone, L.; Damore, M.B.; Goldberg, T.; Wingertzahn, M.A.; McKinley, M.J. A preliminary study of growth hormone therapy for Crohn’s disease. N. Engl. J. Med. 2000, 342, 1633–1637. [Google Scholar] [CrossRef] [PubMed]
- Soendergaard, C.; Nielsen, O.H.; Skak, K.; Ropke, M.A.; Seidelin, J.B.; Kvist, P.H. Objective quantification of immune cell infiltrates and epidermal proliferation in psoriatic skin: A comparison of digital image analysis and manual counting. Appl. Immunohistochem. Mol. Morphol. 2016, 24, 453–458. [Google Scholar] [CrossRef] [PubMed]
- Holgersen, K.; Kvist, P.H.; Hansen, A.K.; Holm, T.L. Predictive validity and immune cell involvement in the pathogenesis of piroxicam-accelerated colitis in interleukin-10 knockout mice. Int. Immunopharmacol. 2014, 21, 137–147. [Google Scholar] [CrossRef] [PubMed]
- Holgersen, K.; Kvist, P.H.; Markholst, H.; Hansen, A.K.; Holm, T.L. Characterisation of enterocolitis in the piroxicam-accelerated interleukin-10 knock out mouse—A model mimicking inflammatory bowel disease. J. Crohns Colitis 2014, 8, 147–160. [Google Scholar] [CrossRef] [PubMed]
- Sanderson, I.R. Growth problems in children with ibd. Nat. Rev. Gastroenterol. Hepatol. 2014, 11, 601–610. [Google Scholar] [CrossRef] [PubMed]
- Hattori, N.; Saito, T.; Yagyu, T.; Jiang, B.H.; Kitagawa, K.; Inagaki, C. Gh, GH receptor, GH secretagogue receptor, and ghrelin expression in human T cells, B cells, and neutrophils. J. Clin. Endocrinol. Metab. 2001, 86, 4284–4291. [Google Scholar] [CrossRef] [PubMed]
- Matsuda, T.; Saito, H.; Inoue, T.; Fukatsu, K.; Han, I.; Furukawa, S.; Ikeda, S.; Muto, T. Growth hormone inhibits apoptosis and up-regulates reactive oxygen intermediates production by human polymorphonuclear neutrophils. J. Parenter. Enter. Nutr. 1998, 22, 368–374. [Google Scholar] [CrossRef] [PubMed]
- Lu, C.; Kumar, P.A.; Sun, J.; Aggarwal, A.; Fan, Y.; Sperling, M.A.; Lumeng, C.N.; Menon, R.K. Targeted deletion of growth hormone (GH) receptor in macrophage reveals novel osteopontin-mediated effects of gh on glucose homeostasis and insulin sensitivity in diet-induced obesity. J. Biol. Chem. 2013, 288, 15725–15735. [Google Scholar] [CrossRef] [PubMed]
- Cui, X.; Shan, X.; Qian, J.; Ji, Q.; Wang, L.; Wang, X.; Li, M.; Ding, H.; Liu, Q.; Chen, L.; et al. The suppressor of cytokine signaling socs1 promotes apoptosis of intestinal epithelial cells via p53 signaling in Crohn’s disease. Exp. Mol. Pathol. 2016, 101, 1–11. [Google Scholar] [CrossRef] [PubMed]
- Suzuki, A.; Hanada, T.; Mitsuyama, K.; Yoshida, T.; Kamizono, S.; Hoshino, T.; Kubo, M.; Yamashita, A.; Okabe, M.; Takeda, K.; et al. CIS3/SOCS3/SSI3 plays a negative regulatory role in STAT3 activation and intestinal inflammation. J. Exp. Med. 2001, 193, 471–481. [Google Scholar] [CrossRef] [PubMed]
- Thomas, A.G.; Holly, J.M.; Taylor, F.; Miller, V. Insulin like growth factor-I, insulin like growth factor binding protein-1, and insulin in childhood Crohn’s disease. Gut 1993, 34, 944–947. [Google Scholar] [CrossRef] [PubMed]
- Katsanos, K.H.; Tsatsoulis, A.; Christodoulou, D.; Challa, A.; Katsaraki, A.; Tsianos, E.V. Reduced serum insulin-like growth factor-1 (IGF-1) and igf-binding protein-3 levels in adults with inflammatory bowel disease. Growth Horm. IGF Res. 2001, 11, 364–367. [Google Scholar] [CrossRef] [PubMed]
- Eivindson, M.; Gronbaek, H.; Flyvbjerg, A.; Frystyk, J.; Zimmermann-Nielsen, E.; Dahlerup, J.F. The insulin-like growth factor (IGF)-system in active ulcerative colitis and Crohn’s disease: Relations to disease activity and corticosteroid treatment. Growth Horm. IGF Res. 2007, 17, 33–40. [Google Scholar] [CrossRef] [PubMed]
- Chesnokova, V.; Zonis, S.; Zhou, C.; Recouvreux, M.V.; Ben-Shlomo, A.; Araki, T.; Barrett, R.; Workman, M.; Wawrowsky, K.; Ljubimov, V.A.; et al. Growth hormone is permissive for neoplastic colon growth. Proc. Natl. Acad. Sci. USA 2016, 113, E3250–E3259. [Google Scholar] [CrossRef] [PubMed]
- Sato, T.; Vries, R.G.; Snippert, H.J.; van de Wetering, M.; Barker, N.; Stange, D.E.; van Es, J.H.; Abo, A.; Kujala, P.; Peters, P.J.; et al. Single Lgr5 stem cells build crypt-villus structures in vitro without a mesenchymal niche. Nature 2009, 459, 262–265. [Google Scholar] [CrossRef] [PubMed]
- Wang, X.; Wang, B.; Wu, K.; Xu, M.; Gong, Z. Growth hormone downregulated the excessive apoptosis of ileal intestinal epithelial cells in rats during the early course of acute necrotizing pancreatitis. Pancreas 2002, 25, 205–209. [Google Scholar] [CrossRef] [PubMed]
- Challacombe, D.N.; Wheeler, E.E. The trophic action of human growth hormone on human duodenal mucosa cultured in vitro. J. Pediatr. Gastroenterol. Nutr. 1995, 21, 50–53. [Google Scholar] [CrossRef] [PubMed]
- Gilbert, S.; Nivarthi, H.; Mayhew, C.N.; Lo, Y.H.; Noah, T.K.; Vallance, J.; Rulicke, T.; Muller, M.; Jegga, A.G.; Tang, W.; et al. Activated STAT5 confers resistance to intestinal injury by increasing intestinal stem cell proliferation and regeneration. Stem Cell Rep. 2015, 4, 209–225. [Google Scholar] [CrossRef] [PubMed]
- Williams, K.L.; Fuller, C.R.; Dieleman, L.A.; DaCosta, C.M.; Haldeman, K.M.; Sartor, R.B.; Lund, P.K. Enhanced survival and mucosal repair after dextran sodium sulfate-induced colitis in transgenic mice that overexpress growth hormone. Gastroenterology 2001, 120, 925–937. [Google Scholar] [CrossRef] [PubMed]
- DiFedele, L.M.; He, J.; Bonkowski, E.L.; Han, X.; Held, M.A.; Bohan, A.; Menon, R.K.; Denson, L.A. Tumor necrosis factor α blockade restores growth hormone signaling in murine colitis. Gastroenterology 2005, 128, 1278–1291. [Google Scholar] [CrossRef] [PubMed]
- Moller, J. Effects of growth hormone on fluid homeostasis. Clinical and experimental aspects. Growth Horm. IGF Res. 2003, 13, 55–74. [Google Scholar] [CrossRef]
- Mijac, D.D.; Jankovic, G.L.; Jorga, J.; Krstic, M.N. Nutritional status in patients with active inflammatory bowel disease: Prevalence of malnutrition and methods for routine nutritional assessment. Eur. J. Intern Med. 2010, 21, 315–319. [Google Scholar] [CrossRef] [PubMed]
- Valentini, L.; Schulzke, J.D. Mundane, yet challenging: The assessment of malnutrition in inflammatory bowel disease. Eur. J. Intern Med. 2011, 22, 13–15. [Google Scholar] [CrossRef] [PubMed]
- Chey, W.D.; Kurlander, J.; Eswaran, S. Irritable bowel syndrome: A clinical review. JAMA 2015, 313, 949–958. [Google Scholar] [CrossRef] [PubMed]
- Soendergaard, C.; Kvist, P.H.; Seidelin, J.B.; Pelzer, H.; Nielsen, O.H. Systemic and intestinal levels of factor XIII-A: The impact of inflammation on expression in macrophage subtypes. J. Gastroenterol. 2016, 51, 796–807. [Google Scholar] [CrossRef] [PubMed]
- Soendergaard, C.; Nielsen, O.H.; Seidelin, J.B.; Kvist, P.H.; Bjerrum, J.T. α-1 antitrypsin and granulocyte colony-stimulating factor as serum biomarkers of disease severity in ulcerative colitis. Inflamm. Bowel Dis. 2015, 21, 1077–1088. [Google Scholar] [CrossRef] [PubMed]
- Schroeder, K.W.; Tremaine, W.J.; Ilstrup, D.M. Coated oral 5-aminosalicylic acid therapy for mildly to moderately active ulcerative colitis. A randomized study. N. Engl. J. Med. 1987, 317, 1625–1629. [Google Scholar] [CrossRef] [PubMed]
- Geboes, K.; Riddell, R.; Ost, A.; Jensfelt, B.; Persson, T.; Lofberg, R. A reproducible grading scale for histological assessment of inflammation in ulcerative colitis. Gut 2000, 47, 404–409. [Google Scholar] [CrossRef] [PubMed]
- Nevalainen Convenor, T.; Blom, H.J.; Guaitani, A.; Hardy, P.; Howard, B.R.; Vergara, P. Felasa recommendations for the accreditation of laboratory animal science education and training. Lab. Anim. 2002, 36, 373–377. [Google Scholar] [CrossRef] [PubMed]
- Holgersen, K.; Kutlu, B.; Fox, B.; Serikawa, K.; Lord, J.; Hansen, A.K.; Holm, T.L. High-resolution gene expression profiling using RNA sequencing in patients with inflammatory bowel disease and in mouse models of colitis. J. Crohns Colitis 2015, 9, 492–506. [Google Scholar] [CrossRef] [PubMed]
- Daehwan, K.; Geo, P.; Cole, T.; Harold, P.; Ryan, K.; Steven, L.S. TopHat2: Accurate alignment of transcriptomes in the presence of insertions, deletions and gene fusions. Genome Biol. 2013, 14, R36. [Google Scholar]
- Langmead, B.; Salzberg, S.L. Fast gapped-read alignment with bowtie 2. Nat. Methods 2012, 9, 357–359. [Google Scholar] [CrossRef] [PubMed]
- Anders, S.; Pyl, P.T.; Huber, W. HTSeq—A python framework to work with high-throughput sequencing data. Bioinformatics 2015, 31, 166–169. [Google Scholar] [CrossRef] [PubMed]
- Irizarry, R.A.; Hobbs, B.; Collin, F.; Beazer-Barclay, Y.D.; Antonellis, K.J.; Scherf, U.; Speed, T.P. Exploration, normalization, and summaries of high density oligonucleotide array probe level data. Biostatistics 2003, 4, 249–264. [Google Scholar] [CrossRef] [PubMed]
- Kauffmann, A.; Gentleman, R.; Huber, W. Arrayqualitymetrics—A bioconductor package for quality assessment of microarray data. Bioinformatics 2009, 25, 415–416. [Google Scholar] [CrossRef] [PubMed]
- Zhang, B.; Kumar, R.B.; Dai, H.; Feldman, B.J. A plasmonic chip for biomarker discovery and diagnosis of type 1 diabetes. Nat. Med. 2014, 20, 948–953. [Google Scholar] [CrossRef] [PubMed]
- Tabakman, S.M.; Lau, L.; Robinson, J.T.; Price, J.; Sherlock, S.P.; Wang, H.; Zhang, B.; Chen, Z.; Tangsombatvisit, S.; Jarrell, J.A.; et al. Plasmonic substrates for multiplexed protein microarrays with femtomolar sensitivity and broad dynamic range. Nat. Commun. 2011, 2, 466. [Google Scholar] [CrossRef] [PubMed]
- Zhou, Y.; Xu, B.C.; Maheshwari, H.G.; He, L.; Reed, M.; Lozykowski, M.; Okada, S.; Cataldo, L.; Coschigamo, K.; Wagner, T.E.; et al. A mammalian model for Laron syndrome produced by targeted disruption of the mouse growth hormone receptor/binding protein gene (the Laron mouse). Proc. Natl. Acad. Sci. USA 1997, 94, 13215–13220. [Google Scholar] [CrossRef] [PubMed]
- Hang, C.H.; Shi, J.X.; Li, J.S.; Li, W.Q.; Wu, W. Expressions of intestinal NF-κb, TNF-α, and IL-6 following traumatic brain injury in rats. J. Surg. Res. 2005, 123, 188–193. [Google Scholar] [CrossRef] [PubMed]
- Zhang, J.; Fu, S.; Sun, S.; Li, Z.; Guo, B. Inflammasome activation has an important role in the development of spontaneous colitis. Mucosal Immunol. 2014, 7, 1139–1150. [Google Scholar] [CrossRef] [PubMed]


| Clinical Variables | Controls | Remission | Mild | Moderate | Severe | p-Value |
|---|---|---|---|---|---|---|
| n = 20 | n = 21 | n = 11 | n = 24 | n = 10 | ||
| Gender (male/female) | 7/13 | 12/9 | 4/7 | 11/13 | 3/7 | =0.52 ° |
| Age, years (median, IQR) | 49 (20) | 52 (27) | 31 (15) | 40 (22) | 30 (14) | <0.01 Δ |
| Mayo score (median, IQR) | 0 (0) | 0 (1) | 4 (2) | 8 (3) | 12 (1) | <0.001 Δ |
| Mayo endoscopic score (median, IQR) | 0 (0) | 0 (0) | 1 (0) | 2 (0) | 3 (0) | <0.001 Δ |
| Geboes score (mean, IQR) § | 0.4 (1) | 1.0 (1) | 5.3 (14) | 13.0 (10) | 19.0 (4.5) | <0.001 Δ |
| Smoking/non-smoking | 4/16 | 3/18 | 0/11 | 0/24 | 4/6 | <0.05 ° |
| Daily medication: | <0.05 ° | |||||
| - Steroids (oral or topical) | 0 | 0 | 2 | 10 | 4 | |
| - 5-ASA (oral or topical) | 0 | 19 | 7 | 22 | 8 | |
| - Thiopurines | 0 | 4 | 2 | 8 | 0 | |
| - Infliximab | 0 | 3 | 0 | 1 | 2 | |
| - Antibiotics | 0 | 0 | 1 | 2 | 3 | |
| - None | 40 | 1 | 2 | 0 | 2 |
| Gene | Human (Array) n = 19 (H), 32 (I) | Enteroids (qPCR) n = 8 (H), 8 (I) | PAC (mRNA Seq) n = 3 (H), 12 (I) | |||
|---|---|---|---|---|---|---|
| Mean (SD) | P-Value | Mean (SD) | p-Value | Mean (SD) | p-Value | |
| GHR | H: 55.27 (30.21) I *: 13.94 (4.70) | ↓ <0.0001 | H: 3.31 (0.47) I °: 1.54 (0.36) | ↓ <0.001 | H: 10.06 (0.39) I Δ: 5.37 (1.40) | ↓ <0.01 |
| PRLR | H: 20.18 (4.77) I *: 10.69 (2.51) | ↓ <0.0001 | H: 11.21 (2.24) I °: 5.50 (1.46) | ↓ <0.001 | H: 1.45 (0.13) I Δ: 0.28 (0.23) | ↓ <0.01 |
| TNF-α | H: 25.63 (7.07) I *: 49.19 (31.74) | ↑ <0.0001 | - | H: 0.57 (0.15) I Δ: 12.60 (9.03) | ↑ <0.01 | |
| IL-1β | H: 48.20 (49.94) I *: 643.1 (952.2) | ↑ <0.0001 | - | H: 1.37 (0.32) I Δ: 38.04 (40.41) | ↑ <0.01 | |
| IL-6 | H: 8.32 (4.33) I *: 29.41 (81.64) | ↑ <0.0001 | - | H: 0.027 (0.046) I Δ: 1.014 (1.008) | ↑ <0.05 | |
| SOCS1 | H: 8.86 (2.86) I *: 35.18 (18.08) | ↑ <0.0001 | H: 2.43 (0.24) I °: 3.21 (0.25) | ↑ <0.001 | H: 2.93 (0.84) I °: 51.76 (32.83) | ↑ <0.01 |
| SOCS2 | H: 64.65 (14.17) I *: 43.42 (11.96) | ↓ <0.0001 | - | H: 9.56 (0.91) I Δ: 4.02 (0.87) | ↓ <0.01 | |
| SOCS3 | H: 4.89 (1.17) I *: 9.90 (5.66) | ↑ <0.0001 | H: 6.14 (0.72) I °: 7.47 (0.80) | ↑ <0.01 | H: 6.50 (2.01) I Δ: 76.34 (36.57) | ↑ <0.01 |
| IGF-1 | H: 32.23 (7.57) I *: 32.21 (10.49) | =0.9 (ns) | H: Below detection limitI °: Below detection limit | H: 2.20 (0.72) I Δ: 3.05 (1.20) | =0.3 (ns) | |
| IGF1R | H: 28.25 (4.18) I *: 23.01 (4.53) | ↓ <0.0001 | H: 1.18 (0.17) I °: 1.56 (0.32) | ↑ <0.05 | H: 3.34 (0.22) I Δ: 2.34 (0.31) | ↓ <0.01 |
| GH1 | Below detection limit (pcr) | - | Below detection limit | |||
| GH2 | H: 8.35 (1.34) I *: 7.91 (0.92) | =0.5 (ns) | H: 0.02 (0.02) I °: 0.02 (0.02) | =0.9 (ns) | ND § | |
© 2017 by the authors. Licensee MDPI, Basel, Switzerland. This article is an open access article distributed under the terms and conditions of the Creative Commons Attribution (CC BY) license (http://creativecommons.org/licenses/by/4.0/).
Share and Cite
Soendergaard, C.; Kvist, P.H.; Thygesen, P.; Reslow, M.; Nielsen, O.H.; Kopchick, J.J.; Holm, T.L. Characterization of Growth Hormone Resistance in Experimental and Ulcerative Colitis. Int. J. Mol. Sci. 2017, 18, 2046. https://doi.org/10.3390/ijms18102046
Soendergaard C, Kvist PH, Thygesen P, Reslow M, Nielsen OH, Kopchick JJ, Holm TL. Characterization of Growth Hormone Resistance in Experimental and Ulcerative Colitis. International Journal of Molecular Sciences. 2017; 18(10):2046. https://doi.org/10.3390/ijms18102046
Chicago/Turabian StyleSoendergaard, Christoffer, Peter Helding Kvist, Peter Thygesen, Mats Reslow, Ole Haagen Nielsen, John Joseph Kopchick, and Thomas Lindebo Holm. 2017. "Characterization of Growth Hormone Resistance in Experimental and Ulcerative Colitis" International Journal of Molecular Sciences 18, no. 10: 2046. https://doi.org/10.3390/ijms18102046