
A Thoroughly Validated Virtual Screening Strategy for Discovery of Novel HDAC3 Inhibitors


Abstract
:
1. Introduction
2. Results and Discussions
2.1. Structure-Based VS (SBVS) Approaches
2.1.1. The Optimal Docking Program and Scoring Function
2.1.2. The Optimal Protein Models from Ligand-Induced-Fit Docking
2.2. Ligand-Based VS (LBVS) Approaches
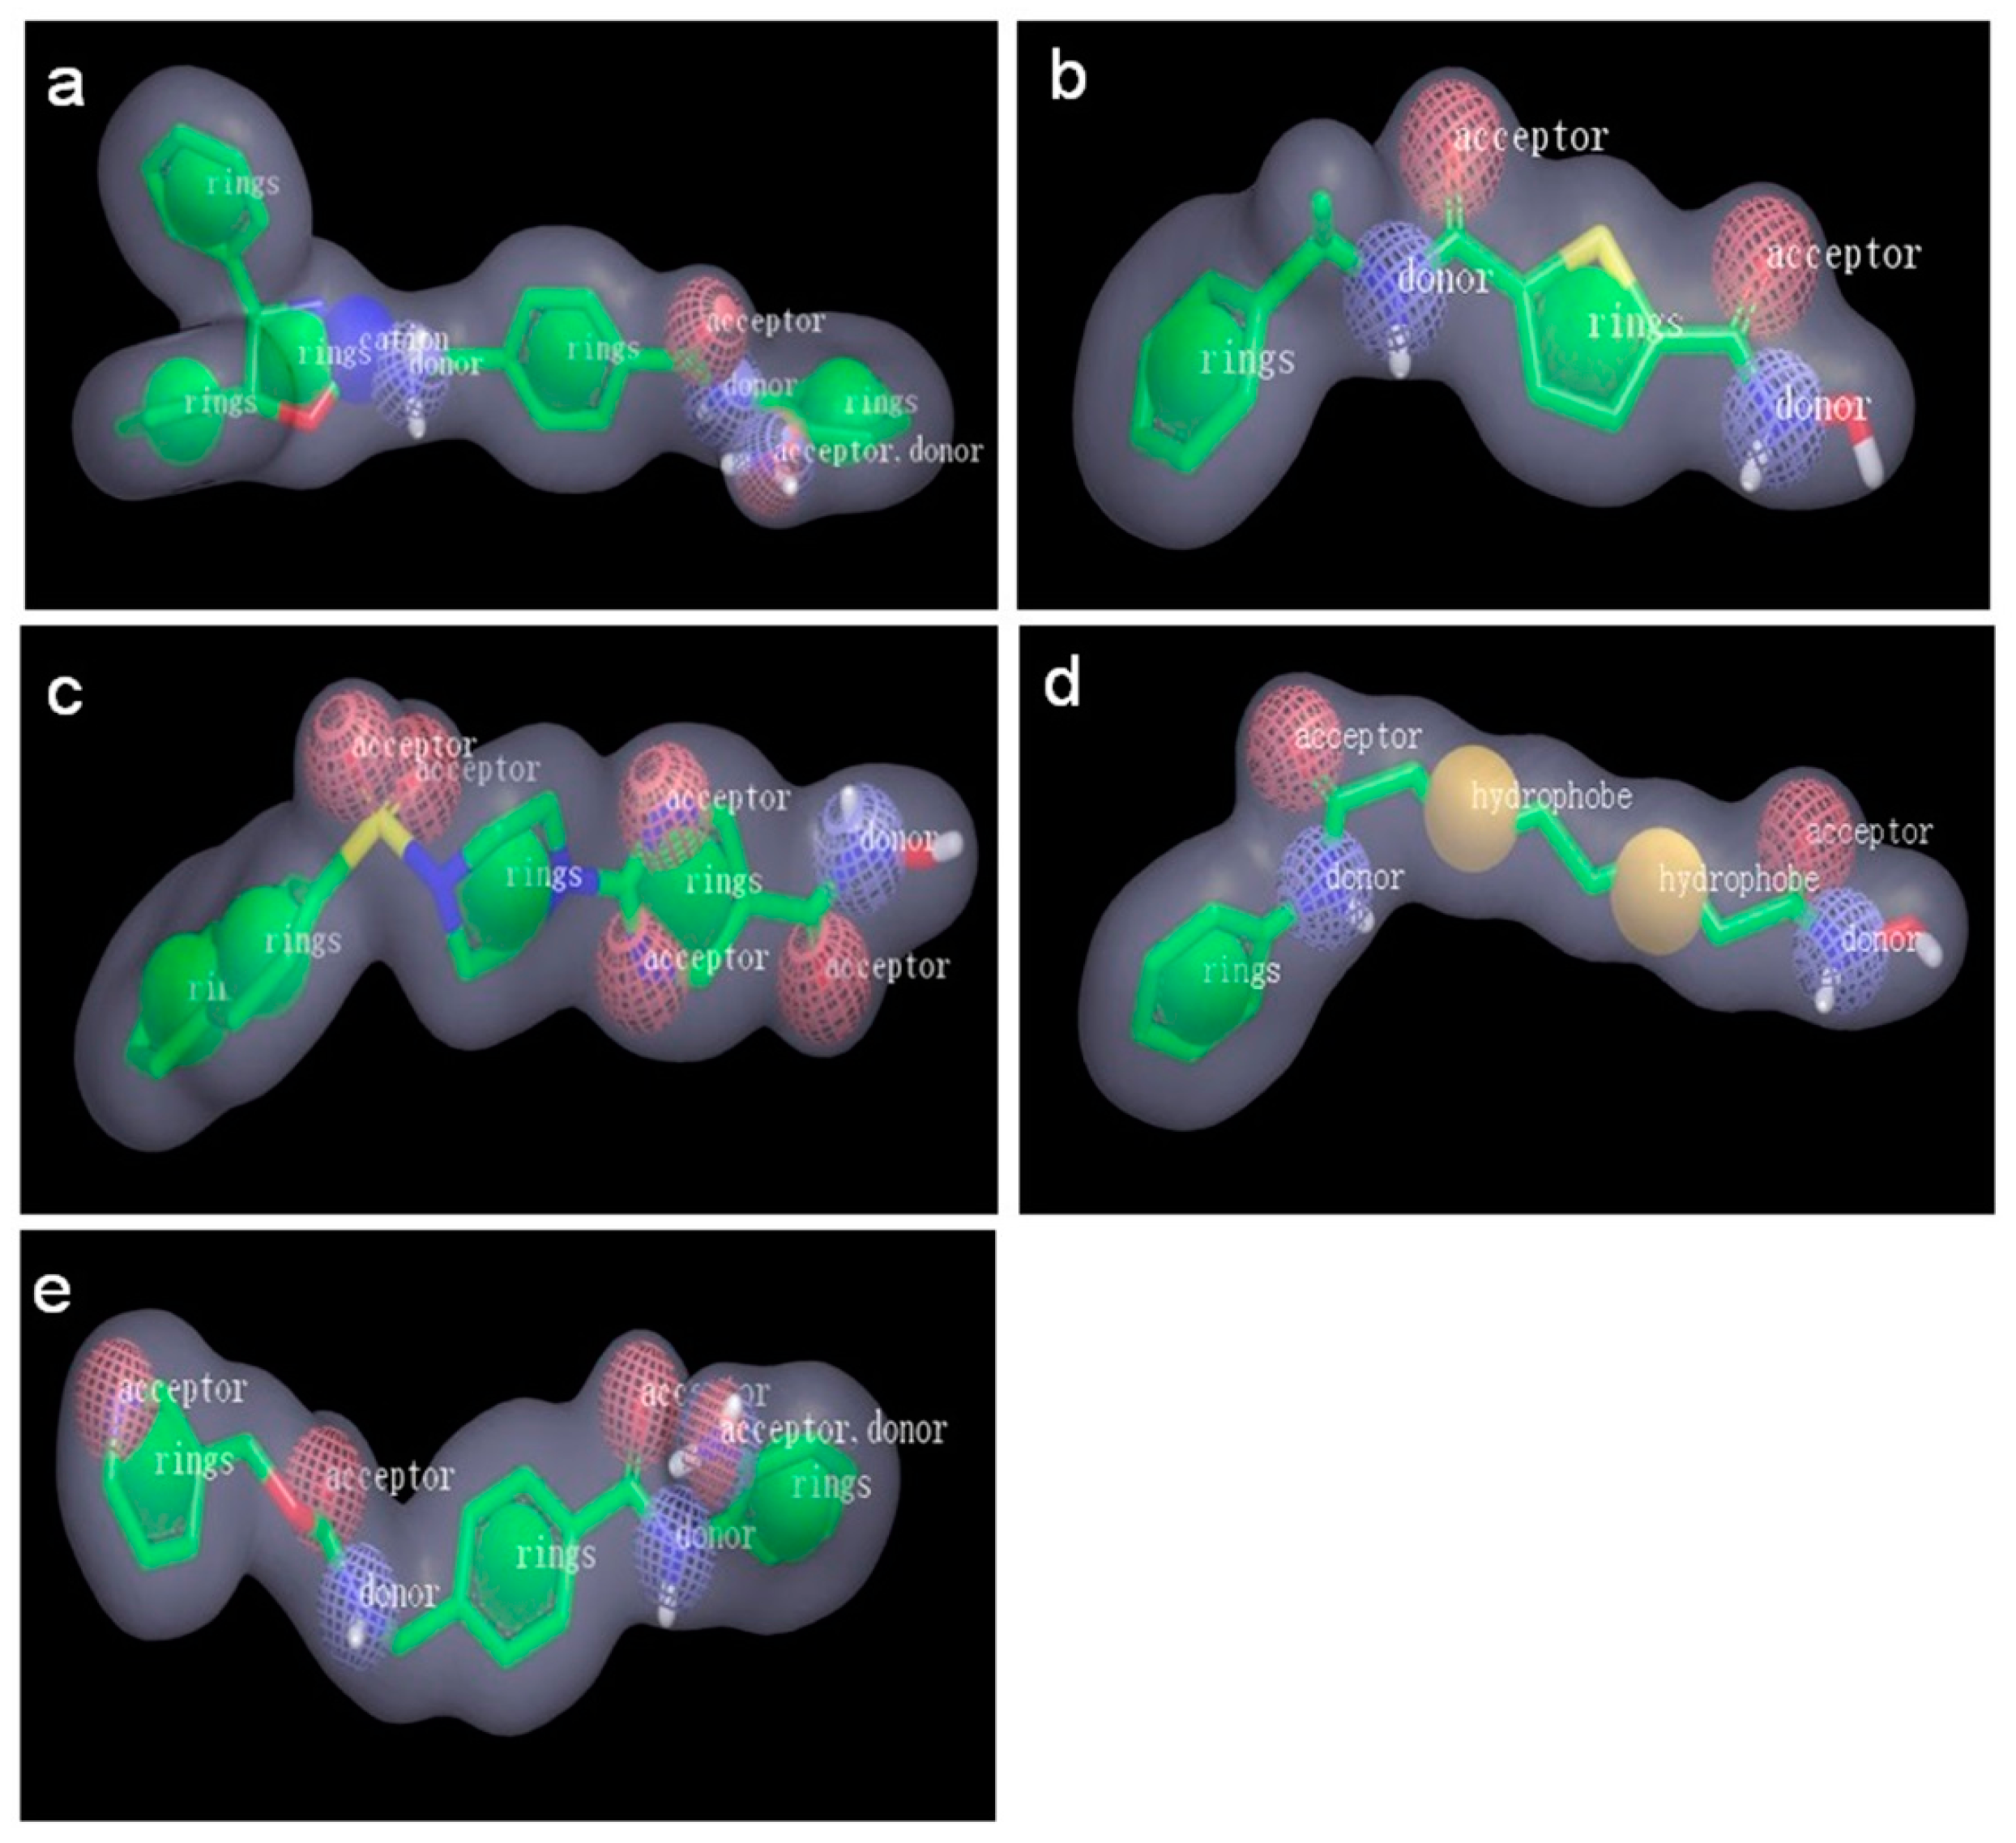
2.2.1. Pharmacophore Models Generated by Catalyst/HipHop
2.2.2. Shape-Based Models Generated by ROCS
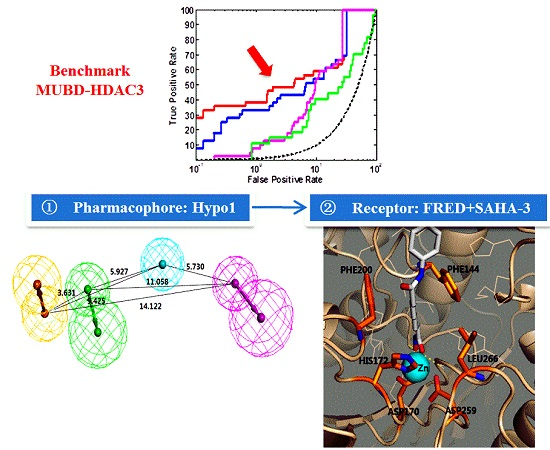
2.3. The Optimal Strategy to Virtually Screen HDAC3Is
3. Materials and Methods
3.1. Data Collection and Curation
3.1.1. The Ligand Set for Molecular Modeling
3.1.2. The Benchmarking Set for Ligand Enrichment Assessment
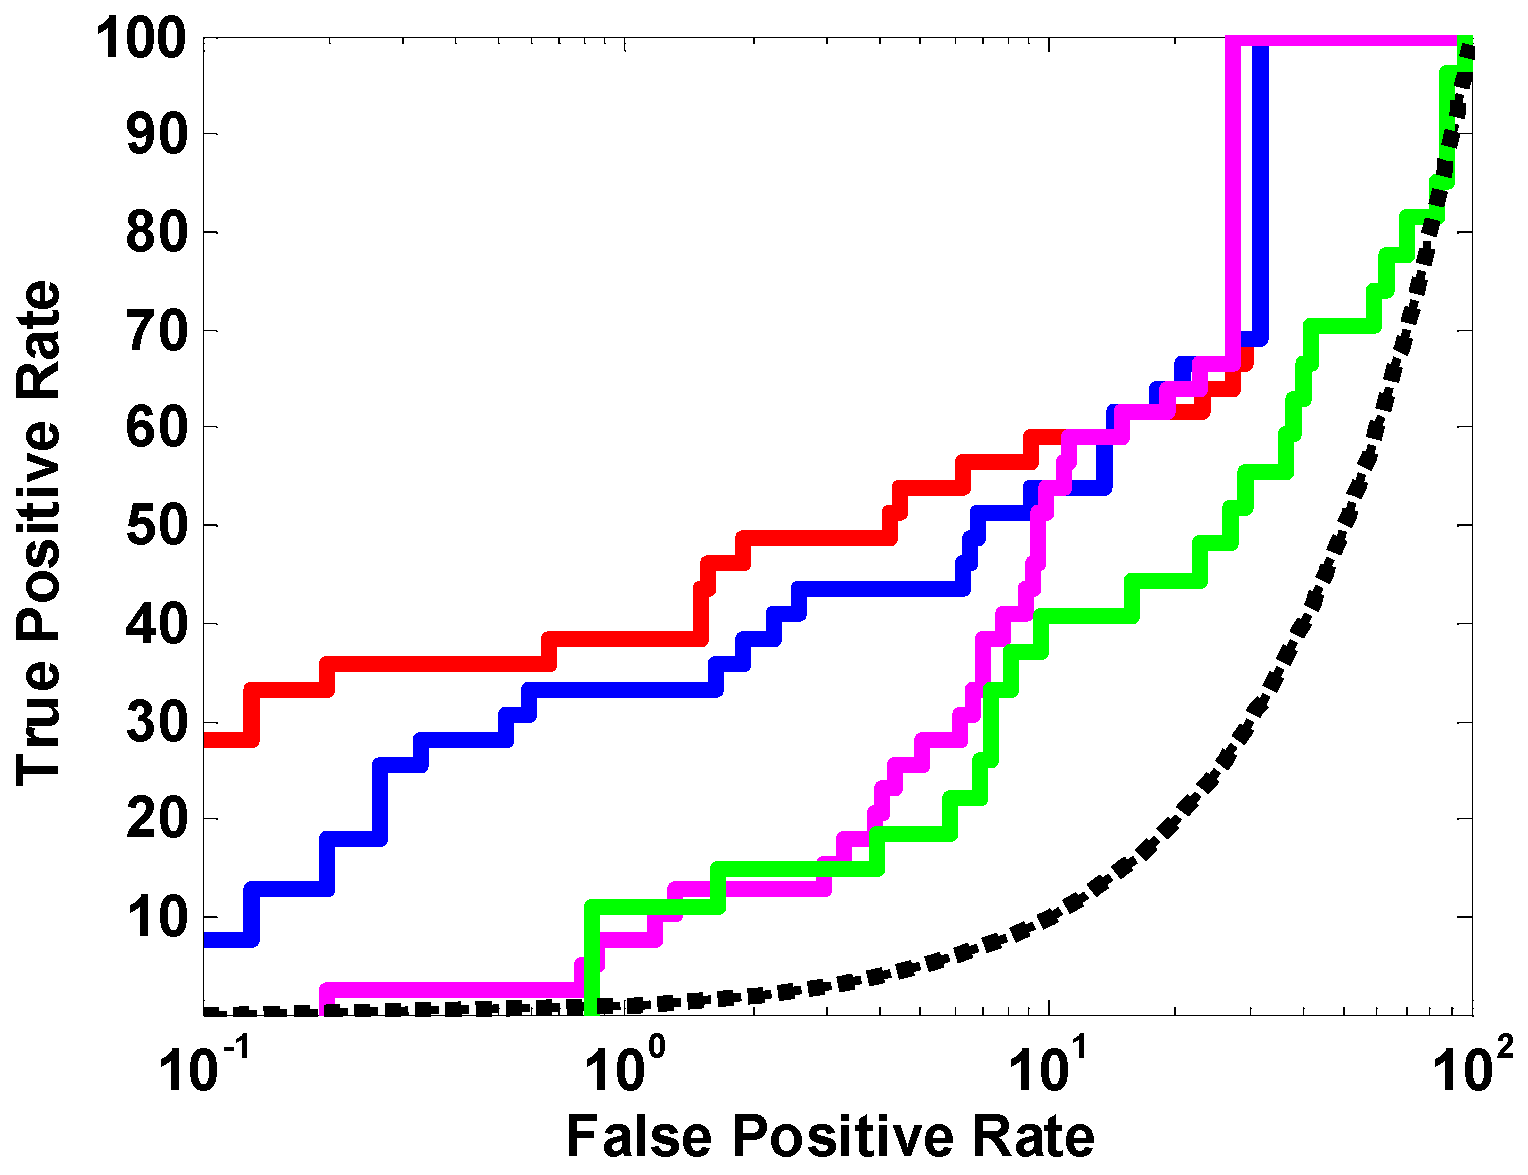
3.2. Metrics to Assess Ligand Enrichment
3.3. Development and Evaluation of SBVS Approaches
3.3.1. Three Commonly Used Docking Programs
3.3.2. Other Structure-Based Scoring Functions
3.3.3. Multiple Ligand-Induced-Fit Protein Models
3.4. Development and Evaluation of LBVS Approaches
3.4.1. Pharmacophore Modeling: Catalyst/HipHop
3.4.2. Shape-Based Models: ROCS
3.5. Development of Pipeline for Large-Scale VS
4. Conclusions
Acknowledgments
Author Contributions
Conflicts of Interest
Abbreviations
| HDAC3 | histone deacetylase 3 |
| VS | virtual screening |
| SBVS | structure-based VS |
| LBVS | ligand-based VS |
| HDACs | histone deacetylases |
| HATs | histone acetyltransfereases |
| NF-κB | nuclear factor κB |
| HDAC3Is | HDAC3 inhibitors |
| CADD | computer-aided drug design |
| MUBD-HDACs | maximal unbiased benchmarking datasets for histone deacetylases |
| DS | Discovery Studio |
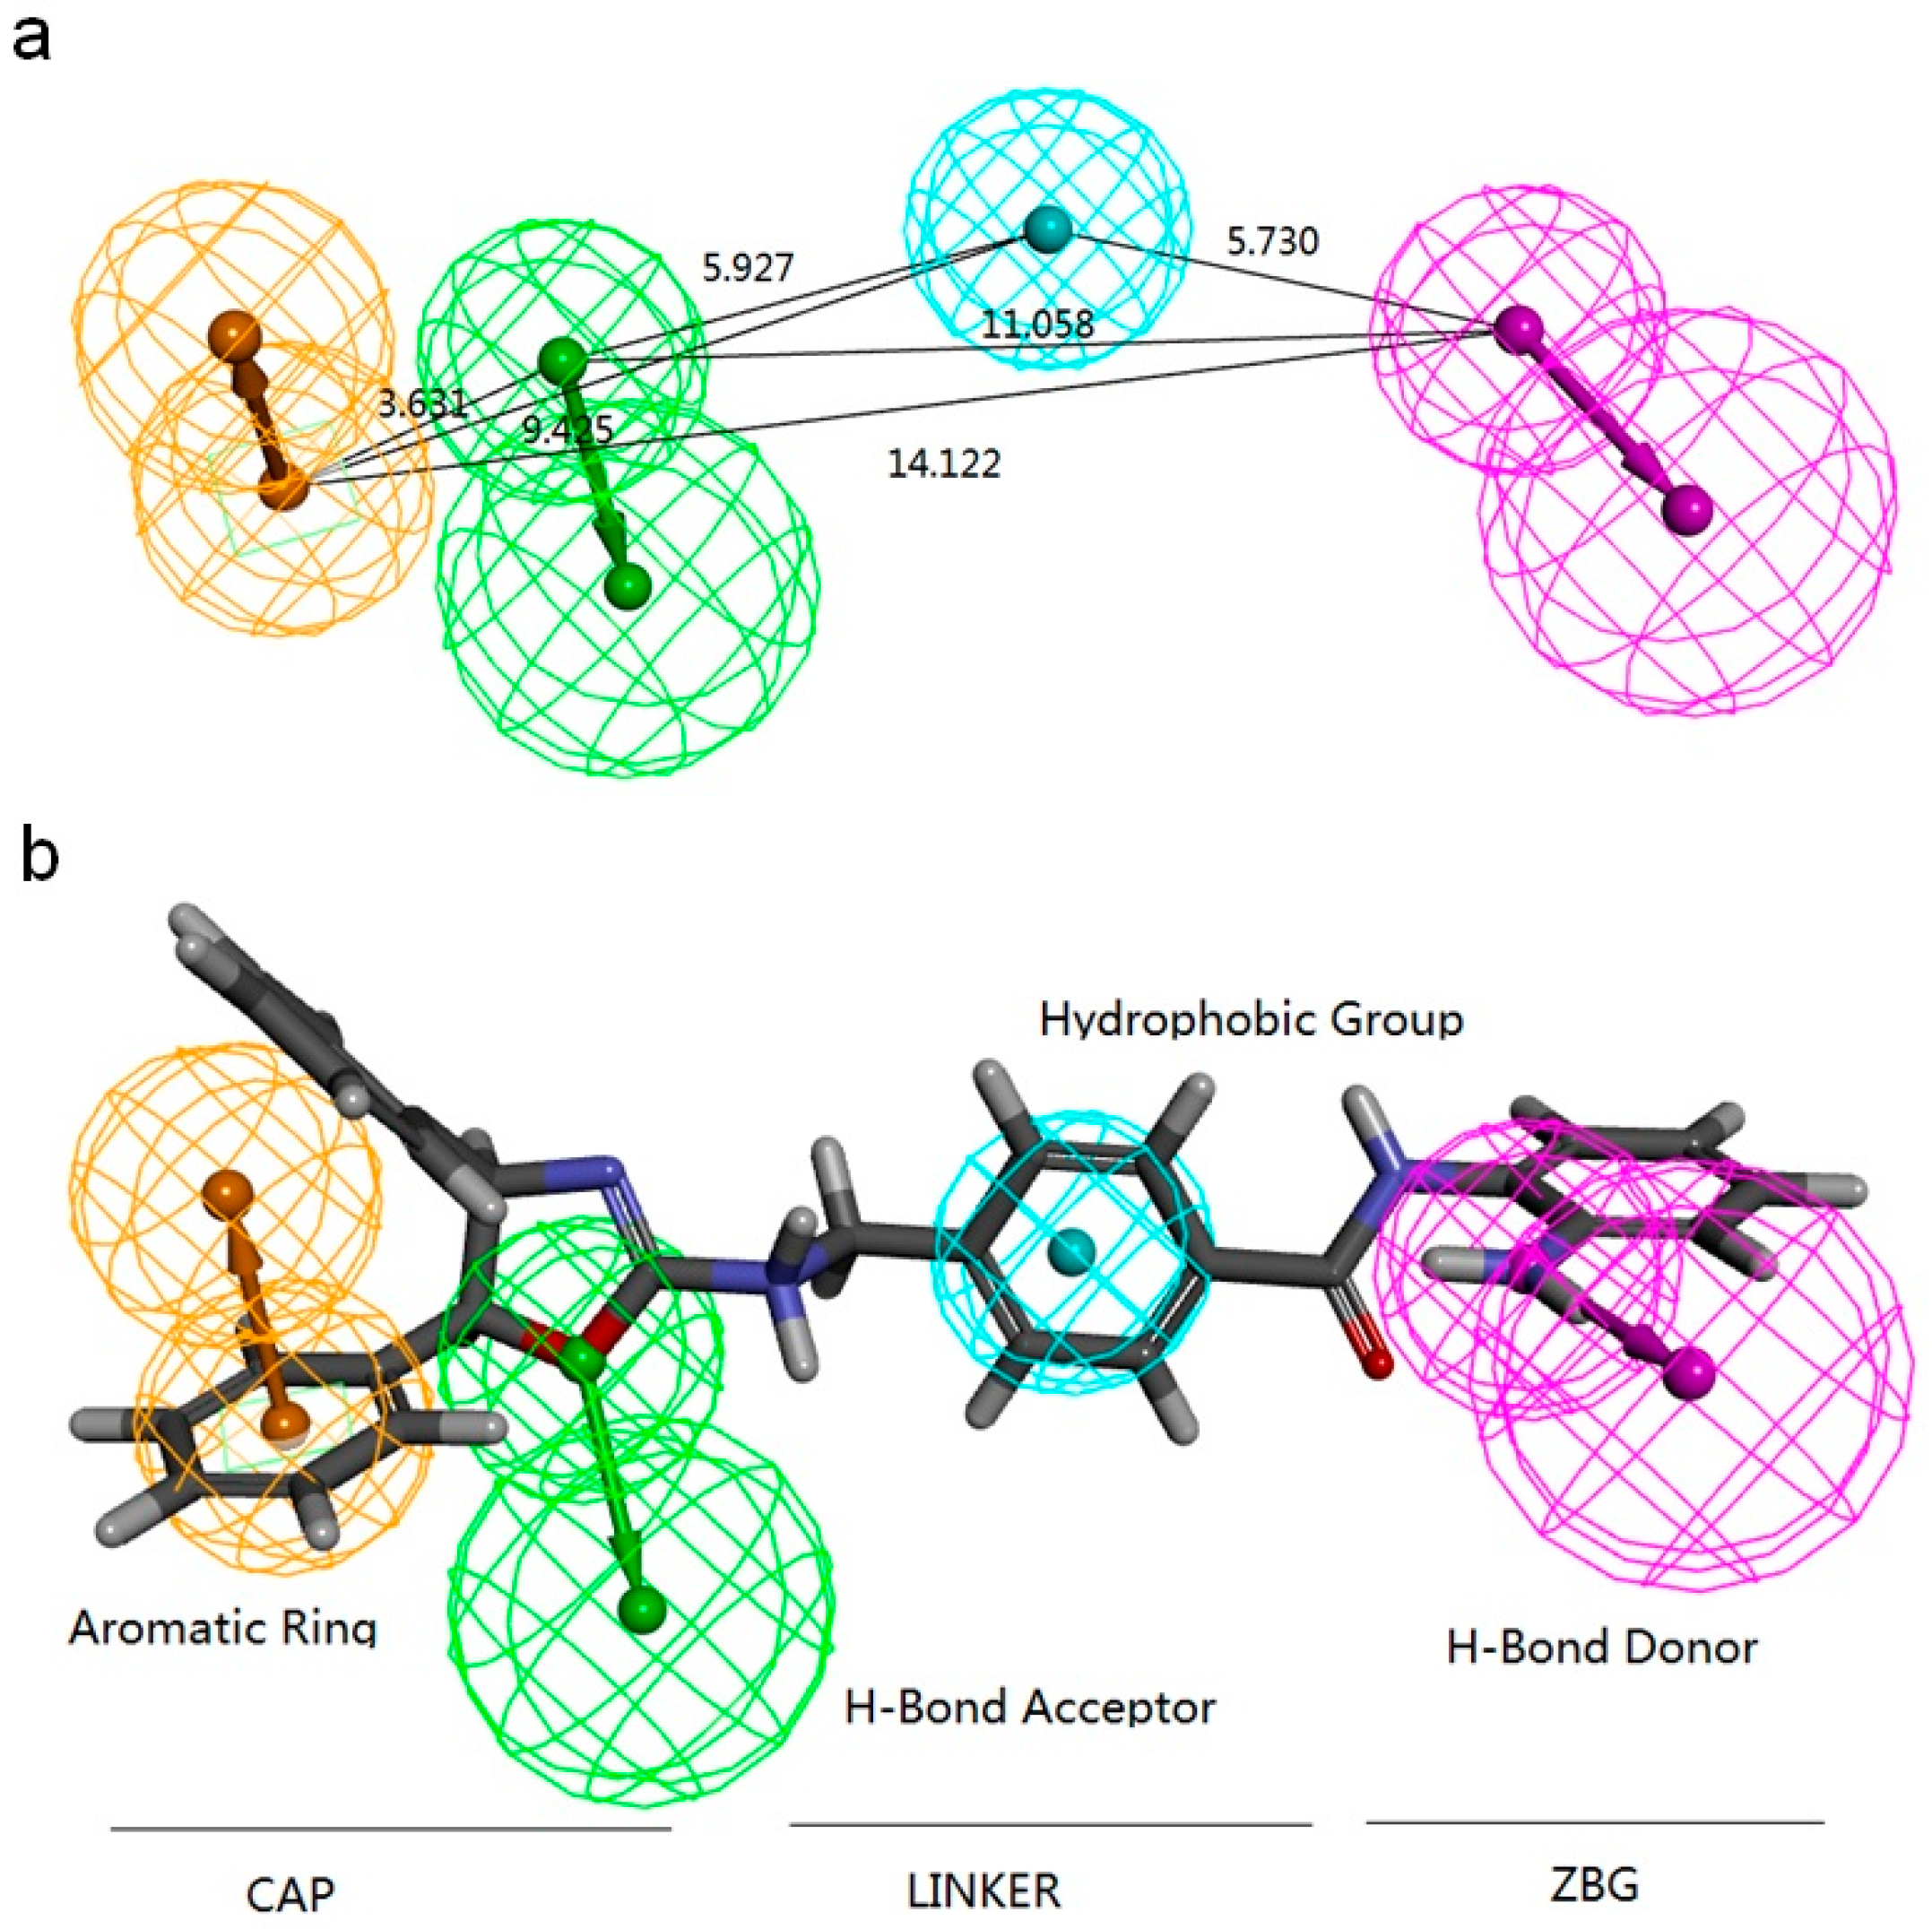
| R | aromatic ring |
| H | hydrophobic group |
| D | H-bond donor |
| A | H-bond acceptor |
| ZBG | zinc binding group |
| TC | TanimotoCombo |
| ST | ShapeTanimoto |
| CT | ColorTanimoto |
| SC | ScaledColor |
| CS | ComboScore |
| ROC | receiver operating characteristic |
| AUC | area under the curve |
| ROCE | ROC enrichment |
References
- Tang, H.; Wang, X.S.; Huang, X.P.; Roth, B.L.; Butler, K.V.; Kozikowski, A.P.; Jung, M.; Tropsha, A. Novel inhibitors of human histone deacetylase (HDAC) identified by QSAR modeling of known inhibitors, virtual screening, and experimental validation. J. Chem. Inf. Model. 2009, 49, 461–476. [Google Scholar] [CrossRef] [PubMed]
- Ropero, S.; Esteller, M. The role of histone deacetylases (HDACs) in human cancer. Mol. Oncol. 2007, 1, 19–25. [Google Scholar] [CrossRef] [PubMed]
- Yamagoe, S.; Kanno, T.; Kanno, Y.; Sasaki, S.; Siegel, R.M.; Lenardo, M.J.; Humphrey, G.; Wang, Y.; Nakatani, Y.; Howard, B.H.; et al. Interaction of histone acetylases and deacetylases in vivo. Mol. Cell. Biol. 2003, 23, 1025–1033. [Google Scholar] [CrossRef] [PubMed]
- Chuang, D.M.; Leng, Y.; Marinova, Z.; Kim, H.J.; Chiu, C.T. Multiple roles of HDAC inhibition in neurodegenerative conditions. Trends Neurosci. 2009, 32, 591–601. [Google Scholar] [CrossRef] [PubMed]
- Xia, J.; Tilahun, E.L.; Kebede, E.H.; Reid, T.E.; Zhang, L.; Wang, X.S. Comparative modeling and benchmarking data sets for human histone deacetylases and sirtuin families. J. Chem. Inf. Model. 2015, 55, 374–388. [Google Scholar] [CrossRef] [PubMed]
- Leus, N.G.; Zwinderman, M.R.; Dekker, F.J. Histone deacetylase 3 (HDAC3) as emerging drug target in NF-κB-mediated inflammation. Curr. Opin. Chem. Biol. 2016, 33, 160–168. [Google Scholar] [CrossRef] [PubMed]
- Chen, X.; Barozzi, I.; Termanini, A.; Prosperini, E.; Recchiuti, A.; Dalli, J.; Mietton, F.; Matteoli, G.; Hiebert, S.; Natoli, G. Requirement for the histone deacetylase HDAC3 for the inflammatory gene expression program in macrophages. Proc. Natl. Acad. Sci. USA 2012, 109, E2865–E2874. [Google Scholar] [CrossRef] [PubMed]
- Felice, C.; Lewis, A.; Armuzzi, A.; Lindsay, J.O.; Silver, A. Review article: Selective histone deacetylase isoforms as potential therapeutic targets in inflammatory bowel diseases. Aliment. Pharmacol. Ther. 2015, 41, 26–38. [Google Scholar] [CrossRef] [PubMed]
- McQuown, S.C.; Barrett, R.M.; Matheos, D.P.; Post, R.J.; Rogge, G.A.; Alenghat, T.; Mullican, S.E.; Jones, S.; Rusche, J.R.; Lazar, M.A.; et al. HDAC3 is a critical negative regulator of long-term memory formation. J. Neurosci. 2011, 31, 764–774. [Google Scholar] [CrossRef] [PubMed]
- Rogge, G.A.; Singh, H.; Dang, R.; Wood, M.A. HDAC3 is a negative regulator of cocaine-context-associated memory formation. J. Neurosci. 2013, 33, 6623–6632. [Google Scholar] [CrossRef] [PubMed]
- Malvaez, M.; McQuown, S.C.; Rogge, G.A.; Astarabadi, M.; Jacques, V.; Carreiro, S.; Rusche, J.R.; Wood, M.A. HDAC3-selective inhibitor enhances extinction of cocaine-seeking behavior in a persistent manner. Proc. Natl. Acad. Sci. USA 2013, 110, 2647–2652. [Google Scholar] [CrossRef] [PubMed]
- Lundh, M.; Christensen, D.P.; Damgaard Nielsen, M.; Richardson, S.J.; Dahllof, M.S.; Skovgaard, T.; Berthelsen, J.; Dinarello, C.A.; Stevenazzi, A.; Mascagni, P.; et al. Histone deacetylases 1 and 3 but not 2 mediate cytokine-induced β cell apoptosis in INS-1 cells and dispersed primary islets from rats and are differentially regulated in the islets of type 1 diabetic children. Diabetologia 2012, 55, 2421–2431. [Google Scholar] [CrossRef] [PubMed]
- Vetere, A.; Choudhary, A.; Burns, S.M.; Wagner, B.K. Targeting the pancreatic β cell to treat diabetes. Nat. Rev. Drug Discov. 2014, 13, 278–289. [Google Scholar] [CrossRef] [PubMed]
- Christensen, D.P.; Dahllof, M.; Lundh, M.; Rasmussen, D.N.; Nielsen, M.D.; Billestrup, N.; Grunnet, L.G.; Mandrup-Poulsen, T. Histone deacetylase (HDAC) inhibition as a novel treatment for diabetes mellitus. Mol. Med. 2011, 17, 378–390. [Google Scholar] [CrossRef] [PubMed]
- Larsen, L.; Tonnesen, M.; Ronn, S.G.; Storling, J.; Jorgensen, S.; Mascagni, P.; Dinarello, C.A.; Billestrup, N.; Mandrup-Poulsen, T. Inhibition of histone deacetylases prevents cytokine-induced toxicity in β cells. Diabetologia 2007, 50, 779–789. [Google Scholar] [CrossRef] [PubMed]
- Lewis, E.C.; Blaabjerg, L.; Storling, J.; Ronn, S.G.; Mascagni, P.; Dinarello, C.A.; Mandrup-Poulsen, T. The oral histone deacetylase inhibitor ITF2357 reduces cytokines and protects islet β cells in vivo and in vitro. Mol. Med. 2011, 17, 369–377. [Google Scholar] [CrossRef] [PubMed]
- Christensen, D.P.; Gysemans, C.; Lundh, M.; Dahllof, M.S.; Noesgaard, D.; Schmidt, S.F.; Mandrup, S.; Birkbak, N.; Workman, C.T.; Piemonti, L.; et al. Lysine deacetylase inhibition prevents diabetes by chromatin-independent immunoregulation and β cell protection. Proc. Natl. Acad. Sci. USA 2014, 111, 1055–1059. [Google Scholar] [CrossRef] [PubMed]
- Khan, S.; Jena, G. The role of butyrate, a histone deacetylase inhibitor in diabetes mellitus: Experimental evidence for therapeutic intervention. Epigenomics 2015, 7, 669–680. [Google Scholar] [CrossRef] [PubMed]
- Chou, D.H.; Holson, E.B.; Wagner, F.F.; Tang, A.J.; Maglathlin, R.L.; Lewis, T.A.; Schreiber, S.L.; Wagner, B.K. Inhibition of histone deacetylase 3 protects β cells from cytokine-induced apoptosis. Chem. Biol. 2012, 19, 669–673. [Google Scholar] [CrossRef] [PubMed]
- Wagner, F.F.; Lundh, M.; Kaya, T.; McCarren, P.; Zhang, Y.L.; Chattopadhyay, S.; Gale, J.P.; Galbo, T.; Fisher, S.L.; Meier, B.C.; et al. An Isochemogenic set of inhibitors to define the therapeutic potential of histone deacetylases in β cell protection. ACS Chem. Biol. 2016, 11, 363–374. [Google Scholar] [CrossRef] [PubMed]
- Lundh, M.; Galbo, T.; Poulsen, S.S.; Mandrup-Poulsen, T. Histone deacetylase 3 inhibition improves glycaemia and insulin secretion in obese diabetic rats. Diabetes Obes. Metab. 2015, 17, 703–707. [Google Scholar] [CrossRef] [PubMed]
- Cheng, Y.H.; Guo, Y.S.; Han, H.Z.; Wang, N.; Zhang, G.H.; Guo, Z.R.; Wu, S. Synthesis and activity of some new histone deacetylases inhibitors. Yao Xue Xue Bao 2010, 45, 735–741. [Google Scholar] [PubMed]
- Basant, N.; Lin, X.; Reid, T.E.; Karla, P.K.; Wang, X.S. Discovery of a novel HDAC2 inhibitor by a scaffold-merging hybrid query. Comb. Chem. High Throughput Screen. 2015, 18, 693–700. [Google Scholar] [CrossRef] [PubMed]
- Xia, J.; Jin, H.; Liu, Z.; Zhang, L.; Wang, X.S. An unbiased method to build benchmarking sets for ligand-based virtual screening and its application to GPCRs. J. Chem. Inf. Model. 2014, 54, 1433–1450. [Google Scholar] [CrossRef] [PubMed]
- Xia, J.; Tilahun, E.L.; Reid, T.E.; Zhang, L.; Wang, X.S. Benchmarking methods and data sets for ligand enrichment assessment in virtual screening. Methods 2015, 71, 146–157. [Google Scholar] [CrossRef] [PubMed]
- Huang, Y.X.; Zhao, J.; Song, Q.H.; Zheng, L.H.; Fan, C.; Liu, T.T.; Bao, Y.L.; Sun, L.G.; Zhang, L.B.; Li, Y.X. Virtual screening and experimental validation of novel histone deacetylase inhibitors. BMC Pharmacol. Toxicol. 2016, 17, 32. [Google Scholar] [CrossRef] [PubMed]
- Li, X.; Inks, E.S.; Li, X.; Hou, J.; Chou, C.J.; Zhang, J.; Jiang, Y.; Zhang, Y.; Xu, W. Discovery of the first N-hydroxycinnamamide-based histone deacetylase 1/3 dual inhibitors with potent oral antitumor activity. J. Med. Chem. 2014, 57, 3324–3341. [Google Scholar] [CrossRef] [PubMed]
- Micelli, C.; Rastelli, G. Histone deacetylases: Structural determinants of inhibitor selectivity. Drug Discov. Today 2015, 20, 718–735. [Google Scholar] [CrossRef] [PubMed]
- Marson, C.M.; Matthews, C.J.; Atkinson, S.J.; Lamadema, N.; Thomas, N.S. Potent and selective inhibitors of histone deacetylase-3 containing chiral oxazoline capping groups and a N-(2-aminophenyl)-benzamide binding unit. J. Med. Chem. 2015, 58, 6803–6818. [Google Scholar] [CrossRef] [PubMed]
- Jones, P.; Bottomley, M.J.; Carfi, A.; Cecchetti, O.; Ferrigno, F.; lo Surdo, P.; Ontoria, J.M.; Rowley, M.; Scarpelli, R.; Schultz-Fademrecht, C.; et al. 2-Trifluoroacetylthiophenes, a novel series of potent and selective class II histone deacetylase inhibitors. Bioorg. Med. Chem. Lett. 2008, 18, 3456–3461. [Google Scholar] [CrossRef] [PubMed]
- Angibaud, P.; van Emelen, K.; Decrane, L.; van Brandt, S.; Ten Holte, P.; Pilatte, I.; Roux, B.; Poncelet, V.; Speybrouck, D.; Queguiner, L.; et al. Identification of a series of substituted 2-piperazinyl-5-pyrimidylhydroxamic acids as potent histone deacetylase inhibitors. Bioorg. Med. Chem. Lett. 2010, 20, 294–298. [Google Scholar] [CrossRef] [PubMed]
- Estiu, G.; West, N.; Mazitschek, R.; Greenberg, E.; Bradner, J.E.; Wiest, O. On the inhibition of histone deacetylase 8. Bioorg. Med. Chem. 2010, 18, 4103–4110. [Google Scholar] [CrossRef] [PubMed]
- Wang’s Lab. Available online: http://www.xswlab.org/ (accessed on 1 January 2016).
- Jahn, A.; Hinselmann, G.; Fechner, N.; Zell, A. Optimal assignment methods for ligand-based virtual screening. J. Cheminf. 2009, 1, 14. [Google Scholar] [CrossRef] [PubMed]
- Hawkins, P.C.; Nicholls, A. Conformer generation with OMEGA: Learning from the data set and the analysis of failures. J. Chem. Inf. Model. 2012, 52, 2919–2936. [Google Scholar] [CrossRef] [PubMed]
- Li, Y.; Han, L.; Liu, Z.; Wang, R. Comparative assessment of scoring functions on an updated benchmark: 2. Evaluation methods and general results. J. Chem. Inf. Model. 2014, 54, 1717–1736. [Google Scholar] [CrossRef] [PubMed]
- Li, Y.; Liu, Z.; Li, J.; Han, L.; Liu, J.; Zhao, Z.; Wang, R. Comparative assessment of scoring functions on an updated benchmark: 1. Compilation of the test set. J. Chem. Inf. Model. 2014, 54, 1700–1716. [Google Scholar] [CrossRef] [PubMed]
- Koska, J.; Spassov, V.Z.; Maynard, A.J.; Yan, L.; Austin, N.; Flook, P.K.; Venkatachalam, C.M. Fully automated molecular mechanics based induced fit protein-ligand docking method. J. Chem. Inf. Model. 2008, 48, 1965–1973. [Google Scholar] [CrossRef] [PubMed]
- Grant, J.A.; Gallardo, M.A.; Pickup, B.T. A fast method of molecular shape comparison: A simple application of a Gaussian description of molecular shape. J. Comput. Chem. 1996, 17, 1653–1666. [Google Scholar] [CrossRef]
- Hawkins, P.C.; Skillman, A.G.; Nicholls, A. Comparison of shape-matching and docking as virtual screening tools. J. Med. Chem. 2007, 50, 74–82. [Google Scholar] [CrossRef] [PubMed]


| LBVS Approach | ROCE 0.5% a | ROCE 1% a | ROC AUC b | |
|---|---|---|---|---|
| docking programs | GOLD (Chemscore) | 0.00 | 0.00 | 0.63 |
| LibDock (LibScore) | 10.89 | 5.42 | 0.77 | |
| FRED (Chemgauss4) | 30.90 | 25.66 | 0.72 | |
| other scoring functions | Ludi_1 (DS c) | 0.00 | 0.00 | 0.39 |
| Ludi_2 (DS) | 0.00 | 0.00 | 0.40 | |
| Ludi_3 (DS) | 0.00 | 0.00 | 0.33 | |
| Ligscore1 (DS) | 0.00 | 2.57 | 0.56 | |
| Ligscore2 (DS) | 0.00 | 0.00 | 0.37 | |
| PLP1 (DS) | 5.15 | 7.70 | 0.50 | |
| PLP2 (DS) | 10.30 | 5.13 | 0.53 | |
| Jain (DS) | 5.15 | 2.57 | 0.40 | |
| PMF (DS) | 5.15 | 5.13 | 0.54 | |
| PMF04 (DS) | 0.00 | 5.13 | 0.52 | |
| HDAC3I | Model | ROCE 0.5% | ROCE 1% | ROC AUC |
|---|---|---|---|---|
| No ligand | apo | 30.90 | 25.66 | 0.72 |
| 15k | 15k-1 | 36.05 | 23.09 | 0.73 |
| 15k-2 | 25.75 | 17.96 | 0.76 | |
| 15k-3 | 25.75 | 15.40 | 0.72 | |
| 15k-4 | 15.45 | 12.83 | 0.72 | |
| 15k-5 | 46.35 | 25.66 | 0.75 | |
| 8d | 8d-1 | 61.80 | 33.36 | 0.72 |
| 8d-2 | 61.80 | 35.92 | 0.71 | |
| 8d-3 | 41.20 | 23.09 | 0.69 | |
| 8d-4 | 61.80 | 33.36 | 0.73 | |
| 8d-5 | 72.10 | 38.49 | 0.76 | |
| 8d-6 | 66.95 | 35.92 | 0.72 | |
| 8d-7 | 77.25 | 41.05 | 0.77 | |
| 8d-8 | 36.05 | 25.66 | 0.76 | |
| 8d-9 | 72.10 | 35.92 | 0.67 | |
| 8d-10 | 61.80 | 35.92 | 0.66 | |
| 8d-11 | 61.80 | 35.92 | 0.72 | |
| 8d-12 | 66.95 | 35.92 | 0.73 | |
| R306465 | R306465-1 | 63.69 | 34.17 | 0.68 |
| R306465-2 | 65.28 | 35.02 | 0.67 | |
| R306465-3 | 70.30 | 35.02 | 0.71 | |
| R306465-4 | 63.69 | 31.73 | 0.65 | |
| R306465-5 | 70.30 | 37.53 | 0.74 | |
| R306465-6 | 62.49 | 31.13 | 0.63 | |
| R306465-7 | 75.32 | 40.03 | 0.74 | |
| R306465-8 | 65.28 | 37.53 | 0.71 | |
| SAHA | SAHA-1 | 41.20 | 30.79 | 0.68 |
| SAHA-2 | 61.80 | 33.36 | 0.71 | |
| SAHA-3 | 77.25 | 41.05 | 0.79 | |
| SAHA-4 | 51.50 | 41.05 | 0.75 | |
| SAHA-5 | 41.20 | 25.66 | 0.71 | |
| SAHA-6 | 66.95 | 35.92 | 0.74 | |
| SAHA-7 | 72.10 | 38.49 | 0.73 | |
| SAHA-8 | 66.95 | 35.92 | 0.72 | |
| SAHA-9 | 36.05 | 25.66 | 0.75 | |
| SAHA-10 | 77.25 | 41.05 | 0.77 | |
| SAHA-11 | 66.95 | 33.36 | 0.73 | |
| SAHA-12 | 66.95 | 33.36 | 0.73 | |
| MS-275 | MS-275-1 | 41.20 | 30.79 | 0.76 |
| MS-275-2 | 41.20 | 23.09 | 0.73 | |
| MS-275-3 | 46.35 | 30.79 | 0.74 | |
| MS-275-4 | 66.95 | 35.92 | 0.74 | |
| MS-275-5 | 25.75 | 12.83 | 0.73 | |
| statistics | average | 56.55 | 31.83 | 0.72 |
| min | 15.45 | 12.83 | 0.63 | |
| max | 77.25 | 41.05 | 0.79 |
| Model | Features a | Rank | Direct Hit b | Partial Hit c | Max Fit |
|---|---|---|---|---|---|
| Hypo1 | RHDA | 46.740 | 11101 | 00010 | 4 |
| Hypo2 | RHDA | 46.725 | 11101 | 00010 | 4 |
| Hypo3 | RHDA | 46.725 | 11101 | 00010 | 4 |
| Hypo4 | RHDA | 44.288 | 11111 | 00000 | 4 |
| Hypo5 | RHDA | 44.206 | 11101 | 00010 | 4 |
| Hypo6 | RHDA | 44.206 | 11101 | 00010 | 4 |
| Hypo7 | RHDA | 44.039 | 11101 | 00010 | 4 |
| Hypo8 | RHDA | 44.039 | 11101 | 00010 | 4 |
| Hypo9 | RHAA | 43.379 | 11111 | 00000 | 4 |
| Hypo10 | RHAA | 42.530 | 11101 | 00010 | 4 |
| Model | ROCE 0.5% | ROCE 1% | ROC AUC |
|---|---|---|---|
| Hypo1 | 41.20 | 23.09 | 0.86 |
| Hypo2 | 20.60 | 12.83 | 0.85 |
| Hypo3 | 20.60 | 17.96 | 0.85 |
| Hypo4 | 0.00 | 0.00 | 0.59 |
| Hypo5 | 10.30 | 7.70 | 0.76 |
| Hypo6 | 10.30 | 12.83 | 0.77 |
| Hypo7 | 5.15 | 5.13 | 0.74 |
| Hypo8 | 0.00 | 5.13 | 0.73 |
| Hypo9 | 5.15 | 2.57 | 0.55 |
| Hypo10 | 5.15 | 2.57 | 0.69 |
| Model | Similarity Metric * | ROCE 0.5% | ROCE 1% | ROC AUC |
|---|---|---|---|---|
| 15k-5L | TC | 15.45 | 10.26 | 0.55 |
| ST | 10.30 | 7.70 | 0.50 | |
| CT | 5.15 | 7.70 | 0.59 | |
| SC | 10.30 | 7.70 | 0.53 | |
| CS | 15.45 | 7.70 | 0.52 | |
| 8d-7L | TC | 20.60 | 10.26 | 0.44 |
| ST | 15.45 | 7.70 | 0.43 | |
| CT | 20.60 | 12.83 | 0.48 | |
| SC | 15.45 | 7.70 | 0.47 | |
| CS | 15.45 | 7.70 | 0.43 | |
| R306465-7L | TC | 10.30 | 7.70 | 0.54 |
| ST | 5.15 | 2.57 | 0.5 | |
| CT | 10.30 | 10.26 | 0.55 | |
| SC | 15.45 | 7.70 | 0.52 | |
| CS | 10.30 | 7.70 | 0.53 | |
| SAHA-3L | TC | 20.60 | 17.96 | 0.56 |
| ST | 0 | 0 | 0.52 | |
| CT | 15.45 | 10.26 | 0.59 | |
| SC | 20.60 | 10.26 | 0.58 | |
| CS | 20.60 | 12.83 | 0.58 | |
| MS-275-4L | TC | 10.30 | 7.70 | 0.52 |
| ST | 10.30 | 5.13 | 0.49 | |
| CT | 5.15 | 2.57 | 0.53 | |
| SC | 10.30 | 5.13 | 0.48 | |
| CS | 15.45 | 7.70 | 0.48 |
| Pipeline | ROCE 0.5% | ROCE 1% | ROC AUC |
|---|---|---|---|
| Hypo1_FRED_SAHA-3 | 72.10 | 38.49 | 0.87 |
| Hypo1_FRED_Apo | 56.65 | 33.36 | 0.87 |
| Hypo1_GOLD_Apo | 0 | 11.20 | 0.65 |
| Hypo1_LibDock_Apo | 5.15 | 7.70 | 0.86 |
© 2017 by the authors; licensee MDPI, Basel, Switzerland. This article is an open access article distributed under the terms and conditions of the Creative Commons Attribution (CC-BY) license (http://creativecommons.org/licenses/by/4.0/).
Share and Cite
Hu, H.; Xia, J.; Wang, D.; Wang, X.S.; Wu, S. A Thoroughly Validated Virtual Screening Strategy for Discovery of Novel HDAC3 Inhibitors. Int. J. Mol. Sci. 2017, 18, 137. https://doi.org/10.3390/ijms18010137
Hu H, Xia J, Wang D, Wang XS, Wu S. A Thoroughly Validated Virtual Screening Strategy for Discovery of Novel HDAC3 Inhibitors. International Journal of Molecular Sciences. 2017; 18(1):137. https://doi.org/10.3390/ijms18010137
Chicago/Turabian StyleHu, Huabin, Jie Xia, Dongmei Wang, Xiang Simon Wang, and Song Wu. 2017. "A Thoroughly Validated Virtual Screening Strategy for Discovery of Novel HDAC3 Inhibitors" International Journal of Molecular Sciences 18, no. 1: 137. https://doi.org/10.3390/ijms18010137