
MicroRNAs and Drinking: Association between the Pre-miR-27a rs895819 Polymorphism and Alcohol Consumption in a Mediterranean Population

 , , , ,
  ,
,
Abstract
:
1. Introduction
2. Results
2.1. Association between the Pre-miR-27a rs895819 Polymorphism and Total Alcohol Consumption and Types of Alcoholic Beverages
2.2. Association between the Pre-miR-27a rs895819 Polymorphism and Drinking Categories
2.3. Sensitivity Analysis of the Association between the Pre-miR-27a rs895819 Polymorphism and Drinking
3. Discussion
4. Materials and Methods
4.1. Subjects
4.2. Demographic, Clinical, Anthropometric, Dietary and Other Lifestyles Measurements
4.3. Biochemical Determinations, DNA Extraction and Genotyping
4.4. Statistical Analyses
5. Conclusions
Supplementary Materials
Acknowledgments
Author Contributions
Conflicts of Interest
References
- Deiuliis, J.A. MicroRNAs as regulators of metabolic disease: Pathophysiologic significance and emerging role as biomarkers and therapeutics. Int. J. Obes. 2016, 40, 88–101. [Google Scholar] [CrossRef] [PubMed]
- Orellana, E.A.; Kasinski, A.L. MicroRNAs in cancer: A historical perspective on the path from discovery to therapy. Cancers 2015, 7, 1388–1405. [Google Scholar] [CrossRef] [PubMed]
- Olivieri, F.; Rippo, M.R.; Monsurrò, V.; Salvioli, S.; Capri, M.; Procopio, A.D.; Franceschi, C. MicroRNAs linking inflamm-aging, cellular senescence and cancer. Ageing Res. Rev. 2013, 12, 1056–1068. [Google Scholar] [CrossRef] [PubMed]
- Raffort, J.; Hinault, C.; Dumortier, O.; van Obberghen, E. Circulating microRNAs and diabetes: Potential applications in medical practice. Diabetologia 2015, 58, 1978–1992. [Google Scholar] [CrossRef] [PubMed]
- Gao, Y.; Peng, J.; Ren, Z.; He, N.Y.; Li, Q.; Zhao, X.S.; Wang, M.M.; Wen, H.Y.; Tang, Z.H.; Jiang, Z.S.; et al. Functional regulatory roles of microRNAs in atherosclerosis. Clin. Chim. Acta 2016, 460, 164–171. [Google Scholar] [CrossRef] [PubMed]
- Bordoni, A.; Capozzi, F. Foodomics for healthy nutrition. Curr. Opin. Clin. Nutr. Metab. Care 2014, 17, 418–424. [Google Scholar] [CrossRef] [PubMed]
- Luo, C.; Sun, L.; Ma, J.; Wang, J.; Qu, H.; Shu, D. Association of single nucleotide polymorphisms in the microRNA miR-1596 locus with residual feed intake in chickens. Anim. Genet. 2015, 46, 265–271. [Google Scholar] [CrossRef] [PubMed]
- Nunez, Y.O.; Mayfield, R.D. Understanding alcoholism through microRNA signatures in brains of human alcoholics. Front. Genet. 2012, 3, 43. [Google Scholar] [CrossRef] [PubMed]
- De Gaetano, G.; Costanzo, S.; di Castelnuovo, A.; Badimon, L.; Bejko, D.; Alkerwi, A.; Chiva-Blanch, G.; Estruch, R.; La Vecchia, C.; Panico, S.; et al. Effects of moderate beer consumption on health and disease: A consensus document. Nutr. Metab. Cardiovasc. Dis. 2016, 26, 443–467. [Google Scholar] [CrossRef] [PubMed]
- Roerecke, M.; Rehm, J. Alcohol consumption, drinking patterns, and ischemic heart disease: A narrative review of meta-analyses and a systematic review and meta-analysis of the impact of heavy drinking occasions on risk for moderate drinkers. BMC Med. 2014, 12, 182. [Google Scholar] [CrossRef] [PubMed]
- Corella, D. Alcohol intake. Prog. Mol. Biol. Transl. Sci. 2012, 108, 261–292. [Google Scholar] [PubMed]
- Hurley, T.D.; Edenberg, H.J. Genes encoding enzymes involved in ethanol metabolism. Alcohol. Res. 2012, 34, 339–344. [Google Scholar] [PubMed]
- Wall, T.L.; Luczak, S.E.; Hiller-Sturmhöfel, S. Biology, genetics, and environment: Underlying factors influencing alcohol metabolism. Alcohol. Res. 2016, 38, 59–68. [Google Scholar] [PubMed]
- Hayes, J.E.; Wallace, M.R.; Knopik, V.S.; Herbstman, D.M.; Bartoshuk, L.M.; Duffy, V.B. Allelic variation in TAS2R bitter receptor genes associates with variation in sensations from and ingestive behaviors toward common bitter beverages in adults. Chem. Senses. 2011, 36, 311–319. [Google Scholar] [CrossRef] [PubMed]
- Kapoor, M.; Wang, J.C.; Wetherill, L.; Le, N.; Bertelsen, S.; Hinrichs, A.L.; Budde, J.; Agrawal, A.; Bucholz, K.; Dick, D.; et al. A meta-analysis of two genome-wide association studies to identify novel loci for maximum number of alcoholic drinks. Hum. Genet. 2013, 132, 1141–1151. [Google Scholar] [CrossRef] [PubMed]
- Miranda, R.C.; Pietrzykowski, A.Z.; Tang, Y.; Sathyan, P.; Mayfield, D.; Keshavarzian, A.; Sampson, W.; Hereld, D. MicroRNAs: Master regulators of ethanol abuse and toxicity? Alcohol. Clin. Exp. Res. 2010, 34, 575–587. [Google Scholar] [CrossRef] [PubMed]
- Cao, D.D.; Li, L.; Chan, W.Y. MicroRNAs: Key regulators in the central nervous system and their implication in neurological diseases. Int. J. Mol. Sci. 2016, 17, 842. [Google Scholar] [CrossRef] [PubMed]
- Most, D.; Workman, E.; Harris, R.A. Synaptic adaptations by alcohol and drugs of abuse: Changes in microRNA expression and mRNA regulation. Front. Mol. Neurosci. 2014, 7, 85. [Google Scholar] [CrossRef] [PubMed]
- Jonkman, S.; Kenny, P.J. Molecular, cellular, and structural mechanisms of cocaine addiction: A key role for microRNAs. Neuropsychopharmacology 2013, 38, 198–211. [Google Scholar] [CrossRef] [PubMed]
- Hwang, C.K.; Wagley, Y.; Law, P.Y.; Wei, L.N.; Loh, H.H. MicroRNAs in opioid pharmacology. J. Neuroimmune Pharmacol. 2012, 7, 808–819. [Google Scholar] [CrossRef] [PubMed]
- Sathyan, P.; Golden, H.B.; Miranda, R.C. Competing interactions between micro-RNAs determine neural progenitor survival and proliferation after ethanol exposure: Evidence from an ex vivo model of the fetal cerebral cortical neuroepithelium. J. Neurosci. 2007, 27, 8546–8557. [Google Scholar] [CrossRef] [PubMed]
- Pietrzykowski, A.Z.; Friesen, R.M.; Martin, G.E.; Puig, S.I.; Nowak, C.L.; Wynne, P.M.; Siegelmann, H.T.; Treistman, S.N. Posttranscriptional regulation of BK channel splice variant stability by miR-9 underlies neuroadaptation to alcohol. Neuron 2008, 59, 274–287. [Google Scholar] [CrossRef] [PubMed]
- Beech, R.D.; Leffert, J.J.; Lin, A.; Hong, K.A.; Hansen, J.; Umlauf, S.; Mane, S.; Zhao, H.; Sinha, R. Stress-related alcohol consumption in heavy drinkers correlates with expression of miR-10a, miR-21, and components of the TAR-RNA-binding protein-associated complex. Alcohol. Clin. Exp. Res. 2014, 38, 2743–2753. [Google Scholar] [CrossRef] [PubMed]
- Gedik, H.; Erdal, M.E.; Yilmaz, S.G.; Sengul, C.; Sengul, C.B.; Herken, H. Association of microRNA biogenesis pathway gene variants and alcohol dependence risk. DNA Cell Biol. 2015, 34, 220–226. [Google Scholar] [CrossRef] [PubMed]
- Darcq, E.; Warnault, V.; Phamluong, K.; Besserer, G.M.; Liu, F.; Ron, D. MicroRNA-30a-5p in the prefrontal cortex controls the transition from moderate to excessive alcohol consumption. Mol. Psychiatry 2015, 20, 1219–1231. [Google Scholar] [CrossRef] [PubMed]
- Lewohl, J.M.; Nunez, Y.O.; Dodd, P.R.; Tiwari, G.R.; Harris, R.A.; Mayfield, R.D. Up-regulation of microRNAs in brain of human alcoholics. Alcohol. Clin. Exp. Res. 2011, 35, 1928–1937. [Google Scholar] [CrossRef] [PubMed]
- Manzardo, A.M.; Gunewardena, S.; Butler, M.G. Over-expression of the miRNA cluster at chromosome 14q32 in the alcoholic brain correlates with suppression of predicted target mRNA required for oligodendrocyte proliferation. Gene 2013, 526, 356–363. [Google Scholar] [CrossRef] [PubMed]
- Ignacio, C.; Hicks, S.D.; Burke, P.; Lewis, L.; Szombathyne-Meszaros, Z.; Middleton, F.A. Alterations in serum microRNA in humans with alcohol use disorders impact cell proliferation and cell death pathways and predict structural and functional changes in brain. BMC Neurosci. 2015, 16, 55. [Google Scholar] [CrossRef] [PubMed]
- Novo-Veleiro, I.; González-Sarmiento, R.; Cieza-Borrella, C.; Pastor, I.; Laso, F.J.; Marcos, M. A genetic variant in the microRNA-146a gene is associated with susceptibility to alcohol use disorders. Eur. Psychiatry 2014, 29, 288–292. [Google Scholar] [CrossRef] [PubMed]
- Saunders, M.A.; Liang, H.; Li, W.H. Human polymorphism at microRNAs and microRNA target sites. Proc. Natl. Acad. Sci. USA 2007, 104, 3300–3305. [Google Scholar] [CrossRef] [PubMed]
- Saha, B.; Momen-Heravi, F.; Kodys, K.; Szabo, G. MicroRNA cargo of extracellular vesicles from alcohol-exposed monocytes signals naive monocytes to differentiate into M2 macrophages. J. Biol. Chem. 2016, 291, 149–159. [Google Scholar] [CrossRef] [PubMed]
- Saha, B.; Bruneau, J.C.; Kodys, K.; Szabo, G. Alcohol-induced miR-27a regulates differentiation and M2 macrophage polarization of normal human monocytes. J. Immunol. 2015, 194, 3079–3087. [Google Scholar] [CrossRef] [PubMed]
- Tapocik, J.D.; Ceniccola, K.; Mayo, C.L.; Schwandt, M.L.; Solomon, M.; Wang, B.D.; Luu, T.V.; Olender, J.; Harrigan, T.; Maynard, T.M.; et al. MicroRNAs are involved in the development of morphine-induced analgesic tolerance and regulate functionally relevant changes in serpini1. Front. Mol. Neurosci. 2016, 9, 20. [Google Scholar] [CrossRef] [PubMed]
- Sun, Q.; Gu, H.; Zeng, Y.; Xia, Y.; Wang, Y.; Jing, Y.; Yang, L.; Wang, B. Hsa-mir-27a genetic variant contributes to gastric cancer susceptibility through affecting miR-27a and target gene expression. Cancer Sci. 2010, 101, 2241–2247. [Google Scholar] [CrossRef] [PubMed]
- Song, B.; Yan, G.; Hao, H.; Yang, B. rs11671784 G/A and rs895819 A/G polymorphisms inversely affect gastric cancer susceptibility and miR-27a expression in a Chinese population. Med. Sci. Monit. 2014, 20, 2318–2326. [Google Scholar] [PubMed]
- Jiang, Y.; Lin, D.H.; Xu, J.P.; Chen, W.X.; Zheng, S.J.; Song, L. Genotype GG of rs895819 Functional polymorphism within miR-27a might increase genetic susceptibility to colorectal cancer in Han Chinese population. J. Clin. Lab. Anal. 2016, 30, 351–355. [Google Scholar] [CrossRef] [PubMed]
- Estruch, R.; Ros, E.; Salas-Salvadó, J.; Covas, M.I.; Corella, D.; Arós, F.; Gómez-Gracia, E.; Ruiz-Gutiérrez, V.; Fiol, M.; Lapetra, J.; et al. Primary prevention of cardiovascular disease with a mediterranean diet. N. Engl. J. Med. 2013, 368, 1279–1290. [Google Scholar] [CrossRef] [PubMed]
- Sotos-Prieto, M.; Guillén, M.; Portolés, O.; Sorlí, J.V.; González, J.I.; Asensio, E.M.; Corella, D. Association between the rs6950982 polymorphism near the SERPINE1 gene and blood pressure and lipid parameters in a high-cardiovascular-risk population: Interaction with Mediterranean diet. Genes Nutr. 2013, 8, 401–409. [Google Scholar] [CrossRef] [PubMed]
- Fernández-Ballart, J.D.; Piñol, J.L.; Zazpe, I.; Corella, D.; Carrasco, P.; Toledo, E.; Perez-Bauer, M.; Martínez-González, M.A.; Salas-Salvadó, J.; Martín-Moreno, J.M. Relative validity of a semi-quantitative food-frequency questionnaire in an elderly Mediterranean population of Spain. Br. J. Nutr. 2010, 103, 1808–1816. [Google Scholar] [CrossRef] [PubMed]
- Pearson, T.A. Alcohol and heart disease. Circulation 1996, 94, 3023–3025. [Google Scholar] [CrossRef] [PubMed]
- Bergmann, M.M.; Rehm, J.; Klipstein-Grobusch, K.; Boeing, H.; Schütze, M.; Drogan, D.; Overvad, K.; Tjønneland, A.; Halkjær, J.; Fagherazzi, G.; et al. The association of pattern of lifetime alcohol use and cause of death in the European prospective investigation into cancer and nutrition (EPIC) study. Int. J. Epidemiol. 2013, 42, 1772–1790. [Google Scholar] [CrossRef] [PubMed]
- Corella, D.; Tucker, K.; Lahoz, C.; Coltell, O.; Cupples, L.A.; Wilson, P.W.; Schaefer, E.J.; Ordovas, J.M. Alcohol drinking determines the effect of the APOE locus on LDL-cholesterol concentrations in men: The Framingham Offspring Study. Am. J. Clin. Nutr. 2001, 73, 736–745. [Google Scholar] [PubMed]
- Corella, D.; Carrasco, P.; Fitó, M.; Martínez-González, M.A.; Salas-Salvadó, J.; Arós, F.; Lapetra, J.; Guillén, M.; Ortega-Azorín, C.; Warnberg, J.; et al. Gene-environment interactions of CETP gene variation in a high cardiovascular risk Mediterranean population. J. Lipid Res. 2010, 51, 2798–2807. [Google Scholar] [CrossRef] [PubMed]
- Djoussé, L.; Ellison, R.C.; Beiser, A.; Scaramucci, A.; D’Agostino, R.B.; Wolf, P.A. Alcohol consumption and risk of ischemic stroke: The framingham study. Stroke 2002, 33, 907–912. [Google Scholar] [CrossRef] [PubMed]
- Sieri, S.; Krogh, V.; Saieva, C.; Grobbee, D.E.; Bergmann, M.; Rohrmann, S.; Tjønneland, A.; Ferrari, P.; Chloptsios, Y.; Dilis, V.; et al. Alcohol consumption patterns, diet and body weight in 10 European countries. Eur. J. Clin. Nutr. 2009, 63, S81–S100. [Google Scholar] [CrossRef] [PubMed]
- Mamdani, M.; Williamson, V.; McMichael, G.O.; Blevins, T.; Aliev, F.; Adkins, A.; Hack, L.; Bigdeli, T.; van der Vaart, A.D.; Web, B.T.; et al. Vladimirov integrating mRNA and miRNA weighted gene co-expression networks with eQTLs in the nucleus accumbens of subjects with alcohol dependence. PLoS ONE 2015, 10, e0137671. [Google Scholar] [CrossRef] [PubMed]
- Gardiner, A.S.; Gutierrez, H.L.; Luo, L.; Davies, S.; Savage, D.D.; Bakhireva, L.N.; Perrone-Bizzozero, N.I. Alcohol use during pregnancy is associated with specific alterations in MicroRNA levels in maternal serum. Alcohol. Clin. Exp. Res. 2016, 40, 826–837. [Google Scholar] [CrossRef] [PubMed]
- Sethupathy, P. Needles in the genetic haystack of lipid disorders: Single nucleotide polymorphisms in the microRNA regulome. J. Lipid Res. 2013, 54, 1168–1173. [Google Scholar] [CrossRef] [PubMed]
- Huan, T.; Rong, J.; Liu, C.; Zhang, X.; Tanriverdi, K.; Joehanes, R.; Chen, B.H.; Murabito, J.M.; Yao, C.; Courchesne, P.; et al. Genome-wide identification of microRNA expression quantitative trait loci. Nat. Commun. 2015, 6, 6601. [Google Scholar] [CrossRef] [PubMed]
- Bian, Q.; Chen, J.J.; Gu, J.P.; Xu, J. Association between pre-miR-27a functional polymorphism and risk of colorectal cancer in north Chinese Han population. Onco Targets Ther. 2015, 8, 3003–3007. [Google Scholar] [PubMed]
- Ma, J.Y.; Yan, H.J.; Yang, Z.H.; Gu, W. Rs895819 within miR-27a might be involved in development of non small cell lung cancer in the Chinese Han population. Asian Pac. J. Cancer Prev. 2015, 16, 1939–1944. [Google Scholar] [CrossRef] [PubMed]
- Boef, A.G.; Dekkers, O.M.; le Cessie, S. Mendelian randomization studies: A review of the approaches used and the quality of reporting. Int. J. Epidemiol. 2015, 44, 496–511. [Google Scholar] [CrossRef] [PubMed]
- Wang, J.; Wang, H.; Chen, Y.; Hao, P.; Zhang, Y. Alcohol ingestion and colorectal neoplasia: A meta-analysis based on a Mendelian randomization approach. Colorectal. Dis. 2011, 13, e71–e78. [Google Scholar] [CrossRef] [PubMed]
- Ewing, J.A. Detecting alcoholism: The CAGE questionnaire. JAMA 1984, 252, 1905–1907. [Google Scholar] [CrossRef] [PubMed]
- Schröder, H.; Fitó, M.; Estruch, R.; Martínez-González, M.A.; Corella, D.; Salas-Salvadó, J.; Lamuela-Raventós, R.; Ros, E.; Salaverría, I.; Fiol, M.; et al. A short screener is valid for assessing Mediterranean diet adherence among older Spanish men and women. J. Nutr. 2011, 141, 1140–1145. [Google Scholar] [CrossRef] [PubMed]
- Estruch, R.; Martínez-González, M.A.; Corella, D.; Salas-Salvadó, J.; Ruiz-Gutiérrez, V.; Covas, M.I.; Fiol, M.; Gómez-Gracia, E.; López-Sabater, M.C.; Vinyoles, E.; et al. Effects of a Mediterranean-style diet on cardiovascular risk factors: a randomized trial. Ann. Intern. Med. 2006, 145, 1–11. [Google Scholar] [CrossRef] [PubMed]

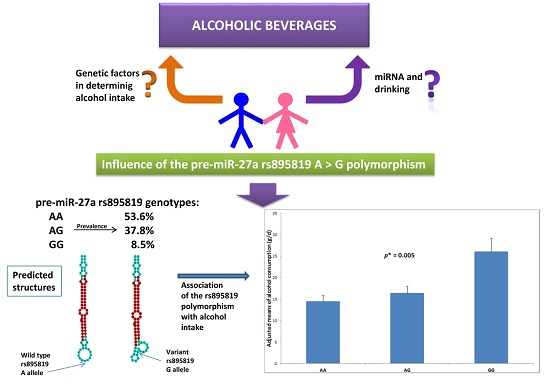
| pre-miR-27a-rs895819 A>G genotypes | |||||||||
|---|---|---|---|---|---|---|---|---|---|
| Variable | Total (n = 1007) | AA (n = 540) | AG (n = 381) | GG (n = 86) | p 2 | ||||
| Male sex: n, % | 368 | (36.5%) | 201 | (37.2%) | 137 | (36.0%) | 30 | (34.9%) | 0.876 |
| Type 2 diabetes: n, % 3 | 468 | (46.5%) | 243 | (45.0%) | 188 | (49.3%) | 37 | (43.0%) | 0.342 |
| Hypertension: n, % 4 | 844 | (83.8%) | 451 | (83.5%) | 320 | (84.0%) | 73 | (84.9%) | 0.944 |
| Dyslipidemia: n, % | 769 | (76.4%) | 408 | (75.6%) | 290 | (76.1%) | 71 | (82.6%) | 0.361 |
| Obesity: n, % 5 | 512 | (50.8%) | 269 | (49.8%) | 199 | (52.2%) | 44 | (51.2%) | 0.769 |
| Smokers: n, % | – | – | – | – | – | – | – | – | 0.504 |
| Current | 127 | (12.6%) | 67 | (12.4%) | 44 | (11.5%) | 16 | (18.6%) | – |
| Former | 234 | (23.2%) | 128 | (23.7%) | 88 | (23.1%) | 18 | (20.9%) | – |
| Never | 646 | (64.2%) | 345 | (63.9%) | 249 | (65.4%) | 52 | (60.5%) | – |
| Age (years) | 66.8 | (0.2) | 67.0 | (0.3) | 66.9 | (0.3) | 66.1 | (0.7) | 0.467 |
| Weight (kg) | 77.2 | (0.4) | 77.2 | (0.5) | 77.2 | (0.6) | 77.1 | (1.4) | 0.997 |
| BMI (kg/m2) | 30.6 | (0.1) | 30.7 | (0.2) | 30.7 | (0.2) | 30.4 | (0.5) | 0.842 |
| Waist circumference (cm) | 103.0 | (0.4) | 103.0 | (0.5) | 103.6 | (0.6) | 102.2 | (1.3) | 0.553 |
| SBP (mm Hg) | 147.1 | (0.7) | 147.0 | (0.9) | 147.8 | (1.1) | 144.5 | (2.2) | 0.444 |
| DBP (mm Hg) | 82.0 | (0.3) | 82.1 | (0.5) | 82.3 | (0.6) | 79.5 | (1.0) | 0.092 |
| Heart rate (bpm) | 72.4 | (0.3) | 72.1 | (0.4) | 72.8 | (0.6) | 72.3 | (1.1) | 0.678 |
| Total cholesterol (mg/dL) | 208.1 | (1.3) | 208.1 | (1.7) | 207.6 | (2.1) | 210.7 | (4.6) | 0.806 |
| LDL-C (mg/dL) | 129.4 | (1.1) | 129.2 | (1.5) | 129.3 | (1.9) | 130.6 | (4.0) | 0.946 |
| HDL-C (mg/dL) | 52.6 | (0.4) | 52.7 | (0.6) | 52.3 | (0.7) | 54.0 | (1.8) | 0.568 |
| Triglycerides (mg/dL) | 131.5 | (2.2) | 133.3 | (3.1) | 129.6 | (3.2) | 129.4 | (9.7) | 0.674 |
| Fasting glucose (mg/dL) | 120.4 | (1.3) | 120.3 | (1.8) | 120.9 | (2.0) | 118.1 | (3.6) | 0.843 |
| Energy intake (kcal/day) | 2210 | (20) | 2198 | (28) | 2221 | (31) | 2238 | (74) | 0.780 |
| Total fat (g/day) | 95.1 | (1.0) | 95.5 | (1.4) | 94.8 | (1.5) | 93.7 | (2.8) | 0.852 |
| Saturated fat (g/day) | 25.1 | (0.3) | 25.1 | (0.4) | 25.4 | (0.5) | 23.7 | (0.8) | 0.337 |
| MUFA (g/day) | 46.4 | (0.5) | 46.7 | (0.7) | 46.1 | (0.8) | 46.1 | (1.5) | 0.812 |
| PUFA (g/day) | 15.6 | (0.2) | 15.7 | (0.3) | 15.6 | (0.3) | 15.2 | (0.7) | 0.856 |
| Proteins (g/day) | 92.8 | (0.8) | 92.7 | (1.2) | 92.6 | (1.3) | 93.5 | (3.0) | 0.962 |
| Carbohydrates (g/day) | 235.6 | (2.6) | 232.6 | (3.5) | 239.1 | (4.2) | 239.3 | (10.9) | 0.463 |
| Adherence to the MedDiet (points) 6 | 8.4 | (0.1) | 8.5 | (0.1) | 8.4 | (0.1) | 8.8 | (0.2) | 0.246 |
| Physical activity (METs-min/day) | 169.8 | (5.5) | 169.6 | (7.8) | 173.1 | (8.7) | 156.3 | (15.8) | 0.721 |
| Genotypes | |||||||||
|---|---|---|---|---|---|---|---|---|---|
| Alcoholic Beverage 2,3 | Total (n = 1007) | AA (n = 540) | AG (n = 381) | GG (n = 86) | p 4,5 | ||||
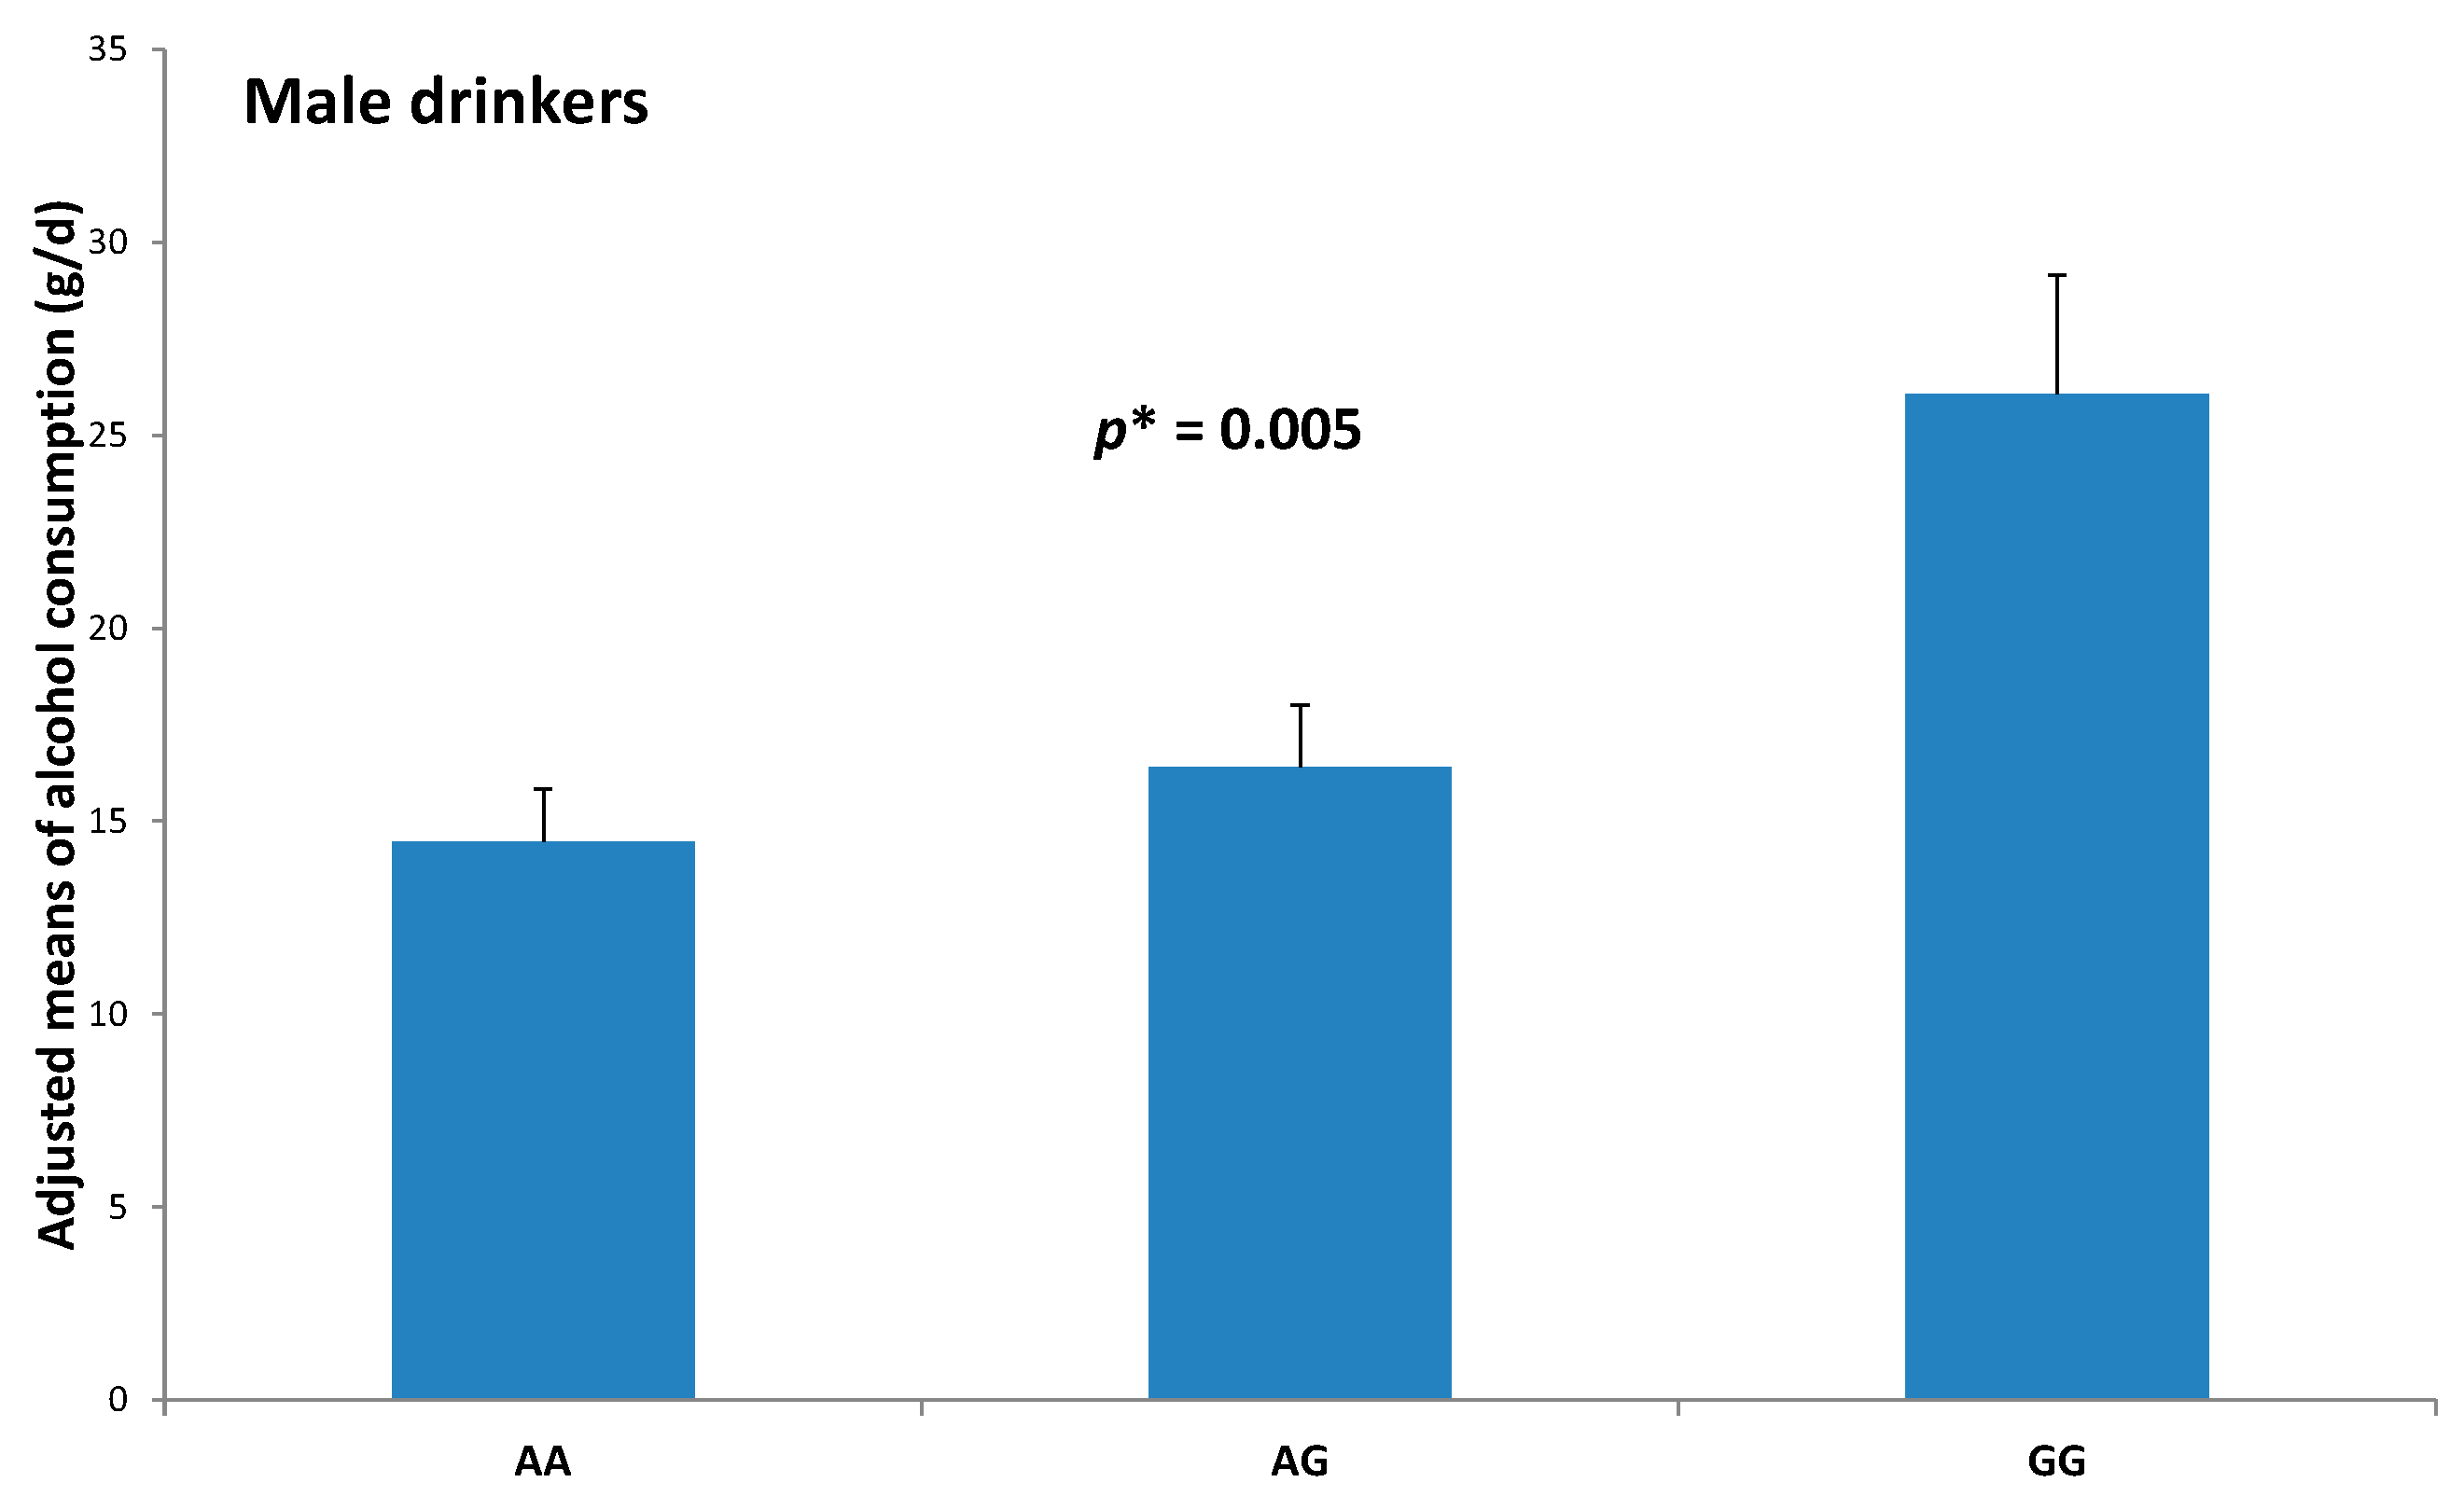
| Total alcohol (g/day) 2 | 5.8 | (0.3) | 5.2 | (4.4–6.0) | 5.9 | (4.8–6.9) | 9.1 | (5.6–12.6) | 0.020 |
| Total alcohol (g/day) 3 | – | – | 7.4 | (6.3–8.6) | 8.2 | (6.9–9.5) | 11.0 | (8.2–13.1) | 0.016 |
| Total wine (mL/day) 2 | 36.8 | (2.3) | 34.8 | (28.7–40.7) | 35.7 | (28.8–42.5) | 54.9 | (32.0–77.7) | 0.036 |
| Total wine (mL/day) 3 | – | – | 47.8 | (38.8–56.1) | 49.4 | (39.9–58.8) | 66.4 | (50.9–82.0) | 0.043 |
| Total beer (mL/day) 2 | 39.9 | (3.4) | 35.1 | (27.6–42.6) | 38.8 | (28.3–49.3) | 75.5 | (33.4–117.8) | 0.041 |
| Total beer (mL/day) 3 | – | – | 56.7 | (39.5–65.8) | 56.0 | (41.6–70.4) | 88.2 | (64.6–111.7) | 0.142 |
| Total spirits (mL/day) 2 | 2.0 | (0.3) | 1.4 | (0.8–1.9) | 2.6 | (0.9–3.8) | 2.9 | (0.9–5.0) | 0.172 |
| Total spirits (mL/day) 3 | – | – | 3.6 | (1.4–3.6) | 3.7 | (2.5–4.9) | 4.0 | (2.0–6.0) | 0.073 |
| Whole Population | Men | Women | ||||||||||||
|---|---|---|---|---|---|---|---|---|---|---|---|---|---|---|
| Alcohol Consumption | Non-Drinkers (0 g/Day) | Moderate (<26.4 g/Day for Men) (<13.2 g/Day for Women) | High (>26.4 g/Day for Men) (>13.2 g/Day for Women) | Non-Drinkers + Moderate | High | Non-Drinkers + Moderate | High | |||||||
| Genotypes | (n = 540) | (n = 381) | (n = 86) | (n = 315) | (n = 53) | (n = 616) | (n = 23) | |||||||
| p 3 polymorphism | 0.005 | – | – | – | – | 0.024 | – | – | 0.010 | – | – | |||
| AA: n (%) | 244 | (45.2%) | 264 | (48.9%) | 32 | (5.9%) | 178 | (88.6%) | 23 | (11.4%) | 330 | (97.3%) | 9 | (2.7%) |
| AG: n (%) | 160 | (42.0%) | 192 | (50.4%) | 29 | (7.6%) | 116 | (84.7%) | 21 | (15.3%) | 236 | (96.7%) | 8 | (3.3%) |
| GG: n (%) | 34 | (39.5%) | 37 | (43.0%) | 15 | (17.4%) | 21 | (70.0%) | 9 | (30.0%) | 50 | (89.3%) | 6 | (10.7%) |
| Whole Population | ||||||
|---|---|---|---|---|---|---|
| Polymorphism | Model 1 | Model 2 | ||||
| Genotypes | OR | 95% CI | p | OR | 95% CI | p |
| AA (n = 540) | 1.00 | (reference) | – | 1.00 | (reference) | – |
| AG (n = 381) | 1.34 | (0.79–2.29) | 0.276 | 1.45 | (0.81–2.53) | 0.190 |
| GG (n = 86) | 3.57 | (1.79–7.16) | <0.001 | 3.84 | (1.83–8.04) | <0.001 |
| Men | ||||||
| Polymorphism | Model 1 | Model 2 | ||||
| Genotypes | OR | 95% CI | p | OR | 95% CI | p |
| AA (n = 201) | 1.00 | (reference) | – | 1.00 | (reference) | – |
| AG (n = 137) | 1.40 | (0.73–2.64) | 0.311 | 1.52 | (0.78–2.99) | 0.220 |
| GG (n = 30) | 3.01 | (1.22–7.45) | 0.017 | 3.42 | (1.28–9.11) | 0.014 |
| Women | ||||||
| Polymorphism | Model 1 | Model 2 | ||||
| Genotypes | OR | 95% CI | p | OR | 95% CI | p |
| AA (n = 339) | 1.00 | (reference) | – | 1.00 | (reference) | – |
| AG (n = 244) | 1.24 | (0.47–3.27) | 0.660 | 1.44 | (0.52–3.96) | 0.486 |
| GG (n = 56) | 4.39 | (1.50–12.87) | 0.007 | 4.61 | (1.44–14.83) | 0.010 |
| Variable | % Drinker High 2 | Risk 3 | ||||
|---|---|---|---|---|---|---|
| Sex | AA + AG | GG | p 4 | OR | 95% CI | p 5 |
| Men (n = 368) | 13.0% | 30.0% | 0.011 | 2.84 | (1.12–7.17) | 0.028 |
| Women (n = 639) | 2.9% | 10.7% | 0.003 | 3.79 | (1.36–11.64) | 0.012 |
| p 6 for interaction: | 0.774 | |||||
| Variable | % Drinker High 2 | Risk 3 | ||||
| Obesity | AA + AG | GG | p 4 | OR | 95% CI | p 5 |
| Non-obese (n = 495) | 8.2% | 21.0% | 0.005 | 3.31 | (1.34–8.18) | 0.010 |
| Obese (n = 512) | 5.1% | 13.6% | 0.022 | 3.87 | (1.21–12.35) | 0.022 |
| p 6 for interaction: | 0.934 | |||||
| Adherence to MedDiet | AA + AG | GG | p 4 | OR | 95% CI | p 5 |
| Low < 9 (n = 511) | 5.1% | 17.1% | 0.002 | 4.56 | (1.71–14.34) | 0.003 |
| High ≥ 9 (n = 496) | 8.2% | 17.8% | 0.033 | 2.49 | (0.09–6.60) | 0.069 |
| p 6 for interaction: | 0.546 | |||||
| Variable | % Drinker High 2 | Risk 3 | ||||
| Diabetes | AA + AG | GG | p 4 | OR | 95% CI | p 5 |
| No (n = 539) | 9.0% | 24.5% | 0.001 | 3.56 | (1.54–8.23) | 0.003 |
| Yes (n = 468) | 3.9% | 8.1% | 0.221 | 2.06 | (0.52–8.18) | 0.304 |
| p 6 for interaction: | 0.547 | |||||
| Variable | % Drinker High 2 | Risk 3 | ||||
| Hypertension | AA + AG | GG | p 4 | OR | 95% CI | p 5 |
| No (n = 163) | 8.0% | 23.1% | 0.103 | 4.59 | (0.77–27.59) | 0.096 |
| Yes (n = 844) | 6.4% | 16.4% | 0.004 | 3.22 | (1.50–6.90) | 0.003 |
| p 6 for interaction: | 0.818 | |||||
© 2016 by the authors; licensee MDPI, Basel, Switzerland. This article is an open access article distributed under the terms and conditions of the Creative Commons Attribution (CC-BY) license (http://creativecommons.org/licenses/by/4.0/).
Share and Cite
Barragán, R.; Coltell, O.; Asensio, E.M.; Francés, F.; Sorlí, J.V.; Estruch, R.; Salas-Huetos, A.; Ordovas, J.M.; Corella, D. MicroRNAs and Drinking: Association between the Pre-miR-27a rs895819 Polymorphism and Alcohol Consumption in a Mediterranean Population. Int. J. Mol. Sci. 2016, 17, 1338. https://doi.org/10.3390/ijms17081338
Barragán R, Coltell O, Asensio EM, Francés F, Sorlí JV, Estruch R, Salas-Huetos A, Ordovas JM, Corella D. MicroRNAs and Drinking: Association between the Pre-miR-27a rs895819 Polymorphism and Alcohol Consumption in a Mediterranean Population. International Journal of Molecular Sciences. 2016; 17(8):1338. https://doi.org/10.3390/ijms17081338
Chicago/Turabian StyleBarragán, Rocío, Oscar Coltell, Eva M. Asensio, Francesc Francés, José V. Sorlí, Ramon Estruch, Albert Salas-Huetos, Jose M. Ordovas, and Dolores Corella. 2016. "MicroRNAs and Drinking: Association between the Pre-miR-27a rs895819 Polymorphism and Alcohol Consumption in a Mediterranean Population" International Journal of Molecular Sciences 17, no. 8: 1338. https://doi.org/10.3390/ijms17081338