
Serum Levels of MicroRNA-206 and Novel Mini-STR Assays for Carrier Detection in Duchenne Muscular Dystrophy


Abstract
:
1. Introduction
2. Results
2.1. Population Analysis
2.2. STRs for Carrier Detection
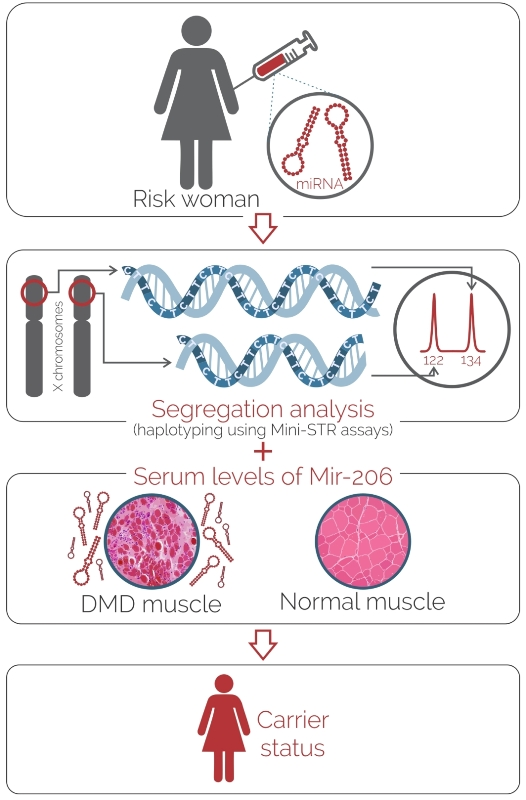
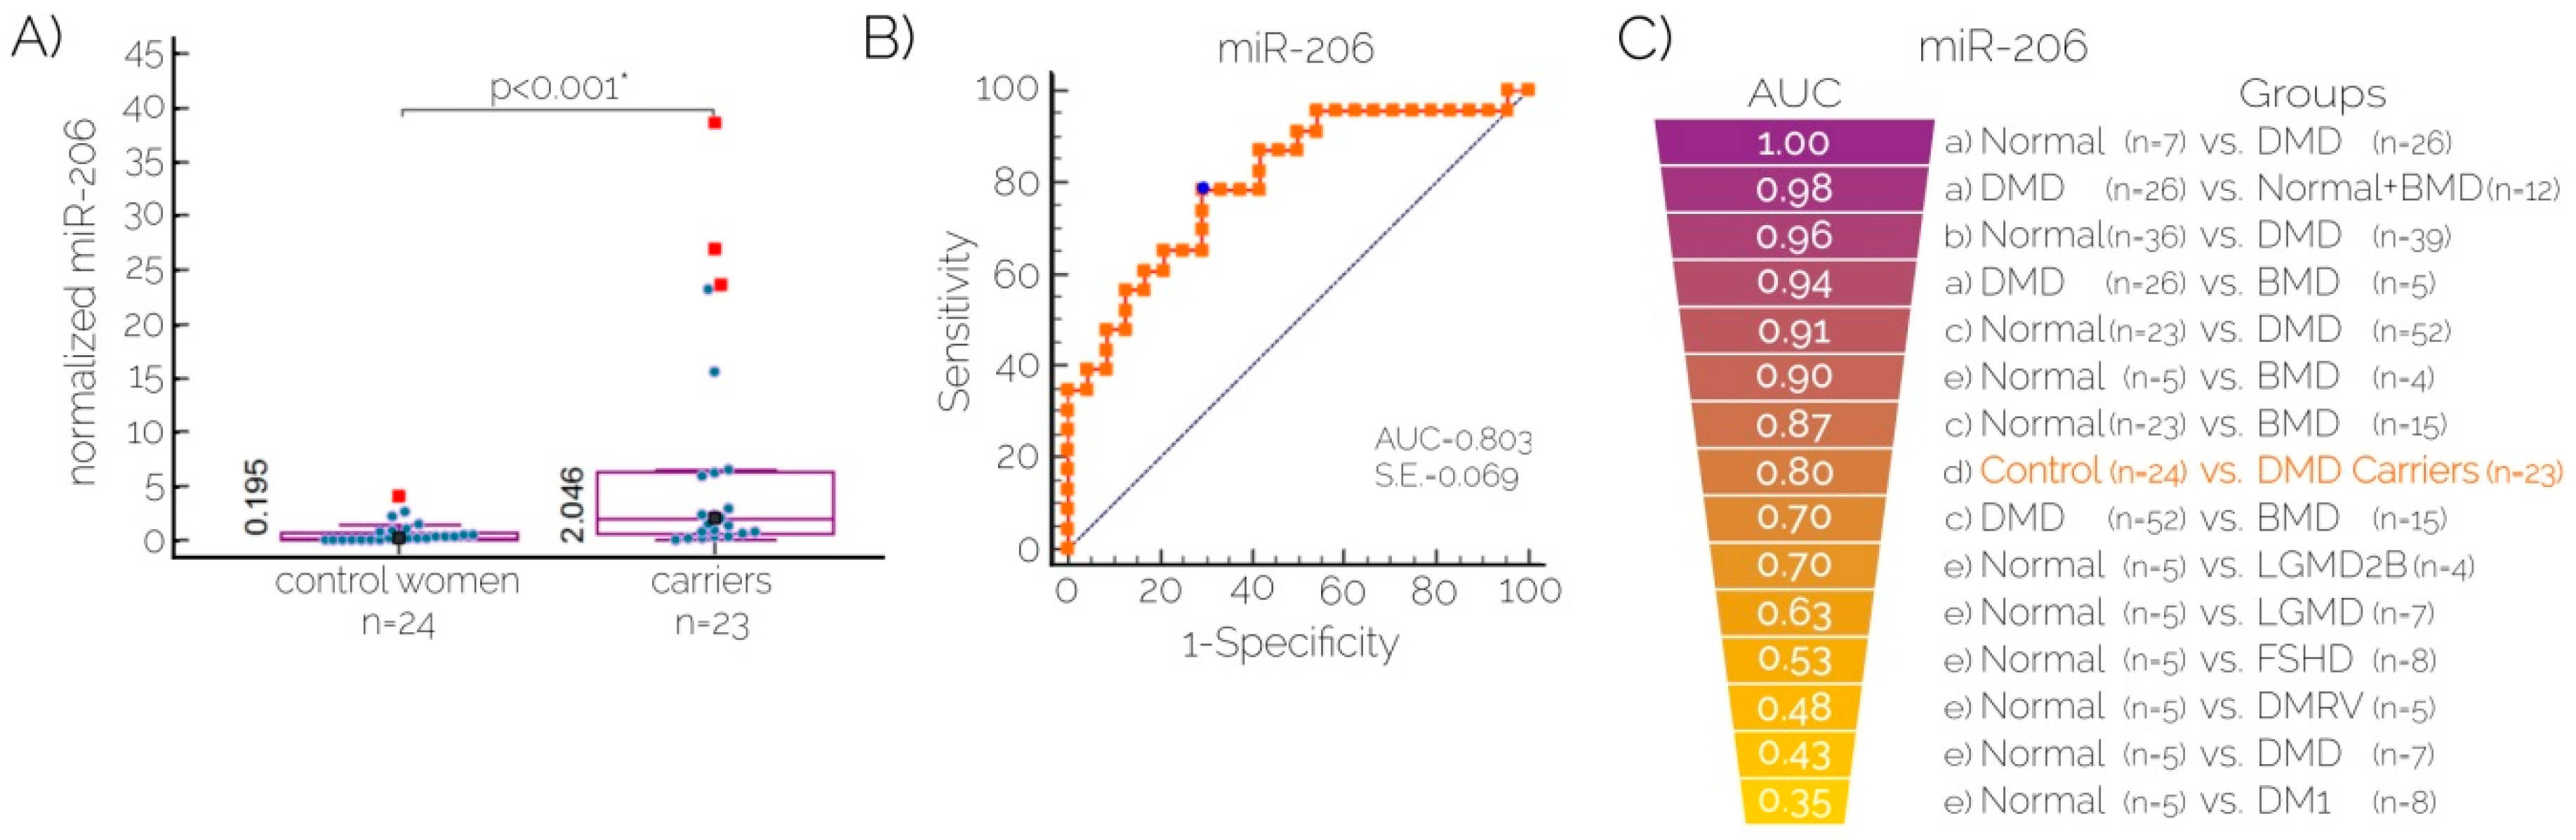
2.3. Quantitation of Serum Levels of MicroRNA-206 for Carrier Detection
3. Discussion
4. Materials and Methods
4.1. Sampling, DNA Isolation and Quantification
4.2. Mutation Detection by MLPA
4.3. Mini-STR Assay Design and Genotyping
4.4. Quantitation of MicroRNAs by Real Time PCR
4.5. Statistical Analysis
Acknowledgments
Author Contributions
Conflicts of Interest
References
- Muntoni, F.; Torelli, S.; Ferlini, A. Dystrophin and mutations: One gene, several proteins, multiple phenotypes. Lancet Neurol. 2003, 2, 731–740. [Google Scholar] [CrossRef]
- Lopez-Hernandez, L.B.; Ayala-Madrigal, M.L.; van Heusden, D.; Estrada-Mena, F.J.; Canto, P.; Sandoval-Ramirez, L.; Gomez-Diaz, B.; Coral-Vazquez, R.M. [Improvements in the diagnosis of dystrophinopathies: What have we learnt in these last 20 years?]. Revista de Neurologia 2011, 52, 239–249. [Google Scholar] [PubMed]
- Imbornoni, L.; Price, E.T.; Andrews, J.; Meaney, F.J.; Ciafaloni, E.; Cunniff, C. Diagnostic and clinical characteristics of early-manifesting females with duchenne or becker muscular dystrophy. Am. J. Med. Genet. A 2014, 164A, 2769–2774. [Google Scholar] [CrossRef] [PubMed]
- Mavrogeni, S.; Bratis, K.; Papavasiliou, A.; Skouteli, E.; Karanasios, E.; Georgakopoulos, D.; Kolovou, G.; Papadopoulos, G. Cmr detects subclinical cardiomyopathy in mother-carriers of duchenne and becker muscular dystrophy. JACC Cardiovasc. Imaging 2013, 6, 526–528. [Google Scholar] [CrossRef] [PubMed]
- Mercier, S.; Toutain, A.; Toussaint, A.; Raynaud, M.; de Barace, C.; Marcorelles, P.; Pasquier, L.; Blayau, M.; Espil, C.; Parent, P.; et al. Genetic and clinical specificity of 26 symptomatic carriers for dystrophinopathies at pediatric age. Eur. J. Hum. Genet. 2013, 21, 855–863. [Google Scholar] [CrossRef] [PubMed]
- Mathews, K.D.; Cunniff, C.; Kantamneni, J.R.; Ciafaloni, E.; Miller, T.; Matthews, D.; Cwik, V.; Druschel, C.; Miller, L.; Meaney, F.J.; et al. Muscular dystrophy surveillance tracking and research network (md starnet): Case definition in surveillance for childhood-onset duchenne/becker muscular dystrophy. J. Child. Neurol. 2010, 25, 1098–1102. [Google Scholar] [CrossRef] [PubMed]
- Giliberto, F.; Ferreiro, V.; Massot, F.; Ferrer, M.; Francipane, L.; Szijan, I. Prenatal diagnosis of duchenne/becker muscular dystrophy by short tandem repeat segregation analysis in argentine families. Muscle Nerve 2011, 43, 510–517. [Google Scholar] [CrossRef] [PubMed]
- Fischer, C.; Kruger, J.; Gross, W. Riscalw: A windows program for risk calculation in families with duchenne muscular dystrophy. Ann. Hum. Genet. 2006, 70, 249–253. [Google Scholar] [CrossRef] [PubMed]
- Grubwieser, P.; Muhlmann, R.; Berger, B.; Niederstatter, H.; Pavlic, M.; Parson, W. A new “ministr-multiplex” displaying reduced amplicon lengths for the analysis of degraded DNA. Int. J. Legal. Med. 2006, 120, 115–120. [Google Scholar] [CrossRef] [PubMed]
- Hashim, R.; Shaheen, S.; Ahmad, S.; Sattar, A.; Khan, F.A. Comparison of serum creatine kinase estimation with short tandem repeats based linkage analysis in carriers and affected children of duchenne muscular dystrophy. J. Ayub Med. Coll. Abbottabad 2011, 23, 125–128. [Google Scholar] [PubMed]
- Cacchiarelli, D.; Legnini, I.; Martone, J.; Cazzella, V.; D’Amico, A.; Bertini, E.; Bozzoni, I. Mirnas as serum biomarkers for duchenne muscular dystrophy. EMBO Mol. Med. 2011, 3, 258–265. [Google Scholar] [CrossRef] [PubMed]
- Li, X.; Li, Y.; Zhao, L.; Zhang, D.; Yao, X.; Zhang, H.; Wang, Y.C.; Wang, X.Y.; Xia, H.; Yan, J.; et al. Circulating muscle-specific mirnas in duchenne muscular dystrophy patients. Mol. Ther. Nucleic Acids 2014, 3, e177. [Google Scholar] [CrossRef] [PubMed]
- Hoogerwaard, E.M.; Ginjaar, I.B.; Bakker, E.; de Visser, M. Dystrophin analysis in carriers of duchenne and becker muscular dystrophy. Neurology 2005, 65, 1984–1986. [Google Scholar] [CrossRef] [PubMed]
- Cai, X.; Janku, F.; Zhan, Q.; Fan, J.B. Accessing genetic information with liquid biopsies. Trends Genet. 2015, 31, 564–575. [Google Scholar] [CrossRef] [PubMed]
- Rubi-Castellanos, R.; Martinez-Cortes, G.; Munoz-Valle, J.F.; Gonzalez-Martin, A.; Cerda-Flores, R.M.; Anaya-Palafox, M.; Rangel-Villalobos, H. Pre-hispanic mesoamerican demography approximates the present-day ancestry of mestizos throughout the territory of mexico. Am. J. Phys. Anthropol. 2009, 139, 284–294. [Google Scholar] [CrossRef] [PubMed]
- Moreno-Estrada, A.; Gignoux, C.R.; Fernandez-Lopez, J.C.; Zakharia, F.; Sikora, M.; Contreras, A.V.; Acuna-Alonzo, V.; Sandoval, K.; Eng, C.; Romero-Hidalgo, S.; et al. Human genetics. The genetics of mexico recapitulates native american substructure and affects biomedical traits. Science 2014, 344, 1280–1285. [Google Scholar] [CrossRef] [PubMed]
- Feener, C.A.; Boyce, F.M.; Kunkel, L.M. Rapid detection of ca polymorphisms in cloned DNA: Application to the 5’ region of the dystrophin gene. Am. J. Hum. Genet. 1991, 48, 621–627. [Google Scholar] [PubMed]
- King, S.C.; Roche, A.L.; Passos-Bueno, M.R.; Takata, R.; Zatz, M.; Cockburn, D.J.; Seller, A.; Stapleton, P.M.; Love, D.R. Molecular characterization of further dystrophin gene microsatellites. Mol. Cell. Probes 1995, 9, 361–370. [Google Scholar] [CrossRef]
- Sun, R.F.; Zhu, Y.S.; Feng, J.L.; Tian, Z.; Kuang, W.J.; Liu, Y.; Zhang, H.B.; Li, S.B. Polymorphisms of three new microsatellite sites of the dystrophin gene. Genet. Mol. Res. 2011, 10, 744–751. [Google Scholar] [CrossRef] [PubMed]
- Clemens, P.R.; Fenwick, R.G.; Chamberlain, J.S.; Gibbs, R.A.; de Andrade, M.; Chakraborty, R.; Caskey, C.T. Carrier detection and prenatal diagnosis in duchenne and becker muscular dystrophy families, using dinucleotide repeat polymorphisms. Am. J. Hum. Genet. 1991, 49, 951–960. [Google Scholar] [PubMed]
- Dib, C.; Faure, S.; Fizames, C.; Samson, D.; Drouot, N.; Vignal, A.; Millasseau, P.; Marc, S.; Hazan, J.; Seboun, E.; et al. A comprehensive genetic map of the human genome based on 5,264 microsatellites. Nature 1996, 380, 152–154. [Google Scholar] [CrossRef] [PubMed]
- Matsumoto, T.; Niikawa, N. Eight novel microsatellite markers in the 3’ region of the dystrophin gene useful for diagnosis of duchenne muscular dystrophy. Prenat. Diagn. 2004, 24, 1014–1015. [Google Scholar] [CrossRef] [PubMed]
- Hu, J.; Kong, M.; Ye, Y.; Hong, S.; Cheng, L.; Jiang, L. Serum miR-206 and other muscle-specific micrornas as non-invasive biomarkers for duchenne muscular dystrophy. J. Neurochem. 2014, 129, 877–883. [Google Scholar] [CrossRef] [PubMed]
- Matsuzaka, Y.; Kishi, S.; Aoki, Y.; Komaki, H.; Oya, Y.; Takeda, S.; Hashido, K. Three novel serum biomarkers, miR-1, miR-133a, and miR-206 for limb-girdle muscular dystrophy, facioscapulohumeral muscular dystrophy, and becker muscular dystrophy. Environ. Health Prev. Med. 2014, 19, 452–458. [Google Scholar] [CrossRef] [PubMed]
- Aartsma-Rus, A.; Ferlini, A.; Vroom, E. Biomarkers and surrogate endpoints in duchenne: Meeting report. Neuromuscul. Disord. 2014, 24, 743–745. [Google Scholar] [CrossRef] [PubMed]
- Mazzone, E.; Martinelli, D.; Berardinelli, A.; Messina, S.; D’Amico, A.; Vasco, G.; Main, M.; Doglio, L.; Politano, L.; Cavallaro, F.; et al. North star ambulatory assessment, 6-minute walk test and timed items in ambulant boys with duchenne muscular dystrophy. Neuromuscul. Disord.: NMD 2010, 20, 712–716. [Google Scholar] [CrossRef] [PubMed]
- Larrea, E.; Sole, C.; Manterola, L.; Goicoechea, I.; Armesto, M.; Arestin, M.; Caffarel, M.M.; Araujo, A.M.; Araiz, M.; Fernandez-Mercado, M.; et al. New concepts in cancer biomarkers: Circulating mirnas in liquid biopsies. Int. J. Mol. Sci. 2016, 17, 627. [Google Scholar] [CrossRef] [PubMed]
- Rao, M.V.; Sindhav, G.M.; Mehta, J.J. Duchenne/becker muscular dystrophy: A report on clinical, biochemical, and genetic study in gujarat population, india. Ann. Indian Acad. Neurol. 2014, 17, 303–307. [Google Scholar] [CrossRef] [PubMed]
- Ayoglu, B.; Chaouch, A.; Lochmuller, H.; Politano, L.; Bertini, E.; Spitali, P.; Hiller, M.; Niks, E.H.; Gualandi, F.; Ponten, F.; et al. Affinity proteomics within rare diseases: A bio-nmd study for blood biomarkers of muscular dystrophies. EMBO Mol. Med. 2014, 6, 918–936. [Google Scholar] [CrossRef] [PubMed]
- Anaya-Segura, M.A.; Garcia-Martinez, F.A.; Montes-Almanza, L.A.; Diaz, B.G.; Avila-Ramirez, G.; Alvarez-Maya, I.; Coral-Vazquez, R.M.; Mondragon-Teran, P.; Escobar-Cedillo, R.E.; Garcia-Calderon, N.; et al. Non-invasive biomarkers for duchenne muscular dystrophy and carrier detection. Molecules 2015, 20, 11154–11172. [Google Scholar] [CrossRef] [PubMed]
- Zaharieva, I.T.; Calissano, M.; Scoto, M.; Preston, M.; Cirak, S.; Feng, L.; Collins, J.; Kole, R.; Guglieri, M.; Straub, V.; et al. Dystromirs as serum biomarkers for monitoring the disease severity in duchenne muscular dystrophy. PLoS ONE 2013, 8, e80263. [Google Scholar] [CrossRef] [PubMed]
- Ma, G.; Wang, Y.; Li, Y.; Cui, L.; Zhao, Y.; Zhao, B.; Li, K. MiR-206, a key modulator of skeletal muscle development and disease. Int. J. Biol. Sci. 2015, 11, 345–352. [Google Scholar] [CrossRef] [PubMed]
- Baird, M.F.; Graham, S.M.; Baker, J.S.; Bickerstaff, G.F. Creatine-kinase- and exercise-related muscle damage implications for muscle performance and recovery. J. Nutr. Metab. 2012, 2012, 13. [Google Scholar] [CrossRef] [PubMed]
- Abbs, S.; Tuffery-Giraud, S.; Bakker, E.; Ferlini, A.; Sejersen, T.; Mueller, C.R. Best practice guidelines on molecular diagnostics in duchenne/becker muscular dystrophies. Neuromuscul. Disord.: NMD 2010, 20, 422–427. [Google Scholar] [CrossRef] [PubMed]
- Aghanoori, M.R.; Vafaei, H.; Kavoshi, H.; Mohamadi, S.; Goodarzi, H.R. Sex determination using free fetal DNA at early gestational ages: A comparison between a modified mini-str genotyping method and real-time pcr. Am. J. Obstet. Gynecol. 2012, 207, 202.e1–202.e8. [Google Scholar] [CrossRef] [PubMed]
- Gustincich, S.; Manfioletti, G.; del Sal, G.; Schneider, C.; Carninci, P. A fast method for high-quality genomic DNA extraction from whole human blood. Biotechniques 1991, 11, 298–300, 302. [Google Scholar] [PubMed]
- Lopez-Hernandez, L.B.; Gomez-Diaz, B.; Luna-Angulo, A.B.; Anaya-Segura, M.; Bunyan, D.J.; Zuniga-Guzman, C.; Escobar-Cedillo, R.E.; Roque-Ramirez, B.; Ruano-Calderon, L.A.; Rangel-Villalobos, H.; et al. Comparison of mutation profiles in the duchenne muscular dystrophy gene among populations: Implications for potential molecular therapies. Int. J. Mol. Sci. 2015, 16, 5334–5346. [Google Scholar] [CrossRef] [PubMed]
- Butler, J.M. Constructing str multiplex assays. Methods Mol. Biol. 2005, 297, 53–66. [Google Scholar] [PubMed]
- Pfaffl, M.W. Quantification Strategies in Real-Time pcr.; Bustin, S.A., Ed.; International University Line: La Jolla, CA, USA, 2002. [Google Scholar]
- Tereba, A. Tools for Analysis of Population Statistics; Promega Corporation: Fitchburg, WI, USA, 1999; pp. 14–16. [Google Scholar]
- Excoffier, L.; Lischer, H.E. Arlequin suite ver 3.5: A new series of programs to perform population genetics analyses under linux and windows. Mol. Ecol. Resour. 2010, 10, 564–567. [Google Scholar] [CrossRef] [PubMed]


| STR loci | North | West | Southeast | |||||||||
|---|---|---|---|---|---|---|---|---|---|---|---|---|
| HE | HO | NA | HWE p-Value | HE | HO | NA | HWE p-Value | HE | HO | NA | HWE p-Value | |
| DXS1242 | 0.765 | 0.722 | 8 | 0.5349 | 0.742 | 0.576 | 8 | 0.0581 | 0.713 | 0.848 | 8 | 0.1857 |
| 5′-5n4 | 0.751 | 0.786 | 12 | 0.9521 | 0.763 | 0.720 | 13 | 0.1182 | 0.578 | 0.442 | 9 | 0.0419 |
| 5′-7n4 | 0.508 | 0.529 | 5 | 1.0000 | 0.665 | 0.833 | 7 | 0.0127 | 0.566 | 0.769 | 6 | 0.3488 |
| DXSDMD-In30 | 0.500 | 0.500 | 5 | 1.0000 | 0.503 | 0.423 | 5 | 0.4792 | 0.505 | 0.396 | 7 | 0.1583 |
| DXS1237 | 0.815 | 0.615 | 9 | 0.2737 | 0.754 | 0.500 | 10 | 0.0141 | 0.723 | 0.578 | 11 | 0.0229 |
| DXS997 | 0.575 | 0.750 | 5 | 0.2965 | 0.475 | 0.389 | 6 | 0.3778 | 0.373 | 0.333 | 6 | 0.1780 |
| DXS1236 | 0.862 | 0.889 | 14 | 0.9764 | 0.800 | 0.969 | 13 | 0.9764 | 0.809 | 0.909 | 14 | 0.9764 |
| DXSDMD-In60 | 0.652 | 0.667 | 7 | 0.4278 | 0.613 | 0.500 | 7 | 0.4278 | 0.647 | 0.627 | 8 | 0.4278 |
| DI623 | 0.766 | 0.647 | 14 | 0.6746 | 0.776 | 0.613 | 13 | 0.2555 | 0.746 | 0.791 | 15 | 0.6673 |
| DXS1234 | 0.675 | 0.389 | 6 | 0.0931 | 0.467 | 0.406 | 4 | 0.1117 | 0.539 | 0.290 | 5 | 0.0109 |
| STR loci | Mexico | Other Populations | Reference | |||
|---|---|---|---|---|---|---|
| North | West | Southeast | ||||
| DXS1242 | 0.77 | 0.80 | 0.70 | 0.77 | USA | [17] |
| 5′-5n4 | 0.73 | 0.78 | 0.58 | 0.64 | New Zealand | [18] |
| 5′-7n4 | 0.62 | 0.69 | 0.62 | 0.52 | New Zealand | [18] |
| DXSDMD-In30 | 0.61 | 0.56 | 0.63 | 0.65 | China | [19] |
| DXS1237 | 0.82 | 0.78 | 0.73 | 0.89 | USA | [20] |
| DXS997 | 0.67 | 0.58 | 0.53 | 0.70 | France | [21] |
| DXS1236 | 0.88 | 0.87 | 0.88 | 0.93 | USA | [20] |
| DXSDMD-In60 | 0.76 | 0.77 | 0.77 | 0.69 | China | [19] |
| DI623 | 0.88 | 0.87 | 0.87 | 0.91 | Japan | [22] |
| DXS1234 | 0.74 | 0.52 | 0.55 | 0.34 | Japan | [22] |
| Family | Case Description | Applicability of STRs Indirect Haplotyping Analysis | Concluding Remarks |
|---|---|---|---|
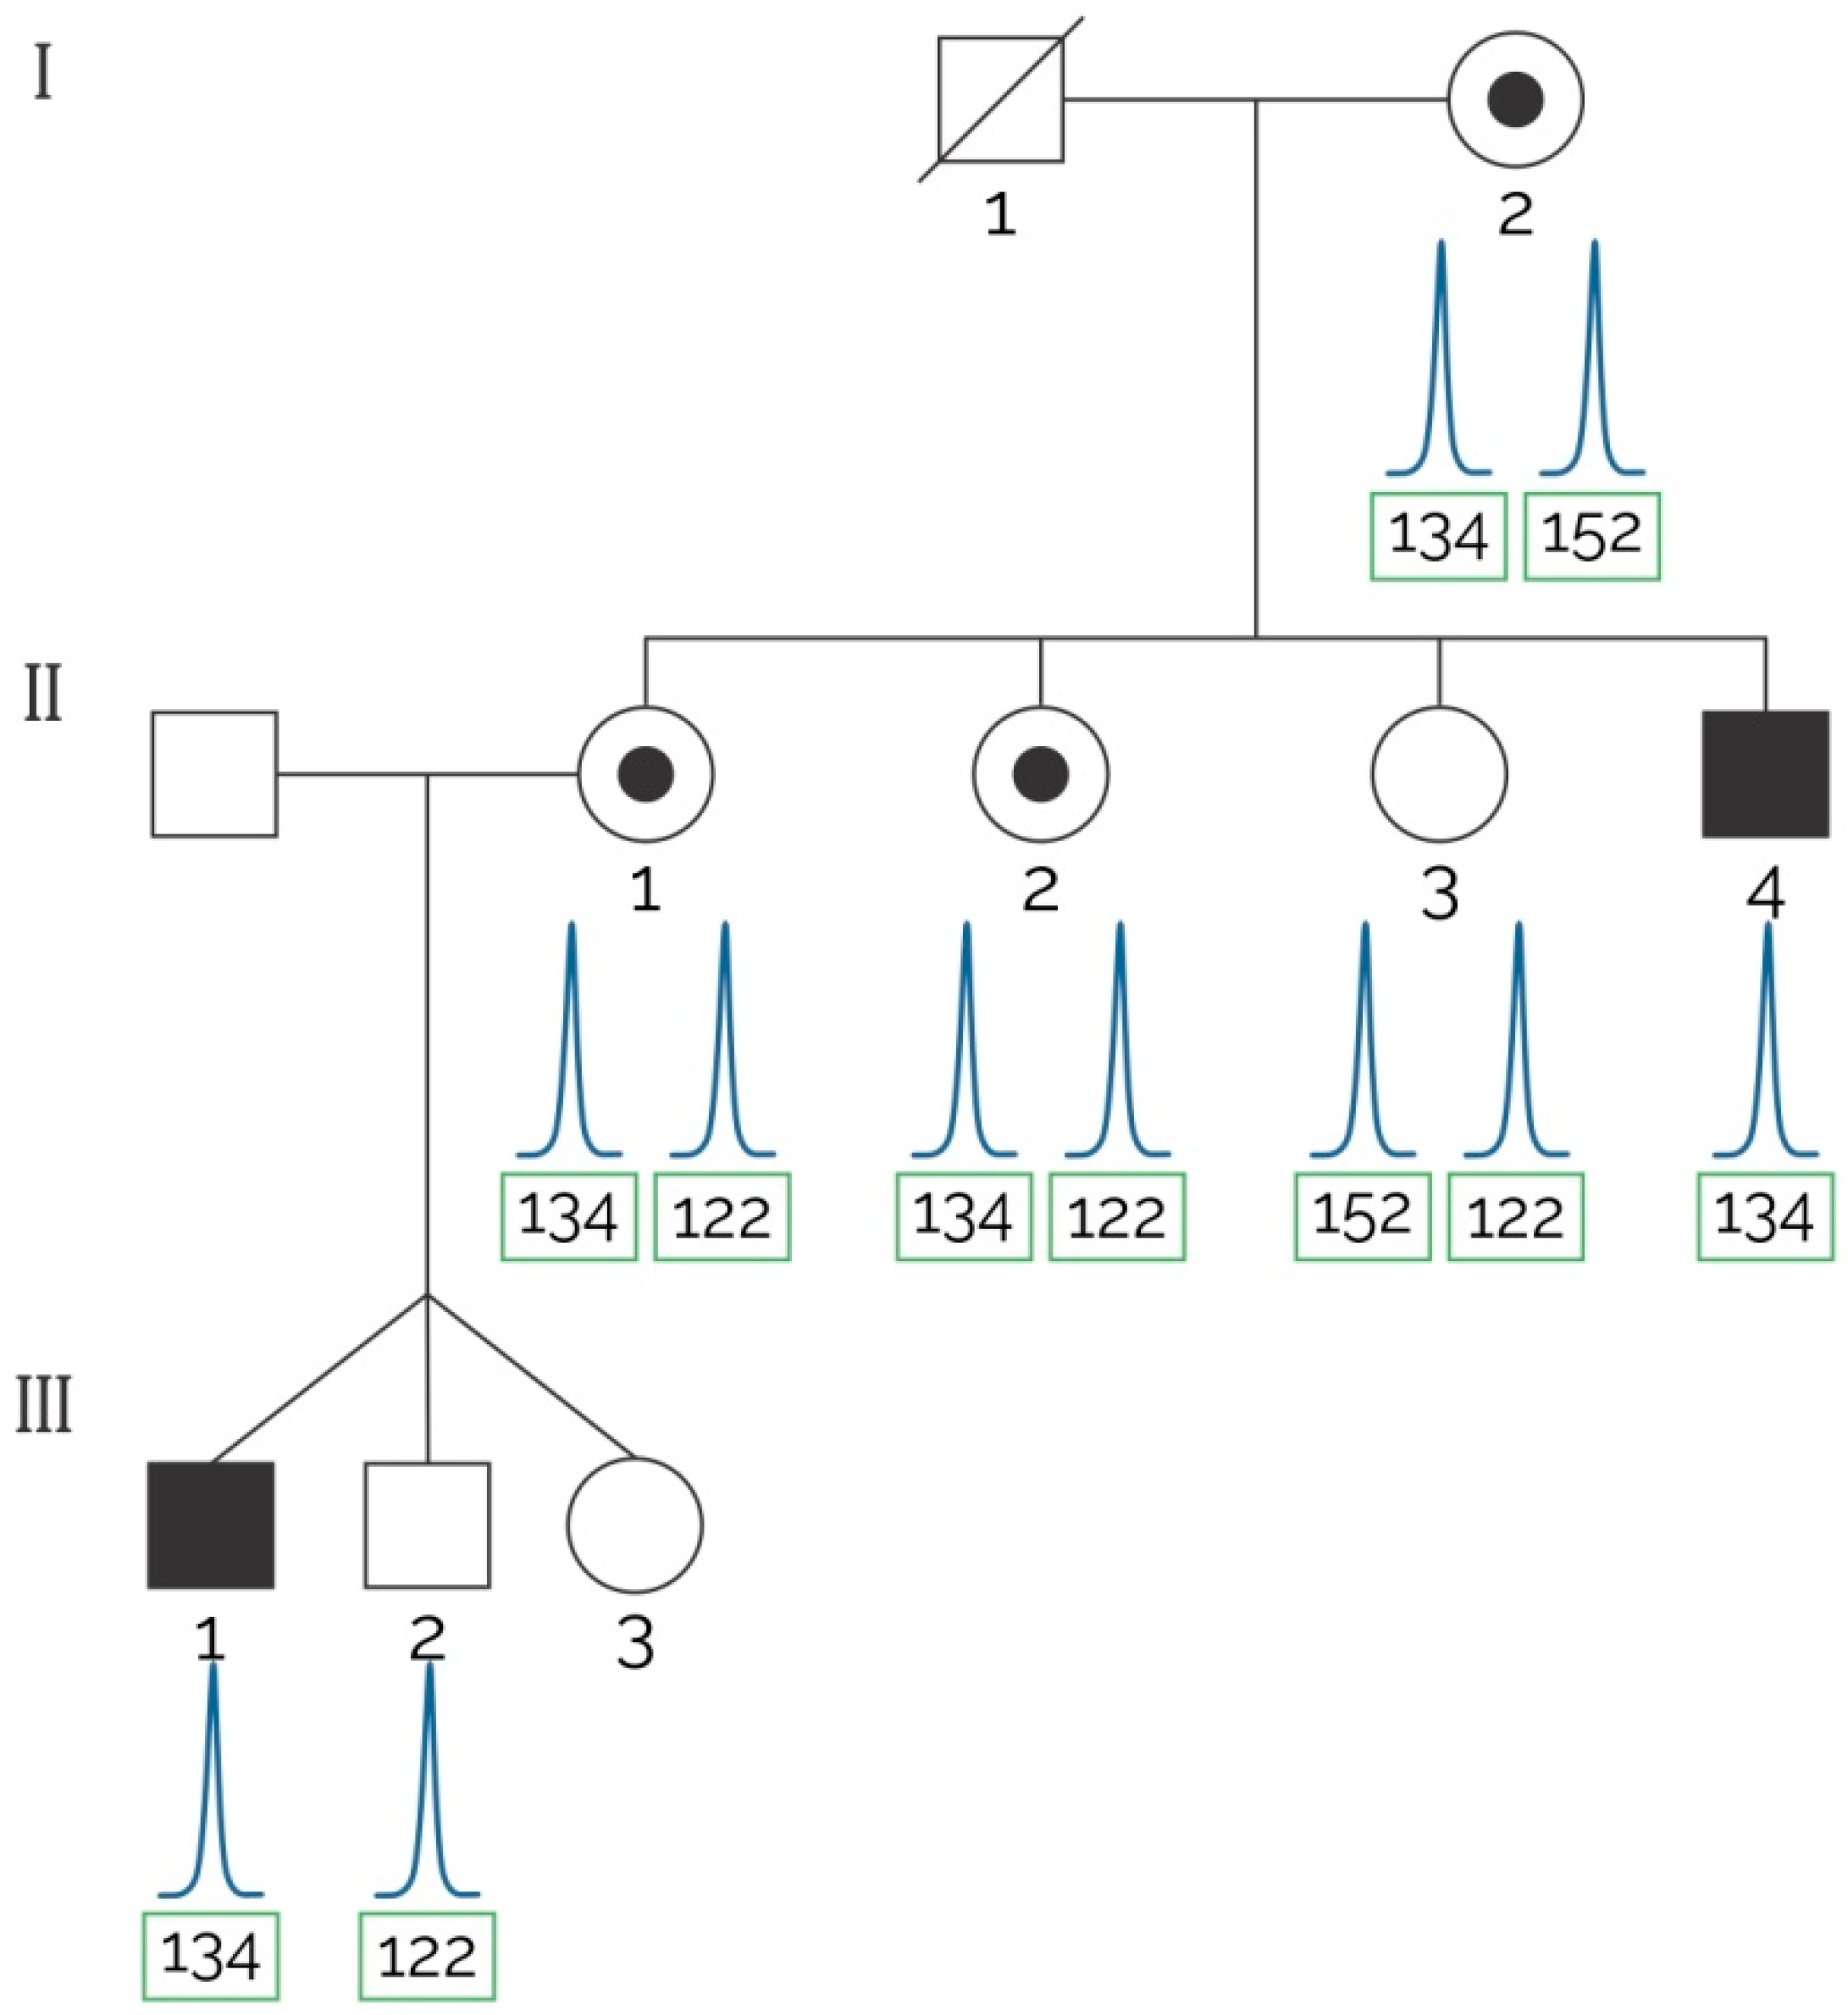
| 1 | Three sisters of an index case with positive FH and two male children (triplets) were tested by MLPA and the assay proposed herein to detect the at-risk haplotype (see Figure 2). | Informative markers: 5′5n4, DXSDMD-In30, DXS1237, DXS1236, DI623. | MLPA confirmed a deletion of exons 6–7 that segregated with the at-risk haplotype traced with our assay. Two out of three sisters of the index case were carriers of the at-risk haplotype. |
| 2 | Two aunts of an index case with positive FH in which a mutation was not found after MLPA analysis solicited genetic testing. | Informative markers: 5′-5n4, 5′-7n4, DXSDMD-In30, DXS1236, DI623. | Both analyzed females were non-carriers of the at-risk haplotype; all the obligate carriers shared the at-risk haplotype found in the index case. |
| 3 | Three aunts of an index case with positive FH in which a mutation was not found after MLPA analysis solicited genetic testing. | Informative markers: DXS1242, 5′-7n4, DXS1237, DXS1236, DXSDMD-In60, DXSDMD-In30, DI623. | None of the analyzed females were carriers of the at-risk haplotype. Next-generation sequencing confirmed that a point mutation (stop codon) in exon 30 co-segregated with the at-risk haplotype. |
| Marker | Locus | Primer Sequences (5′→3′) | Fluorophore | PCR Product (bp) | Conditions for Multiplex STRs Assays PCR | ||
|---|---|---|---|---|---|---|---|
| Denaturation | Annealing | Extension | |||||
| DX997 | Intron 48 | AGCTGGCTTTATTTTAAGAGGACA | FAM | 88 | 95 °C, 25 s | 64 °C, 30 s | 72 °C, 30 s |
| GGGTAGCCTTCCAAGAATAGG | |||||||
| DXS1237 | Intron 45 | GGCTATAATTCTTTAACTTTGGCAAG | FAM | 169 | |||
| CCACCTCTTTCCCTCTT | |||||||
| DXS1236 | Intron 49 | CGTTTACCAGCTCAAAATCTCAAC | PET | 111 | 95 °C, 18 s | 62.5 °C, 20 s | 72 °C, 15 s |
| GGCTTTGGCCATACAGAAAA | |||||||
| DI623 | Intron 62 | CGAGACACCCCACCTCTG | FAM | 140 | |||
| GCCATGGTGAATGATCAGAAA | |||||||
| 5′-5n4 | Intron 4 | GAGAGAAGGGAAAATGATGAATAAAA | VIC | 148 | |||
| TGTCAGAACTTTGTCACCTGTCTT | |||||||
| 5′-7n4 | Intron 25 | CTTTTAAGGCAGTTGGTGAAGC | PET | 181 | |||
| TCCAGGATCCAACAATATCTCA | |||||||
| DXSDMD-In30 | Intron 30 | GTTAGTCCCTATTCTATTCCTTTC | PET | 162 | 95 °C, 30 s | 57 °C, 40 s | 72 °C, 30 s |
| AAGAATGCCACCAAAATGAC | |||||||
| DXSDMD-In60 | Intron 60 | CGAGGGGATCAGGGTAATA | NED | 136 | |||
| CTGTTCTCTTCTCTGGTCATCA | |||||||
| DXS1234 | Region 3′ | CTGTTTGCGACATTGGCTAT | VIC | 151 | 95 °C, 20 s | 57 °C, 40 s | 72 °C, 30 s |
| GCAAACATCATGGTGATAACTGA | |||||||
| DXS1242 | Region 5′ | CAAAAATCAAATGGAAGTAGAATAGC | NED | 112 | 95 °C, 30 s | 59 °C, 50 s | 72 °C, 40 s |
| TCGCTATTCTGAAATAGTGTTTTCC | |||||||
© 2016 by the authors; licensee MDPI, Basel, Switzerland. This article is an open access article distributed under the terms and conditions of the Creative Commons Attribution (CC-BY) license (http://creativecommons.org/licenses/by/4.0/).
Share and Cite
Anaya-Segura, M.A.; Rangel-Villalobos, H.; Martínez-Cortés, G.; Gómez-Díaz, B.; Coral-Vázquez, R.M.; Zamora-González, E.O.; García, S.; López-Hernández, L.B. Serum Levels of MicroRNA-206 and Novel Mini-STR Assays for Carrier Detection in Duchenne Muscular Dystrophy. Int. J. Mol. Sci. 2016, 17, 1334. https://doi.org/10.3390/ijms17081334
Anaya-Segura MA, Rangel-Villalobos H, Martínez-Cortés G, Gómez-Díaz B, Coral-Vázquez RM, Zamora-González EO, García S, López-Hernández LB. Serum Levels of MicroRNA-206 and Novel Mini-STR Assays for Carrier Detection in Duchenne Muscular Dystrophy. International Journal of Molecular Sciences. 2016; 17(8):1334. https://doi.org/10.3390/ijms17081334
Chicago/Turabian StyleAnaya-Segura, Mónica Alejandra, Héctor Rangel-Villalobos, Gabriela Martínez-Cortés, Benjamín Gómez-Díaz, Ramón Mauricio Coral-Vázquez, Edgar Oswaldo Zamora-González, Silvia García, and Luz Berenice López-Hernández. 2016. "Serum Levels of MicroRNA-206 and Novel Mini-STR Assays for Carrier Detection in Duchenne Muscular Dystrophy" International Journal of Molecular Sciences 17, no. 8: 1334. https://doi.org/10.3390/ijms17081334