
Association of Serum Uric Acid Concentration with Diabetic Retinopathy and Albuminuria in Taiwanese Patients with Type 2 Diabetes Mellitus

 ,
,
Abstract
:1. Introduction
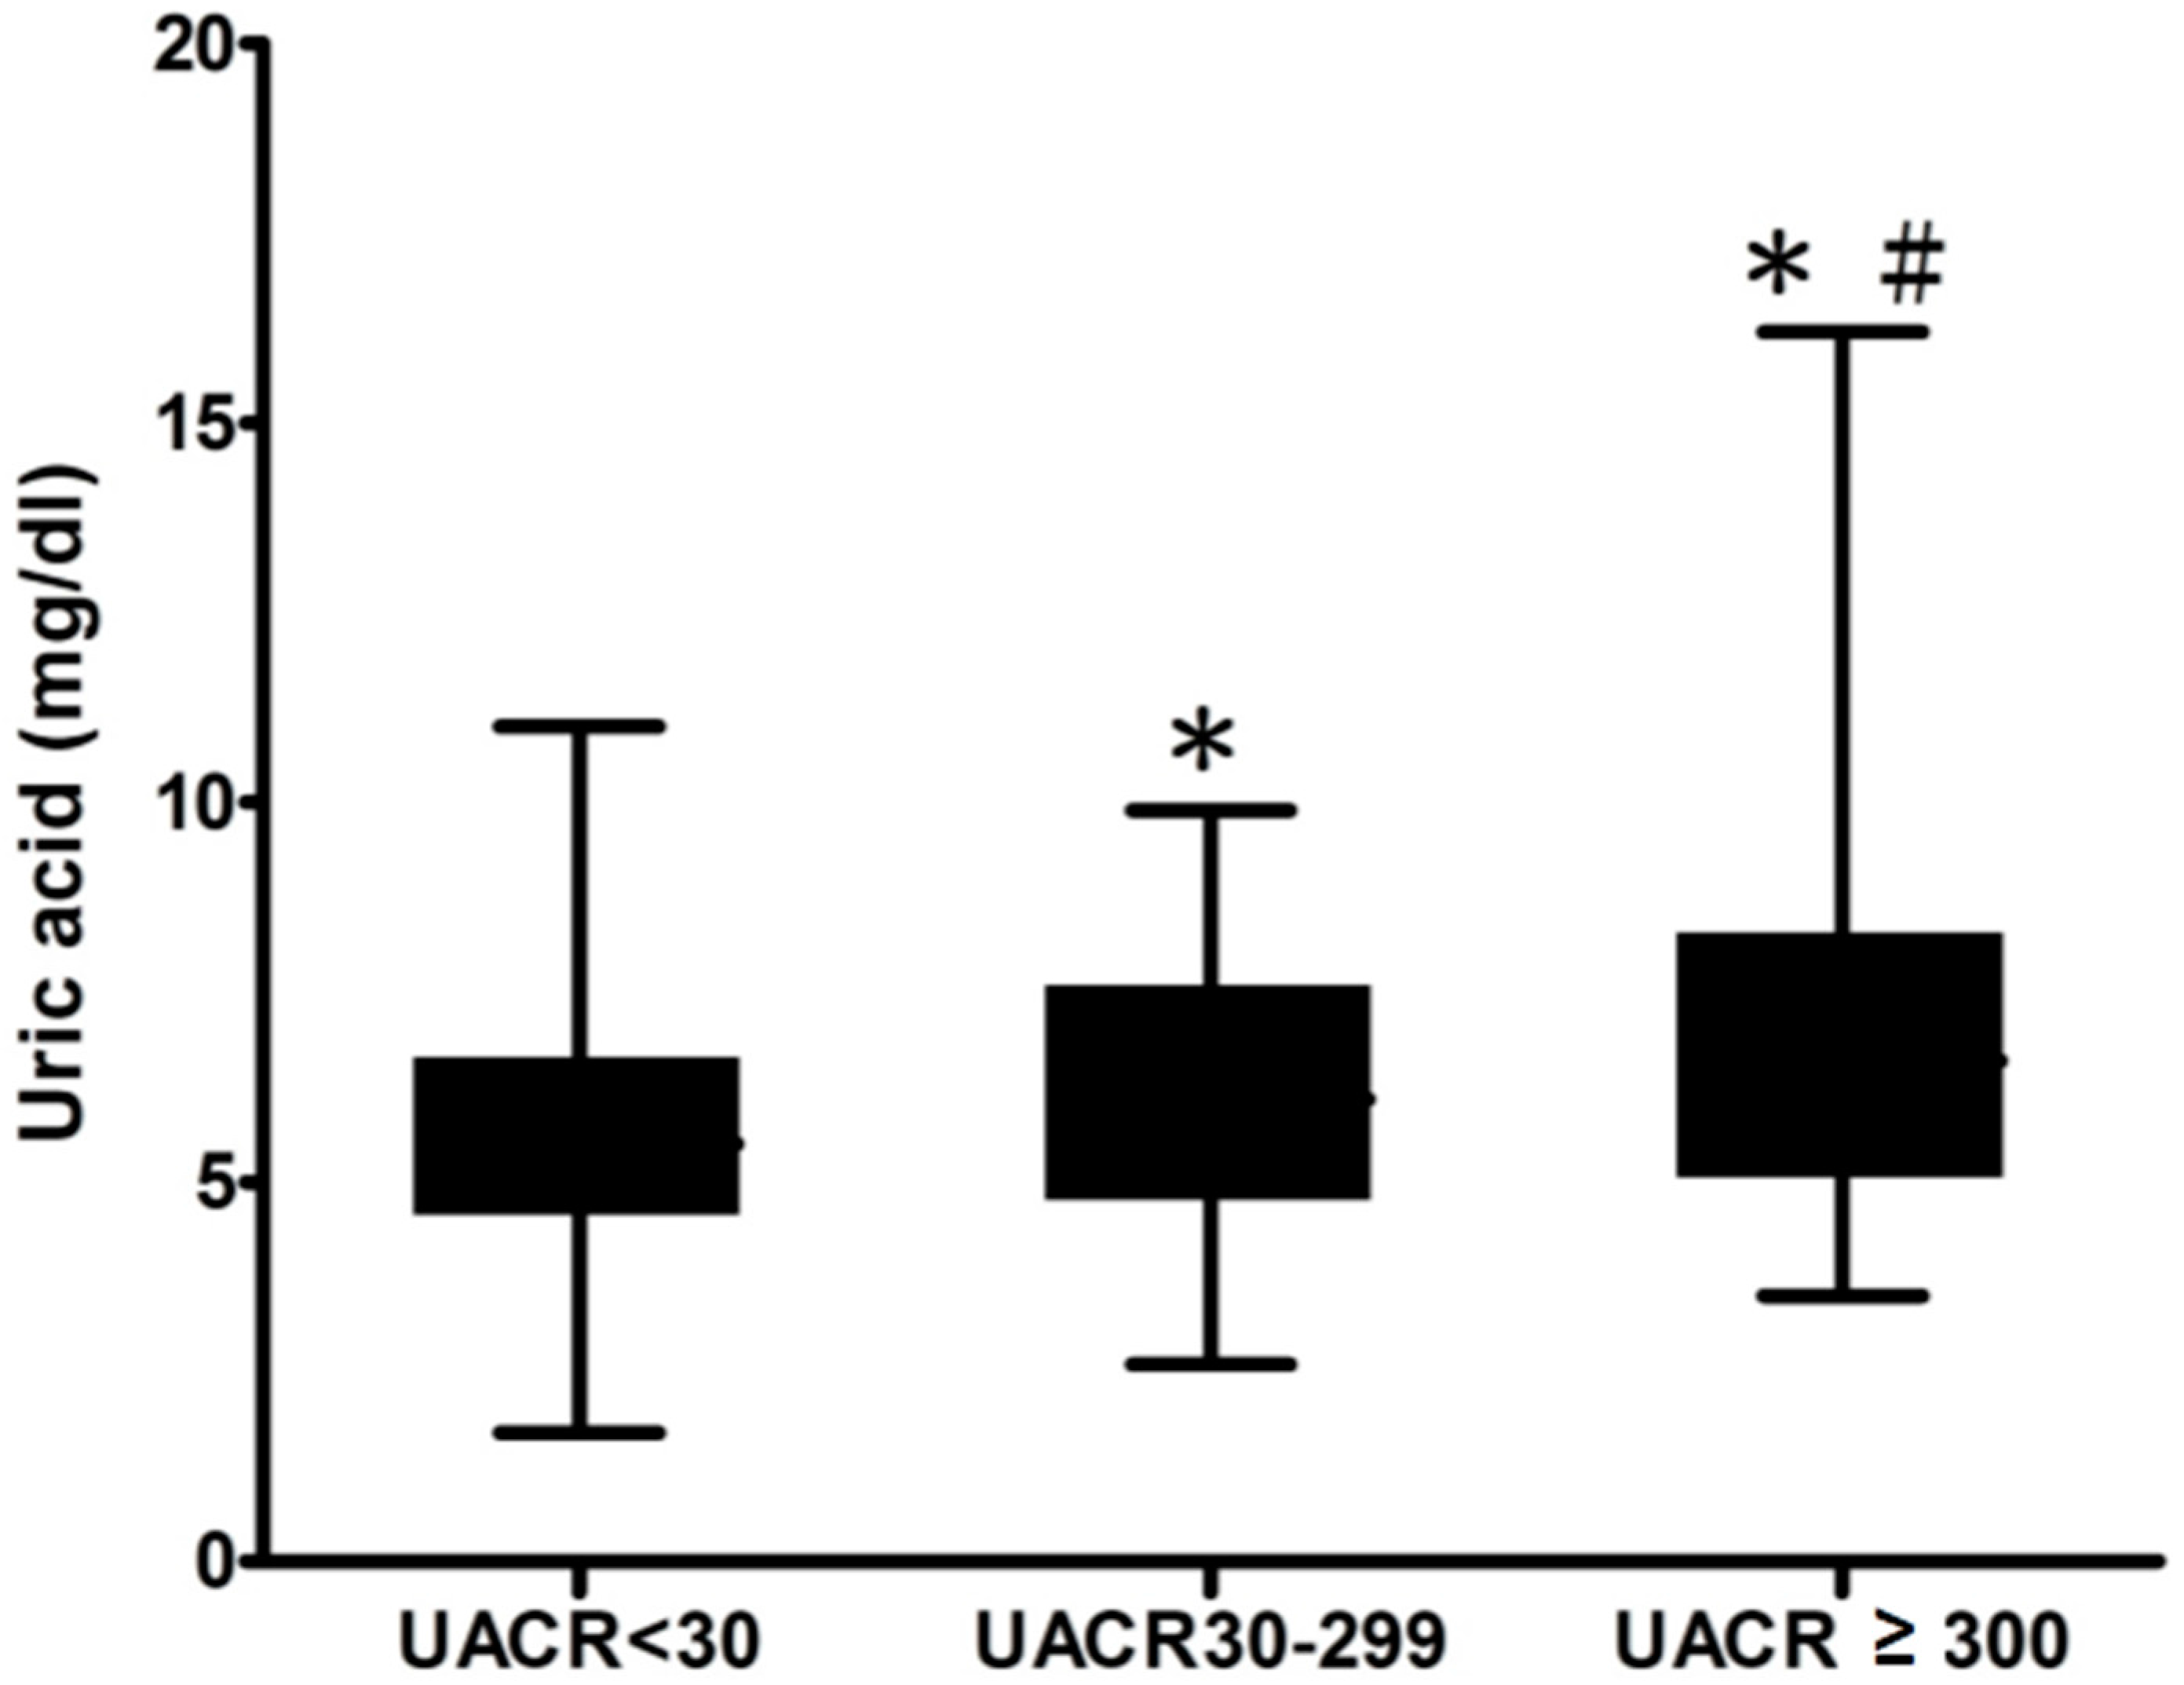
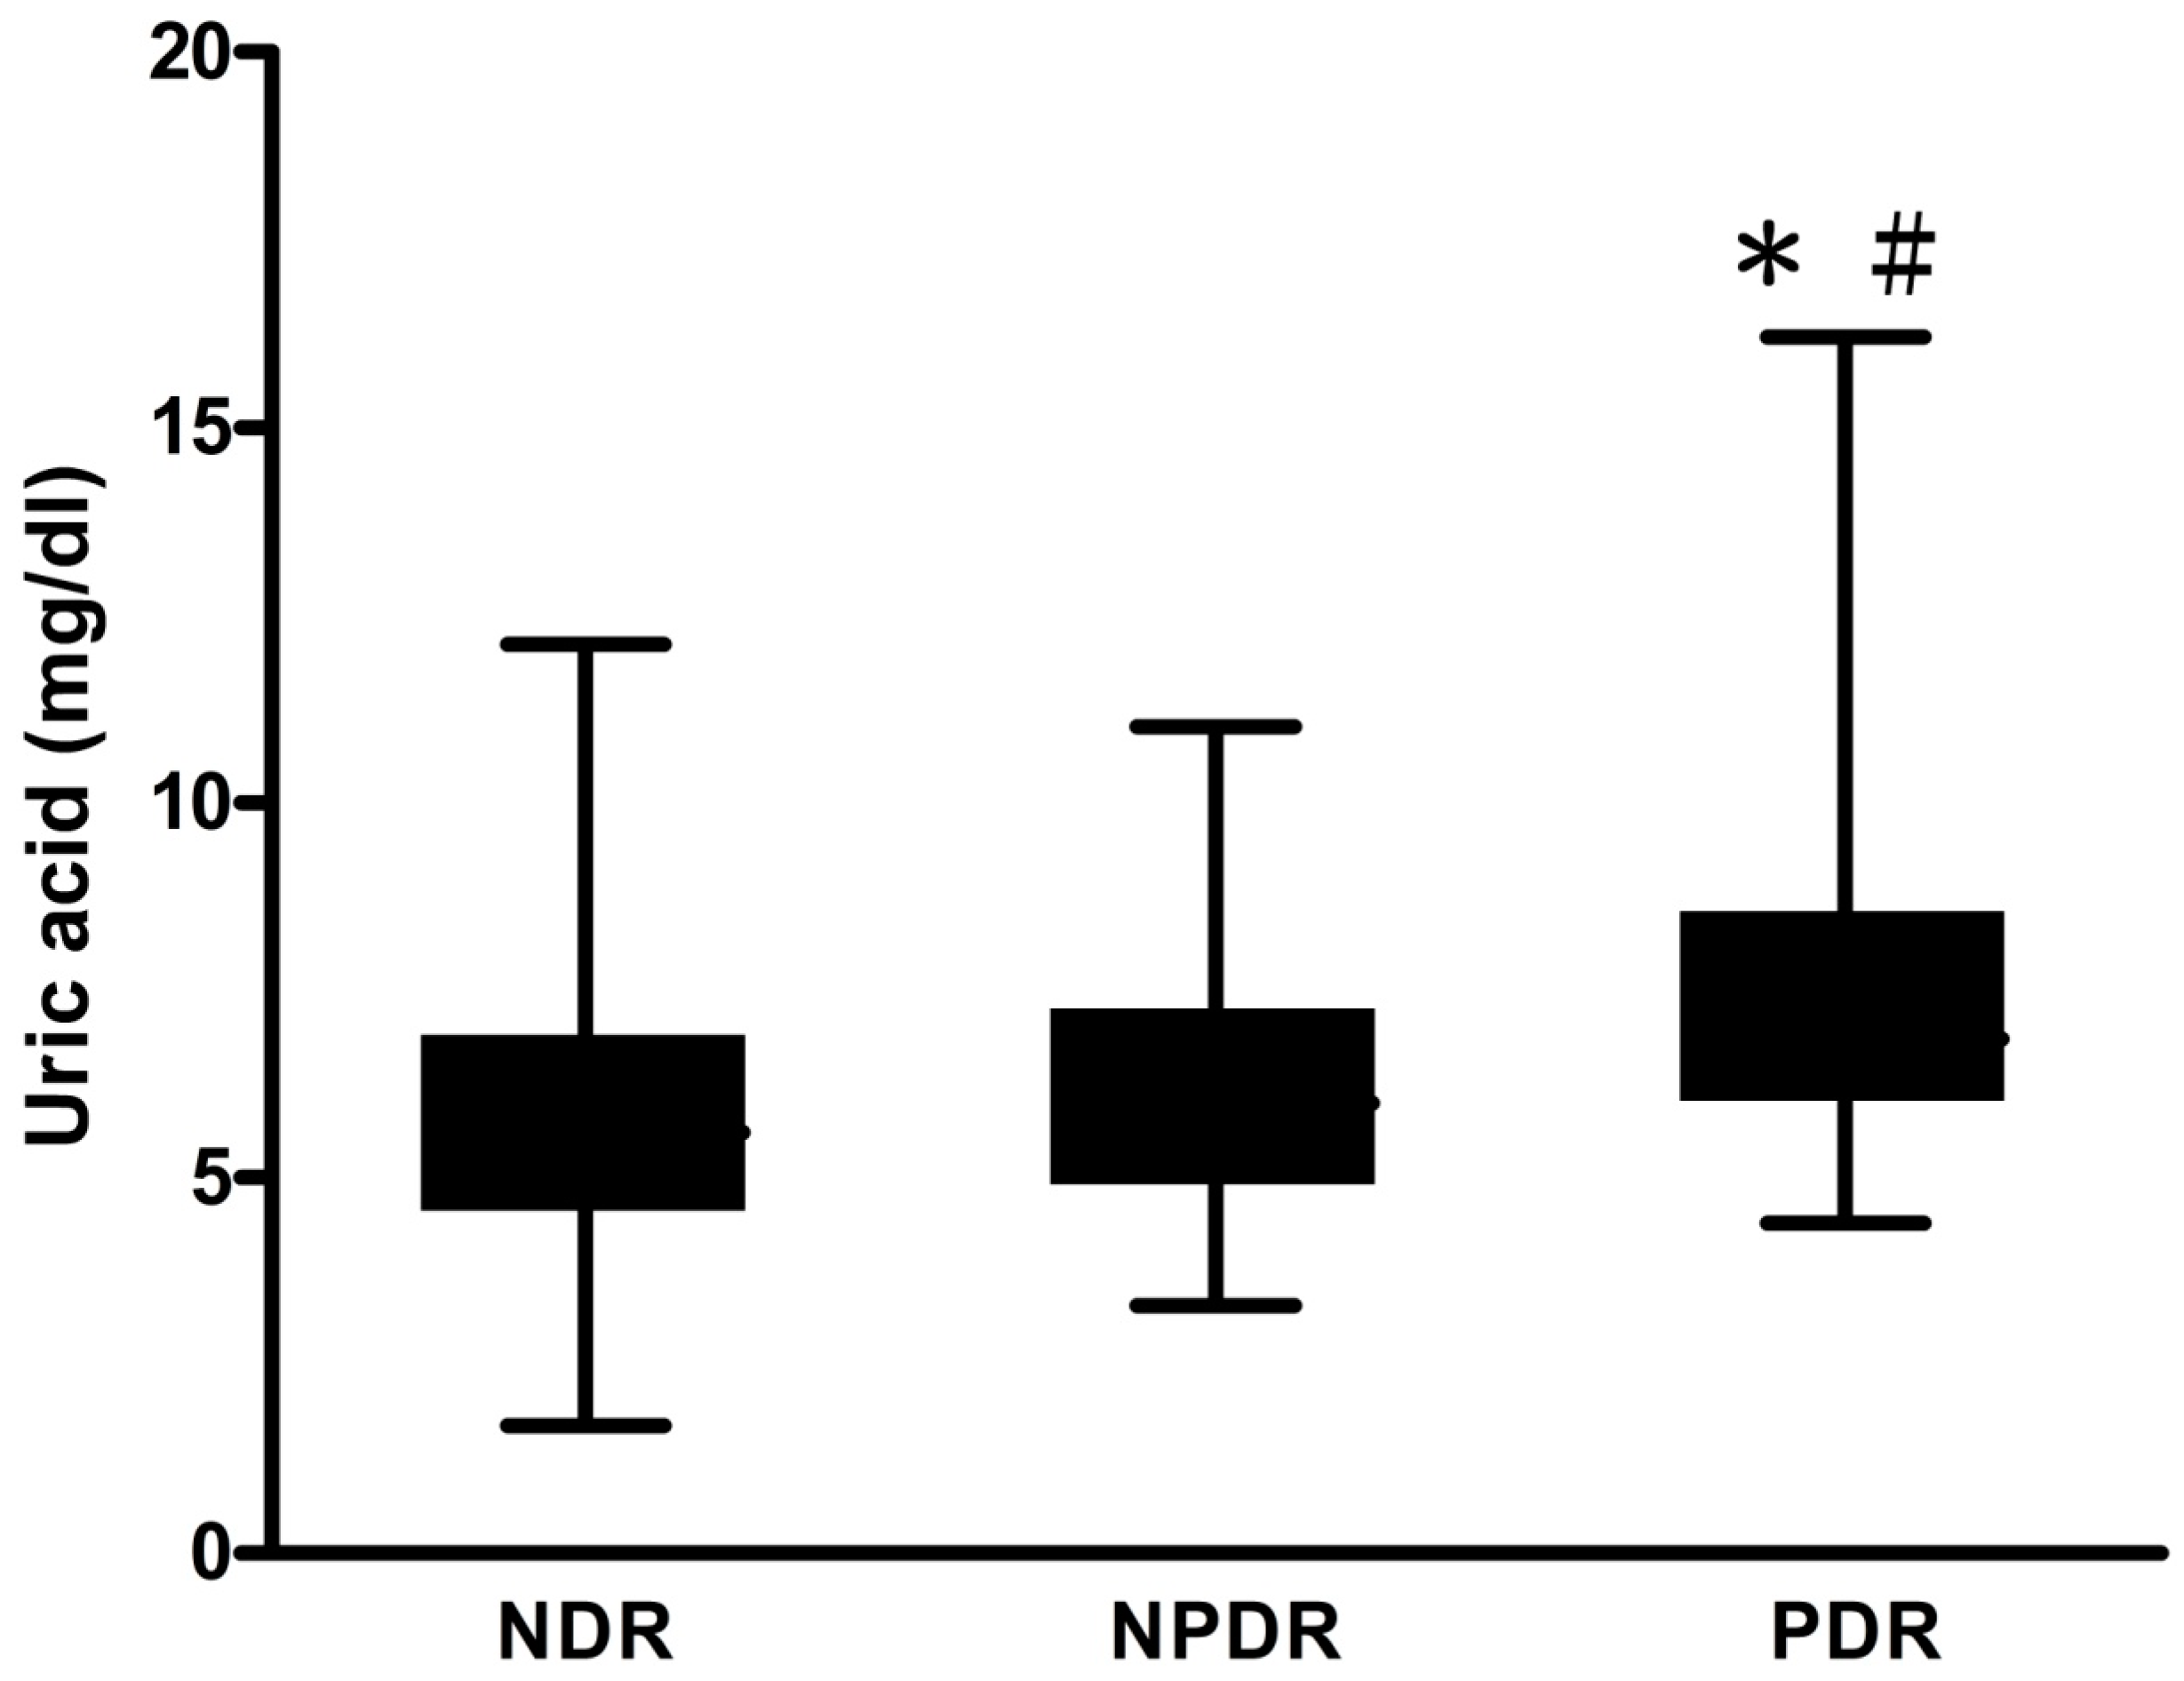
2. Results
3. Discussion
4. Materials and Methods
4.1. Subjects and Study Design
4.2. Demographic and Clinical Data
4.3. Diabetes Retinopathy
4.4. Statistical Analyses
5. Conclusions
Acknowledgments
Author Contributions
Conflicts of Interest
References
- Fong, D.S.; Aiello, L.P.; Ferris, F.L., 3rd; Klein, R. Diabetic retinopathy. Diabetes Care 2004, 27, 2540–2553. [Google Scholar] [CrossRef] [PubMed]
- Sivaprasad, S.; Gupta, B.; Crosby-Nwaobi, R.; Evans, J. Prevalence of diabetic retinopathy in various ethnic groups: A worldwide perspective. Surv. Ophthalmol. 2012, 57, 347–370. [Google Scholar] [CrossRef] [PubMed]
- Ritz, E.; Orth, S.R. Nephropathy in patients with type 2 diabetes mellitus. N. Engl. J. Med. 1999, 341, 1127–1133. [Google Scholar] [CrossRef] [PubMed]
- Hwang, S.J.; Tsai, J.C.; Chen, H.C. Epidemiology, impact and preventive care of chronic kidney disease in taiwan. Nephrology 2010, 15 (Suppl. 2), 3–9. [Google Scholar] [CrossRef] [PubMed]
- Lee, J.J.; Yang, I.H.; Kuo, H.K.; Chung, M.S.; Chen, Y.J.; Chen, C.H.; Liu, R.T. Serum uric acid concentration is associated with worsening in severity of diabetic retinopathy among type 2 diabetic patients in taiwan—A 3-year prospective study. Diabetes Res. Clin. Pract. 2014, 106, 366–372. [Google Scholar] [CrossRef] [PubMed]
- Fukui, M.; Tanaka, M.; Shiraishi, E.; Harusato, I.; Hosoda, H.; Asano, M.; Kadono, M.; Hasegawa, G.; Yoshikawa, T.; Nakamura, N. Serum uric acid is associated with microalbuminuria and subclinical atherosclerosis in men with type 2 diabetes mellitus. Metabolism 2008, 57, 625–629. [Google Scholar] [CrossRef] [PubMed]
- Fu, C.C.; Wu, D.A.; Wang, J.H.; Yang, W.C.; Tseng, C.H. Association of C-reactive protein and hyperuricemia with diabetic nephropathy in Chinese type 2 diabetic patients. Acta Diabetol. 2009, 46, 127–134. [Google Scholar] [CrossRef] [PubMed]
- Cai, X.L.; Wang, F.; Ji, L.N. Risk factors of diabetic retinopathy in type 2 diabetic patients. Chin. Med. J. 2006, 119, 822–826. [Google Scholar] [PubMed]
- Krizova, L.; Kalousova, M.; Kubena, A.; Benakova, H.; Zima, T.; Kovarik, Z.; Kalvoda, J.; Kalvodova, B. Increased uric acid and glucose concentrations in vitreous and serum of patients with diabetic macular oedema. Ophthalmic Res. 2011, 46, 73–79. [Google Scholar] [CrossRef] [PubMed]
- Krizova, L.; Kalousova, M.; Kubena, A.A.; Chrapek, O.; Chrapkova, B.; Sin, M.; Zima, T. Correlation of vitreous vascular endothelial growth factor and uric acid concentration using optical coherence tomography in diabetic macular edema. J. Ophthalmol. 2015, 2015. [Google Scholar] [CrossRef] [PubMed]
- Aiello, L.P.; Avery, R.L.; Arrigg, P.G.; Keyt, B.A.; Jampel, H.D.; Shah, S.T.; Pasquale, L.R.; Thieme, H.; Iwamoto, M.A.; Park, J.E.; et al. Vascular endothelial growth factor in ocular fluid of patients with diabetic retinopathy and other retinal disorders. N. Engl. J. Med. 1994, 331, 1480–1487. [Google Scholar] [CrossRef] [PubMed]
- Selim, K.M.; Sahan, D.; Muhittin, T.; Osman, C.; Mustafa, O. Increased levels of vascular endothelial growth factor in the aqueous humor of patients with diabetic retinopathy. Indian J. Ophthalmol. 2010, 58, 375–379. [Google Scholar] [CrossRef] [PubMed]
- Funatsu, H.; Yamashita, H.; Noma, H.; Mimura, T.; Nakamura, S.; Sakata, K.; Hori, S. Aqueous humor levels of cytokines are related to vitreous levels and progression of diabetic retinopathy in diabetic patients. Graefe’s Arch. Clin. Exp. 2005, 243, 3–8. [Google Scholar] [CrossRef] [PubMed]
- Hovind, P.; Rossing, P.; Tarnow, L.; Johnson, R.J.; Parving, H.H. Serum uric acid as a predictor for development of diabetic nephropathy in type 1 diabetes: An inception cohort study. Diabetes 2009, 58, 1668–1671. [Google Scholar] [CrossRef] [PubMed]
- Hayashino, Y.; Okamura, S.; Tsujii, S.; Ishii, H. Association of serum uric acid levels with the risk of development or progression of albuminuria among Japanese patients with type 2 diabetes: A prospective cohort study [Diabetes Distress And Care Registry at Tenri (DDCRT 10)]. Acta Diabetol. 2016. [Google Scholar] [CrossRef] [PubMed]
- Papanas, N.; Katsiki, N.; Papatheodorou, K.; Demetriou, M.; Papazoglou, D.; Gioka, T.; Maltezos, E. Peripheral neuropathy is associated with increased serum levels of uric acid in type 2 diabetes mellitus. Angiology 2011, 62, 291–295. [Google Scholar] [CrossRef] [PubMed]
- Kiani, J.; Habibi, Z.; Tajziehchi, A.; Moghimbeigi, A.; Dehghan, A.; Azizkhani, H. Association between serum uric acid level and diabetic peripheral neuropathy (a case control study). Casp. J. Intern. Med. 2014, 5, 17–21. [Google Scholar]
- Yu, S.; Chen, Y.; Hou, X.; Xu, D.; Che, K.; Li, C.; Yan, S.; Wang, Y.; Wang, B. Serum uric acid levels and diabetic peripheral neuropathy in type 2 diabetes: A systematic review and meta-analysis. Mol. Neurobiol. 2016, 53, 1045–1051. [Google Scholar] [CrossRef] [PubMed]
- Mene, P.; Punzo, G. Uric acid: Bystander or culprit in hypertension and progressive renal disease? J. Hypertens. 2008, 26, 2085–2092. [Google Scholar] [CrossRef] [PubMed]
- Oh, J.; Won, H.Y.; Kang, S.M. Uric acid and cardiovascular risk. N. Engl. J. Med. 2009, 360, 539–540. [Google Scholar] [PubMed]
- Momeni, A.; Shahidi, S.; Seirafian, S.; Taheri, S.; Kheiri, S. Effect of allopurinol in decreasing proteinuria in type 2 diabetic patients. Iran. J. Kidney Dis. 2010, 4, 128–132. [Google Scholar] [PubMed]
- Bose, B.; Badve, S.V.; Hiremath, S.S.; Boudville, N.; Brown, F.G.; Cass, A.; de Zoysa, J.R.; Fassett, R.G.; Faull, R.; Harris, D.C.; et al. Effects of uric acid-lowering therapy on renal outcomes: A systematic review and meta-analysis. Nephrol. Dial. Transplant. 2014, 29, 406–413. [Google Scholar] [CrossRef] [PubMed]
- David, Z.I. Cherney. The Effect of Uric Acid Lowering in Type 1 Diabetes. Available online: https://clinicaltrials.gov/ct2/show/NCT02344602 (accessed on 23 June 2016).
- Kato, S.; Ando, M.; Mizukoshi, T.; Nagata, T.; Katsuno, T.; Kosugi, T.; Tsuboi, N.; Maruyama, S. Randomized control trial for the assessment of the anti-albuminuric effects of topiroxostat in hyperuricemic patients with diabetic nephropathy (the ETUDE study). Nagoya J. Med.Sci. 2016, 78, 135–142. [Google Scholar] [PubMed]
- Levey, A.S.; Coresh, J.; Balk, E.; Kausz, A.T.; Levin, A.; Steffes, M.W.; Hogg, R.J.; Perrone, R.D.; Lau, J.; Eknoyan, G. National kidney foundation practice guidelines for chronic kidney disease: Evaluation, classification, and stratification. Ann. Intern. Med. 2003, 139, 137–147. [Google Scholar] [CrossRef] [PubMed]


| Characteristics | All Patients (n = 385) | SUA < 7 mg/dL (n = 292) | SUA ≥ 7 mg/dL (n = 93) |
|---|---|---|---|
| Age (year) | 64.6 ± 12.1 | 63.7 ± 11.6 | 67.3 ± 13.3 * |
| Male gender (%) | 49.6 | 43.5 | 68.8 |
| CAD (%) | 6.6 | 7.2 | 4.3 |
| CVD (%) | 3.8 | 2.7 | 7.2 |
| Duration of DM (years) | 9 (5–16) | 9 (4–15) | 11 (6–16) |
| Systolic BP (mmHg) | 138.6 ± 17.8 | 137.3 ± 17.1 | 142.7 ± 19.6 * |
| Diastolic BP (mmHg) | 76.1 ± 11.9 | 76.0 ± 11.5 | 76.1 ± 13.0 |
| WC (cm) | 92.6 ± 11.1 | 91.0 ± 10.4 | 97.5 ± 11.7 ** |
| HC (cm) | 100.0 ± 10.0 | 99.3 ± 10.2 | 102.4 ± 9.4 |
| W-to-H ratio | 0.93 ± 0.07 | 0.92 ± 0.07 | 0.95 ± 0.06 * |
| BMI (kg/m2) | 26.4 ± 4.6 | 26.1 ± 4.4 | 27.3 ± 5.2 |
| Laboratory parameters | |||
| Uric acid (mg/dL) | 5.9 ± 1.8 | 5.1 ± 1.1 | 8.3 ± 1.3 ** |
| Triglyceride (mg/dL) | 121 (83.5–172) | 117 (78–164) | 144 (99.5–206.5) * |
| Total cholesterol (mg/dL) | 180.6 ± 47.7 | 179.9 ± 46.4 | 182.9 ± 51.6 |
| HDL-cholesterol (mg/dL) | 45.0 ± 12.9 | 46.4 ± 13.0 | 40.8 ± 11.6 * |
| LDL-cholesterol (mg/dL) | 101.7 ± 35.4 | 100.8 ± 33.2 | 104.5 ± 41.6 |
| Fasting glucose (mg/dL) | 154.8 ± 64.3 | 158.4 ± 67.3 | 143.4 ± 52.6 * |
| HbA1c (g/dL) | 7.6 ± 1.9 | 7.6 ± 1.9 | 7.5 ± 1.9 |
| eGFR (mL/min/1.73 m2) | 78.6 ± 33.0 | 84.5 ± 31.5 | 60.0 ± 30.7 ** |
| Urinary albumin-to-creatinine ratio (UACR) (mg/gm) (p < 0.001) | |||
| <30 | 60.3 | 66.4 | 40.9 |
| 30–300 | 26.0 | 22.9 | 35.5 |
| ≥300 | 13.8 | 10.6 | 23.7 |
| Diabetic retinopathy (DR) (p = 0.051) | |||
| NDR | 75.8 | 78.1 | 68.9 |
| NPDR | 19.0 | 18.2 | 21.5 |
| PDR | 5.2 | 3.8 | 9.7 |
| Parameters | Univariate | Multivariate | ||
|---|---|---|---|---|
| OR (95% CI) | p | OR (95% CI) | p | |
| Age (per 1 year) | 1.009 (0.992–1.027) | 0.278 | 0.987 (0.956–1.019) | 0.424 |
| Male gender (versus female) | 1.486 (0.986–2.240) | 0.059 | 0.910 (0.457–1.812) | 0.788 |
| CAD | 0.703 (0.259–1.907) | 0.489 | - | - |
| CVD | 1.918 (0.571–6.439) | 0.292 | - | - |
| Log duration of DM (per 1 year) | 1.623 (0.839–3.138) | 0.150 | - | - |
| Systolic BP (per 1 mmHg) | 1.033 (1.019–1.047) | <0.001 | 1.023 (1.005–1.042) | 0.015 |
| Diastolic BP (per 1 mmHg) | 1.013 (0.995–1.032) | 0.156 | - | - |
| WC (per 1 cm) | 1.012 (0.987–1.039) | 0.350 | - | - |
| HC (per 1 cm) | 0.988 (0.960–1.017) | 0.404 | - | - |
| W-to-H ratio (per 0.01) | 2.154 (1.125–4.124) | 0.021 | 1.816 (0.854–3.861) | 0.121 |
| BMI (per 1 kg/m2) | 1.007 (0.959–1.058) | 0.766 | - | - |
| Laboratory parameters | ||||
| Uric acid (per 1 mg/dL) | 1.309 (1.156–1.483) | <0.001 | 1.227 (1.015–1.482) | 0.034 |
| Log Triglyceride (per 1 mg/dL) | 1.339 (0.614–2.921) | 0.463 | - | - |
| Total cholesterol (per 1 mg/dL) | 0.999 (0.994–1.003) | 0.524 | - | - |
| HDL-cholesterol (per 1 mg/dL) | 0.986 (0.969–1.004) | 0.120 | - | - |
| LDL-cholesterol (per 1 mg/dL) | 0.996 (0.990–1.002) | 0.178 | - | - |
| Fasting glucose (per 1 mg/dL) | 1.002 (0.998–1.005) | 0.348 | - | - |
| HbA1c (per 1%) | 1.129 (1.012–1.258) | 0.029 | 1.183 (1.010–1.385) | 0.037 |
| eGFR (per 1 mL/min/1.73 m2) | 0.980 (0.973–0.987) | <0.001 | 0.984 (0.972–0.997) | 0.014 |
| Parameters | Univariate | Multivariate | ||
|---|---|---|---|---|
| OR (95% CI) | p | OR (95% CI) | p | |
| Age (per 1 year) | 0.992 (0.973–1.011) | 0.392 | 0.974 (0.948–1.001) | 0.060 |
| Male gender (versus female) | 0.862 (0.541–1.373) | 0.532 | 0.920 (0.495–1.709) | 0.793 |
| CAD | 0.858 (0.275–2.679) | 0.792 | - | - |
| CVD | 0.315 (0.04–2.506) | 0.275 | - | - |
| Log duration of DM (per 1 year) | 5.295 (2.145–13.070) | <0.001 | 6.133 (2.231–16.860) | <0.001 |
| Systolic BP (per 1 mmHg) | 1.014 (1.000–1.028) | 0.052 | - | - |
| Diastolic BP (per 1 mmHg) | 1.005 (0.984–1.026) | 0.641 | - | - |
| WC (per 1 cm) | 0.975 (0.946–1.006) | 0.109 | - | - |
| HC (per 1 cm) | 0.974 (0.941–1.008) | 0.127 | - | - |
| W-to-H ratio (per 0.01) | 0.952 (0.478–1.894) | 0.888 | - | - |
| BMI (per 1 kg/m2) | 0.961 (0.906–1.019) | 0.185 | - | - |
| Laboratory parameters | ||||
| Uric acid (per 1 mg/dL) | 1.238 (1.086–1.411) | 0.001 | 1.217 (1.013–1.461) | 0.035 |
| Log Triglyceride (per 1 mg/dL) | 1.550 (0.644–3.732) | 0.328 | - | - |
| Total cholesterol (per 1 mg/dL) | 1.005 (1.000–1.009) | 0.057 | - | - |
| HDL-cholesterol (per 1 mg/dL) | 1.007 (0.988–1.027) | 0.469 | - | - |
| LDL-cholesterol (per 1 mg/dL) | 1.001 (0.995–1.008) | 0.701 | - | - |
| Fasting glucose (per 1 mg/dL) | 1.005 (1.001–1.008) | 0.007 | 1.000 (0.995–1.005) | 0.966 |
| HbA1c (per 1%) | 1.172 (1.045–1.315) | 0.007 | 1.159 (0.963–1.395) | 0.118 |
| eGFR (per 1 mL/min/1.73 m2) | 0.992 (0.984–0.999) | 0.026 | 0.997 (0.986–1.008) | 0.605 |
© 2016 by the authors; licensee MDPI, Basel, Switzerland. This article is an open access article distributed under the terms and conditions of the Creative Commons Attribution (CC-BY) license (http://creativecommons.org/licenses/by/4.0/).
Share and Cite
Liang, C.-C.; Lin, P.-C.; Lee, M.-Y.; Chen, S.-C.; Shin, S.-J.; Hsiao, P.-J.; Lin, K.-D.; Hsu, W.-H. Association of Serum Uric Acid Concentration with Diabetic Retinopathy and Albuminuria in Taiwanese Patients with Type 2 Diabetes Mellitus. Int. J. Mol. Sci. 2016, 17, 1248. https://doi.org/10.3390/ijms17081248
Liang C-C, Lin P-C, Lee M-Y, Chen S-C, Shin S-J, Hsiao P-J, Lin K-D, Hsu W-H. Association of Serum Uric Acid Concentration with Diabetic Retinopathy and Albuminuria in Taiwanese Patients with Type 2 Diabetes Mellitus. International Journal of Molecular Sciences. 2016; 17(8):1248. https://doi.org/10.3390/ijms17081248
Chicago/Turabian StyleLiang, Ching-Chao, Pi-Chen Lin, Mei-Yueh Lee, Szu-Chia Chen, Shyi-Jang Shin, Pi-Jung Hsiao, Kun-Der Lin, and Wei-Hao Hsu. 2016. "Association of Serum Uric Acid Concentration with Diabetic Retinopathy and Albuminuria in Taiwanese Patients with Type 2 Diabetes Mellitus" International Journal of Molecular Sciences 17, no. 8: 1248. https://doi.org/10.3390/ijms17081248