Article

The Role of Genetic Polymorphisms as Related to One-Carbon Metabolism, Vitamin B6, and Gene–Nutrient Interactions in Maintaining Genomic Stability and Cell Viability in Chinese Breast Cancer Patients

1
School of Life Sciences, The Engineering Research Center of Sustainable Development and Utilization of Biomass Energy, Ministry of Education, Yunnan Normal University, Kunming 650500, Yunnan, China
2
Third Affiliated Hospital of Kunming Medical College, Kunming 650101, Yunnan, China
3
Genome Health and Personalized Nutrition, CSIRO Food and Nutrition, P.O. Box 10041, Adelaide SA 5000, Australia
*
Authors to whom correspondence should be addressed.
Int. J. Mol. Sci. 2016, 17(7), 1003; https://doi.org/10.3390/ijms17071003
Submission received: 11 May 2016 / Revised: 31 May 2016 / Accepted: 17 June 2016 / Published: 24 June 2016
(This article belongs to the Special Issue Tumor Microenvironment and Metabolism)

Abstract

:
Folate-mediated one-carbon metabolism (FMOCM) is linked to DNA synthesis, methylation, and cell proliferation. Vitamin B6 (B6) is a cofactor, and genetic polymorphisms of related key enzymes, such as serine hydroxymethyltransferase (SHMT), methionine synthase reductase (MTRR), and methionine synthase (MS), in FMOCM may govern the bioavailability of metabolites and play important roles in the maintenance of genomic stability and cell viability (GSACV). To evaluate the influences of B6, genetic polymorphisms of these enzymes, and gene–nutrient interactions on GSACV, we utilized the cytokinesis-block micronucleus assay (CBMN) and PCR-restriction fragment length polymorphism (PCR-RFLP) techniques in the lymphocytes from female breast cancer cases and controls. GSACV showed a significantly positive correlation with B6 concentration, and 48 nmol/L of B6 was the most suitable concentration for maintaining GSACV in vitro. The GSACV indexes showed significantly different sensitivity to B6 deficiency between cases and controls; the B6 effect on the GSACV variance contribution of each index was significantly higher than that of genetic polymorphisms and the sample state (tumor state). SHMT C1420T mutations may reduce breast cancer susceptibility, whereas MTRR A66G and MS A2756G mutations may increase breast cancer susceptibility. The role of SHMT, MS, and MTRR genotype polymorphisms in GSACV is reduced compared with that of B6. The results appear to suggest that the long-term lack of B6 under these conditions may increase genetic damage and cell injury and that individuals with various genotypes have different sensitivities to B6 deficiency. FMOCM metabolic enzyme gene polymorphism may be related to breast cancer susceptibility to a certain extent due to the effect of other factors such as stress, hormones, cancer therapies, psychological conditions, and diet. Adequate B6 intake may be good for maintaining genome health and preventing breast cancer.

Graphical Abstract

1. Introduction

Folate, vitamin B6 (B6), and vitamin B12 (B12) have been proven to play important roles in the one-carbon metabolism pathway and the prevention of carcinogenesis: (a) in the transformation of homocysteine (Hcy) to methionine for methylation of DNA to ensure gene expression and genomic stability; and (b) in the synthesis of purine precursors and thymidylate of nucleic acid (DNA and RNA) [1,2,3,4]. B6 is not only a crucial coenzyme for serine hydroxymethyltransferase (SHMT) in the reversible transformation of serine and tetrahydrofolate (THF) to 5,10-methylene THF and glycine [5,6], a reaction that offers one-carbon units for S-adenosylmethionine (SAM), and for the synthesis of purine and pyrimidine, but it is also a cofactor for cystathionine β-synthase (CBS), which is involved in the transsulfuration pathway where Hcy is converted into cystathionine. Thus, inadequate dietary intake of B6 or deficiency of B6 in plasma might result in a state of missing DNA precursors, aberrations in DNA metabolism and histone methylation, interruption in DNA repair, and imbalance in the synthesis and degradation of Hcy, any of which are likely to be associated with promoting the development of several adverse health effects including carcinogenesis. In addition to its functions in DNA synthesis, methylation, and repair, B6 is also essential for the synthesis of glutathione (GSH) from Hcy via cysteine and cystathionine. GSH plays a key role of detoxification and protection as a cofactor of GSH peroxidases and GSH S-transferases. Additionally, it can protect cells from the oxidative damage of nucleic acids, proteins and lipids [7,8,9]. Rodent studies have shown that azoxymethane-induced colon tumorigenesis in mice is suppressed by moderate doses of dietary B6, and B6 can suppress endothelial cell angiogenesis and proliferation in part by restraining DNA topoisomerases and DNA polymerase [10,11].
Not only the above-mentioned B6 and SHMT are important in the folate-mediated one-carbon metabolism (FMOCM), which also involves various other enzymes. Among them, 5,10-methylenetetrahydrofolate reductase (MTHFR) irreversibly converts 5,10-methylene THF to 5-methyl THF [12,13]. Methionine synthase (MS) maintains methionine dynamic equilibrium by converting Hcy to methionine (the precursor of SAM) in a cobalamin-dependent reaction, which uses 5-methyl THF as the methyl donor [14]. Methionine synthase reductase (MTRR) is responsible for activating MS by keeping adequate levels of activated B12 [15,16,17,18]. The folate metabolism has attracted major attention in relation to breast carcinogenesis. In spite of its significance in the one-carbon metabolism and the elimination of oxidative stress, there is limited basic experimental proof of an association of B6 and the above-mentioned enzymes with susceptibility to cancer, especially breast cancer [19,20,21]. We previously reported associations among two polymorphisms in the MTHFR gene (677 and 1298 loci), folate (or folic acid), B12 deficiency, genome instability, and increased cell death with breast cancer risk in the Chinese Yunnan population [14,22,23,24]. Based on previous work, we utilized the cytokinesis-block micronucleus assay (CBMN) and PCR-restriction fragment length polymorphism (PCR-RFLP) techniques to determine the relationships between B6 deficiency, the other above-mentioned genetic polymorphisms in the folate pathway, gene-nutrient interactions and genomic stability and cell viability (GSACV) in vitro.

2. Results

2.1. Dose-Response Relationship between the Concentration of B6 and the Number of Viable Cells (NVC) in Cell Lines

Our goal was to ascertain the dose-response relationship between the concentration of B6 and the NVC. In preliminary experiments, we selected the lowest B6 concentrations to be 0 nmol/L with an experimental concentration gradient of 6, 12, 24, 48, 96, 200, and 4800 nmol/L to culture a breast cancer cell line and a normal cell line (GM13705 and GM12593, respectively) according to the physiological concentrations of B6 in plasma (20–40 nmol/L) [25]. Although vitamin B6 concentration in vivo is unlikely to be zero, we wanted to make sure of the growth status of the cell line in culture without B6, so we selected the lowest concentration to be 0 nmol/L. The results showed a clear dose-response growth relationship in both cell lines at various B6 concentrations, with 24 nmol/L being the lowest concentration of B6 that can lead to an increase in NVC. Because there was no significant difference of growth between 200 and 4800 nmol/L and both cell lines were dead at 0 nmol/L, we selected 6, 12, 24, 48, 96, and 200 nmol/L B6 to culture both lymphocytes from the breast cancer cases and controls in follow-up experiments (Supplementary Figure S1).

2.2. Comparison of GSACV with Different B6 Concentrations in the Breast Cancer Cases or Controls

The levels of GSACV biomarkers in media with different concentrations of B6 are reported in Table 1. A one-way analysis of variance (ANOVA) showed that there were no significant differences among the nuclear division index (NDI) values at different concentrations of B6 in both groups (breast cancer and controls). However, the other GSACV indexes (frequency of micronucleated binucleated cells, MNBN; micronucleated mononucleated cells, MONO; nucleoplasmic bridge cells, NPB; nuclear bud cells, NBUD) showed a decreasing trends with increasing B6 concentrations from 6–24 to 48–200 nmol/L. There were no significant differences in GSACV indexes including MNBN, NPB, NBUD, and MONO frequencies from 48 to 200 nmol/L in the same groups (breast cancer cases or controls). The frequencies of apoptosis (APO) and necrosis (NEC) significantly decreased when the concentration of B6 was raised from 6–12 to 24–200 nmol/L, and there was no significant difference in APO or NEC from 24 to 200 nmol/L B6.
A correlation analysis among the biomarkers showed that the GSACV indexes were obviously positively related to each other (p < 0.001–0.05, respectively) and that the GSACV indexes were significantly negatively correlated with the B6 concentration: r = −0.764, −0.615, −0.563, −0.448, −0.761, and −0.601 for MNBN, NPB, NBUD, MONO, APO and NEC (p < 0.001–0.05), respectively, in the breast cancer cases, and r = −0.582, −0.609, −0.574, −0.411, −0.663, and −0.510 for MNBN, NPB, NBUD, MONO, APO and NEC (p < 0.001–0.05), respectively, in the controls. These results are shown in Table 2 and Table 3.

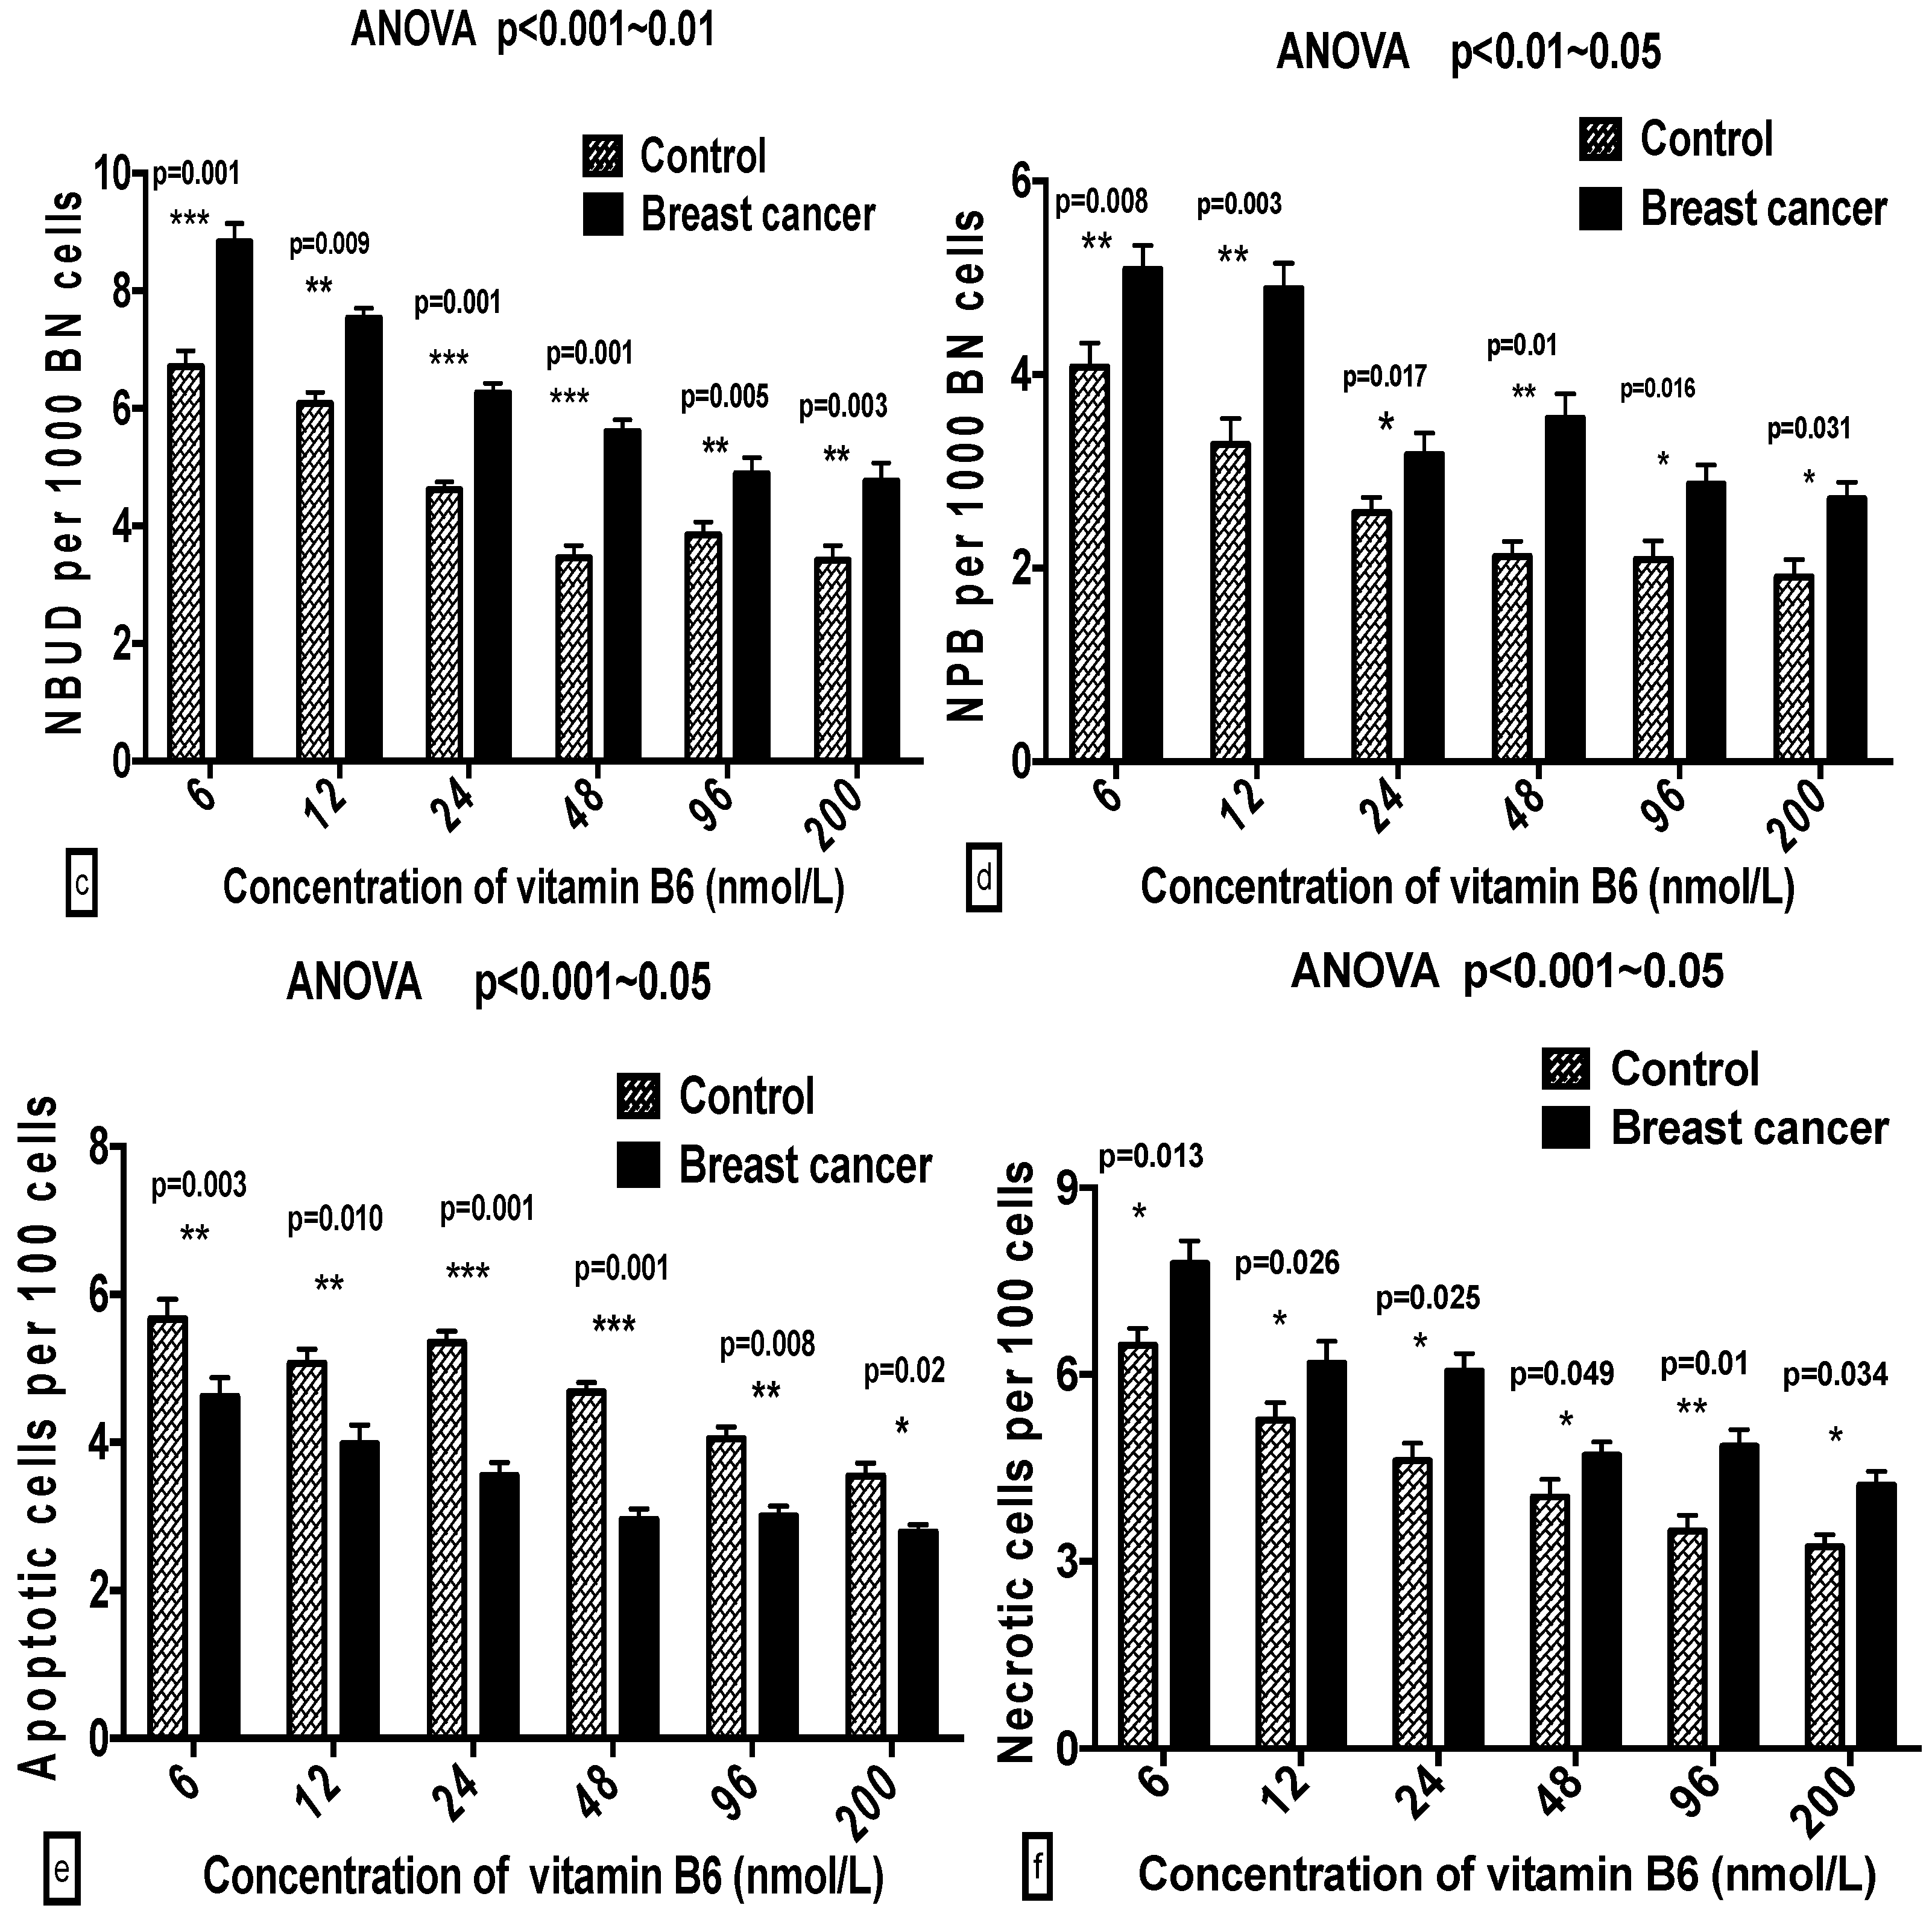
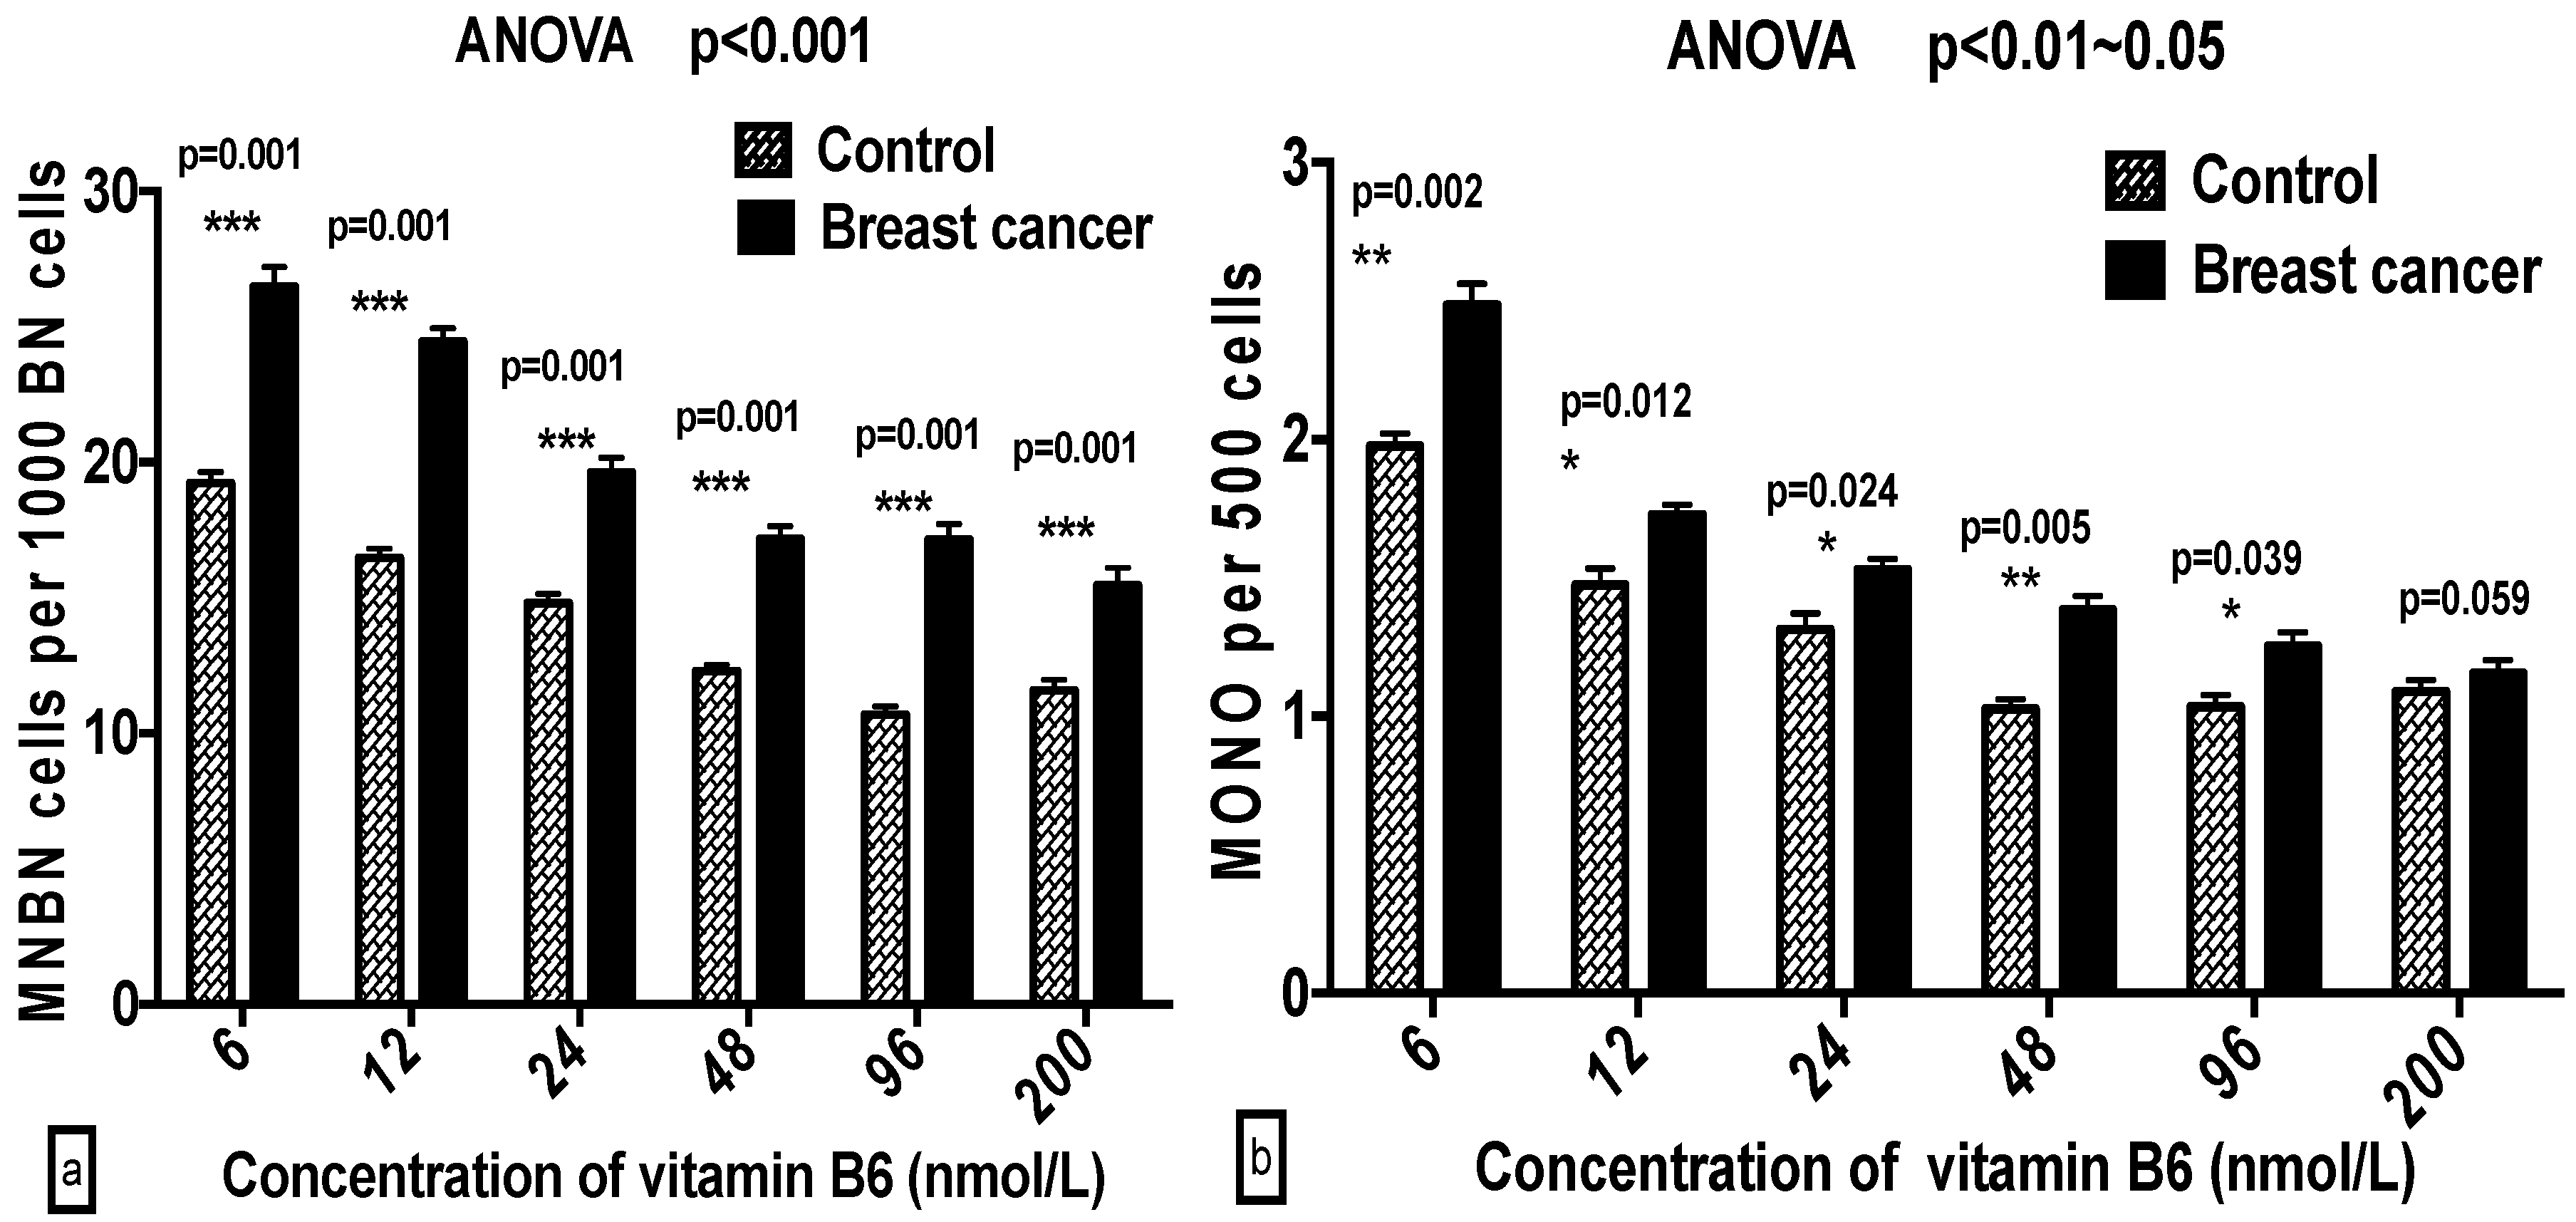
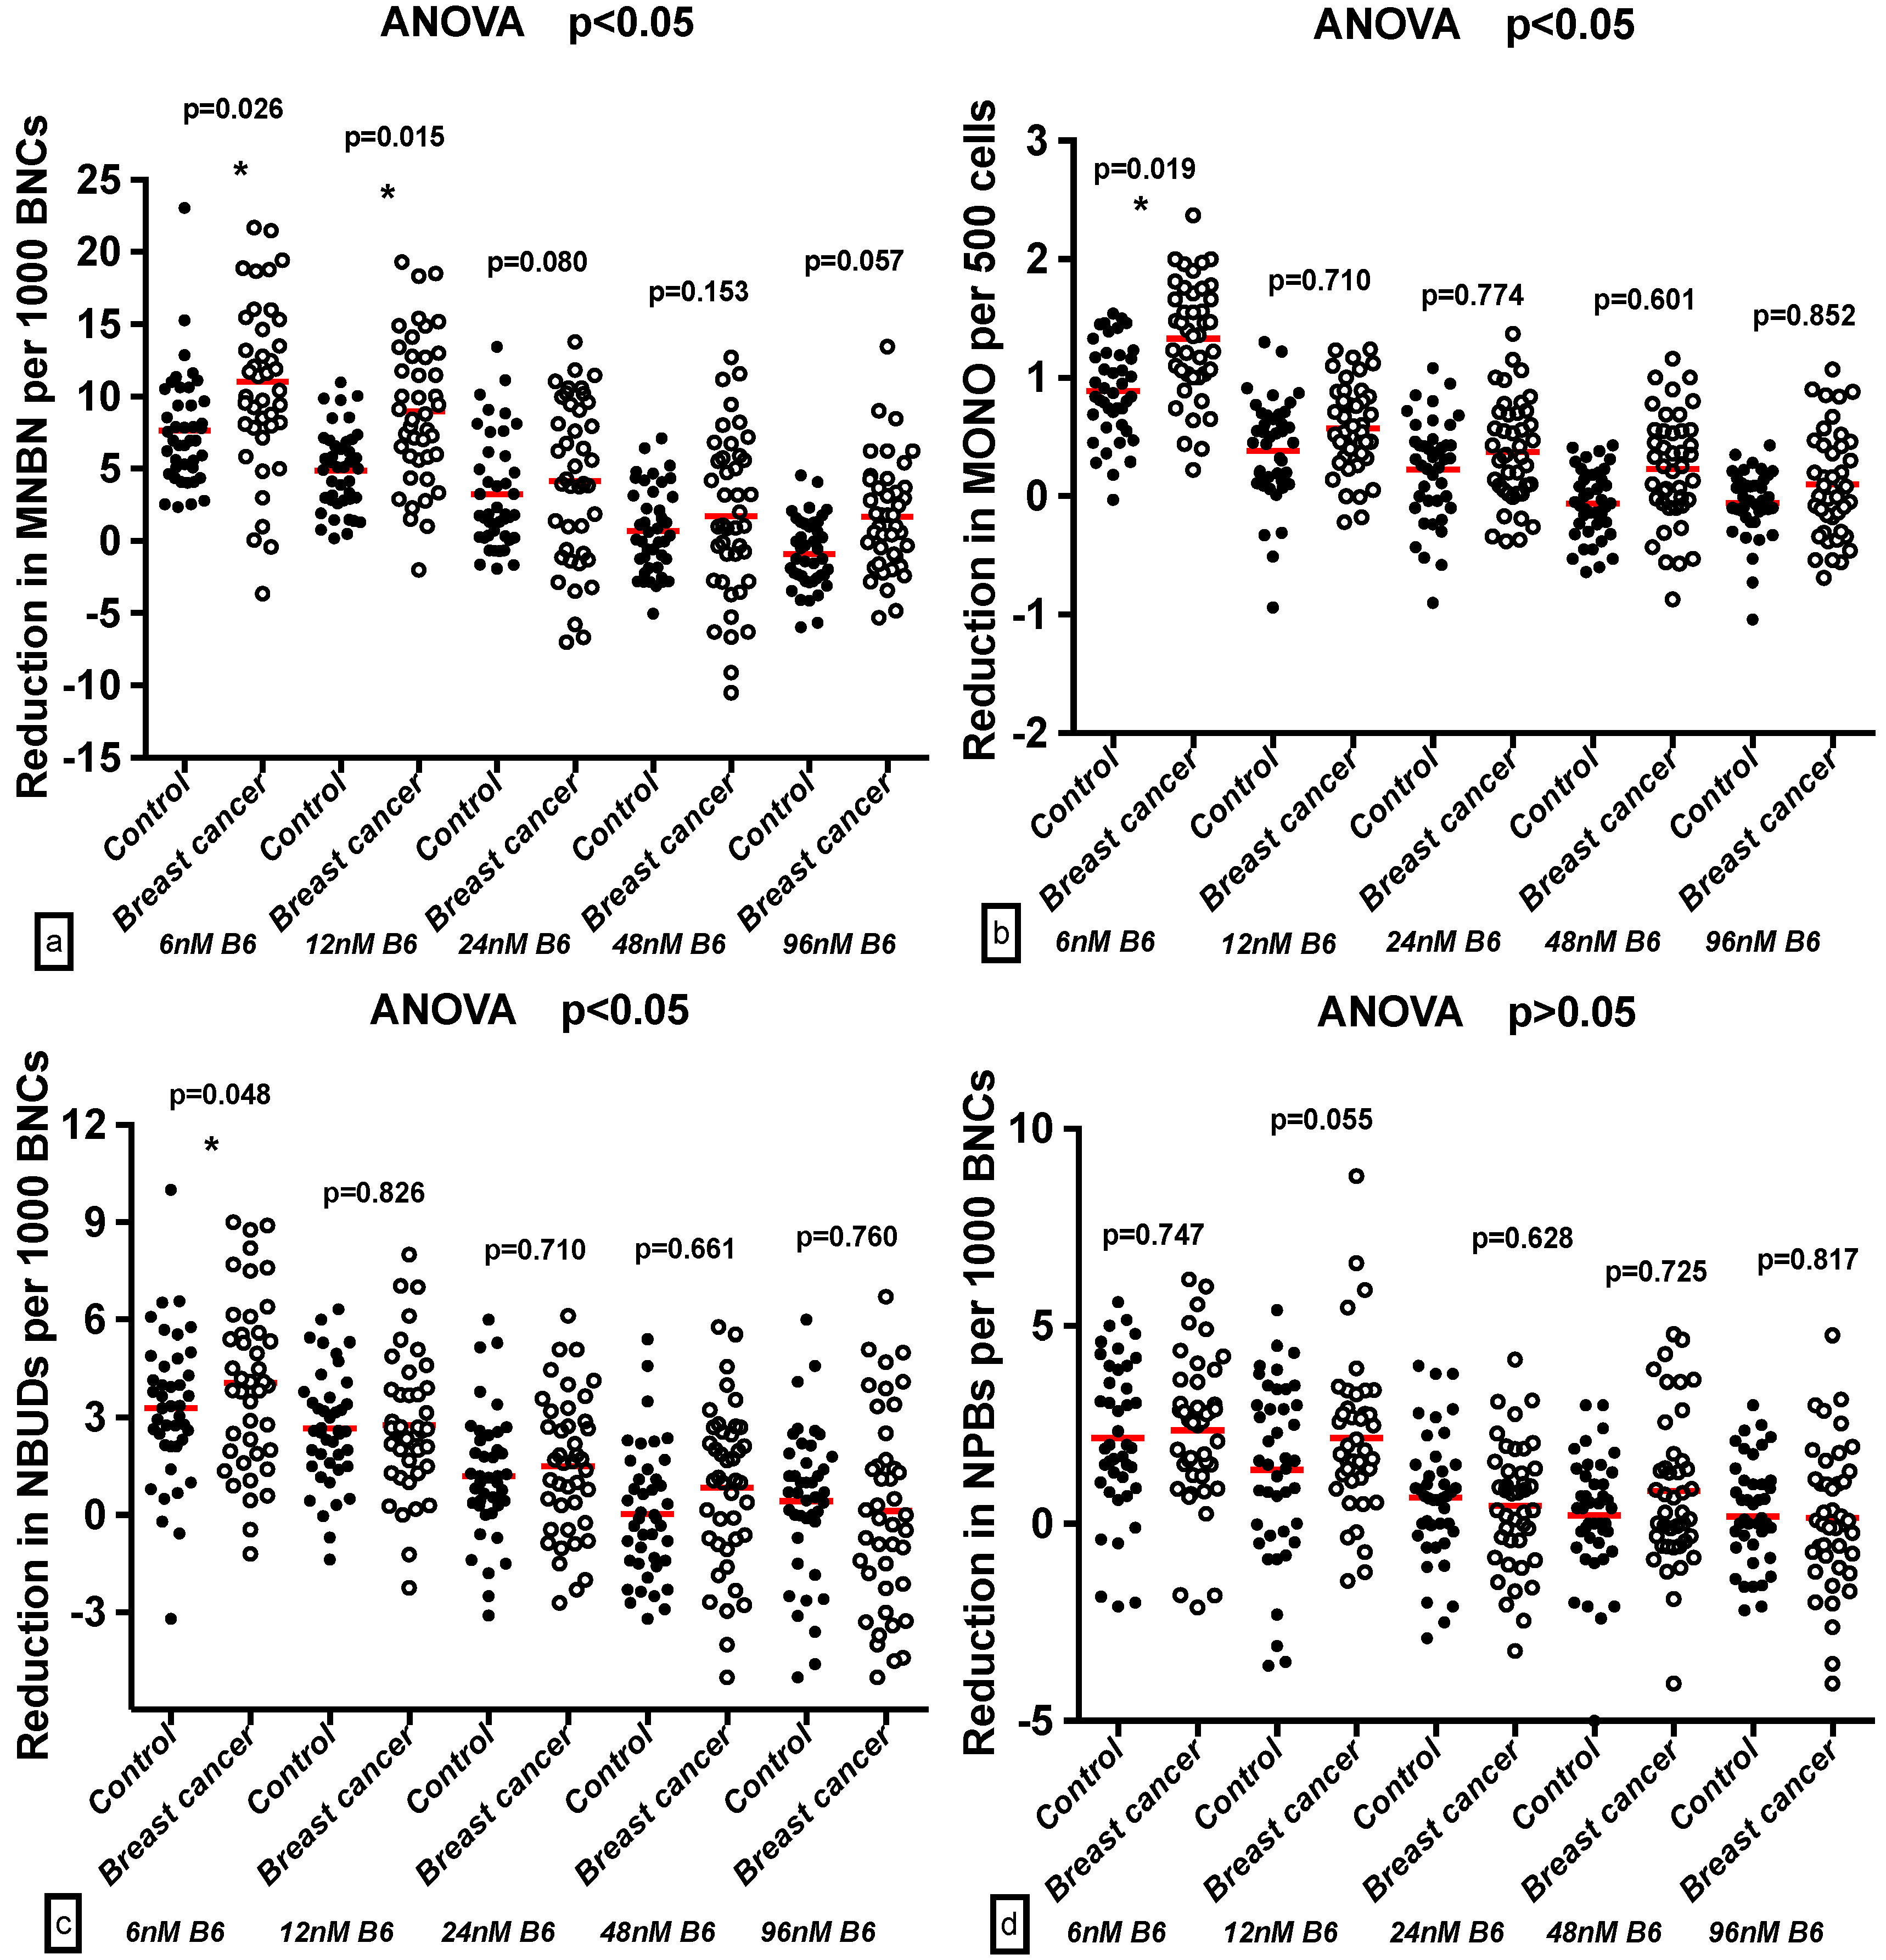
2.3. Comparison of GSACV at the Same B6 Concentration between the Breast Cancer Cases and Controls

Comparing GSACV between the breast cancer cases and controls, the MNBN, NPB, NBUD, MONO, and NEC frequencies in the controls were notably than those in the breast cancer cases at the same B6 concentrations (p < 0.001–0.05) (Figure 1).

2.4. Effect of B6 and Breast Cancer Status on GSACV

A two-way ANOVA revealed that B6 concentrations accounted for 46.15%, 30.13%, 29.66%, 3.14%, 31.65%, and 41.15% (p < 0.001–0.01) of the variance of the MNBN, NPB, NBUD, MONO, APO, and NEC frequencies, respectively, beside the breast cancer status, which accounted for 5.12%, 4.14%, and 5.45% of the variance of the MNBN, NPB, and NEC frequencies, respectively (p < 0.05). The investigation suggested that the breast cancer status affected GSACV but that the effect was less significant than that of the B6 concentration (Table 4).
The breast cancer cases and controls had distinct genomic baselines, which are derived from their different genetic backgrounds. Thus, we performed a Difference in Difference Analysis (DDA) [26] by subtracting the pooled values of the biomarker for 6 to 96 nmol/L from the scores for 200 nmol/L B6. Interestingly, we observed that the MNBN values in the breast cancer cases were significantly higher than those in the respective controls at 6 and 12 nmol/L B6 (p < 0.05). Meanwhile, the MONO and NBUD levels were notably higher than those in the controls at only 6 nmol/L (p < 0.05). There were no significant differences in the NPB, APO, and NEC occurrences between the breast cancer cases and controls. The analyses showed that there were significant differences in sensitivity to the genotoxic and cytotoxic effects of B6 deficiency between the breast cancer cases and controls with respect to MNBN, MONO, and NBUD frequencies (Figure 2).

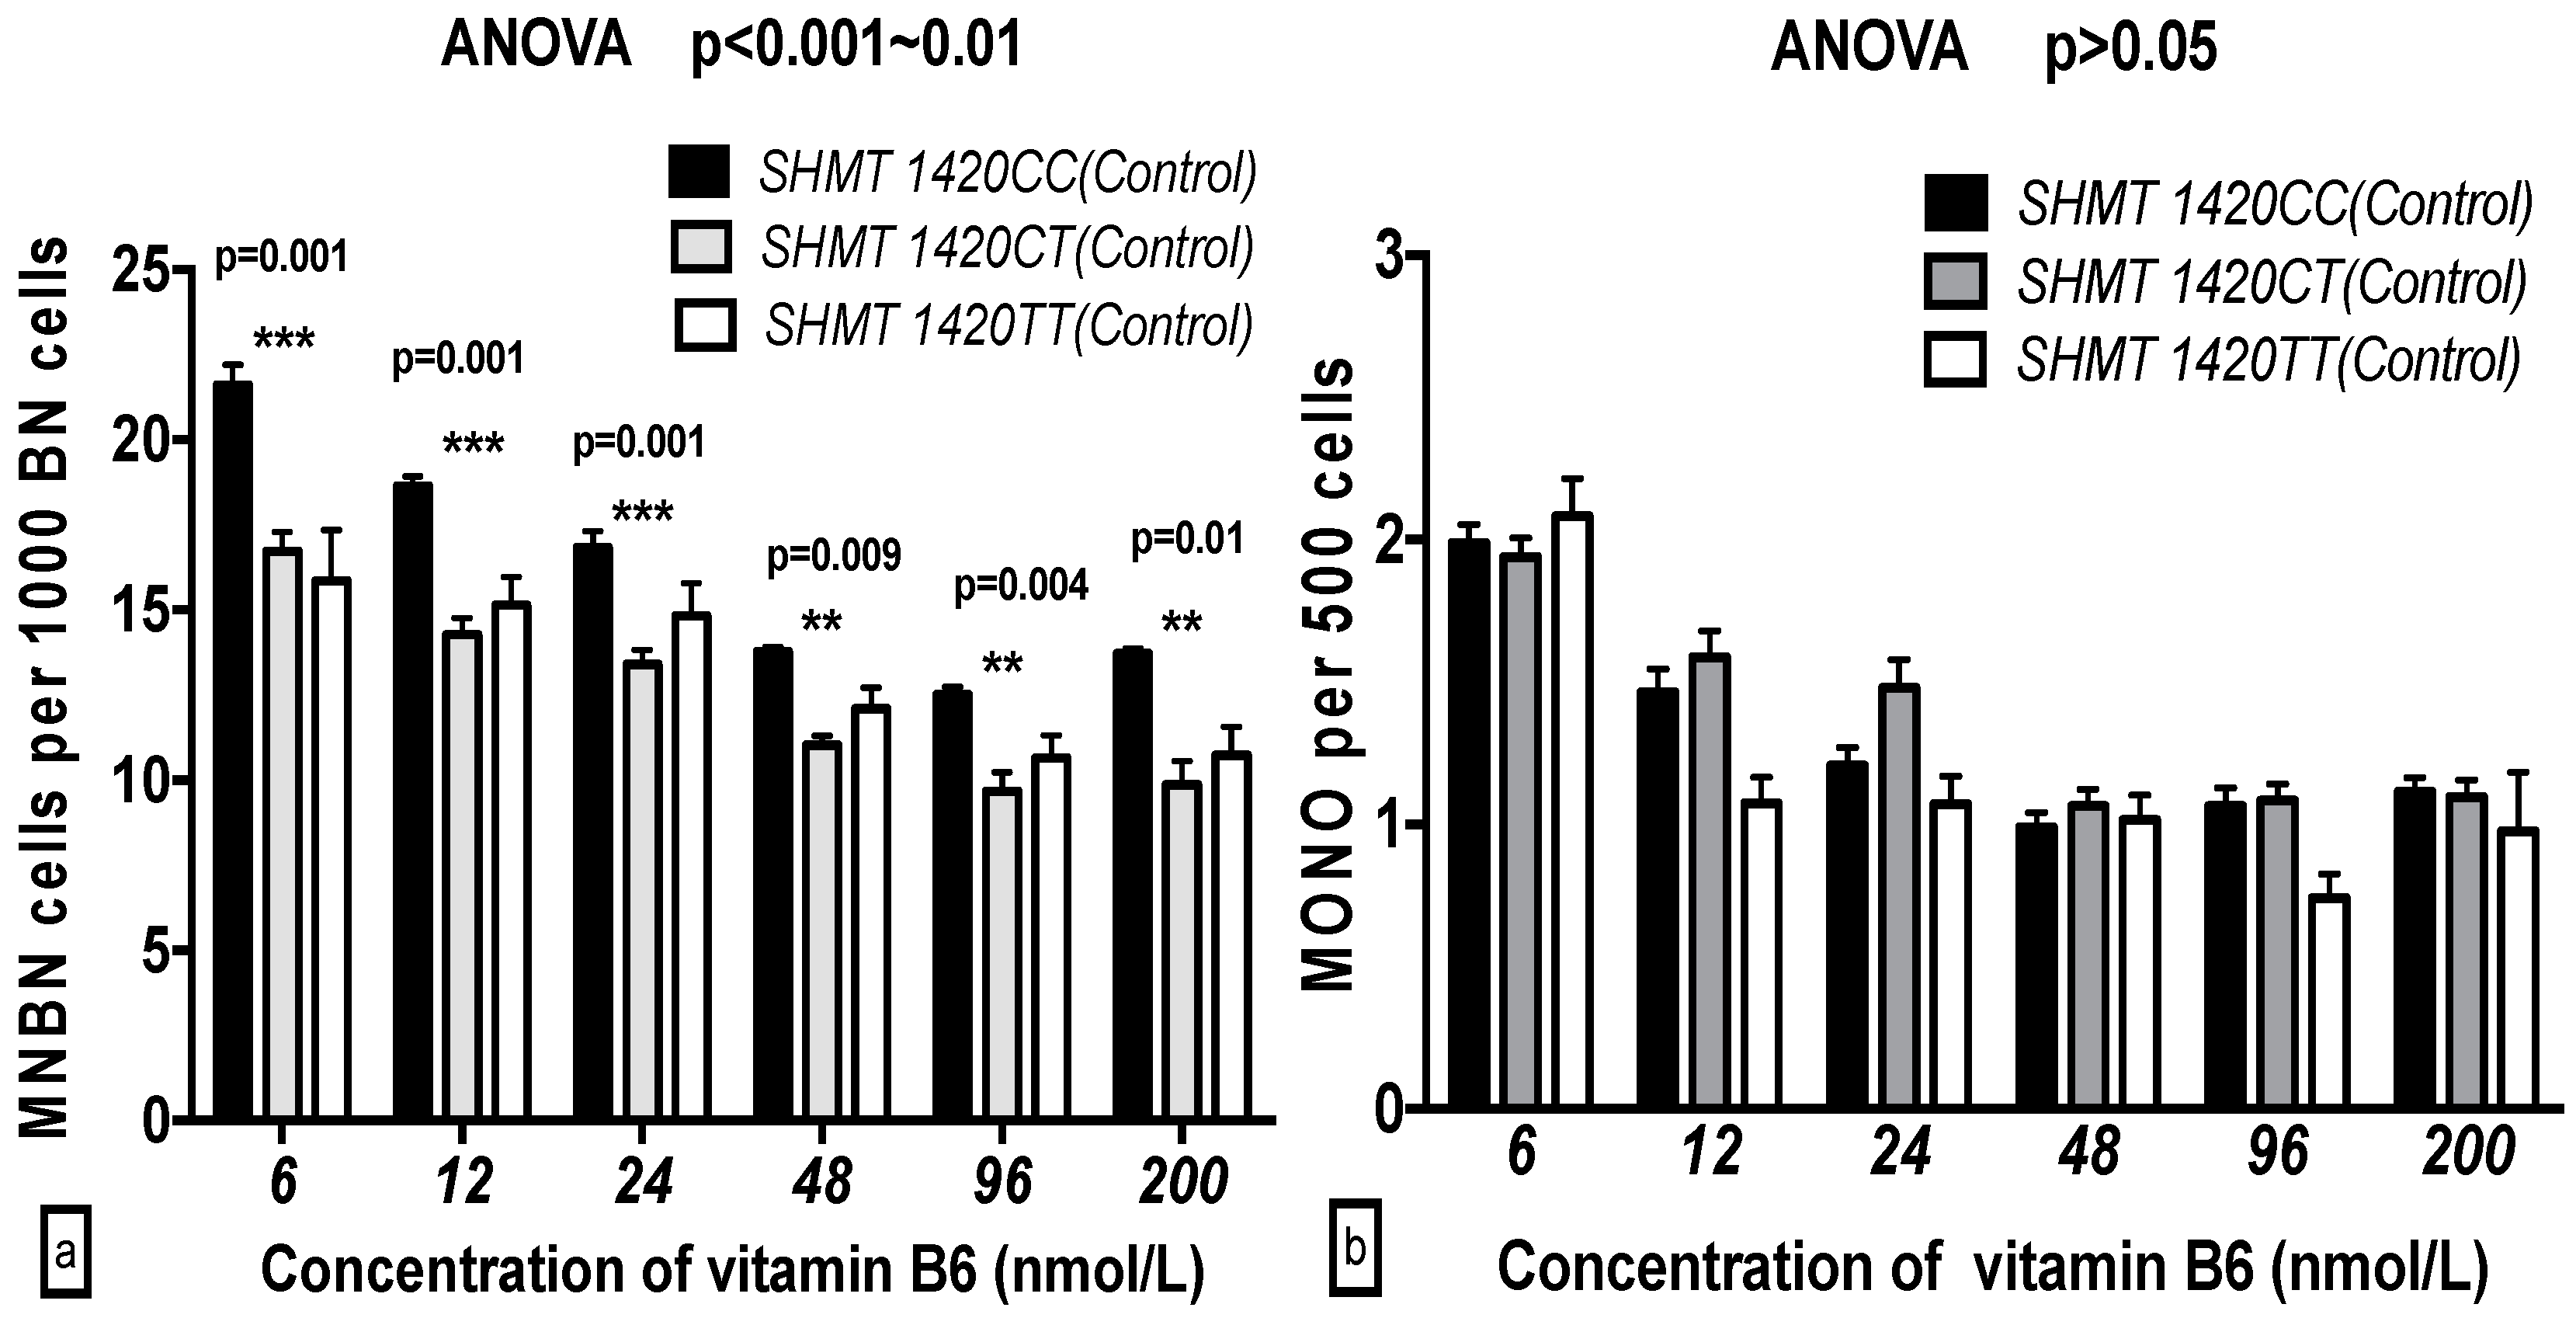
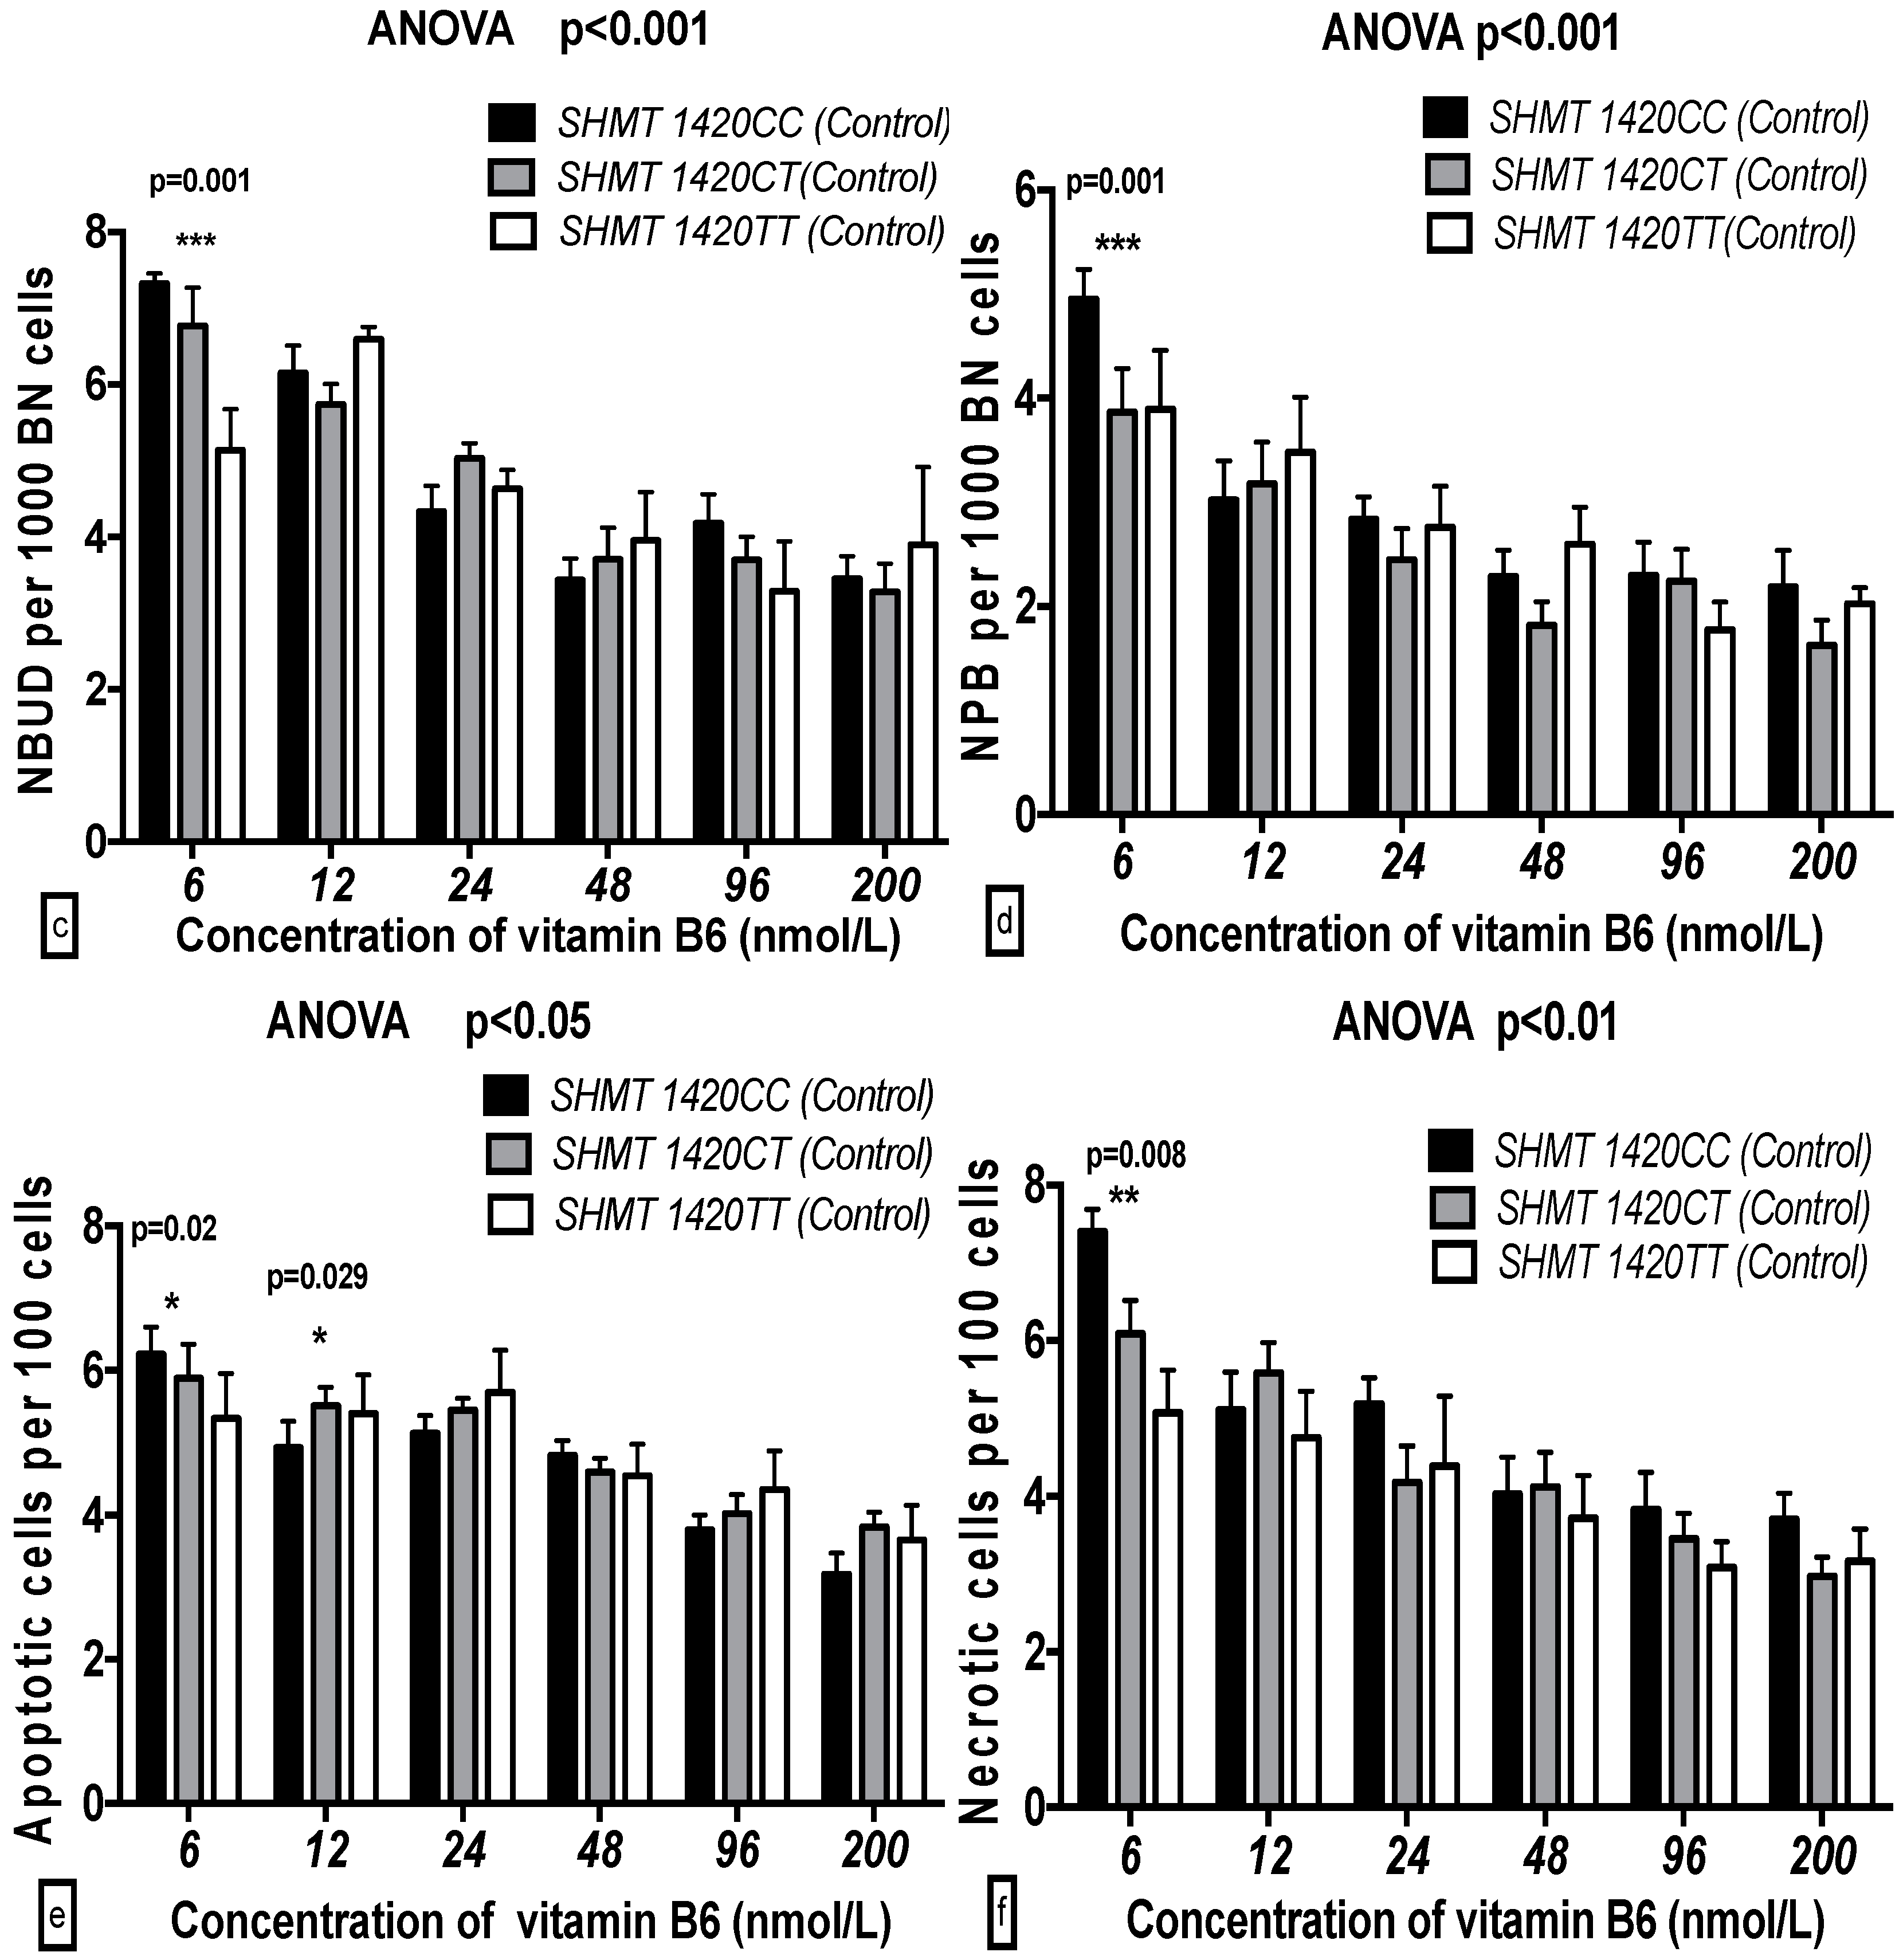
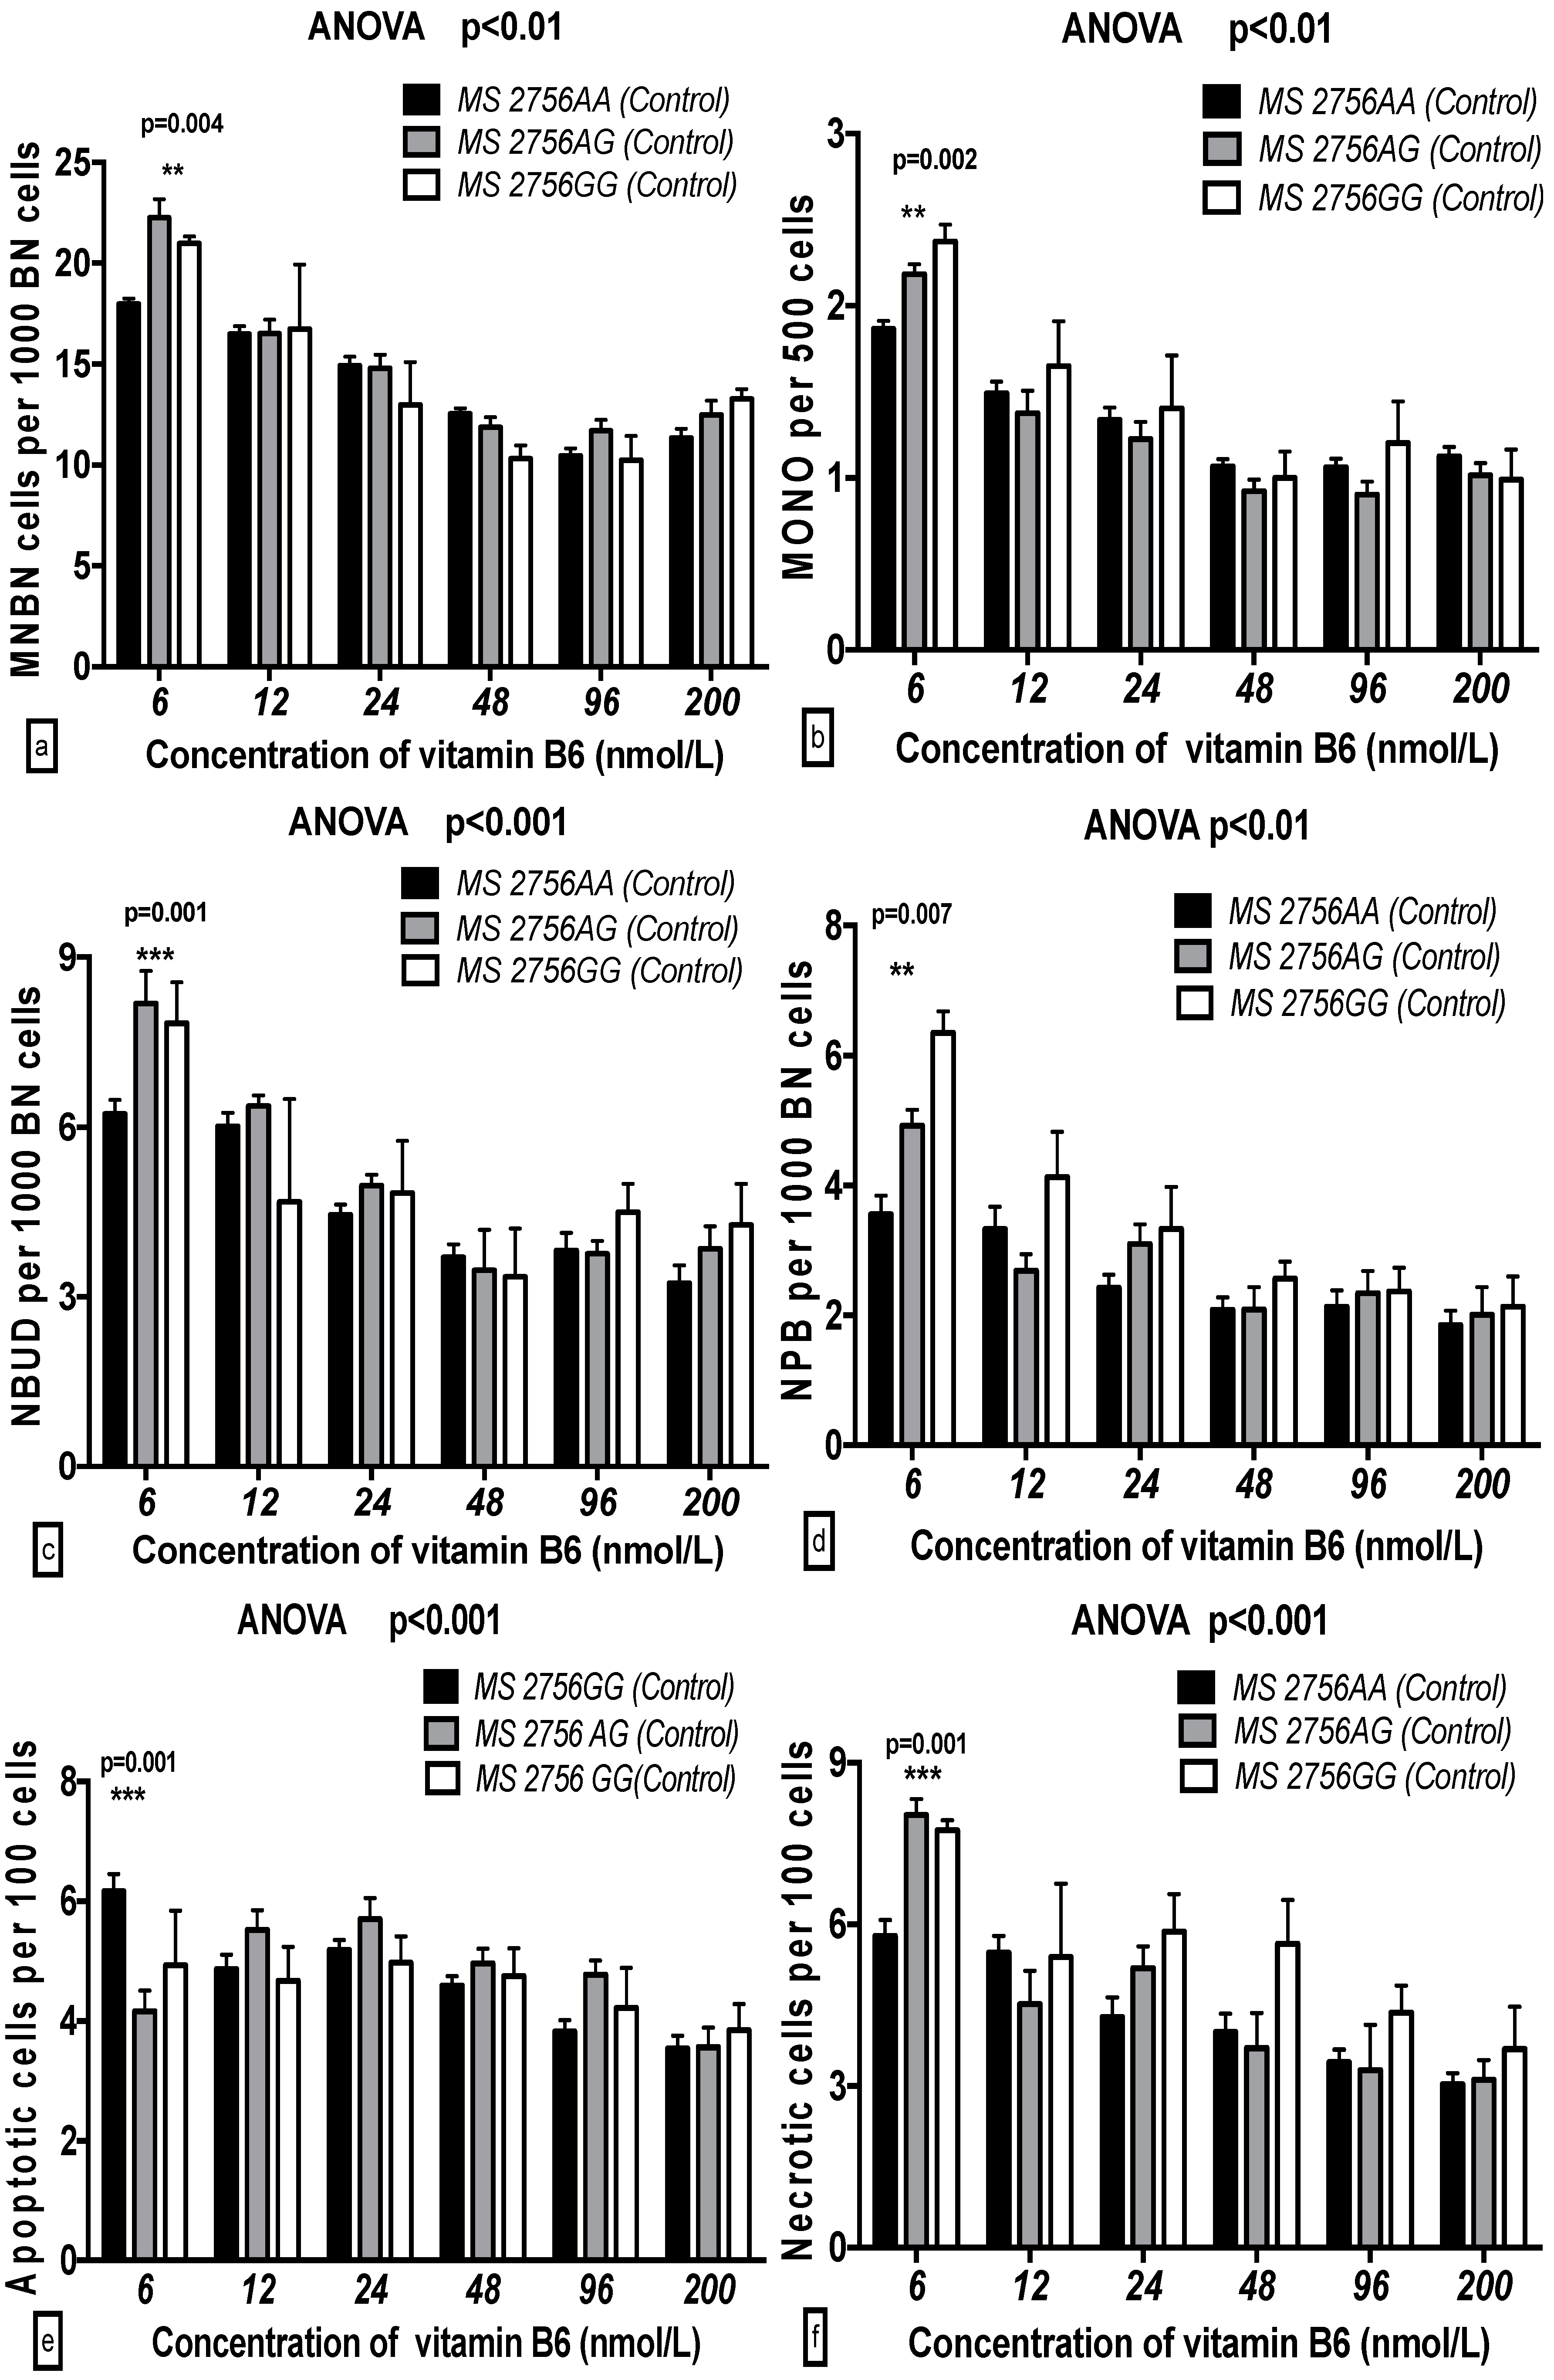
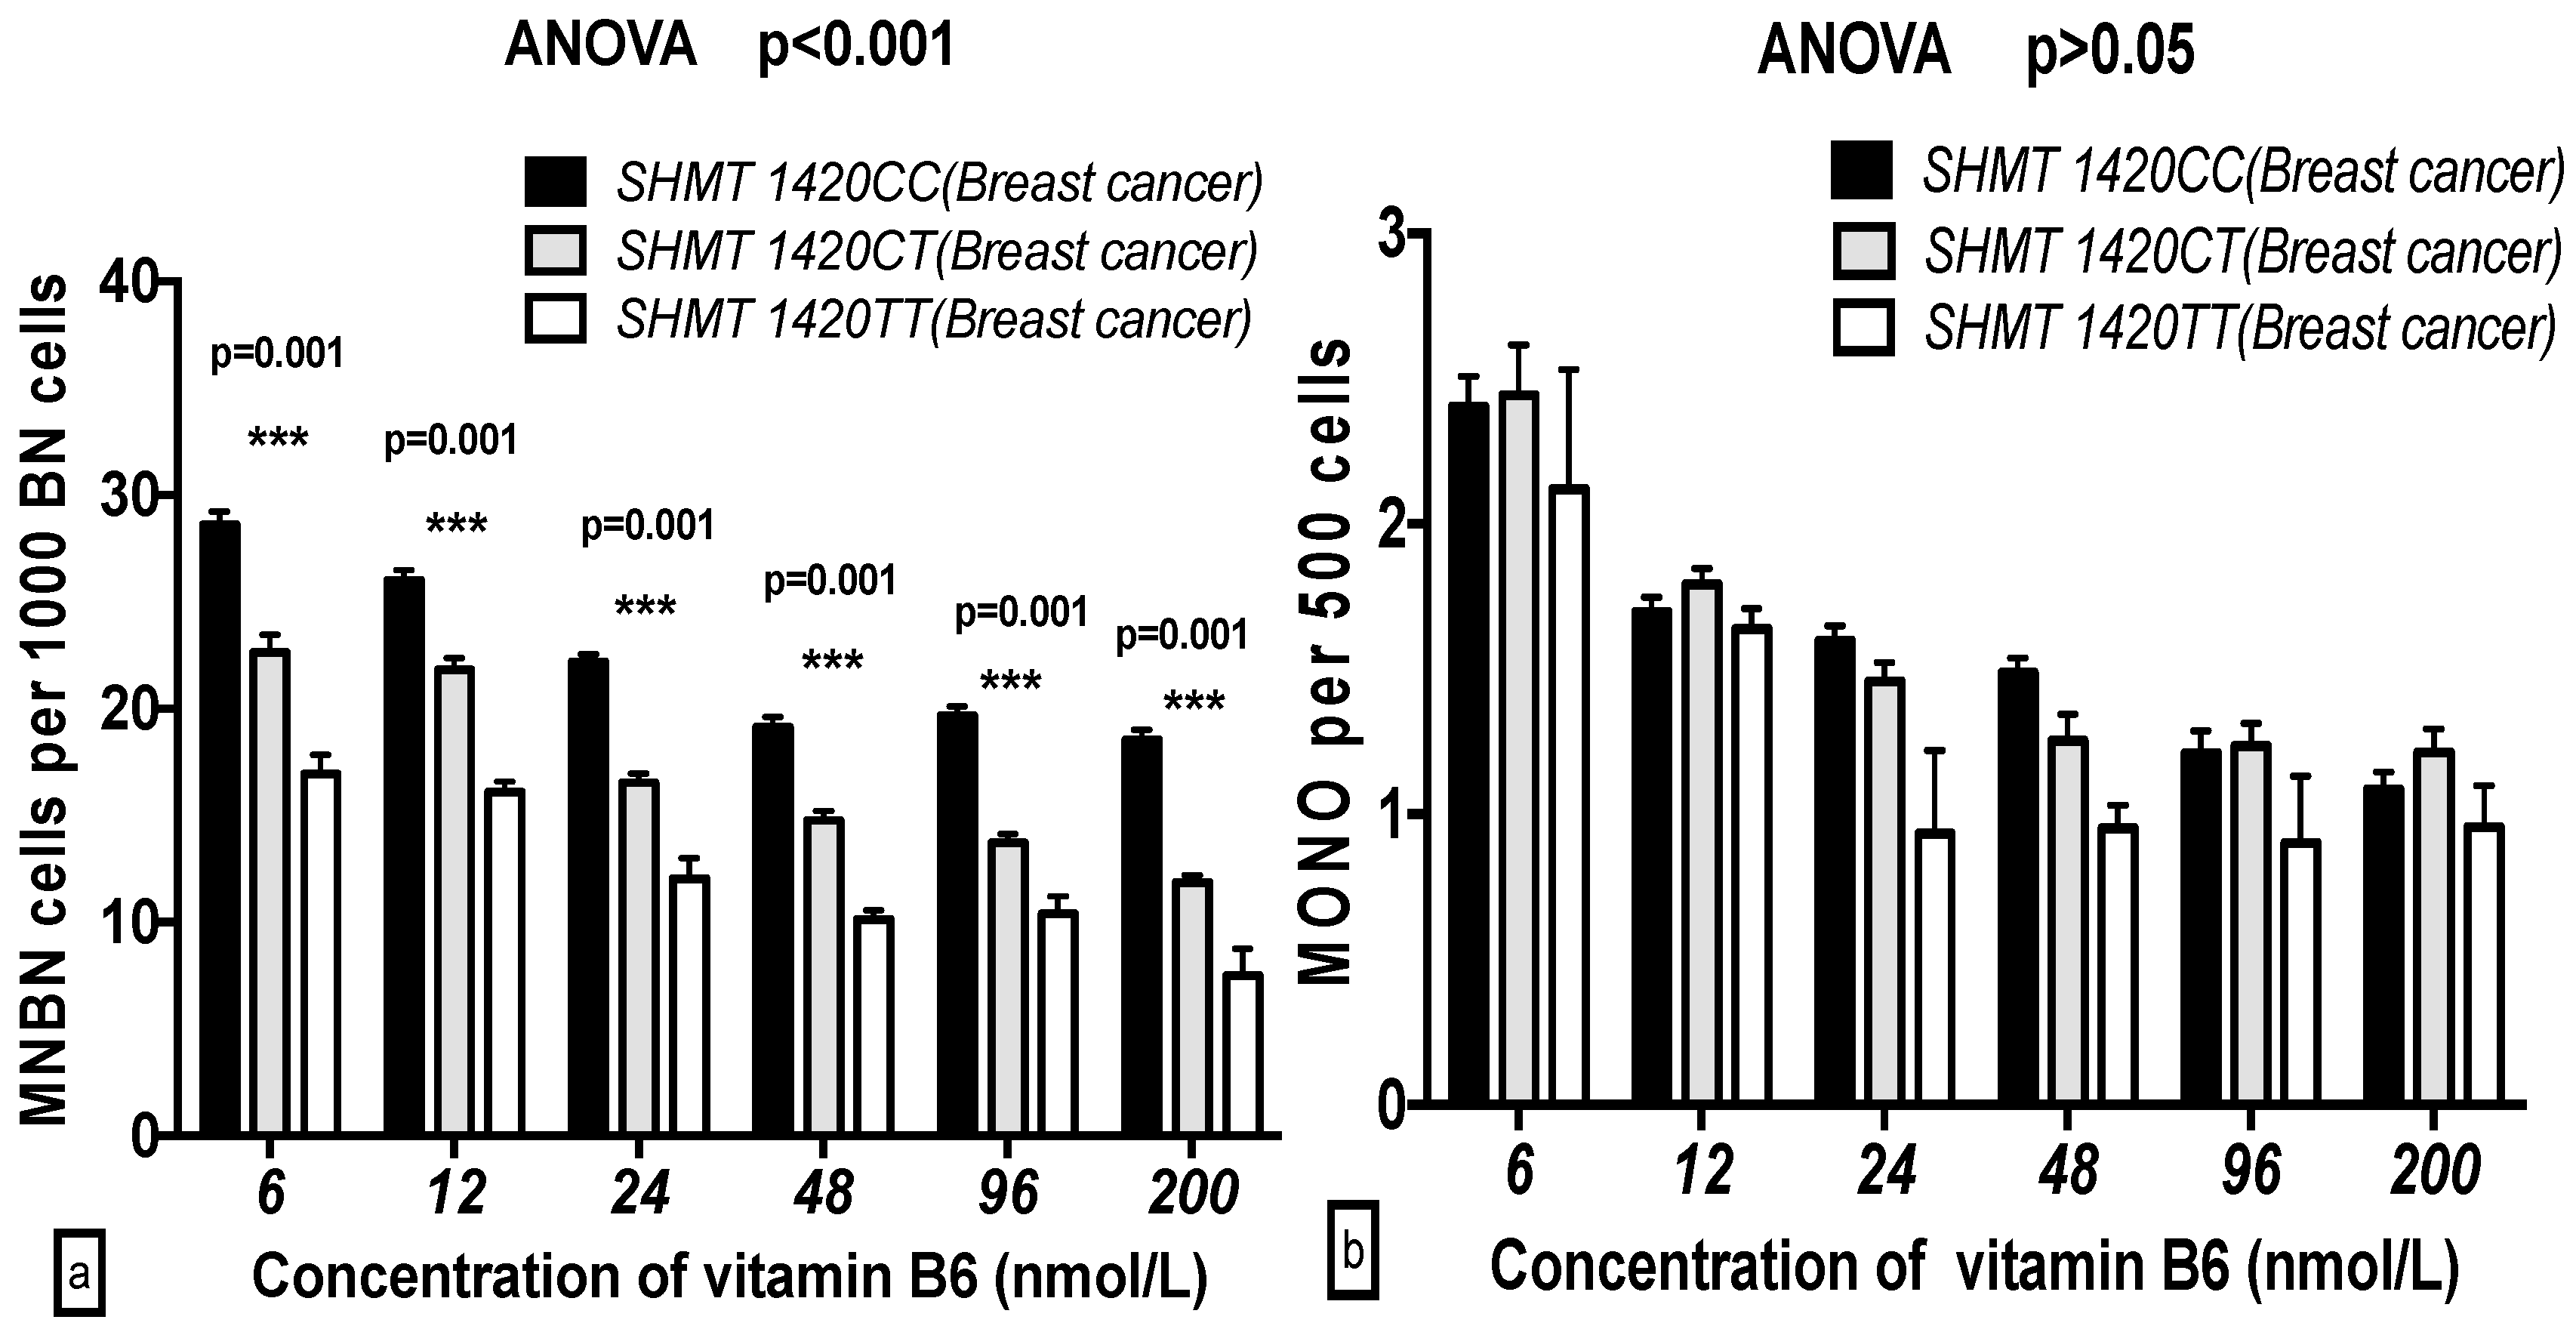
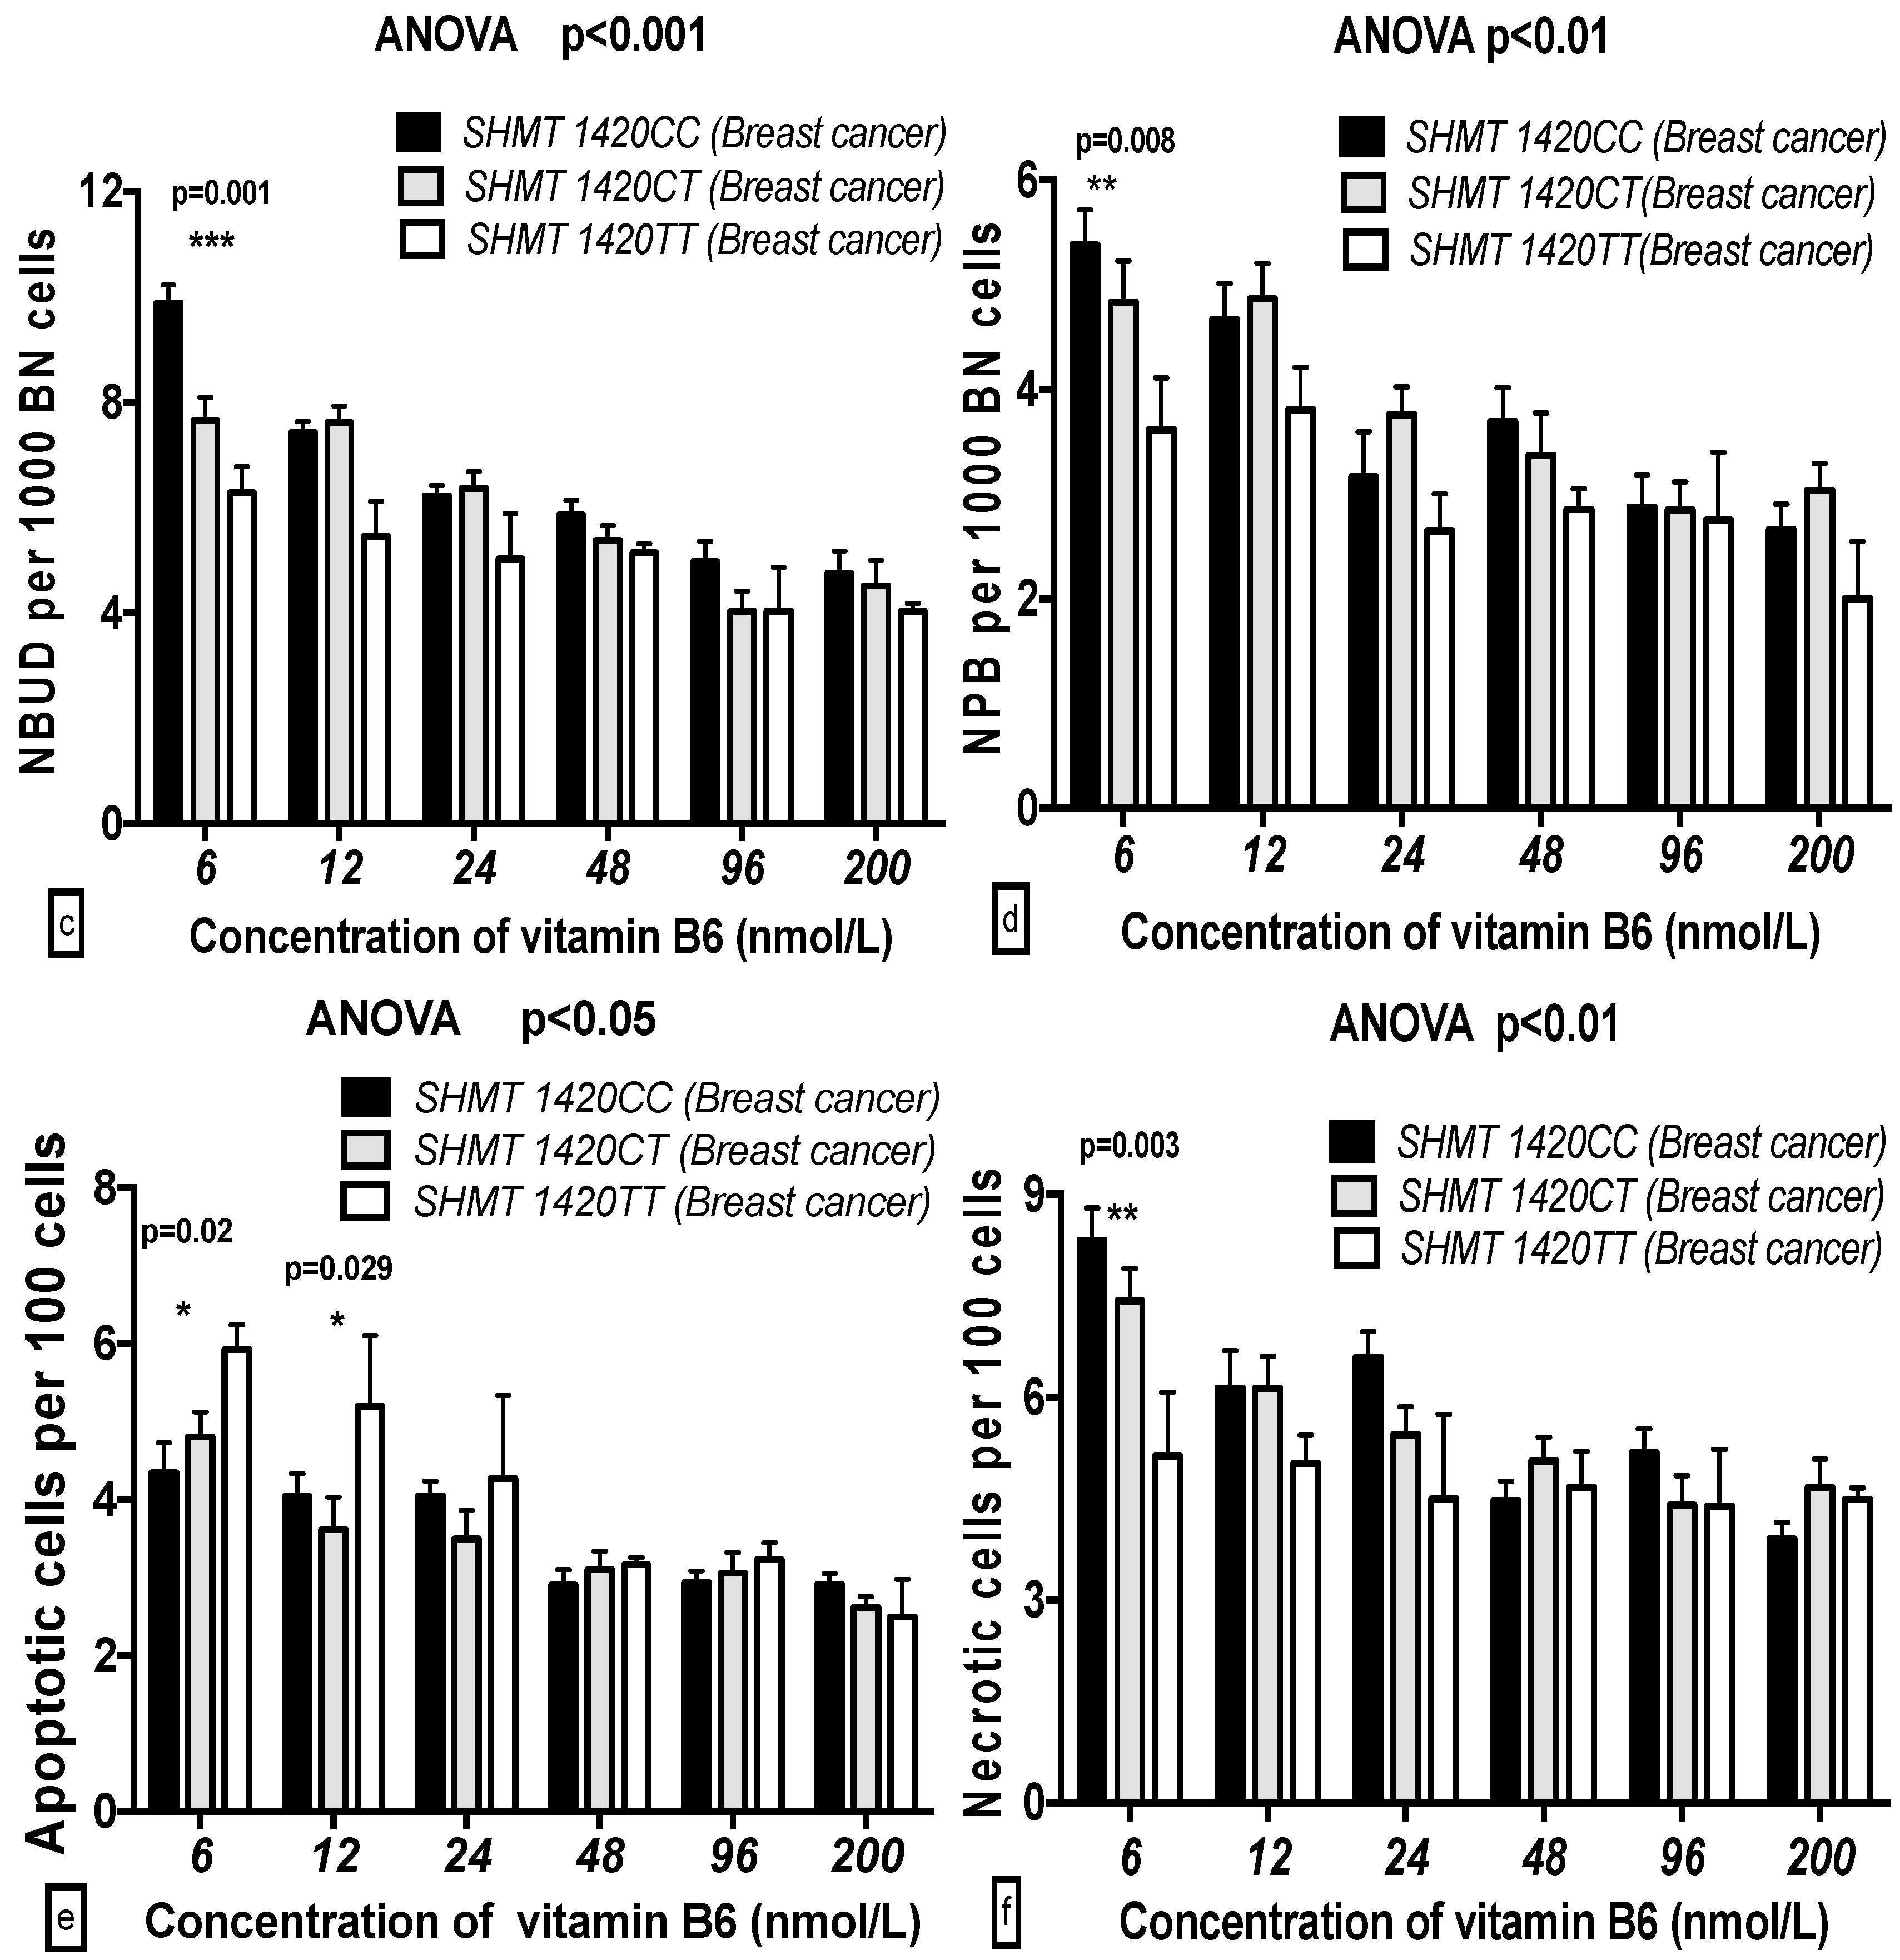
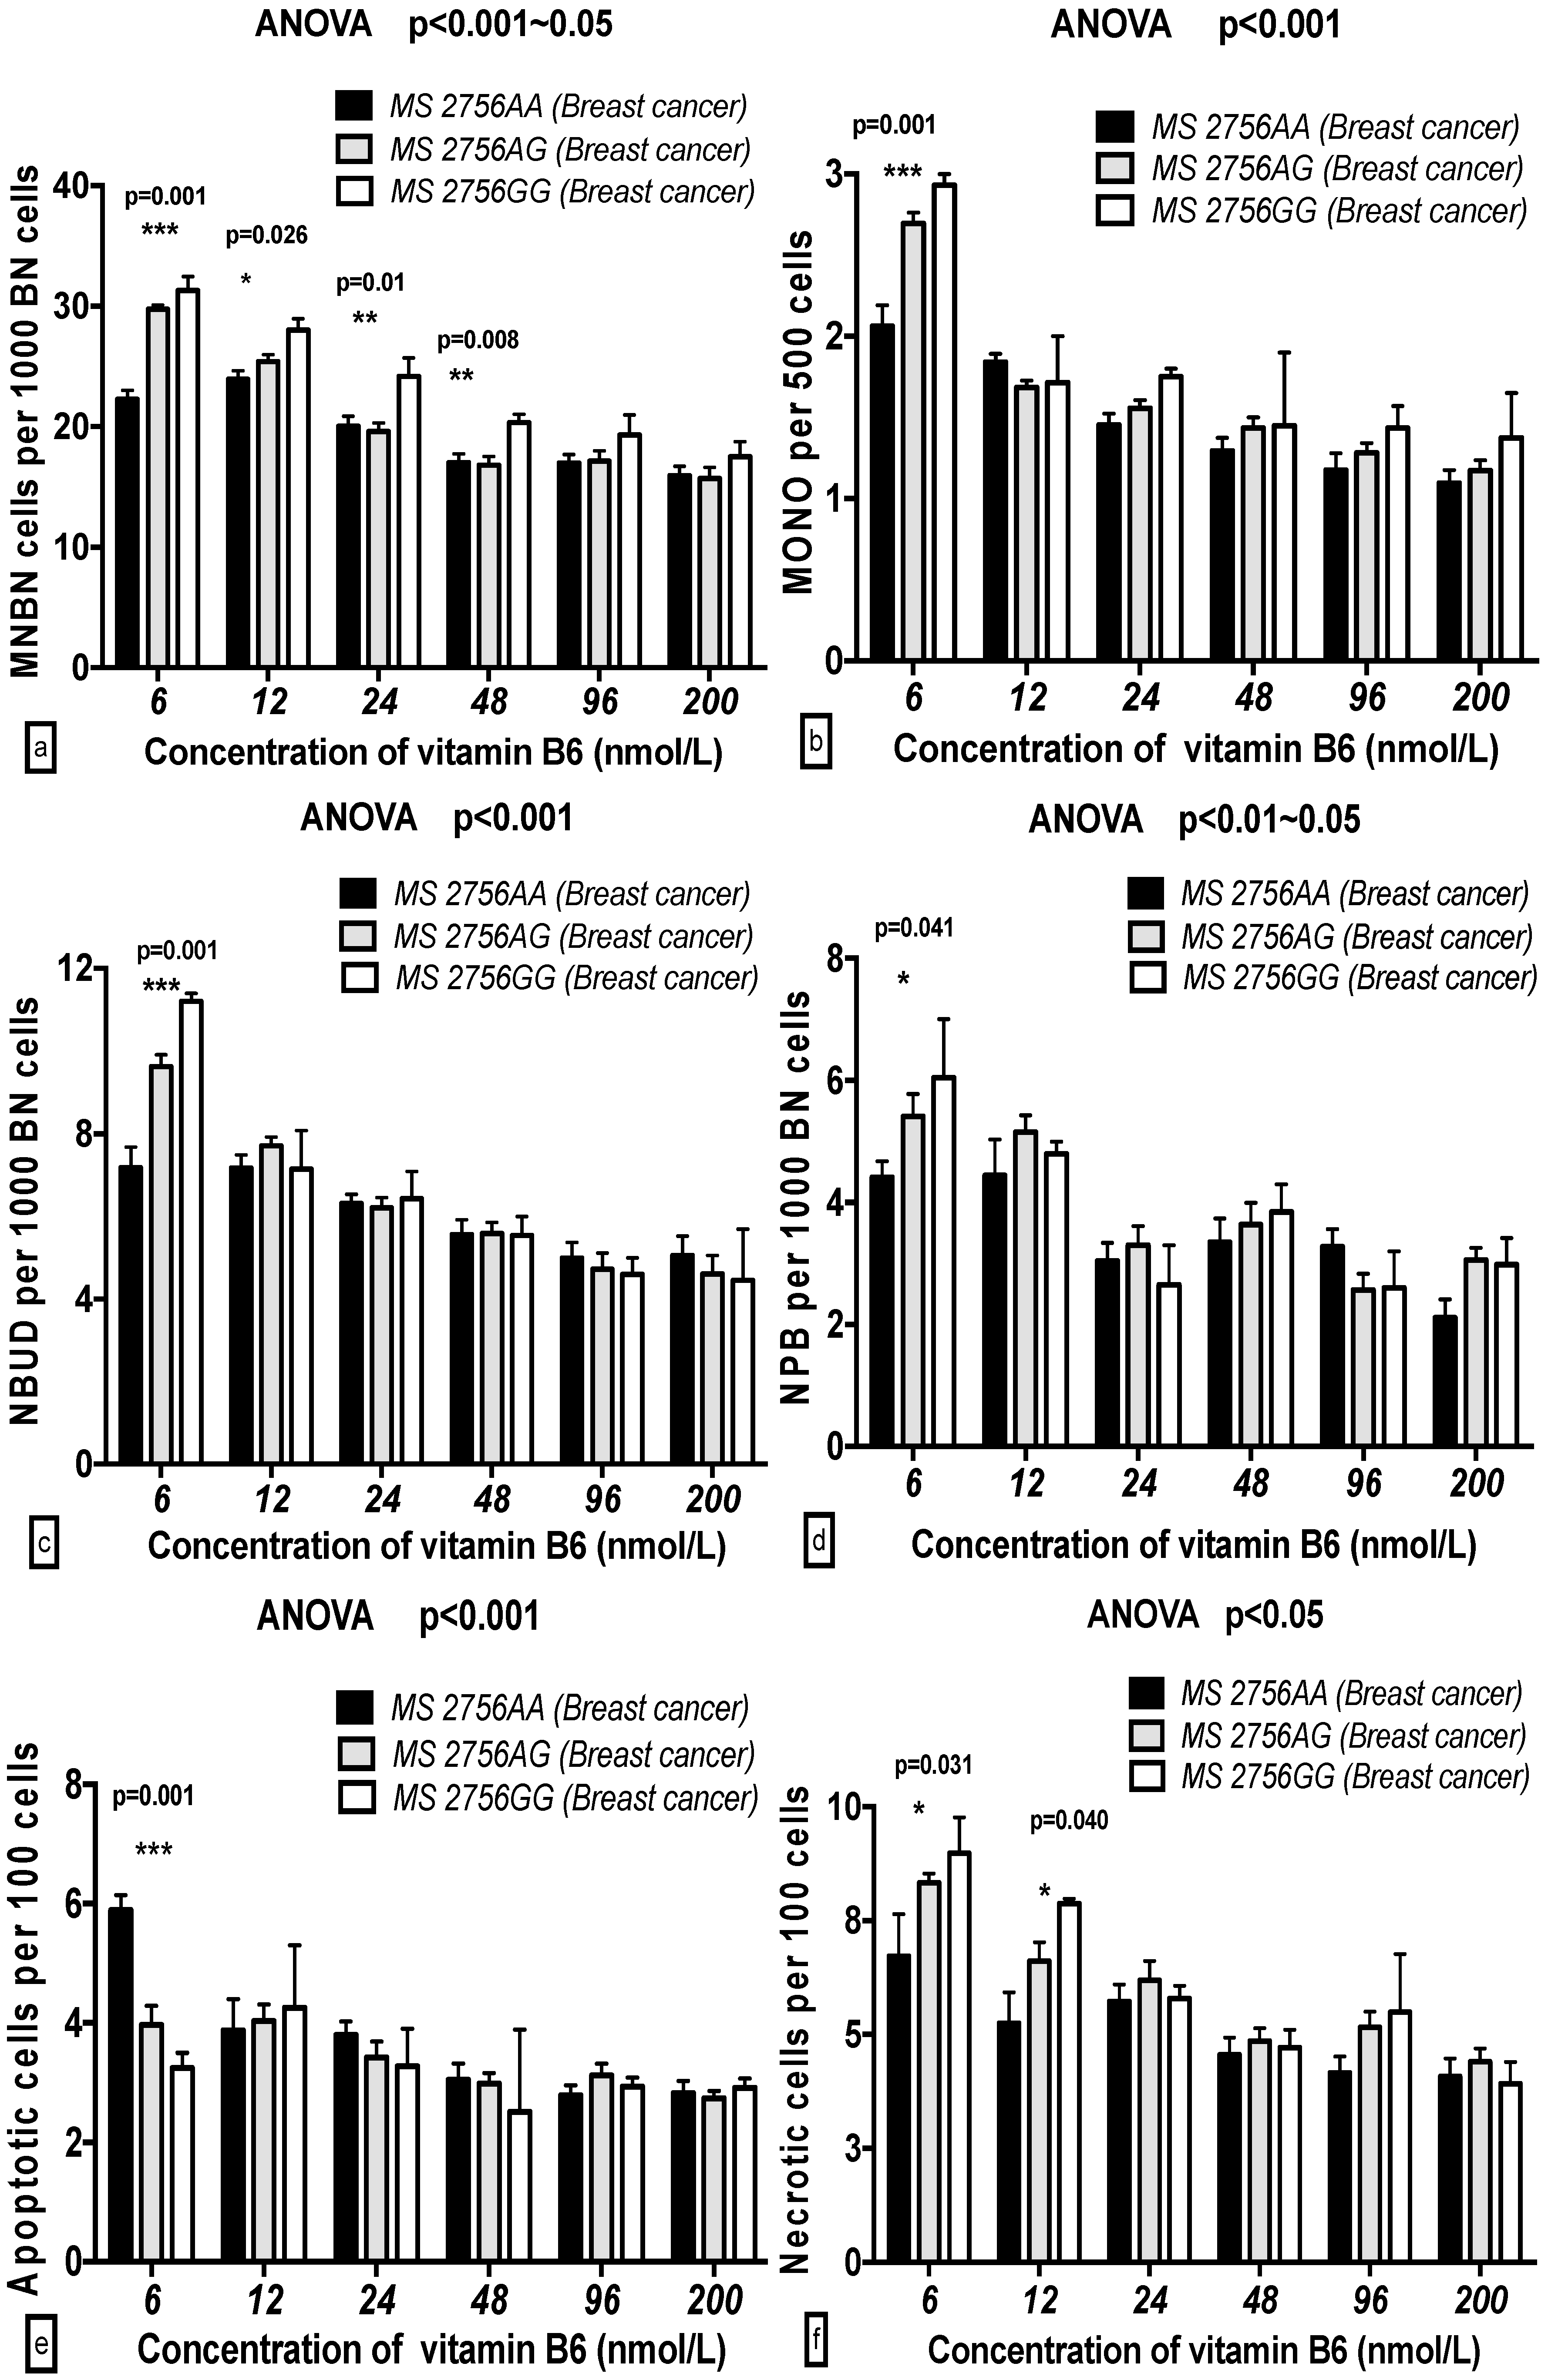
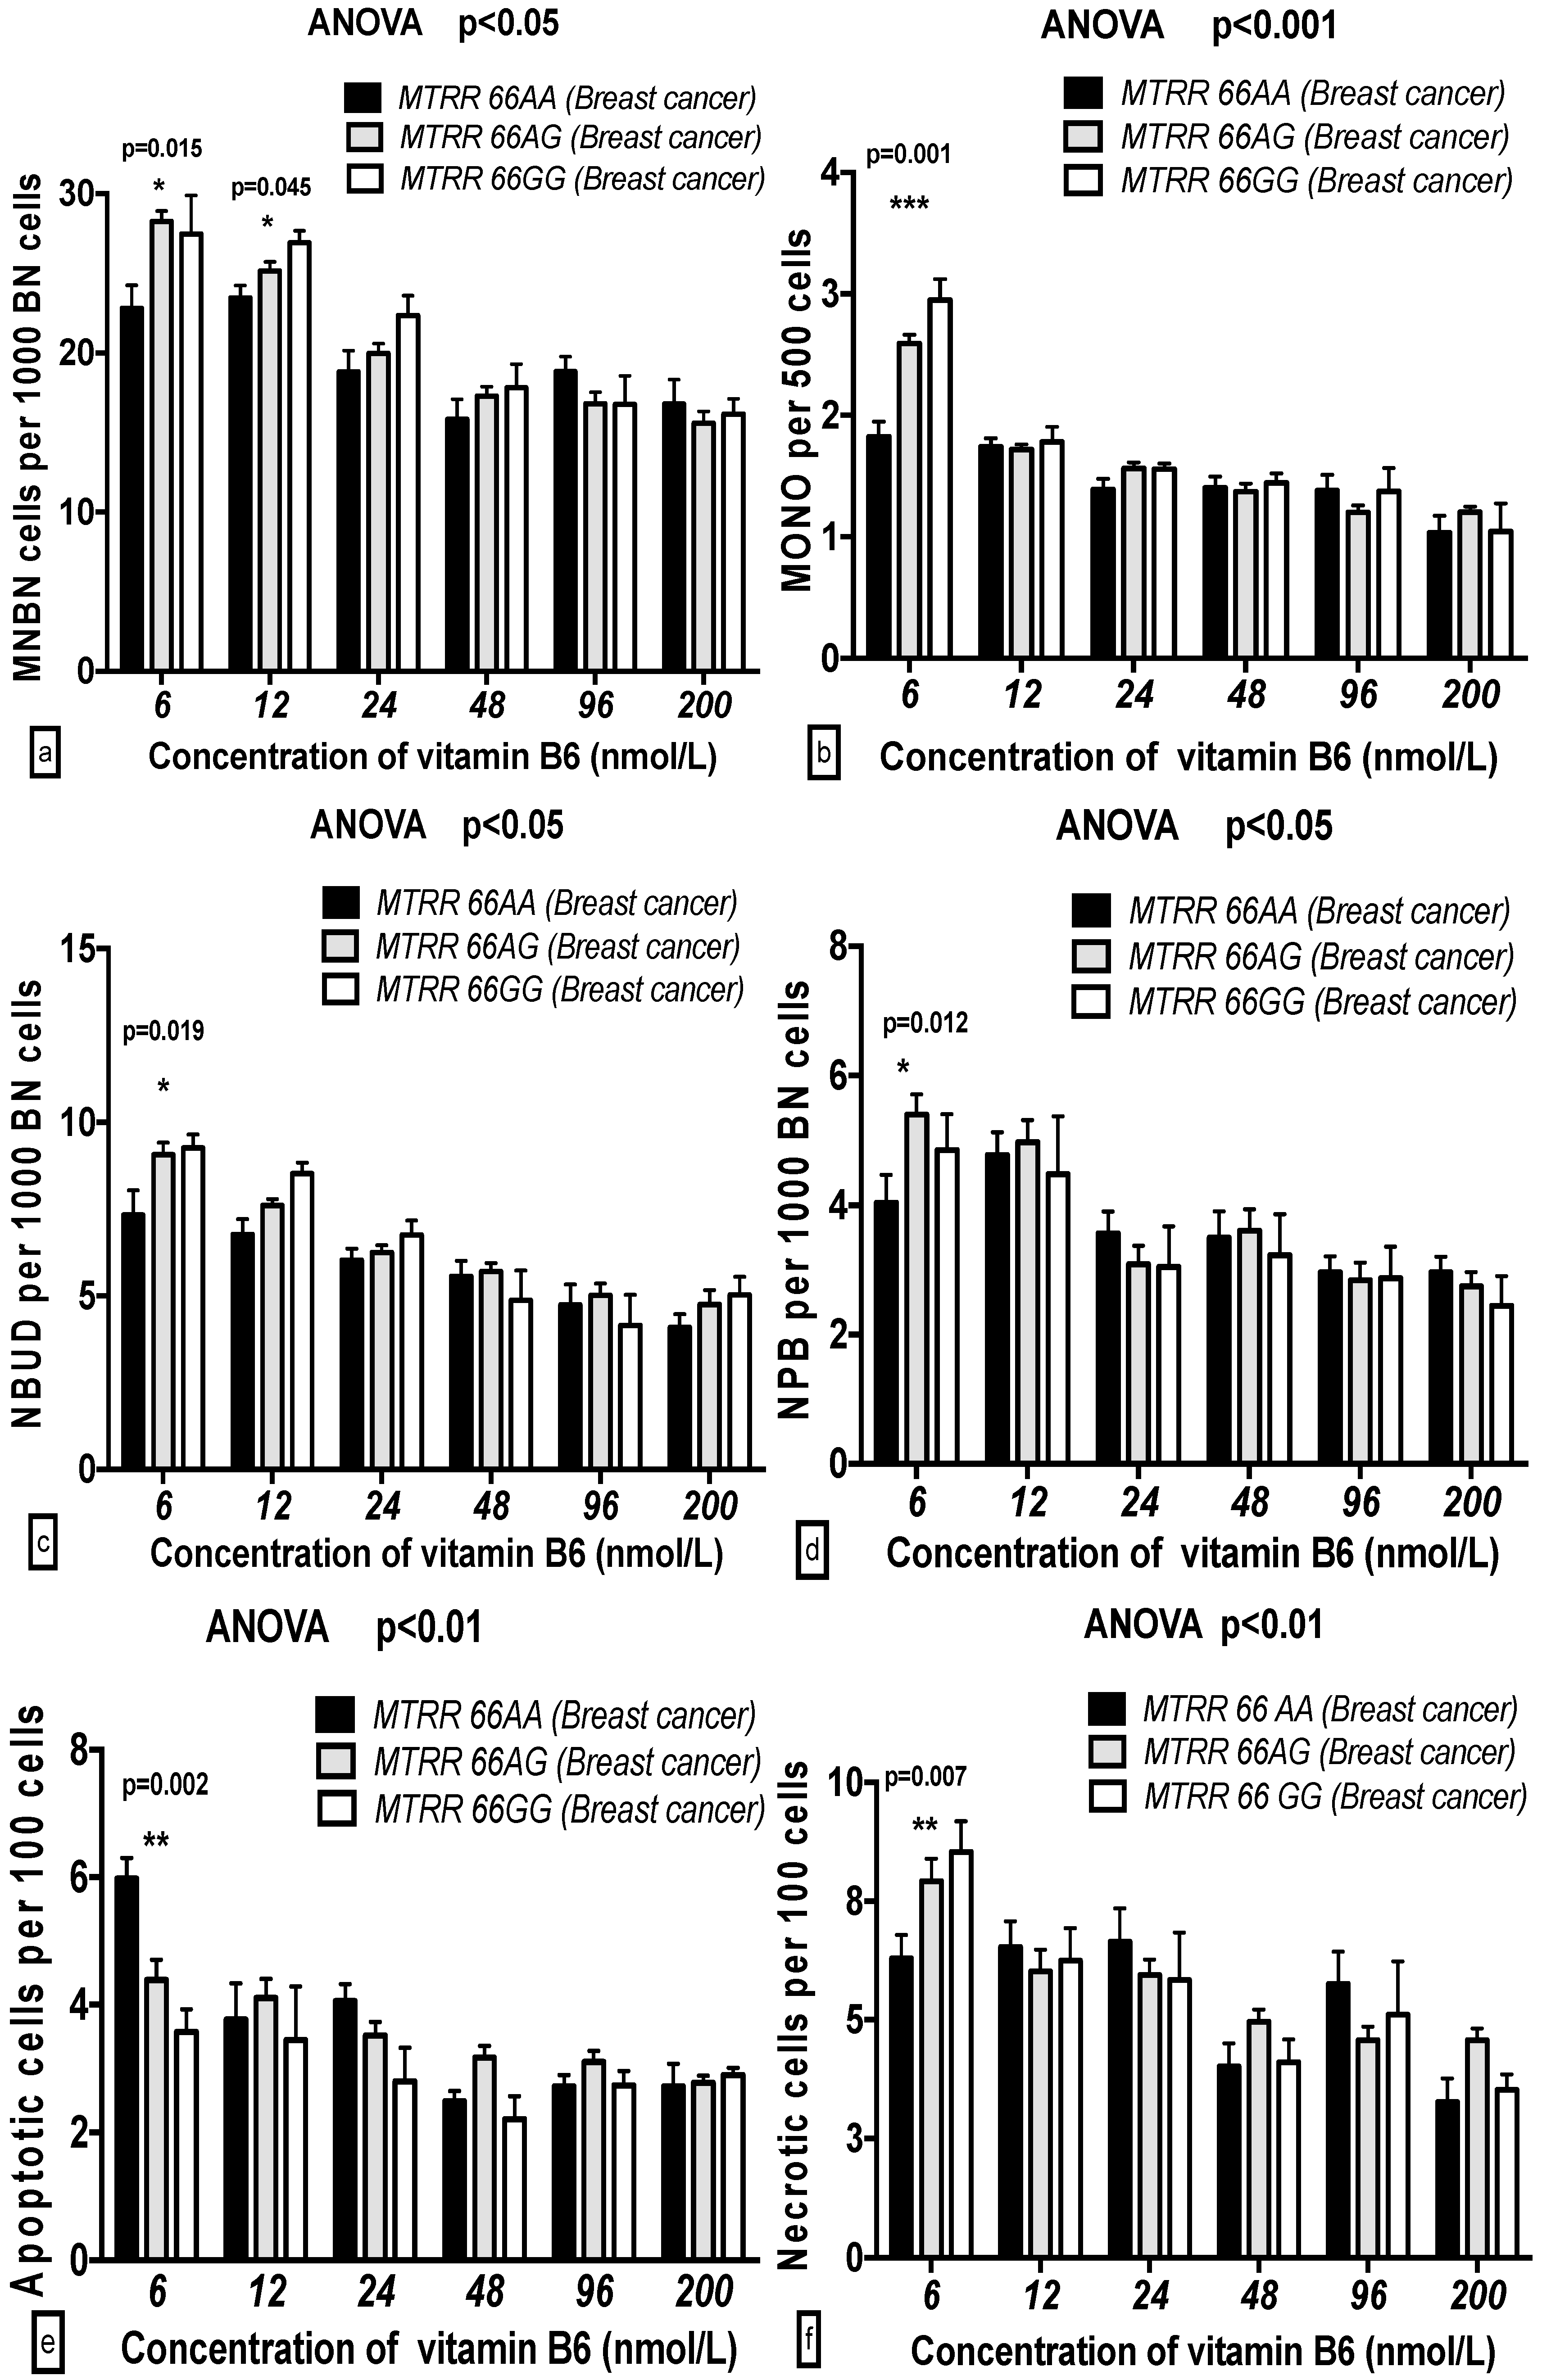
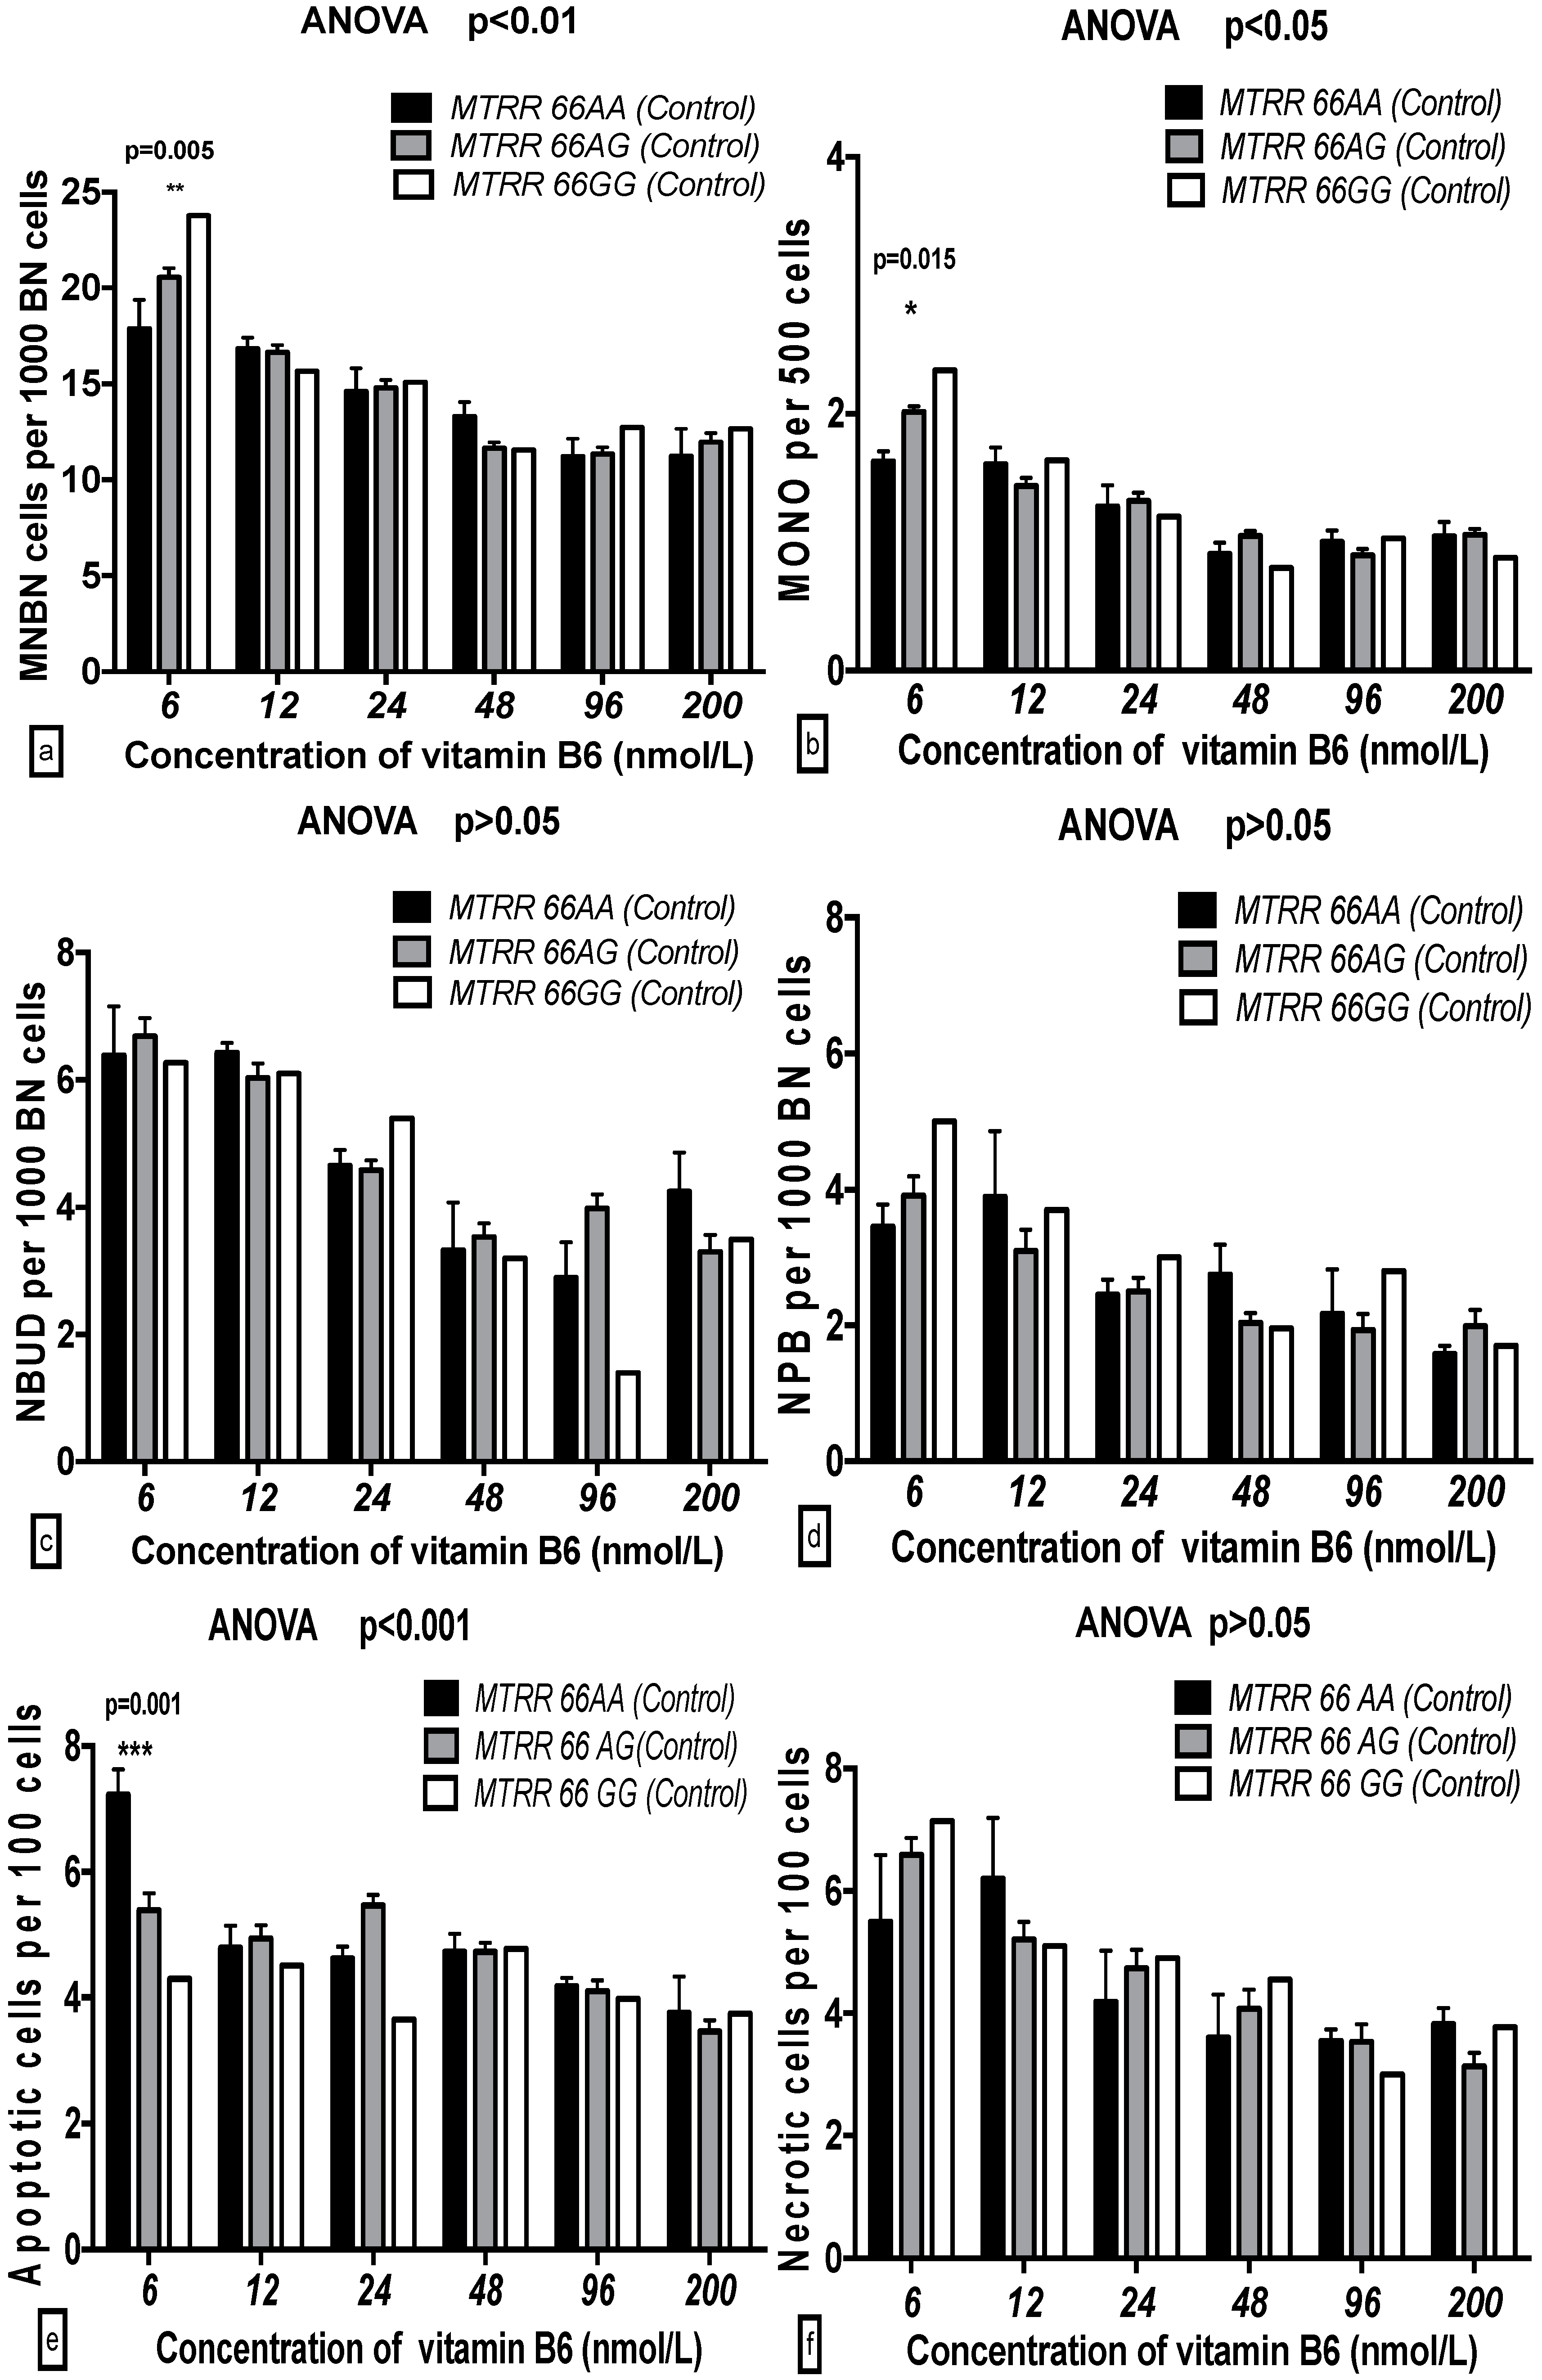
2.5. The GSACV Indexes in Different SHMT C1420T, MS A2756G, and MTRR A66G Genotypes in Breast Cancer Cases and Controls at Various B6 Concentrations

There were significant differences in the GSACV indexes (MNBN, NPB, NBUD, APO and NEC) that were observed with the different SHMT C1420T genotypes at the same B6 concentration in the breast cancer cases. In contrast, no significant differences in the GSACV indexes (NPB, NBUD, MONO, APO and NEC) with the exception of MNBN, were observed with the different SHMT C1420T genotypes at the same B6 concentration in the control groups. There was a significant increase in the MNBN frequency for the SHMT 1420CC vs SHMT 1420TT genotypes at the same concentration of B6 (p < 0.001) in both the breast cancer cases and controls. The NBUD, APO, and NEC frequencies of SHMT 1420CC were higher than those of SHMT 1420TT at 6 and 12 nmol/L B6, while the NPB frequency of SHMT 1420CC was higher than that of SHMT 1420TT only at 6 nmol/L B6 in the breast cancer cases (Figure 3 and Figure 4).
In the breast cancer cases, the MNBN frequency with the MS 2756GG genotype was significantly increased compared to that with the MS 2756AA genotype at 6 to 48 nmol/L B6 (p < 0.001–0.05), whereas the MONO, NBUD, NPB, and NEC frequencies with the MS 2756GG genotype were significantly enhanced compared to those with the MS 2756AA genotype at 6 and 12 nmol/L B6 (p < 0.001–0.05). The APO frequency with the MS 2756GG genotype was enhanced at 6 nmol/L B6. In the controls, none of the GSACV (MNBN, MONO, NPB, NBUD, APO and NEC) indexes were significantly different for the different genotypes at the same concentration of B6 (Figure 5 and Figure 6).
The MNBN, MONO, and APO frequencies with the MTRR 66GG genotype were significantly increased compared to those with the MTRR 66AA genotype at 6 nmol/L B6 in both the breast cancer cases and controls. The NBUD frequency with the MTRR 66AA genotype was markedly decreased compared to that of MTRR 66GG at 6 nmol/L B6 only in the breast cancer cases and not in the controls (Figure 7 and Figure 8).

2.6. The Effects of the Strength and Variation Analysis of B6 and SHMT C1420T, MS A2756G, and MTRR A66G Polymorphisms on GSACV by Two-Way ANOVA

A two-way ANOVA indicated that the B6 concentration accounted for 36.07%, 20.81%, 30.42%, 41.87%, 19.88%, and 22.73% of the variance of the MNBN, NPB, NBUD, MONO, NEC, and APO frequencies, respectively (p < 0.001). However, the SHMT C1420T polymorphisms only explained 21.10%, 2.18%, and 2.31%, of the MNBN, MONO, and NEC frequencies (p < 0.001–0.01), respectively, in the controls. The B6 concentration accounted for 16.58%, 7.19%, 11.94%, 21.60%, 5.68%, and 13.09% of the variance of the MNBN, NPB, NBUD, MONO, NEC, and APO frequencies, respectively (p < 0.001). However, the SHMT C1420T polymorphisms only explained 30.36%, 1.56%, and 3.21% of the MNBN, MONO, and NBUD frequencies (p < 0.001–0.01), respectively, in the breast cancer cases. There was only an interaction between the B6 concentration and the SHMT C1420T polymorphisms for the NBUD biomarker in the breast cancer cases (Table 5).
The B6 concentration accounted for 28.45%, 20.23%, 17.77%, 35.30%, 18.19%, and 7.98% of the variance of the MNBN, NPB, NBUD, MONO, NEC, and APO frequencies, respectively (p < 0.001). However, the MS A2756G polymorphisms only explained 1.31%, 1.45%, and 2.76% of the MNBN, NBUD, and NPB frequencies (p < 0.001–0.01), respectively, in the controls. The B6 concentration accounted for 20.68%, 11.68%, 19.86%, 23.69%, 12.71%, and 6.98% of the variance of the MNBN, NPB, NBUD, MONO, NEC, and APO frequencies, respectively (p < 0.001). However, the MS A2756G polymorphisms only explained 2.89%, 2.23%, and 3.57% of the MNBN, MONO, and NEC frequencies (p < 0.001–0.01), respectively, in the breast cancer cases. There was an interaction between the B6 concentration and the MS A2756G polymorphisms for the MNBN, MONO, APO, and NEC biomarkers in the breast cancer cases and for the MNBN, MONO, NBUD, and APO biomarkers in the controls (Table 6).
The B6 concentration accounted for 13.79%, 17.03%, 10.03%, 11.74%, 5.09%, and 3.73% of the variance of the MNBN, NPB, NBUD, MONO, NEC, and APO frequencies, respectively (p < 0.001). However, there were no effects on the biomarkers for the MTRR A66G polymorphisms in the controls. The B6 concentration explained 26.69%, 11.95%, 25.31%, 32.47%, 17.72%, and 13.95% of the variance of the MNBN, NPB, NBUD, MONO, NEC, and APO frequencies, respectively (p < 0.001). However, the MTRR A66G polymorphisms only explained 1.40% and 1.44% of the MONO and NBUD frequencies (p < 0.01–0.05), respectively, in the breast cancer cases. There was only an interaction between the B6 concentration and the MTRR A66G polymorphisms for the NBUD biomarker in the breast cancer cases (Table 7).

3. Discussion

In the present study, we evaluated the response of the lymphocytes from women with breast cancer to B6 deficiency and gene-nutrient interactions by analyzing the induction of genomic damage and the effect of B6 on cell proliferation and viability. A deficiency of B6 increased genomic instability in binucleated cells. This was an expected result because folate and B6 have been shown to be connected to breast carcinogenesis [27,28]. B6, as a critical coenzyme, acts in two different steps of the folate metabolism pathway: one is the synthesis of 5,10-methylenetetrahydrofolate, which is crucial for DNA synthesis, DNA repair, and DNA methylation [29,30], and the other is the Hcy to glutathione catabolism, which plays vital roles in the detoxification as well as in the defense of cells from oxidative DNA damage [31]. Secondly, the results showed that cell viability increased at 24 nmol/L B6, indicating that proper B6 nutrition is a key determinant of cell growth and proliferation. The CBMN analysis is a thorough system for evaluating genomic damage, cytotoxicity, and cytostasis. Genomic damage events are marked especially in once-divided binucleated (BN) cells, which include three indexes: (a) the chromosome breakage and/or whole chromosome loss biomarker of micronuclei (MNi); (b) the DNA misrepair and/or telomere end-fusions biomarker of NPBs; and (c) the elimination of amplified DNA and/or DNA repair complexes biomarker of NBUDs. The cytostatic events are scored, including frequencies of mononucleated cells, binucleated cells, and multinucleated cells, and cytotoxic events are counted via necrotic and apoptotic cell proportions.

3.1. Influences of B6 on GSACV

We hypothesized that decline in the MNBN frequencies with increasing B6 concentration may be due to a slowdown of the cell proliferation speed or to the wear of strongly damaged cells [22,23,24]. Anyhow, the cells will not arrive at the mitotic telophase when MNBNs are marked in BN cells. The responses to DNA damage are serious and can decrease cell viability, and they can further induce the activation of surveillance systems, which either postpones cell cycle progression until the damaged DNA is repaired or eliminated, or induces apoptosis in case the damage is irreparable [32]. Additionally, we inspected whether the B6 deficiency-induced MNBNs from 9 day would be accompanied by a reduction in NVC and the NDI of the breast cancer cases and controls. Interestingly, our results showed that there was no difference in NDI among the different concentrations of B6. B6 deficiency cultures showed a regular progression through the cell cycle, which maintained the cells’ proliferation ability without suffering either cell loss or the prospective mitotic delay regardless of the persistent DNA lesions [33,34].
We separately analyzed the pooled data from this study and verified that the B6 concentration correlated significantly negative with all of these markers of DNA damage and cell death. DNA damage was minimized at 48 to 200 nmol/L B6 in the breast cancer cases and controls; these concentrations are greater than those normally observed in plasma (20–40 nmol/L) [25]. Cell death was minimized at 24 to 200 nmol/L B6, which suggested that the B6 concentration in plasma may only maintain cell viability, but is not sufficient for maintaining genomic stability. We conclude that 48 nmol/L B6 is the optimal concentration for cell viability and genome stabilization in vitro. More interestingly, we observed that the MNBN, NPB, NBUD, and NEC frequencies correlated significantly and positively, suggesting that whole chromosomes or fragments that lag behind at anaphase may be related to increased chromosome rearrangement and gene amplification [35].
The notion that genetic susceptibility to carcinogenesis is connected to genomic instability was originally observed in rare disorders such as xeroderma pigmentosum and ataxia telangiectasia, which are associated with in vitro and in vivo chromosomal instability and defective DNA repair capacity [36]. The matched-pair Student’s t-test revealed that the breast cancer status in the cases contributed to the variations in the measured biomarkers. The MNBN, NPB, NBUD, MONO, APO, and NEC frequencies in the cancer cases were markedly modified by the B6 concentrations as compared to the controls. This result suggests that breast cancer cases are more sensitive to B6 deficiency than matched controls, considering genomic instability and cell death, which stresses the possibility that B6 may be more important to genome maintenance in cancer groups than in healthy groups. As there have been no studies to date on the relationship between B6 and genomic stability in breast cells, we cannot exclude the possibility that the sensitivities of lymphocyte cells and breast epithelium to B6 deficiency may be different and that the estrogen level in different individuals may have influenced our results. Therefore, future research on the effects of micronutrient deficiency on GSACV should be considered in breast cells, lymphocytes, and tumor patients by including different cancer cells, types of cells, and hormone expression levels.

3.2. Influences of Genetic Polymorphisms on GSACV

We examined the association between GSACV and three enzyme polymorphisms, SHMT C1420T, MS A2756G, and MTRR A66G, under B6 deficiency, which was based on functional polymorphisms and previous reports of associations with breast cancer risk. Functional polymorphisms in these genes may alter the availability of folate in the synthesis and methylation of DNA, and may consequently influence the susceptibility to cancer. To our knowledge, this is also the first report examining the association between MTHFR C677T polymorphisms and GSACV in a Chinese population, though the data are limited for most other populations [37].
In our study, we found an association between the individual SHMT C1420T polymorphism studied and genomic stability. SHMT 1420TT genotypes were found to have reduced DNA damage in the breast cancer cases and controls as compared to CC genotype. One key reason is that the variant SHMT enzyme may lead to accumulation of THF and reduced production of 5,10-methylene THF, although the exact biological effect of this phenomenon or the complete mechanism leading to DNA damage is not certain. Our previous study underlines the capacity of the SHMT C1420T polymorphism being able to directly reduce breast cancer risk. [14,38]. The study found risk reduction for the SHMT 1420TT genotype in malignant lymphomas [39], adult acute lymphocytic leukemia [40], and also in a wide spectrum of diseases including Parkinson’s disease (PD), coronary artery disease (CAD) and systemic lupus erythematosus (SLE) [38]. These suggested that the reduction of DNA damage in the SHMT 1420TT genotype might be the main reason for the risk reduction of different cancers and a wide spectrum of diseases. The variant SHMT enzyme may result in decreased production of 5,10-methylene THF and decreased accumulation of THF, even though the accurate and complete biology mechanism leading to DNA damage is not recognized.
For the MS 2756AG polymorphism, increased GSCAV was found for the AA genotype as compared to the GG genotype. For MTRR A66G, the results indicated elevated GSACV for carriers of the homozygote wild-type genotype (AA) as compared to the other genotypes. The main reason for increased GSCAV is that the A2756G mutation in the MS gene leads to the Asp919Gly substitution in the MS enzyme, which further results in more valid production of methionine and remethylation and the elevation of Hcy, as well as DNA hypomethylation [41]. For MTRR A66G, it was revealed that the 66GG genotype was inversely related to Hcy levels in plasma. Additionally, the mutation of MTRR 66AG easily showed the irregular methylation of DNA and abnormal nucleotide synthesis and altered repair. Our previous study showed that MS 2756GG and MTRR 66GG genotypes had significantly increased risk among Chinese women, which might be due to higher GSCAV.

3.3. Influences of Gene-Nutrient Interactions on GSACV

The interaction between SHMT C1420T, MS A2756G, and MTRR A66G polymorphisms and B6 deficiency was addressed in vitro with human lymphocytes cultured at different concentrations of B6. The different modifying effect of the SHMT C1420T, MS A2756G, and MTRR A66G polymorphisms on various cytogenetic markers may indicate that under B6 deprivation, MNi and NPBs arise through different mechanisms. The results suggest that B6, SHMT C1420T, and MS A2756G are three of the basic determining factors of lymphocyte growth in culture medium, while MTRR A66G has less effect on it. In addition, it is evident that the SHMT 1420TT and MS 2756AA genotypes provided a notable growth advantage over the SHMT 1420CC and MS 2756GG genotypes. The growth advantage of the SHMT 1420TT, MS 2756AA, and MTRR 66AA genotypes may be concerned with decreased cell cycle delay, which may result from the NBUDs formation process which happens during S-phase [42,43,44]. The cells bearing SHMT 1420TT, MS 2756AA, and MTRR 66AA express significantly fewer NBUDs than SHMT 1420CC, MS 2756GG, and MTRR 66GG cells. An alternative interpretation is the slight reduction in the APO frequency in SHMT 1420TT, MS 2756AA, and MTRR 66AA cells compared with SHMT 1420CC, MS 2756GG, and MTRR 66GG cells. Lee et al. examined the relationship between polymorphisms of MTHFR A1298C, and C677T, MTRR A66G and MTR A2756G and non-obstructive male infertility in a Korean population. They found that MTHFR C677T, MTRR A66G, and MS A2756G genotypes were independently related to male infertility [45]. Ethnic differences, gender, geographic variation, the distribution of folate-related enzyme gene polymorphisms, as well as gene-nutrient, gene-environmental, and gene-ethnic interactions have been shown to influence the impact of GSACV.
There were limitations in the present study: (a) the sample number in this study is relatively small, especially the MTRR 66GG genotype of the controls which has only one subject, which could decrease the statistical credibility of finding divergence between breast cancer cases and controls; and (b) all samples were selected from one hospital and all samples were limited to females, which could not explain populations in other places and males. Therefore, a larger number of samples and geographic variation studies are greatly needed for studies in the future.

4. Materials and Methods

4.1. Cell Lines

The GM12593 and GM13705 cell lines are both human B lymphoblastoid cell lines. Both cell lines are from NIGMS Human Genetic Mutant Cell Bank (NIGMS Human Genetic Mutant Cell Repository), and were supplied by Prof. Michael Fenech, Adelaide, Australia. GM12593 came from the spleen of a 34-year-old Caucasian female, while GM13705 was derived from a 38-year-old Caucasian female carrying a positive family history of breast cancer and with a germline BRCA1 mutation at exon 11, codon 1252. The mutation results in the production of a truncated protein [46].

4.2. Characteristics of the Study Population

Consent for our study was acquired from the Yunnan Scientific and Technological Committee and the National Natural Sciences Foundation of China (NSFC). All breast cancer cases and controls agreed to participate and provided written informed consent. Pathology tests were fulfilled, and a number of active manifestations were recruited from each patient. The breast cancer cases were randomly picked from January 2010 to April 2011 in the Third Affiliated Hospital of Kunming Medical College, Kunming, Yunnan, China. In view of the hospital chart number, the breast cancer cases included 42 females consecutively selected from subjects with a first confirmed histopathologic breast carcinoma diagnosis in the age range of 49.83 ± 13.6 years, and 42 female controls comprising individuals without a history of cancer with ages in the range of 43.15 ± 12.6 years were simultaneously recruited from the health examination clinics in the same hospital during the same study period. These samples are the same as in our previous study [14].

4.3. Genotyping Analysis

Peripheral blood lymphocytes were collected from each subject for CBMN assay. Genomic DNA was extracted from fresh or frozen whole blood using a commercially available FlexiGen DNA isolation kit (Qiagen, Valencia, CA, USA). Characteristics of the studied polymorphisms of SHMT C1420T, MS A2756G, and MTRR A66G are reported in our previous study [14]. All genotypes were determined by PCR-based assays followed by RFLP analysis according to published methods [14,47,48,49]. In addition, for internal quality control, 90% of samples were repeated. The genotypes of SHMT 1420CC/MTRR 66AA/MS 2756AA were defined as wild homozygous, SHMT 1420CT/MTRR 66AG/MS 2756AG as mutant heterozygous, and SHMT 1420TT/MTRR 66GG/MS 2756GG as mutant homozygous.

4.4. Cell Lines and Lymphocytes Culture

Before culturing, GM13705 and GM12593 cell lines were washed with fresh Hank’s balanced salt solution (HBSS, Biochrom AG, Berlin, Germany) three times. Cells were prepared at a concentration of 0.25 × 10⁶ viable cells/mL for 2 mL volumes in Roswell Park Memorial Institute Medium (RPMI) 1640 culture medium containing doses of B6 (0, 6, 12, 24, 48, 96, and 200 nmol/L). B6 in regular RPMI 1640 medium (4800 nmol/L) was used as a control. The lymphocytes were cultured at 0.5 × 10⁶ viable cells/mL in 2 mL volume in RPMI 1640 culture medium containing different doses of B6 (6, 12, 24, 48, 96, and 200 nmol/L). Mitogenesis was stimulated by the addition of phytohaemagglutinin (45 g/mL) (PHA; Murex Biotech, Kent, UK) and cultures were incubated at 37 °C and 5% CO2 in a humidified incubator. After 3 days, cell number and viability were determined using a Coulter counter and Trypan blue exclusion, respectively. The cultures were continued in 4.7 mL fresh medium and 0.3 mL “conditioned” medium from the previous 3-day culture with 0.5 × 10⁶ viable cells/mL. The components of fresh medium were the same as above but without PHA. Medium change was repeated at 6 days post-PHA treatment and a final viable cell count was measured on day 9. On the eighth day post-PHA treatment, two 750 μL aliquots of each culture were transferred to 6 mL culture tubes for the CBMN. Cytochalasin B (4.5 g/mL; Sigma Chemical Co., Darmstadt, Germany) was added to each tube and approximately 28 h later cells were harvested onto microscope slides using a cyto-centrifuge (Shandon Southern Products, Cheshire, UK). All other constituents of the medium were standard for RPMI 1640 and CBMN assay was performed as previously described [14,50,51]. All experiments in this study were conducted in the dark to avoid light influences.

4.5. Statistical Analysis

The results for comparison of GSACV with different B6 concentrations in the breast cancer cases or controls were compared using a one-way ANOVA. The GSACV of two groups were compared using the matched-pair Student’s t-test. The significant differences between B6 and genotype were determined by a repeated-measure two-way ANOVA. The differences in sensitivity to B6 deficiency between the breast cancer and control groups were determined using a DDA [26]. The mean values of the GSACS indexes for the breast cancer cases and controls with different genotypes under various concentrations of B6 were determined using the Newman-Keuls ANOVA post-test (two-tailed). The graphical analysis and statistical analyses were conducted using the Prism 6.0 software (GraphPad, San Diego, CA, USA) and SPSS Statistical Package,Version 12.0 (IBM SPSS Inc., Chicago, IL, USA).

5. Conclusions

In conclusion, this research indicates that B6 deficiency induces the formation of MNBNs, NPBs, and NBUDs, decreases APO and increases NEC frequencies in vitro, which shows that it may be a risk factor for cancer by inducing genomic instability/hypermutability/gene amplification in cells via chromosome breakage/rearrangement and breakage-fusion-bridge cycles. Human genome instability can be induced by vitamin B6 deficiency, and 48 nmol/L B6 was the most suitable concentration to maintain genomic stability in lymphocytes in vitro. Although in vitro conditions might not precisely estimate internal B6 requirements, these conditions offer a valuable guideline for the optimal concentration range to maintain genome health. Breast cancer patients are more sensitive to B6 deficiency than controls with respect to genomic stability, suggesting that a low intake of B6 in the long term could increase DNA damage and further exacerbate genomic instability. Adequate B6 intake was believed to be beneficial for breast cancer prevention. In addition, this research showed that the SHMT C1420T mutation may reduce breast cancer susceptibility. In contrast, the MS A2756G and MTRR A66G mutations may increase breast cancer susceptibility, but the role of polymorphisms in SHMT, MS, and MTRR in genome stability is reduced compared to that of B6, which is consistent with our previous results [17]. These results suggest that individuals with various genotypes have different sensitivities to B6 deficiency. FMOCM metabolic enzyme gene polymorphisms may be associated with breast cancer.

Supplementary Materials

Supplementary materials can be found at https://www.mdpi.com/1422-0067/17/7/1003/s1.

Acknowledgments

This research was supported by the National Natural Science Foundation of China (Project No. 31260268 and 31560307), the cooperative project with the United Gene High-Tech Group, the Yunnan Normal University Ph.D. Startup Project and China Scholarship Council (CSC).

Author Contributions

Xiayu Wu was responsible for the majority of this work, including the execution of experiments, data analysis, and writing and publication of this report; Weijiang Xu performed CBMN and genotype analysis; Tao Zhou contributed to cell culture; Neng Cao provided some of the data analysis and spell revision; Juan Ni provided instructions and data proofreading; Tianning Zou was responsible for providing samples; Ziqing Liang performed proofreading; and Xu Wang and Michael Fenech were the corresponding authors and were responsible for the overall work, including the experiments and publication. All authors have read and approved the final manuscript.

Conflicts of Interest

The authors declare no conflicts of interest.

References

  1. Cheng, T.Y.; Makar, K.W.; Neuhouser, M.L.; Miller, J.W.; Song, X.; Brown, E.C.; Beresford, S.A.; Zheng, Y.; Poole, E.M.; Galbraith, R.L.; et al. Folate-mediated one-carbon metabolism genes and interactions with nutritional factors on colorectal cancer risk: Women’s Health Initiative Observational Study. Cancer 2015, 121, 3684–3691. [Google Scholar] [CrossRef] [PubMed]
  2. Zeng, F.F.; Liu, Y.T.; Lin, X.L.; Fan, Y.Y.; Zhang, X.L.; Xu, C.H.; Chen, Y.M. Folate, vitamin B6, vitamin B12 and methionine intakes and risk for nasopharyngeal carcinoma in Chinese adults: A matched case-control study. Br. J. Nutr. 2016, 115, 121–128. [Google Scholar] [CrossRef] [PubMed]
  3. Rajdl, D.; Racek, J.; Trefil, L.; Stehlik, P.; Dobra, J.; Babuska, V. Effect of Folic Acid, Betaine, Vitamin B6, and Vitamin B12 on Homocysteine and Dimethylglycine Levels in Middle-Aged Men Drinking White Wine. Nutrients 2016, 8, E34. [Google Scholar] [CrossRef] [PubMed]
  4. Gong, Z.; Yao, S.; Zirpoli, G.; David Cheng, T.Y.; Roberts, M.; Khoury, T.; Ciupak, G.; Davis, W.; Pawlish, K.; Jandorf, L.; et al. Genetic variants in one-carbon metabolism genes and breast cancer risk in European American and African American women. Int. J. Cancer 2015, 137, 666–677. [Google Scholar] [CrossRef] [PubMed]
  5. Assies, J.; Mocking, R.J.; Lok, A.; Koeter, M.W.; Bockting, C.L.; Visser, I.; Pouwer, F.; Ruhé, H.G.; Schene, A.H. Erythrocyte fatty acid profiles and plasma homocysteine, folate and vitamin B6 and B12 in recurrent depression: Implications for co-morbidity with cardiovascular disease. Psychiatry Res. 2015, 229, 992–998. [Google Scholar] [CrossRef] [PubMed]
  6. Bourquin, F.; Capitani, G.; Grütter, M.G. PLP-dependent enzymes as entry and exit gates of sphingolipid metabolism. Protein Sci. 2011, 20, 1492–1508. [Google Scholar] [CrossRef] [PubMed]
  7. Bessler, H.; Djaldetti, M. Vitamin B6 Modifies the Immune Cross-Talk between Mononuclear and Colon Carcinoma Cells. Folia Biol. (Praha) 2016, 62, 47–52. [Google Scholar] [PubMed]
  8. Zuo, H.; Ueland, P.M.; Eussen, S.J.; Tell, G.S.; Vollset, S.E.; Nygård, O.; Midttun, Ø.; Meyer, K.; Ulvik, A. Markers of vitamin B6 status and metabolism as predictors of incident cancer: The Hordaland Health Study. Int. J. Cancer 2015, 136, 2932–2939. [Google Scholar] [CrossRef] [PubMed] [Green Version]
  9. Ferrari, A.; de Carvalho, A.M.; Steluti, J.; Teixeira, J.; Marchioni, D.M.; Aguiar, S., Jr. Folate and nutrients involved in the 1-carbon cycle in the pretreatment of patients for colorectal cancer. Nutrients 2015, 7, 4318–4335. [Google Scholar] [CrossRef] [PubMed]
  10. Matsubara, K.; Komatsu, S.; Oka, T.; Kato, N. Vitamin B6-mediated suppression of colon tumorigenesis, cell proliferation, and angiogenesis (review). J. Nutr. Biochem. 2003, 14, 246–250. [Google Scholar] [CrossRef]
  11. Matsubara, K.; Matsumoto, H.; Mizushina, Y.; Lee, J.S.; Kato, N. Inhibitory effect of pyridoxal 5′-phosphate on endothelial cell proliferation, replicative DNA polymerase and DNA topoisomerase. Int. J. Mol. Med. 2003, 12, 51–55. [Google Scholar] [CrossRef] [PubMed]
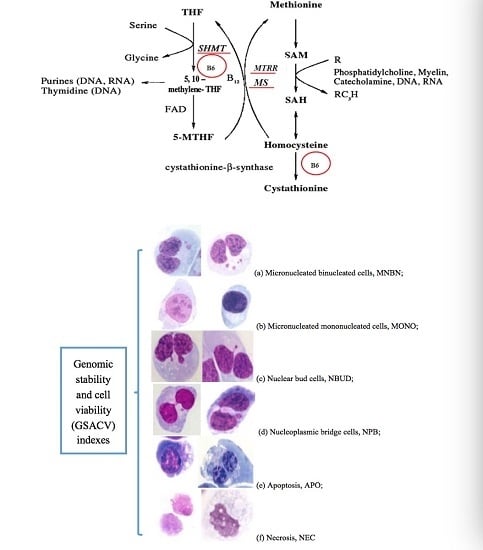
  12. Fenech, M.; Kirsch-Volders, M.; Natarajan, A.T. Molecular mechanisms of micronucleus, nucleoplasmic bridge and nuclear bud formation in mammalian and human cells. Mutagenesis 2010, 26, 125–132. [Google Scholar] [CrossRef] [PubMed]
  13. Jiang, S.; Li, J.; Zhang, Y.; Venners, S.A.; Tang, G.; Wang, Y.; Li, Z.; Xu, X.; Wang, B.; Huo, Y. Methylenetetrahydrofolate Reductase C677T Polymorphism, Hypertension, and Risk of Stroke: A Prospective, Nested Case-Control Study. Int. J. Neurosci. 2016, 29, 1–22. [Google Scholar] [CrossRef] [PubMed]
  14. Wu, X.; Zou, T.; Cao, N.; Ni, J.; Xu, W.; Zhou, T.; Wang, X. Plasma homocysteine levels and genetic polymorphisms in folate metabolism are associated with breast cancer risk in Chinese women. Hered. Cancer Clin. Pract. 2014, 12, 1198–1206. [Google Scholar] [CrossRef] [PubMed]
  15. Li, X.Y.; Ye, J.Z.; Ding, X.P.; Zhang, X.H.; Ma, T.J.; Zhong, R.; Ren, H.Y. Association between methionine synthase reductase A66G polymorphism and primary infertility in Chinese males. Genet. Mol. Res. 2015, 14, 3491–3500. [Google Scholar] [CrossRef] [PubMed]
  16. Hou, N.; Chen, S.; Chen, F.; Jiang, M.; Zhang, J.; Yang, Y.; Zhu, B.; Bai, X.; Hu, Y.; Huang, H.; et al. Association between premature ovarian failure, polymorphisms in MTHFR and MTRR genes and serum homocysteine concentration. Reprod. Biomed. 2016, 32, 407–413. [Google Scholar] [CrossRef] [PubMed]
  17. Zwart, S.R.; Gregory, J.F.; Zeisel, S.H.; Gibson, C.R.; Mader, T.H.; Kinchen, J.M.; Ueland, P.M.; Ploutz-Snyder, R.; Heer, M.A.; Smith, S.M. Genotype, B-vitamin status, and androgens affect spaceflight-induced ophthalmic changes. FASEB J. 2016, 30, 141–148. [Google Scholar] [CrossRef] [PubMed]
  18. Liu, K.; Zhao, R.; Shen, M.; Ye, J.; Li, X.; Huang, Y.; Hua, L.; Wang, Z.; Li, J. Role of genetic mutations in folate-related enzyme genes on Male Infertility. Sci. Rep. 2015, 5, 15548. [Google Scholar] [CrossRef] [PubMed]
  19. Agnoli, C.; Grioni, S.; Krogh, V.; Pala, V.; Allione, A.; Matullo, G.; di Gaetano, C.; Tagliabue, G.; Pedraglio, S.; Garrone, G.; et al. Plasma Riboflavin and Vitamin B-6, but Not Homocysteine, Folate, or Vitamin B-12, Are Inversely Associated with Breast Cancer Risk in the European Prospective Investigation into Cancer and Nutrition-Varese Cohort. J. Nutr. 2016. [Google Scholar] [CrossRef] [PubMed]
  20. Galluzzi, L.; Vacchelli, E.; Michels, J.; Garcia, P.; Kepp, O.; Senovilla, L.; Vitale, I.; Kroemer, G. Effects of vitamin B6 metabolism on oncogenesis, tumor progression and therapeutic responses. Oncogene 2013, 32, 4995–5004. [Google Scholar] [CrossRef] [PubMed]
  21. Cancarini, I.; Krogh, V.; Agnoli, C.; Grioni, S.; Matullo, G.; Pala, V.; Pedraglio, S.; Contiero, P.; Riva, C.; Muti, P.; et al. Micronutrients Involved in One-Carbon Metabolism and Risk of Breast Cancer Subtypes. PLoS ONE 2015, 10, e0138318. [Google Scholar] [CrossRef] [PubMed]
  22. Wu, X.Y.; Ni, J.; Xu, W.J.; Zhou, T.; Wang, X. Interactions between MTHFR C677T-A1298C variants and folic acid deficiency affect breast cancer risk in a Chinese population. Asian Pac. J. Cancer Prev. 2012, 13, 2199–2206. [Google Scholar] [CrossRef] [PubMed]
  23. Wu, X.Y.; Cheng, J.; Lu, L. Vitamin B12 and methionine deficiencies induce genome damage measured using the cytokinesis-block micronucleus cytome assay in human B lymphoblastoid cell lines. Nutr. Cancer 2013, 65, 866–873. [Google Scholar] [CrossRef] [PubMed]
  24. Wu, X.Y.; Liang, Z.; Zou, T.; Wang, X. Effects of folic acid deficiency and MTHFRC677T polymorphisms on cytotoxicity in human peripheral blood lymphocytes. Biochem. Biophys. Res. Commun. 2009, 379, 732–737. [Google Scholar] [CrossRef] [PubMed]
  25. Herrmann, M. Vitamins in the Prevention of Human Diseases; Walter de Gruyter GmbH & Co. KG.: Berlin, Germany; New York, NY, USA, 2011; pp. 305–307. [Google Scholar]
  26. Andrew, J.V.; Douglas, G.A. Analysing controlled trials with baseline and follow up measurements. Br. Med. J. 2001, 323, 1123–1124. [Google Scholar]
  27. Gong, Z.; Ambrosone, C.B.; McCann, S.E.; Zirpoli, G.; Chandran, U.; Hong, C.C.; Bovbjerg, D.H.; Jandorf, L.; Ciupak, G.; Pawlish, K.; et al. Associations of dietary folate, Vitamins B6 and B12 and methionine intake with risk of breast cancer among African American and European American women. Int. J. Cancer 2014, 134, 1422–1435. [Google Scholar] [CrossRef] [PubMed]
  28. Pirouzpanah, S.; Taleban, F.A.; Mehdipour, P.; Atri, M. Association of folate and other one-carbon related nutrients with hypermethylation status and expression of RARB, BRCA1, and RASSF1A genes in breast cancer patients. J. Mol. Med. 2015, 93, 917–934. [Google Scholar] [CrossRef] [PubMed]
  29. Jung, A.Y.; van Duijnhoven, F.J.; Nagengast, F.M.; Botma, A.; Heine-Bröring, R.C.; Kleibeuker, J.H.; Vasen, H.F.; Harryvan, J.L.; Winkels, R.M.; Kampman, E. Dietary B vitamin and methionine intake and MTHFR C677T genotype on risk of colorectal tumors in Lynch syndrome: the GEOLynch cohort study. Cancer Causes Control 2014, 25, 1119–1129. [Google Scholar] [CrossRef] [PubMed]
  30. Kune, G.; Watson, L. Colorectal cancer protective effects and the dietary micronutrients folate, methionine, vitamins B6, B12, C, E, selenium, and lycopene. Nutr. Cancer 2006, 56, 11–21. [Google Scholar] [CrossRef] [PubMed]
  31. Shen, J.; Lai, C.Q.; Mattei, J. Association of vitamin B-6 status with inflammation, oxidative stress, and chronic inflammatory conditions: The Boston Puerto Rican Health Study. Am. J. Clin. Nutr. 2010, 91, 337–342. [Google Scholar] [CrossRef] [PubMed]
  32. Bodakuntla, S.; Libi, A.V.; Sural, S.; Trivedi, P.; Lahiri, M. N-nitroso-N-ethylurea activates DNA damage surveillance pathways and induces transformation in mammalian cells. BMC Cancer 2014, 14, 287. [Google Scholar] [CrossRef] [PubMed]
  33. Takeuchi, P.L.; Antunes, L.M.; Takahashi, C.S. Evaluation of the clastogenicity and anticlastogenicity of vitamin B6 in human lymphocyte cultures. Toxicol. Vitr. 2007, 21, 665–670. [Google Scholar] [CrossRef] [PubMed]
  34. Sharp, A.A.; Fedorovich, Y. Teratogenic effects of pyridoxine on the spinal cord and dorsal root ganglia of embryonic chickens. Neuroscience 2015, 289, 233–241. [Google Scholar] [CrossRef] [PubMed]
  35. Fenech, M.; Crott, J.W. Micronuclei, nucleoplasmic bridges and nuclear buds induced in folic acid deficient human lymphocytes-evidence for breakage-fusion-bridge cycles in the cytokinesis-block micronucleus assay. Mutat. Res. 2002, 504, 131–136. [Google Scholar] [CrossRef]
  36. El-Zein, R.; Vral, A.; Etzel, C.J. Cytokinesis-blocked micronucleus assay and cancer risk assessment. Mutagenesis 2011, 26, 101–106. [Google Scholar] [CrossRef] [PubMed]
  37. Yilmaz, M.; Kacan, T.; Sari, I.; Kilickap, S. Lack of association between the MTHFRC677T polymorphism and lung cancer in a Turkish population. Asian Pac. J. Cancer Prev. 2014, 15, 6333–6337. [Google Scholar] [CrossRef] [PubMed]
  38. Naushad, S.M.; Vijayalakshmi, S.V.; Rupasree, Y.; Kumudini, N.; Sowganthika, S.; Naidu, J.V.; Ramaiah, M.J.; Rao, D.N.; Kutala, V.K. Multifactor dimensionality reduction analysis to elucidate the cross-talk between one-carbon and xenobiotic metabolic pathways in multi-disease models. Mol. Biol. Rep. 2015, 42, 1211–1224. [Google Scholar] [CrossRef] [PubMed]
  39. Hishida, A.; Matsuo, K.; Hamajima, N.; Ito, H.; Ogura, M.; Kagami, Y.; Taji, H.; Morishima, Y.; Emi, N.; Tajima, K. Associations between polymorphisms in the thymidylate synthase and serine hydroxymethyltransferase genes and susceptibility to malignant lymphoma. Haematologica 2003, 88, 159–166. [Google Scholar] [PubMed]
  40. Skibola, C.F.; Smith, M.T.; Hubbard, A.; Shane, B.; Roberts, A.C.; Law, G.R.; Rollinson, S.; Roman, E.; Cartwright, R.A.; Morgan, G.J. Polymorphisms in the thymidylate synthase and serine hydroxymethyltransferase genes and risk of adult acute lymphocytic leukemia. Blood 2002, 99, 3786–3791. [Google Scholar] [CrossRef] [PubMed]
  41. Matsuo, K.; Suzuki, R.; Hamajima, N.; Ogura, M.; Kagami, Y.; Taji, H.; Kondoh, E.; Maeda, S.; Asakura, S.; Kaba, S.; et al. Association between polymorphisms of folate- and methionine-metabolizing enzymes and susceptibility to malignant lymphoma. Blood 2001, 97, 3205–3209. [Google Scholar] [CrossRef] [PubMed]
  42. Tsuchiya, D.; Lacefield, S. Cdk1 modulation ensures the coordination of cell-cycle events during the switch from meiotic prophase to mitosis. Curr. Biol. 2013, 23, 1505–1513. [Google Scholar] [CrossRef] [PubMed]
  43. Thomas, P.; Fenech, M. Buccal Cytome Biomarkers and Their Association with Plasma Folate, Vitamin B12 and Homocysteine in Alzheimer’s Disease. J. Nutrigenet. Nutrigenom. 2015, 8, 57–69. [Google Scholar] [CrossRef] [PubMed]
  44. Fenech, M.; Holland, N.; Zeiger, E.; Chang, W.P.; Burgaz, S.; Thomas, P.; Bolognesi, C.; Knasmueller, S.; Kirsch-Volders, M.; Bonassi, S. The HUMN and HUMNxL international collaboration projects on human micronucleus assays in lymphocytes and buccal cells—Past, present and future. Mutagenesis 2011, 26, 239–245. [Google Scholar] [CrossRef] [PubMed]
  45. Lee, H.C.; Jeong, Y.M.; Lee, S.H.; Cha, K.Y.; Song, S.H.; Kim, N.K.; Lee, K.W.; Lee, S. Association study of four polymorphisms in three folate-related enzyme genes with non-obstructive male infertility. Hum. Reprod. 2006, 21, 3162–3170. [Google Scholar] [CrossRef] [PubMed]
  46. Aressy, B.; Greenberg, R.A. DNA Damage: Placing BRCA1 in the Proper Context. Curr. Biol. 2012, 22, R806–R808. [Google Scholar] [CrossRef] [PubMed]
  47. Vaughn, J.D.; Bailey, L.B.; Shelnutt, K.P.; Dunwoody, K.M.; Maneval, D.R.; Davis, S.R.; Quinlivan, E.P.; Gregory, J.F., 3rd; Theriaque, D.W.; Kauwell, G.P. Methionine synthase reductase 66A→G polymorphism is associated with increased plasma homocysteine concentration when combined with the homozygous methylenetetrahydrofolate reductase 677C→T variant. J. Nutr. 2004, 134, 2985–2990. [Google Scholar] [PubMed]
  48. Scazzone, C.; Acuto, S.; Guglielmini, E.; Campisi, G.; Bono, A. Methionine synthase reductase (MTRR) A66G polymorphism is not related to plasma homocysteine concentration and the risk for vascular disease. Exp. Mol. Pathol. 2009, 86, 131–133. [Google Scholar] [CrossRef] [PubMed]
  49. Lightfoot, T.J.; Johnston, W.T.; Painter, D.; Simpson, J.; Roman, E.; Skibola, C.F.; Smith, M.T.; Allan, J.M.; Taylor, G.M.; United Kingdom Childhood Cancer Study. Genetic variation in the folate metabolic pathway and risk of childhood leukemia. Blood 2010, 115, 3923–3929. [Google Scholar] [CrossRef] [PubMed]
  50. Moore, G.E.; Woods, L.K. Culture media for human cells—RPMI 1603, RPMI 1634, RPMI 1640 and GEM 1717. Methods Cell Sci. 1977, 3, 503–509. [Google Scholar] [CrossRef]
  51. Fenech, M. Cytokinesis-block micronucleus assay evolves into a “cytome” assay of chromosomal instability, mitotic dysfunction and cell death. Mutat. Res. 2006, 600, 58–66. [Google Scholar] [CrossRef] [PubMed]
Figure 1. A comparison of: MNBN (a); MONO (b); NBUD (c); NPB (d); APO (e); and NEC (f) frequency between breast cancer cases and controls under various concentrations of B6.
Ijms 17 01003 g001aIjms 17 01003 g001b
Figure 2. A comparison of reduction of: MNBN (a); MONO (b); NBUD (c); NPB (d); APO (e); and NEC (f) frequency between breast cancer cases and controls using DDA. The results represent the reduction in markers measured relative to 200 nmol/L mean ± SE.
Ijms 17 01003 g002aIjms 17 01003 g002b
Figure 3. GSACV including: MNBN (a); MONO (b); NBUD (c); NPB (d); APO (e); and NEC (f) frequency in different SHMT C1420T genotypes of breast cancer cases at various concentrations of B6 (CC = 24, CT = 16, TT = 2 in breast cancer cases).
Ijms 17 01003 g003aIjms 17 01003 g003b
Figure 4. GSACV including: MNBN (a); MONO (b); NBUD (c); NPB (d); APO (e); and NEC (f) frequency in different SHMT C1420T genotypes of controls at various concentrations of B6 (CC = 17, CT = 19, TT = 6 in controls).
Ijms 17 01003 g004aIjms 17 01003 g004b
Figure 5. GSACV including: MNBN (a); MONO (b); NBUD (c); NPB (d); APO (e); and NEC (f) frequency in different MS A2756G genotypes of breast cancer cases at various B6 concentrations (AA = 15, AG = 25, GG = 2 in breast cancer cases).
Ijms 17 01003 g005
Figure 6. GSACV including: MNBN (a); MONO (b); NBUD (c); NPB (d); APO (e); and NEC (f) frequency in different MS A2756G genotypes of controls at various B6 concentrations (AA = 29, AG = 10, GG = 3 in controls).
Ijms 17 01003 g006
Figure 7. GSACV including: MNBN (a); MONO (b); NBUD (c); NPB (d); APO (e); and NEC (f) frequency in different MTRR A66G genotypes of breast cancer cases at various B6 concentrations (AA = 8, AG = 30, GG = 4 in breast cancer cases).
Ijms 17 01003 g007
Figure 8. GSACV including: MNBN (a); MONO (b); NBUD (c); NPB (d); APO (e); and NEC (f) frequency in different MTRR A66G genotypes of controls at various B6 concentrations (AA = 5, AG = 36, GG = 1 in controls).
Ijms 17 01003 g008
Table 1. The indexes of GSACV in breast cancer cases and controls under various B6 concentrations.
B6 in Medium (nmol/L) ( x ¯ ± SD) 1,2,3
EndpointGroup612244896200
NDICases1.30 ± 0.026 a1.28 ± 0.028 a1.29 ± 0.021 a1.36 ± 0.041 a1.30 ± 0.034 a1.30 ± 0.027 a
Controls1.26 ± 0.027 a1.27 ± 0.031 a1.25 ± 0.015 a1.26 ± 0.030 a1.23 ± 0.027 a1.28 ± 0.025 a
‰ MNBNCases27.8 ± 2.05 a25.9 ± 1.60 b22.2 ± 3.24 b18.7 ± 2.44 c17.2 ± 1.62 c17.0 ± 2.63 c
Controls20.4 ± 2.12 a17.4 ± 1.45 b15.7 ± 3.30 c13.6 ± 2.23 c,d12.07 ± 1.61 d13.44 ± 1.17 d
‰ MONOCases2.78 ± 0.45 a1.74 ± 0.40 b1.62 ± 0.65 b1.55 ± 0.53 b1.44 ± 0.23 b1.40 ± 0.42 b
Controls2.05 ± 0.45 a1.59 ± 0.59 a1.49 ± 0.28 a,b1.30 ± 0.30 b1.29 ± 0.35 b1.33 ± 0.40 b
‰ NBUDCases9.30 ± 1.82 a7.98 ± 2.26 b6.13 ± 1.11 b,c5.96 ± 0.74 c5.43 ± 1.33 c6.02 ± 0.95 c
Controls7.12 ± 1.07 a6.03 ± 1.52 b4.64 ± 1.42 b4.08 ± 1.44 b,c4.21 ± 1.07 b,c4.00 ± 0.68 c
‰ NPBCases5.36 ± 0.76 a4.93 ± 1.22 a3.76 ± 0.42 a,b3.41 ± 0.55 b3.08 ± 1.05 b3.11 ± 0.80 b
Controls4.01 ± 0.27 a3.41 ± 0.56 a2.91 ± 0.67 b2.46 ± 0.60 b2.46 ± 1.02 b2.02 ± 0.12 b
% APOCases4.59 ± 0.80 a4.10 ± 0.67 a,b3.58 ± 1.10 b,c3.37 ± 1.11 b,c3.02 ± 0.95 b,c2.86 ± 0.97 c
Controls5.22 ± 0.55 a5.09 ± 0.80 a,b5.71 ± 0.95 b,c5.25 ± 0.62 b,c4.24 ± 0.67 b,c3.97 ± 0.67 c
% NECCases7.83 ± 0.53 a5.93 ± 0.40 b5.89 ± 0.60 b,c5.02 ± 0.78 c5.65 ± 0.63 c4.73 ± 0.73 c
Controls6.37 ± 0.76 a5.79 ± 1.38 b4.65 ± 0.98 c4.05 ± 0.40 c3.85 ± 1.07 c3.69 ± 0.75 c
1 Values are means ± standard deviation (SD); 2 Different letters differ from each other in the same type in different medium; 3 Repeated measures; one-way analysis of variance (ANOVA) of data.
Table 2. Cross-correlation matrix of variables measured in breast cancer cases under various culture media 1,2.
B6MNBNNBUDNPBMONOAPO
MNBN−0.764 ***-
NBUD−0.563 ***0.712 ***-
NPB−0.615 ***0.538 ***0.426 **-
MONO−0.448 ***0.577 ***0.440 **0.234-
APO−0.761 ***0.739 ***0.502 ***0.356 *0.216 *-
NEC−0.601 **0.621 **0.605 **0.362 *0.516 **0.523 **
1 Values are estimated spearman correlation coefficients; 2 *** p < 0.001; ** p < 0.01; * p < 0.05.
Table 3. Cross-correlation matrix of variables measured in controls under various culture media 1,2.
B6MNBNNBUDNPBMONOAPO
MNBN−0.582 ***-
NBUD−0.574 ***0.701 ***-
NPB−0.609 ***0.620 ***0.419 **-
MONO−0.411 ***0.472 ***0.504 **0.381 *-
APO−0.663 ***0.505 ***0.528 ***0.325 *0.372 *-
NEC−0.510 ***0.610 ***0.592 ***0.430 **0.654 **0.550 **
1 Values are estimated spearman correlation coefficients; 2 *** p < 0.001; ** p < 0.01; * p < 0.05.
Table 4. Effect of B6 and breast cancer status on GSACV 1,2,3.
Source of VariationB6StatusInteraction
V%V%V%
MNBN46.15 ***5.12 *0.88
NPB30.13 **4.14 *0.30
NBUD29.66 ***0.480.30
MONO3.140.041.56
APO31.65 ***0.611.87
NEC40.15 ***5.45 *2.44
1 Values determined by two-way ANOVA; 2 *** p < 0.0001, ** p < 0.001, * p < 0.05; 3 Effect size is expressed as the ratio of the differences between the mean values for the two categories of each independent variable.
Table 5. Effect contribution to the strength and variation analysis of B6 and SHMT C1420T polymorphisms on GSACV by two-way ANOVA analysis.
GSACVMNBNMONONBUDNPBAPONEC
Fp% of VariationFp% of VariationFp% of VariationFp% of VariationFp% of VariationFp% of Variation
Controls
Genotype (SHMT)97.870.001 ***21.106.360.002 **2.180.3830.6820.172.540.0811.470.7640.4670.434.1610.017 *2.31
B666.920.001 ***36.0748.820.001 ***41.8726.880.001 ***30.4214.410.001 ***20.8116.320.001 ***22.7314.300.001 ***19.88
B6-genotype interaction1.6770.0871.811.830.0563.141.7550.073.970.780.6472.250.820.6092.291.0090.4362.81
Cases
Genotype (SHMT)25.310.001 ***30.364.7880.009 **1.568.2860.001 ***3.211.6900.1871.031.3220.2660.832.100.1251.17
B649.970.001 ***16.5826.510.001 ***21.612.330.001 ***11.944.7200.001 ***7.198.3770.001 ***13.094.0710.002 **5.68
B6-genotype interaction1.1160.350.741.0120.4341.652.0140.033*3.900.4780.9041.460.8390.5912.621.300.2323.63
*** p < 0.001; ** p < 0.01; * p < 0.05.
Table 6. Effect contribution to the strength and variation analysis of B6 and MS A2756G polymorphisms on GSACV by two-way ANOVA.
GSACVMNBNMONONBUDNPBAPONEC
Fp% of VariationFp% of VariationFp% of VariationFp% of VariationFp% of VariationFp% of Variation
Controls
Genotype (MS)5.1340.007 **1.312.1470.1190.763.3340.037 *1.454.7750.009 **2.760.2890.7490.164.1740.017 *2.18
B644.520.001 ***28.4539.950.001 ***35.316.310.001 ***17.7714.010.001 ***20.235.9420.001 ***7.9813.930.001 ***18.19
B6-genotype interaction3.4650.001 ***4.431.890.046 *3.351.6150.1033.521.6210.1014.683.6530.001 ***9.811.9570.039 *5.11
Cases
Genotype (MS)10.330.001 ***2.898.8010.001 ***2.231.7660.1730.722.2560.1071.282.6370.0781.546.2080.002 **3.57
B629.620.001 ***20.6837.410.001 ***23.6919.570.001 ***19.868.2490.001 ***11.684.7790.001 ***6.988.8370.001 ***12.71
B6-genotype interaction4.1640.001 ***5.813.5070.001 ***4.442.2750.003 **5.581.0110.4352.862.5650.006 **7.490.6480.7721.86
*** p < 0.001; ** p < 0.01; * p < 0.05.
Table 7. Effect contribution to the strength and variation analysis of B6 and MTRR A66G polymorphisms on GSACV by two-way ANOVA analysis.
GSACVMNBNMONONBUDNPBAPONEC
Fp% of VariationFp% of VariationFp% of VariationFp% of VariationFp% of VariationFp% of Variation
Controls
Genotype (MTRR)0.6260.5360.190.3830.6820.130.2210.8010.102.2290.111.331.1170.3290.640.2650.8770.04
B618.010.001 ***13.7913.750.001 ***11.749.1520.001 ***10.0311.380.001 ***17.032.6180.025 *3.373.5340.004 **5.09
B6-genotype interaction1.1050.3601.691.1930.2962.040.8660.5661.900.9240.5122.761.5950.1094.550.5170.9371.49
Cases
Genotype (MTRR)2.6250.0750.845.4990.005 **1.403.360.036 *1.440.5010.6060.292.8790.0581.720.3350.7160.19
B633.380.001 ***26.6951.120.001 ***32.4723.670.001 ***25.318.1160.001 ***11.959.3550.001 ***13.9512.310.001 ***17.72
B6-genotype interaction1.9490.040 *3.124.4570.001 ***5.660.9190.5161.970.6100.8051.801.8450.0545.501.5020.1394.32
*** p < 0.001; ** p < 0.01; * p < 0.05.

