1. Introduction
In the current socio-political environment, there is increasing concern for improvised radiologic and nuclear devices. In addition, unplanned nuclear and radiological events are also a source of concern with the recent Fukushima disaster as a reminder that we need better countermeasures. To this end, we have described a workflow for characterization of urinary and serum metabolomics signatures after exposure. While most of the effort in radiation biodosimetry and countermeasures has focused on X-ray irradiation [
1,
2,
3,
4,
5], our recent work on exposure to environmentally persistent internal emitters,
90Sr and
137Cs, provided additional insight into their
in vivo metabolomic responses [
6,
7,
8,
9]. The results of these studies indicated that intermediate metabolites in energy metabolism, lipid beta-oxidation, and inflammation signaling are some of the most affected pathways after exposure to these internal emitters [
6,
7,
8,
9]. While these results are similar to those seen with X-ray beam irradiation at a low dose rate (LDR) of 0.00309 Gy/min and at a high dose rate (HDR) of 1.1 Gy/min, distinct differences have been observed in each case based on the type of exposure and dose rate. Dose rate is an important concept in radiobiology since low dose rates can show differences in a variety of biologic responses. In addition, dose estimation can be complicated particularly at low dose rates, which vary with time as the isotope is excreted (or decayed). Varying dose rate played an important role in our studies on the effects of internal emitters,
90Sr and
137Cs, for the calculation of
in vivo whole body dose, which was averaged at each time-point for the estimation of cumulative dose. Our metabolomic studies into the effects of internal exposure by
137Cs in mice showed that
137Cs exposure triggered a large-scale increase in inflammatory markers, such as arachidonic acid, which subsided 30 days (d) after exposure suggesting adaptation and recovery. However, in the case of
90Sr exposure, there was a global and persistent downregulation of several metabolites after exposure, which may be due to a more uniform localization of the radionuclide to the bones. In the course of these initial studies, we detected two urinary ions, which showed distinct changes after exposure based on exposure type and dose rate in mice; however, due to unavailability of commercial standards and analytical separation approaches at the time, we were unable to conclusively identify and quantitate these two spectral features using our previously reported conventional shotgun workflow [
6,
7]. Here, we report on the identification and the development of quantitative methods for these two radiation-sensitive urinary ions using chemical standards via tandem quadrupole mass spectrometry. The results of the current study expand our knowledge of radiation exposure metabolite markers and the methods developed here may be used in other studies for monitoring the levels of these two urinary metabolites.
The first of these two urinary ions to be identified and quantitated using multiple reaction monitoring (MRM) analysis was calcitroic acid. Calcitroic acid is the terminal product of deactivation of 1α,25-dihydroxyvitamin D
2 (1α,25-(OH)
2D
2) [
10]. Vitamin D
2 and D
3 are metabolized in a similar fashion producing a hormonally active form of 1α,25-(OH)
2D
2. Recent studies have indicated that kidneys and keratinocytes contain the enzymes required for production of calcitroic acid from 1α,25-(OH)
2D
2 [
11,
12] under a regulatory mechanism to maintain vitamin D homeostasis. Although these enzymes are yet to be characterized, it is known that the isomers of the cytochrome P450 (CYP) can carry out a multi-step catalytic reaction to hydrolyze vitamin D and ultimately produce calcitroic acid from 1α,25-(OH)
2D
3 [
13]. Arguably, these enzymes could be responsible for most, if not all, of the metabolic steps leading to side chain oxidation and to side cleavage of 1α,25-dihydroxyvitamin D
2. Despite the important role of vitamin D metabolism and evidence that its metabolic intermediates may attenuate cell death induced by ionizing radiation (IR) exposure [
14], there is little information on the IR-induced changes in the various genes, proteins and metabolites pertaining to this pathway. Our recent gene expression study carried out on the blood of mice exposed to
90Sr and
137Cs showed lower expression of two
Cyp genes,
Cyp4f18 and
Cyp4v3 while a higher expression of
Cyp4v3 was recorded after HDR exposure [
15,
16,
17]. In addition, CYP4 proteins have been shown to metabolize vitamin D and are important in defense against chemical and environmental stressors [
18].
The second urinary ion was identified here as citrulline, which is an alpha-amino acid and is mainly synthesized by small bowel enterocytes [
19]. It has been speculated that the citrulline concentration is related to small bowel function [
20]. Studies have shown that a decrease in citrulline concentration is associated with bacterial translocation [
21], elevated intestinal fatty acid binding protein concentration as seen in damaged enterocytes [
22], and in patients with intestinal dysfunction [
23]. Citrulline also plays an important role in regulating the immune response during inflammation and stress signaling [
24]. The enzyme which is responsible for the production of citrulline is nitric oxide synthase (NOS). From the different isomers of NOS, NOS1 is expressed in endothelial cells and is regulated by Ca
2+ [
25]. Upon exposure to IR, NOS1 activity is stimulated as part of an early stress signaling mechanism induced by IR exposure [
26], subsequently leading to changes in the plasma levels of citrulline. Several
in vivo studies have established changes in the plasma levels of citrulline as a reliable indicator for gastrointestinal (GI) injury and citrulline has even been suggested as a promising biomarker of GI toxicity in patients undergoing chemo- and radiation therapy [
26]. We have also observed a slight yet statistically significant increase in the gene expression of
NOS1 in the blood of mice internally exposed to the radionuclide
90Sr [
15,
16].
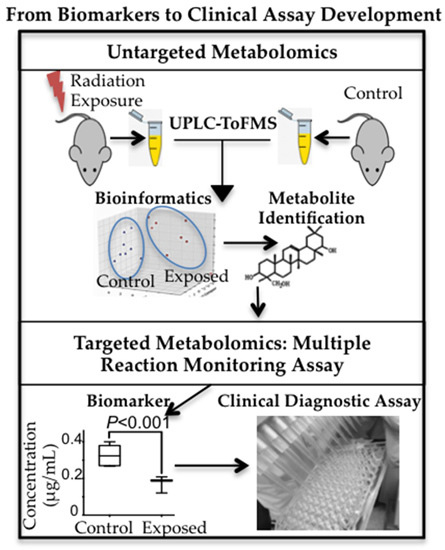
The results of these gene expression studies along with the unique changes in the urinary excretion of citrulline and calcitroic acid reported here under various exposure senarios further provide proof for the IR responsiveness of these two metabolites and the robustness of their responses post exposure. Thus, these two biomarkers bear the potential of having applications in large-scale biodosimetry approaches and can help with the refinement of radiation exposure monitoring bio-signature. Furthermore, this study serves as an example of how quantitative mass spectrometry-based metabolomics may be reliably employed in developing a high throughput radiation biodosimetry assay with future clinical implications.
2. Results
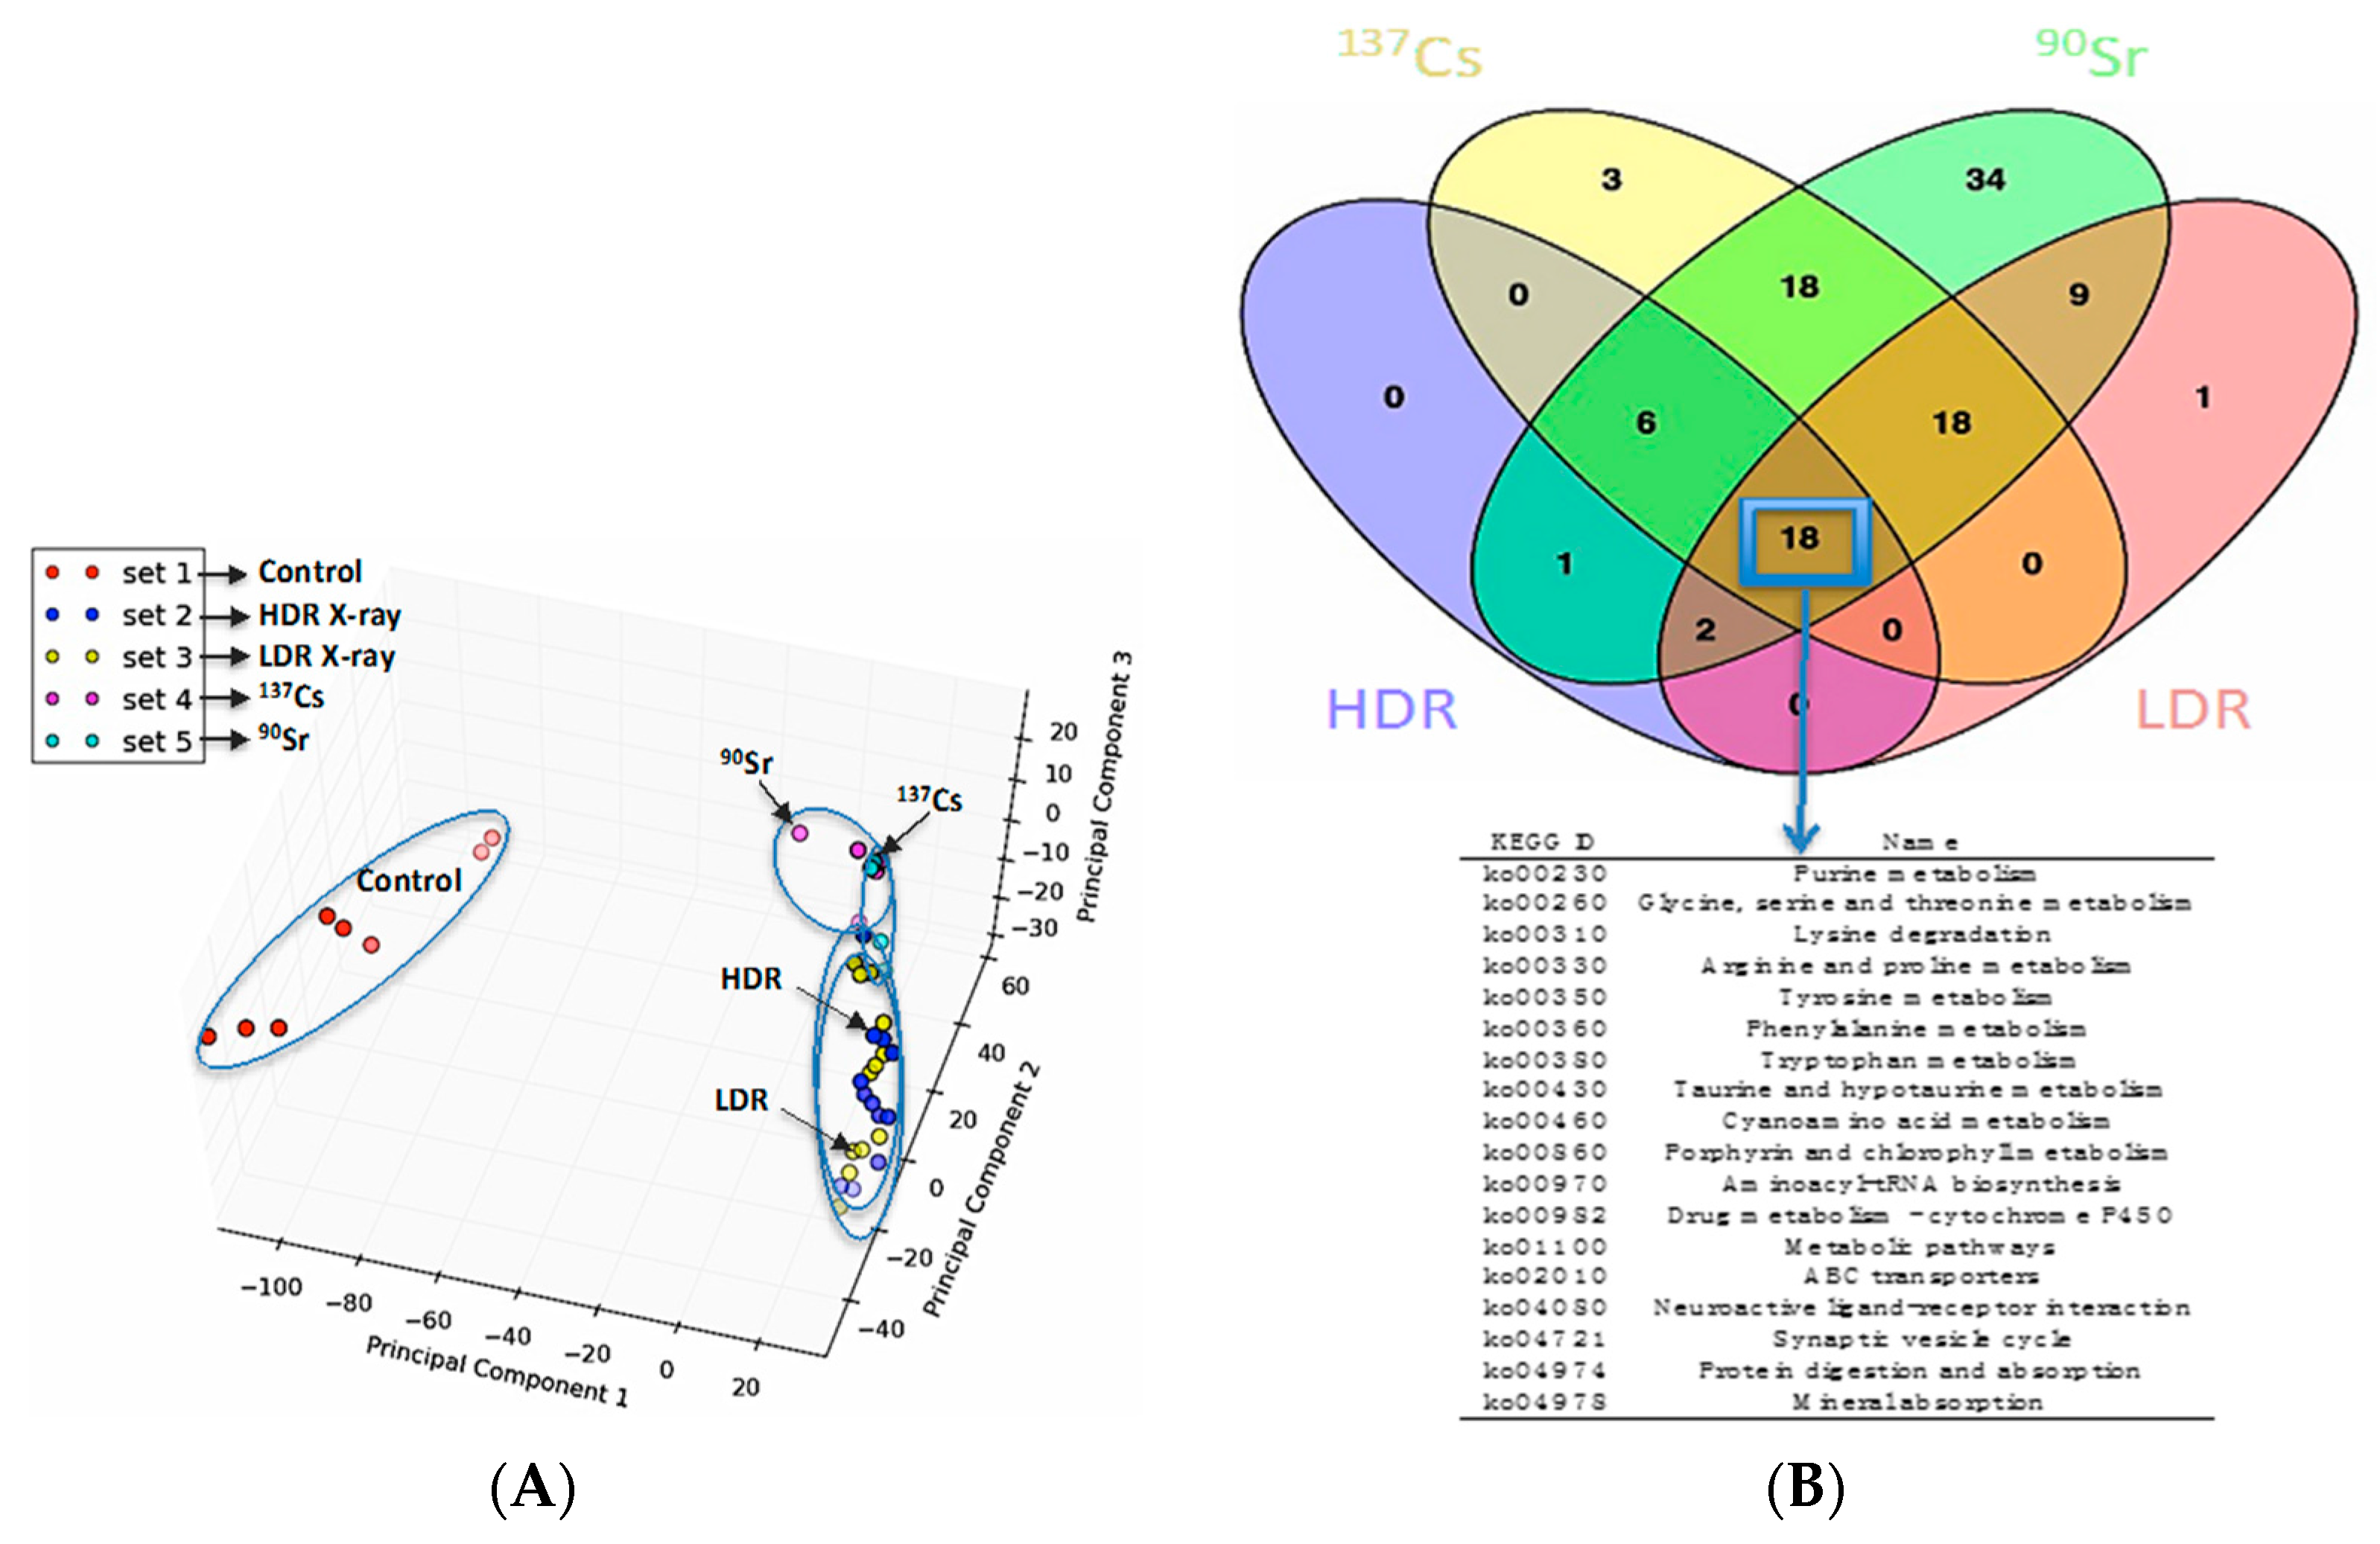
The similarities and differences in the perturbations induced by the following IR sources in the urinary metabolomic profiles of mice were initially evaluated: internal
137Cs, internal
90Sr, X-ray irradiation at 1.1 Gy/min, X-ray irradiation at 3.0 mGy/min. The principle component analysis (PCA) plot in
Figure 1A shows that, while exposure to all four types of IR cases above induced statistically significant and distinct perturbations in the overall urinary metabolomic signature in mice compared to that of the control mice (red circles), the differences in these perturbations in each exposure case is subtle as shown by the close clustering of the metabolomic profiles on the right hand side of the PCA plot. In addition, the Venn diagram in
Figure 1B highlights, that although differences exist among the metabolic perturbations induced by each of the four exposure scenarios, many of the perturbed pathways annotated via Kyoto Encyclopedia of Genes and Genomes (KEGG) are shared among them (marked by a blue box and arrow pointing to the table of common KEGG pathways). However, this does not mean that these exposures induce the same changes (increase/decrease) in the same intermediates of these metabolic pathways. Rather, they can have different impact (increase/decrease/no change) on the urinary concentration of various metabolic intermediates in a pathway. Ions identified here as calcitroic acid and citrulline are two metabolite examples of how different exposure types (internal emitter
vs. X-ray irradiation) and dose rate in the case of X-ray irradiation (LDR
vs. HDR) modulate exposure responses.
In order to study the changes in these two metabolites in a quantitative manner, we developed and optimized MRM methods for citrulline and calcitroic acid in mouse urine using a Waters (Milford, MA, USA) tandem quadrupole TQ-S mass spectrometer (
Table 1). As shown in
Figure 2 and
Figure 3, the target analytes and the appropriate internal standards (IS) for citrulline and calcitroic acid provided high sensitivity and response in positive electrospray ionization (ESI) mode.
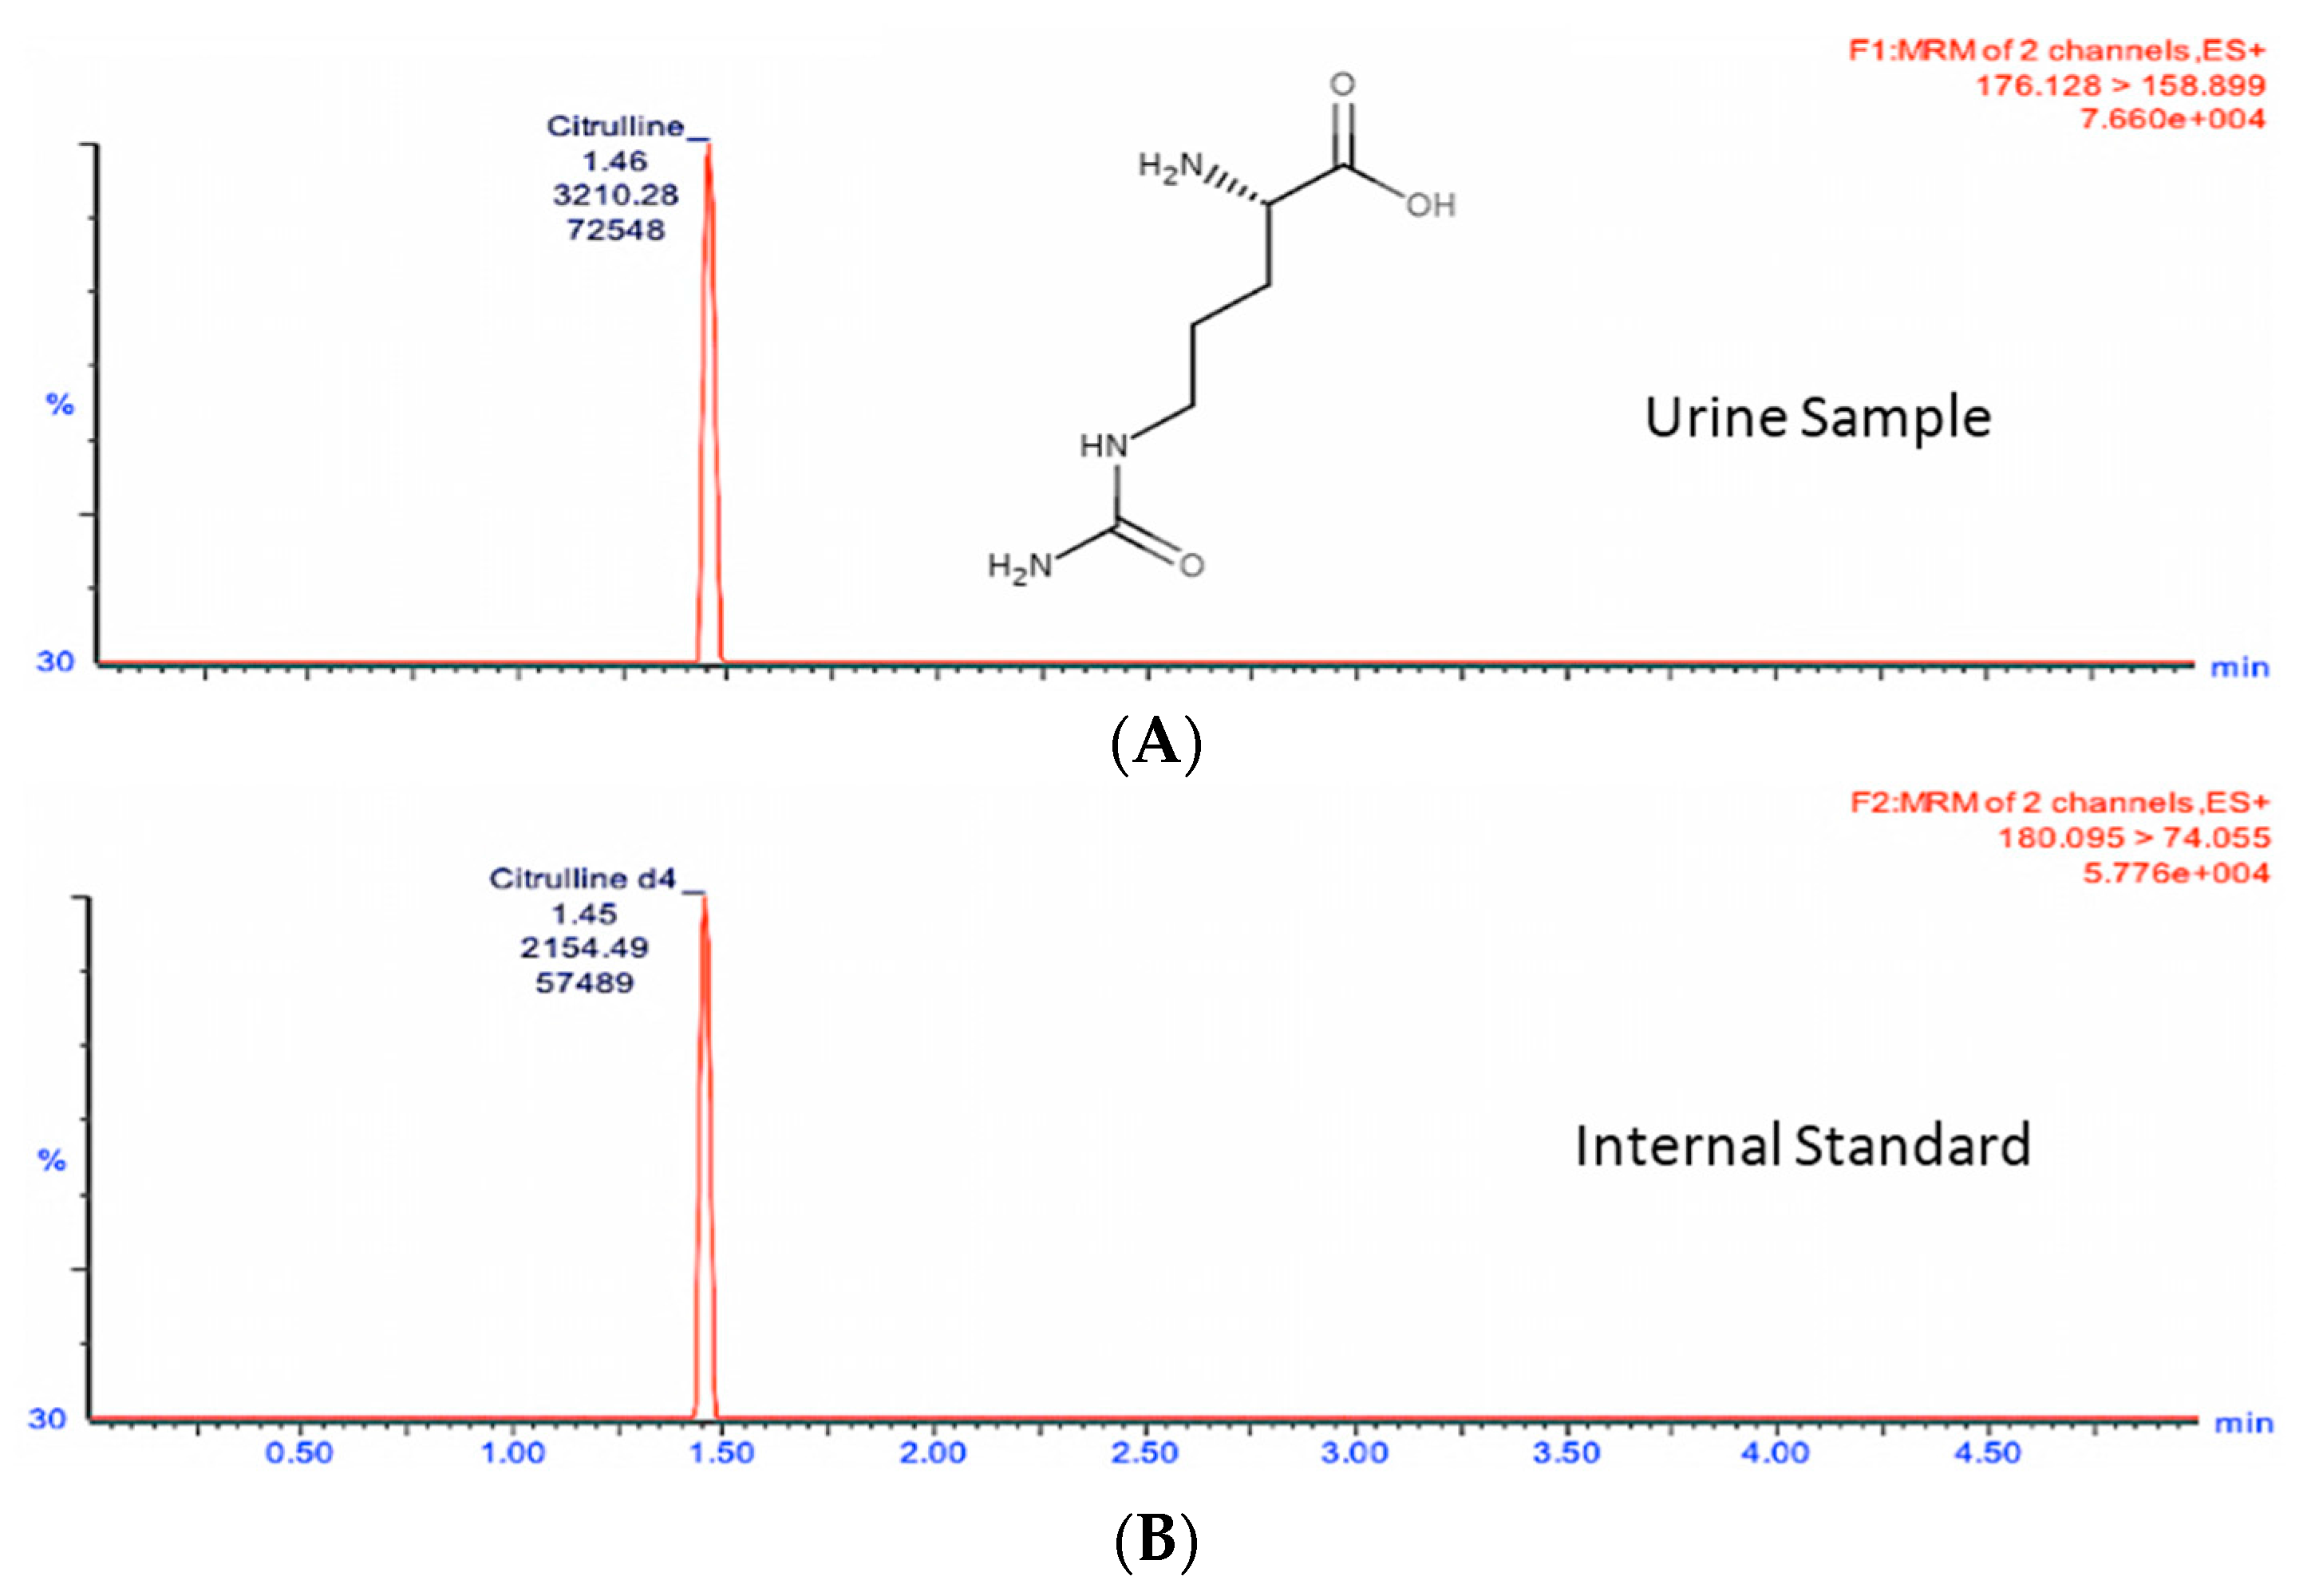
Figure 2 shows the citrulline MRM transition chromatogram of the analyte (A) at
m/
z transition 176.1→158.9 and (B)
m/
z transition 180.1→74.1 for the spiked neat internal standard citrulline-d
4 which was also used for quantitation. Similarly,
Figure 3 shows the chromatogram of MRM transition at
m/
z 375.4→357.3 for calcitroic acid (A) and (B)
m/
z transition 419.2→305.0 for the spiked neat internal standard, 1α,25-dihydroxyvitamin-D
3-d
3. It is important to note that quantitation of calcitroic acid only involved the area of the peak at 1.20 min and excluded that of the peak at 0.73 min.
Once liquid chromatography mass spectrometry (LCMS) method and MRM transitions (fragment structures for citrulline and calcitroic acid transitions provided in
Supplementary Materials Figure S1) were optimized for each analyte, the internal standards were used to calculate urinary concentration of the analytes for each exposure scenario at the designated time/dose points.
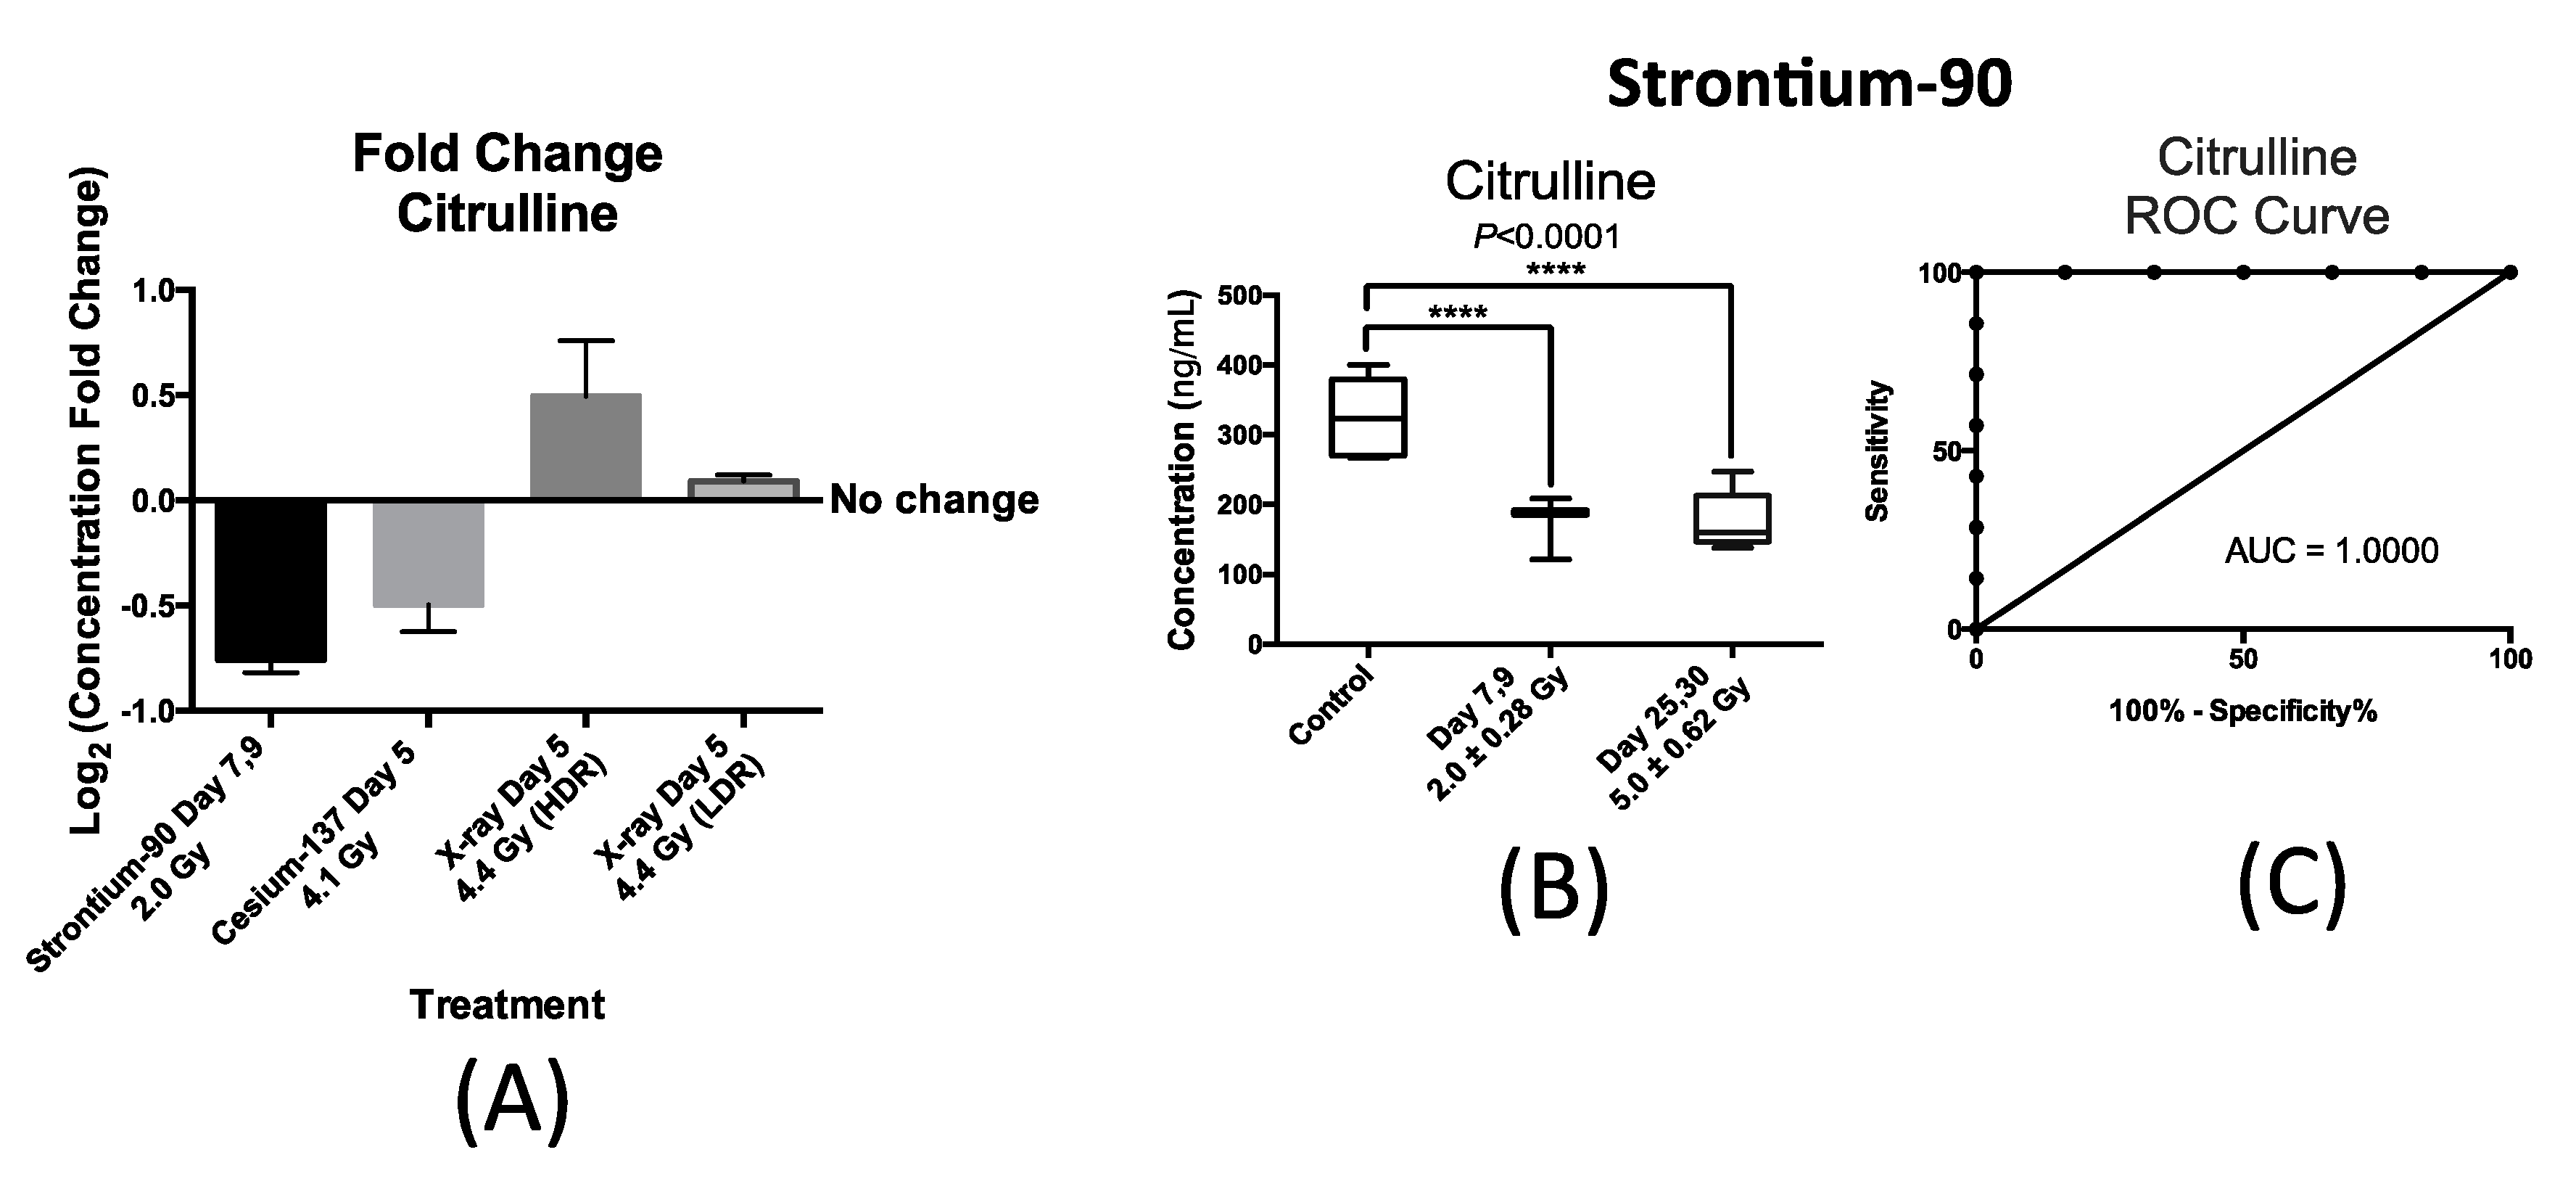
Figure 4 summarizes our findings with respect to urinary excretion of citrulline in response to internal exposure to
90Sr and
137Cs and X-ray exposure at the dose rate of 1.1 Gy/min (HDR) at similar time-points; within one week after exposure. This time-point was chosen to accommodate a real-world nuclear/radiological disaster where exposure monitoring for many will occur in the first week. Thus, the candidate IR markers of exposure need to have a stable and persistent signal during this time to help medical responders assess exposure. The X-ray exposure at the dose rate of 3.0 mGy/min (LDR) induced no statistically significant changes in the urinary concentration of citrulline post exposure to 4.4 Gy of X-ray exposure delivered at 3.0 mGy/min over a 24 h period as shown in
Figure 4A. This plot also shows the statistically significant changes in the urinary concentration of citrulline in mice after exposure to
90Sr (internal exposure) after seven days at cumulative dose of 2.0 Gy,
137Cs (internal exposure) at day 5 after exposure at cumulative dose of 4.1 Gy, and X-ray at day 5 post 4.4 Gy exposure at high dose rate (HDR) of 1.1 Gy/min. The
y-axis, log
2 fold change, signifies the magnitude of change in the urinary excretion of citrulline after exposure and was calculated by the log
2 ratio of urinary concentration of citrulline in the exposed mice exposed to that of citrulline in control mice at each time-point. The
x-axis represents each of the four exposure scenarios. Exposure to
90Sr and to a lesser extent to
137Cs induced a decrease in the urinary levels of citrulline, while X-ray exposure delivered at HDR had the opposite effect. The decrease in the urinary levels of citrulline is thus specific to the two internal emitters with
90Sr having a more persistent effect (
Figure 4B) than
137Cs (
Supplementary Materials Figure S2). Thus, we further measured and tested the feasibility and predictability of citrulline in the case of
90Sr exposure.
Figure 4B shows a box plot representation of the significant and persistent drop in the urinary concentration (ng/mL) of citrulline after
90Sr-exposure throughout the 30-day study. The calculated mean concentration ± SEM for citrulline in the control mice was 326.3 ± 24.6 ng/mL, while this number of the exposed mice at days 7–9 at the cumulative skeleton dose of 2.0 Gy was 182.8 ± 10.7 ng/mL, and 176.1 ± 18.8 ng/mL for days 25–30 at 5.0 Gy. These calculations were based on measurements in at least six mice per study group. The persistent decrease in the urinary concentration of citrulline is clearly evident in this panel, dropping to almost one half of the control levels at days 25–30 after
90Sr-exposure. In the case of
137Cs exposure, the urinary excretion of citrulline drops by almost 30% at five days after exposure at cumulative dose of 4.1 Gy (
Supplementary Materials Figure S2). This is the largest and most statistically significant drop in citrulline’s urinary levels at this time/dose point, and its levels climb back to its pre-exposure levels by the end of the 30-day study. In the case of HDR exposure, statistical significance was reached at 4.4 Gy five days after exposure with after exposure excretion levels of citrulline at 1.4 times its pre-exposure levels.
Figure 4C displays a Receiver Operating Characteristic (ROC) curve for citrulline at time-point day 7 after exposure at cumulative average dose of 2.0 Gy compared to controls showing the predictive power of this metabolite in exposure classification. In this plot, the area under the curve (AUC) demonstrates the sensitivity and specificity of the biomarker from 50% chance up to 100%. The exposure assessment ability of citrulline at the cutoff value of 268.7 ng/mL (days 7–9) and
p-value of 0.0062 had a specificity of 83.3% and sensitivity of 100%.
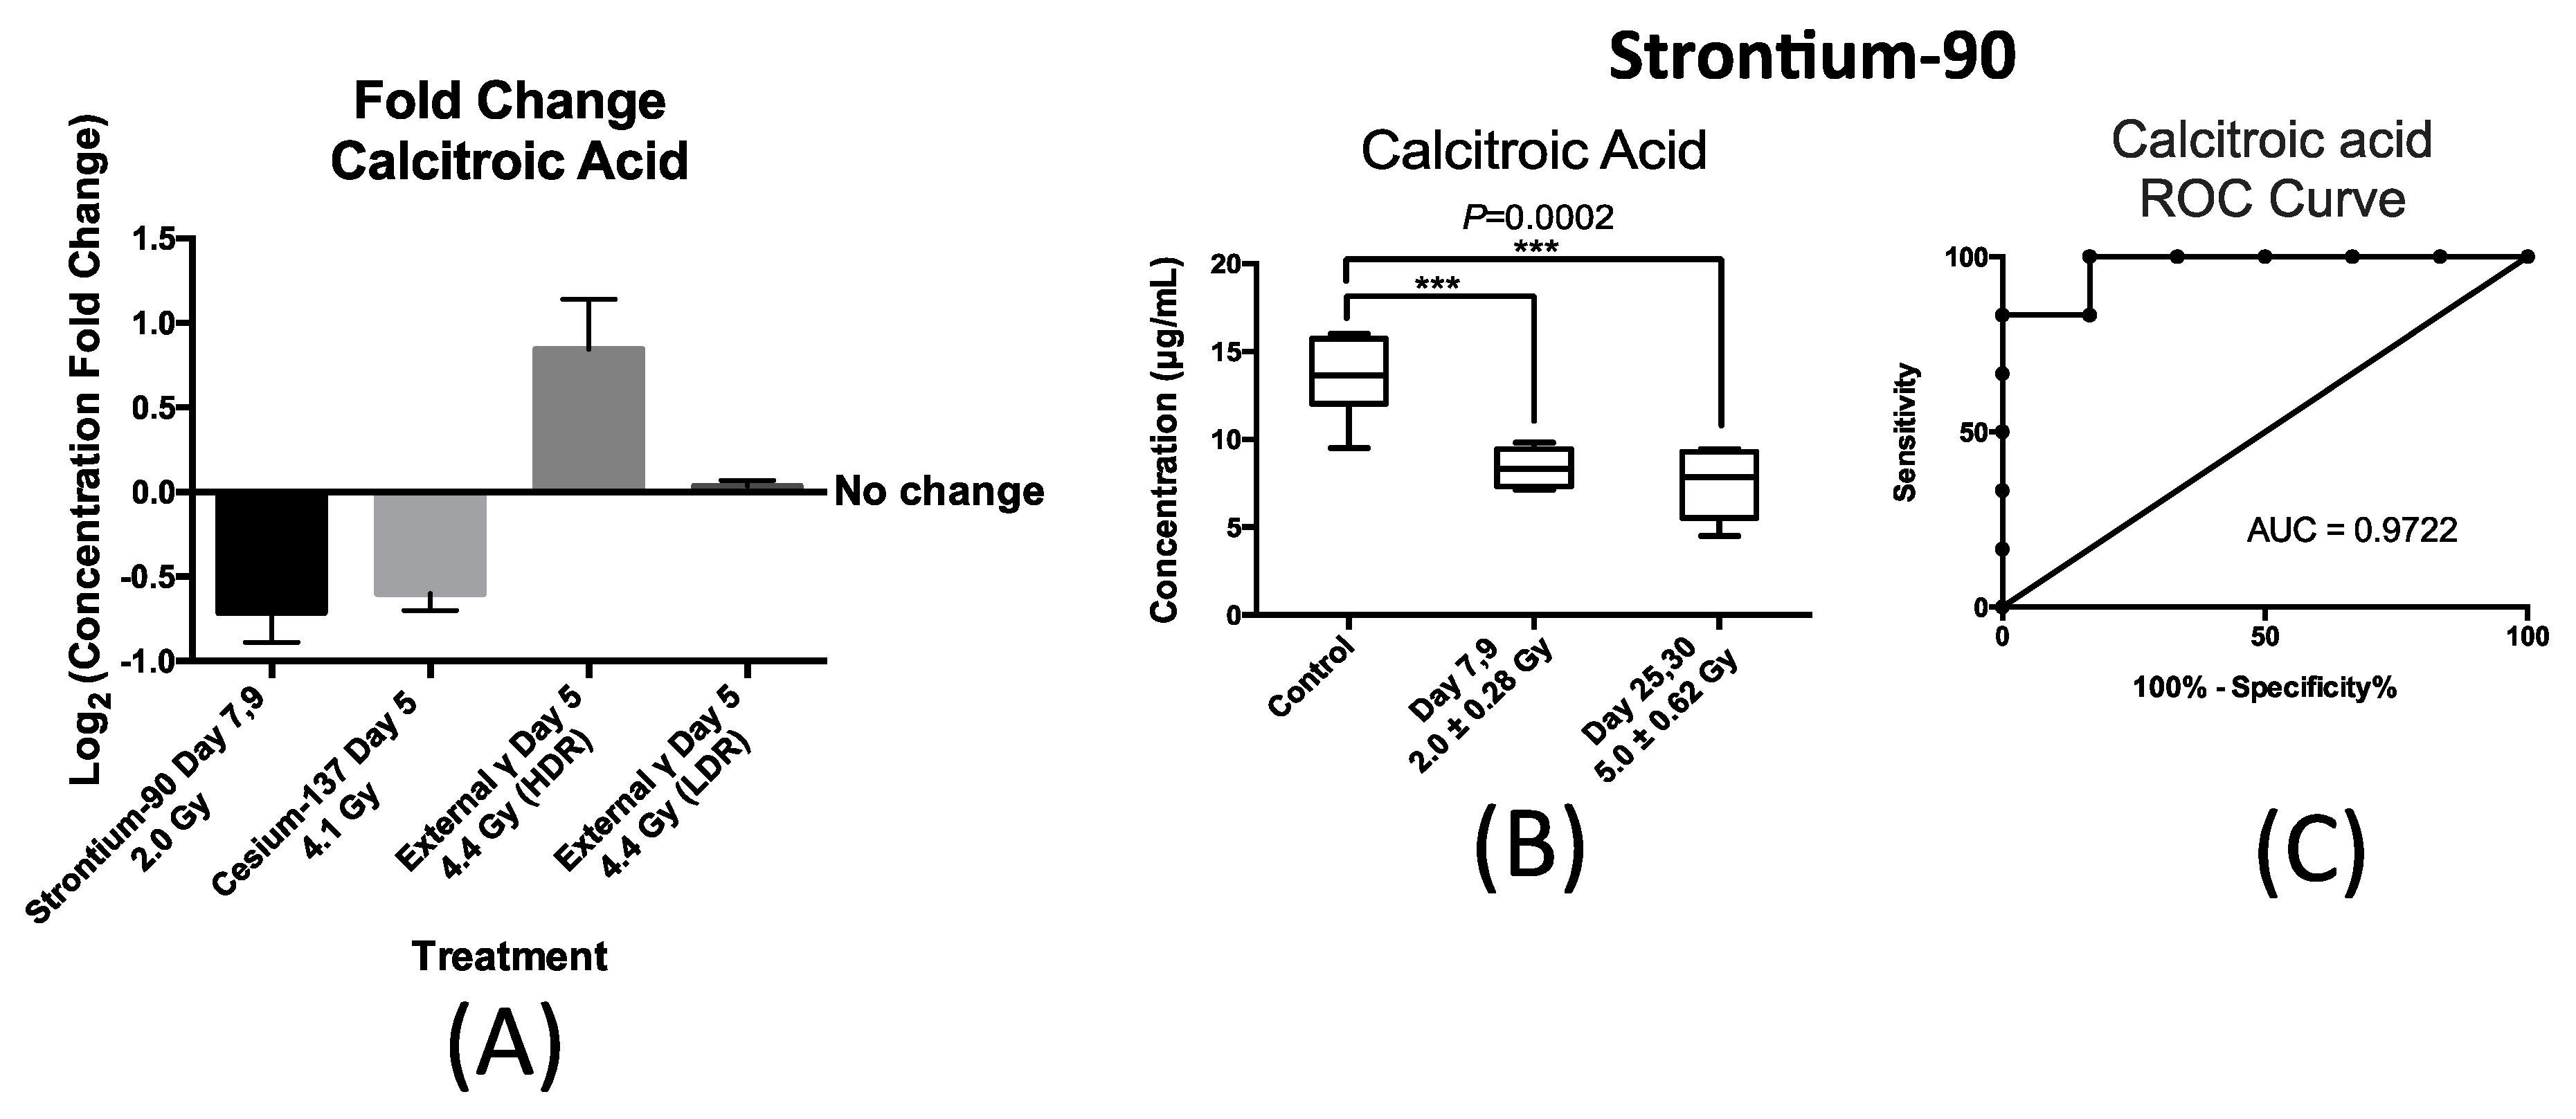
Similarly, the urinary excretion of calcitroic acid was quantified post exposure to both internal emitters and to LDR and HDR X-ray irradiation. In the case of urinary excretion of calcitroic acid, exposure to X-ray exposure at the dose rate of 3.0 mGy/min (LDR) also did not result in a statistically significant change (
Figure 5A). Panel A in
Figure 5 also shows the changes in the urinary concentration of calcitroic acid from mice after exposure to
90Sr at day 7 after exposure at cumulative dose of 2.0 Gy,
137Cs at day 5 after exposure at cumulative dose of 4.1 Gy, and X-ray at day 5 post 4.4 Gy exposure at high dose rate (HDR) of 1.1 Gy/min. This plot was constructed similarly to
Figure 4A as described above. This plot shows that exposure to
90Sr and to a lesser extent
137Cs exposure induced a decrease in the urinary levels of calcitroic acid, while X-ray exposure (HDR) had an opposite effect. As with citrulline, the decrease in the urinary excretion of calcitroic acid after
90Sr-exposure was persistent throughout the 30-day study (
Figure 5B). The box plot in
Figure 5B represents the urinary concentration of calcitroic acid in control and exposred mice. In the control mice, the urinary concentration of calcitroic acid was 13.6 ± 0.96 μg/mL, for days 7–9 at cumulative skeleton dose of 2.0 Gy it was 8.4 ± 0.46 μg/mL, and for days 25–30 at 5.0 Gy, it was 7.5 ± 0.90 μg/mL. However, in the case of
137Cs exposure, the decrease in urinary excretion levels of calcitroic acid showed a dose dependent response (
Supplementary Materials Figure S2), unlike with citrulline. Both internal emitters induced a persistent decrease in the urinary concentration of calcitroic acid with a dose/time dependency in the case of
137Cs exposure. On the other hand, urinary excretion levels of calcitroic acid increased by 15% at five days after HDR-exposure (4.4 Gy). Exposure to
90Sr induced the largest change in the levels of calcitroic acid thus we chose to further analyze these samples to assess the predictive power of calcitroic acid as an IR exposure marker.
Figure 5C depicts an ROC analysis of calcitroic at time-point days 7–9 after exposure at cumulative average dose of 2.0 Gy compared to controls. Calcitroic acid had an AUC of 0.97 at this time/dose point at the cutoff value of 11.4 μg/mL and
p-value of 0.0065 at 83.3% specificity and 100% specificity.
3. Discussion
This study focuses on the identification and quantitative assessment of two urinary biomarkers of IR exposure and complements our previous investigations into the metabolomic profile of urine from mice internally exposed to
90Sr and
137Cs and to X-ray beam radiation. Exposure to internal emitters such as
90Sr and
137Cs is a well-recognized risk after a nuclear/radiological disaster. While more attention has been given to metabolomic perturbations post exposure to X-ray, particularly at 1 Gy/min, less is known about how dose rate modulates these perturbations and the effects of internal exposure to internal emitters on metabolism. Our initial comprehensive analyses of the changes in the urinary metabolomic profiles in mice after exposure to X-ray; radiation at the LDR and the HDR as well as to
90Sr and
137Cs demonstrated that these exposures can induce similar perturbations in the general metabolomic profile of urine in mice as seen in
Figure 1A. While these four different types of exposures induce changes in many of the same metabolic pathways (
Figure 1B), such as pathways associated with energy metabolism, they have varying effects (decrease/increase) on different intermediates in these pathways. It is important to note that the changes observed were the direct result of exposure to various IR sources. We did not detect any adverse events or observations for in the food/water consumption and the weight of the mice thoughout the 30-day studies. While several IR-sensitive metabolites have already been chemically characterized through conventional tandem MS experiments in our previous work [
7], two robust features with highly statistically significant urinary changes could not be chemically identified and further characterized due to lack of commercial chemical standards and unavailability of quantitative approaches in urine until now. Here, we describe the identification and the quantitative methods used for the characterization of these two promising urinary IR-markers, calcitroic acid and citrulline, particularly in the case of internal emitters. Optimized MRM methods were then used for calculating the changes in their concentration in mouse urine after each exposure case (
Figure 4 and
Figure 5 and
Supplementary Materials) as summarized in
Table 2.
The first metabolite to be studied was citrulline, which is an alpha-amino acid and is mainly synthesized by small bowel enterocytes. We observed a significant decrease in the urinary concentration of citrulline after internal exposure to
90Sr and
137Cs in mice (
Figure 4 and
Figure S1). While we did not detect any statistically significant changes in the urinary excretion of citrulline at 4.4 Gy X-ray irradiation delivered at low dose rate (LDR) of 3.0 mGy/min, we did observe a statistically significant increase post 4.4 Gy X-ray irradiation at high dose rate (HDR) of 1.1 Gy/min (
Figure 4). Citrulline is essential for the synthesis of arginine (
Figure 6), which in turn produces nitric oxide. Citrulline is released by the small intestine continuously, thus perturbations in its concentration may be a good marker of intestinal dysfunction [
27]. A decrease in citrulline levels is clinically relevant as it reflects a decrease in the functional mass of enterocytes [
28,
29] and radiation-induced intestinal epithelial damage [
30,
31]. In fact, citrullinaemia is a more sensitive and specific test than the sugar permeability test for assessing small bowel toxicity and enterocyte function [
32]. Thus, the total concentration of citrulline at any given time may be used in a predictive manner for gut injury. This could potentially be indicative of an early but transient damage to the small bowel in the case of
137Cs as the decreased citrulline levels return to baseline 30 days after exposure (
Figure S2), while this damage may be more persistent in the case of
90Sr (
Figure 4B). In the case of LDR X-ray irradiation, the repair and adaptation mechanism over time (3 mGy/min) may prevent damage to the gut epithelium, which may be why we did not detect statistically significant changes in urinary citrulline concentration after LDR exposure unlike with HDR exposure. Although the metabolomic signatures of LDR and HDR share many similarities with each other and those of internal emitters, there are subtle yet important differences in the metabolic perturbations each exposure type induces. The case of citrulline is an example of such a case in the urinary excretion profile of metabolites due to exposure route and dose rate. Our previous gene expression study of blood white cells of the mice exposed to internal emitters showed a slight yet statistically significant increase in the expression of
NOS1 after
90Sr-exposure at days 25–30 while no changes were found with respect to
137Cs or X-ray irradiation. NOS1 is a calcium regulated isomer of NOS and responsible for the production of citrulline. While this observation is intriguing, it is very important to keep in mind the complexity of citrulline metabolism. Thus, much work is needed to draw any conclusion here between the decrease in the concentration of citrulline after exposure and the observed overexpression levels of
NOS1.
Lastly, we analyzed the urinary concentration of calcitroic acid, which remained steady with no statistically significant changes after LDR exposure, yet showed distinct increase after exposure to HDR γ irradiation compared to a significant decrease after exposure to the two internal emitters (
Figure 5A). Calcitroic acid is the terminal product of the deactivation of 1a,25-dihydroxyvitamin D
2. Vitamin D
2 and D
3 are metabolized in a similar fashion producing hormonally active form of the 1α,25-(OH)
2D
2. The synthesis of calcitroic acid from 1α,25-(OH)
2D
2 is carried out by the isomers of the cytochrome P450 (CYP) in a multi-step catalytic process. CYP4 proteins metabolize vitamin D and are also important in chemical and environmental defense. A gene expression study carried out on the blood of mice exposed to
90Sr showed a lower expression of two
CYP genes,
Cyp4f18 and
Cyp4v3 while an increase was observed in the expression of
Cyp4v3 post HDR X-ray irradiation [
15,
16,
17]. Although it is hard to draw direct conclusions from the gene expression and the metabolomics data, significant decrease in the urinary concentration of calcitroic acid in the case of
90Sr-exposure, and the increase in the case of HDR X-ray irradiation, may be indicative of abnormalities in the regulatory oxidation pathway of vitamin D
3 and linked to the changes in the expression of
Cyp4v3 [
18]. In the case of
137Cs changes in the expression of Cytochrome
P450 gene,
Cyp2r1, was induced when rats were exposed to
137Cs in their drinking water for up to three months [
33]. This is further evidence that chronic exposure to
137Cs affects vitamin D metabolism by inducing changes in the CYP enzymes. Collectively, these studies show that vitamin D synthesis and catabolism are radiosensitive metabolic pathways. Further proof can be found in bone mineral density data from the workers of the Chernobyl accident [
34] and bone cancer data reported in previous studies on
137Cs-treated animals [
35]. The involvement of vitamin D metabolism in radiation injury has been documented by several gene expression studies as noted above; however, limited information is available on the mechanism through which ionizing radiation modules vitamin D synthesis and catabolism. While previous untargeted and targeted metabolomic studies by us and other groups have shown severe changes in the energy and lipid metabolism after radiation exposure [
1,
2,
3,
4,
5,
6,
7,
8,
9], more work is needed to explore the effects of exposure on vitamin D metabolism. While the metabolomic data presented here and the results of the previous gene expression studies independently suggest changes in the vitamin D metabolism, the link between these two platforms may be achieved by future proteomic approaches on CYP and other enzymes associated with vitamin D metabolism.
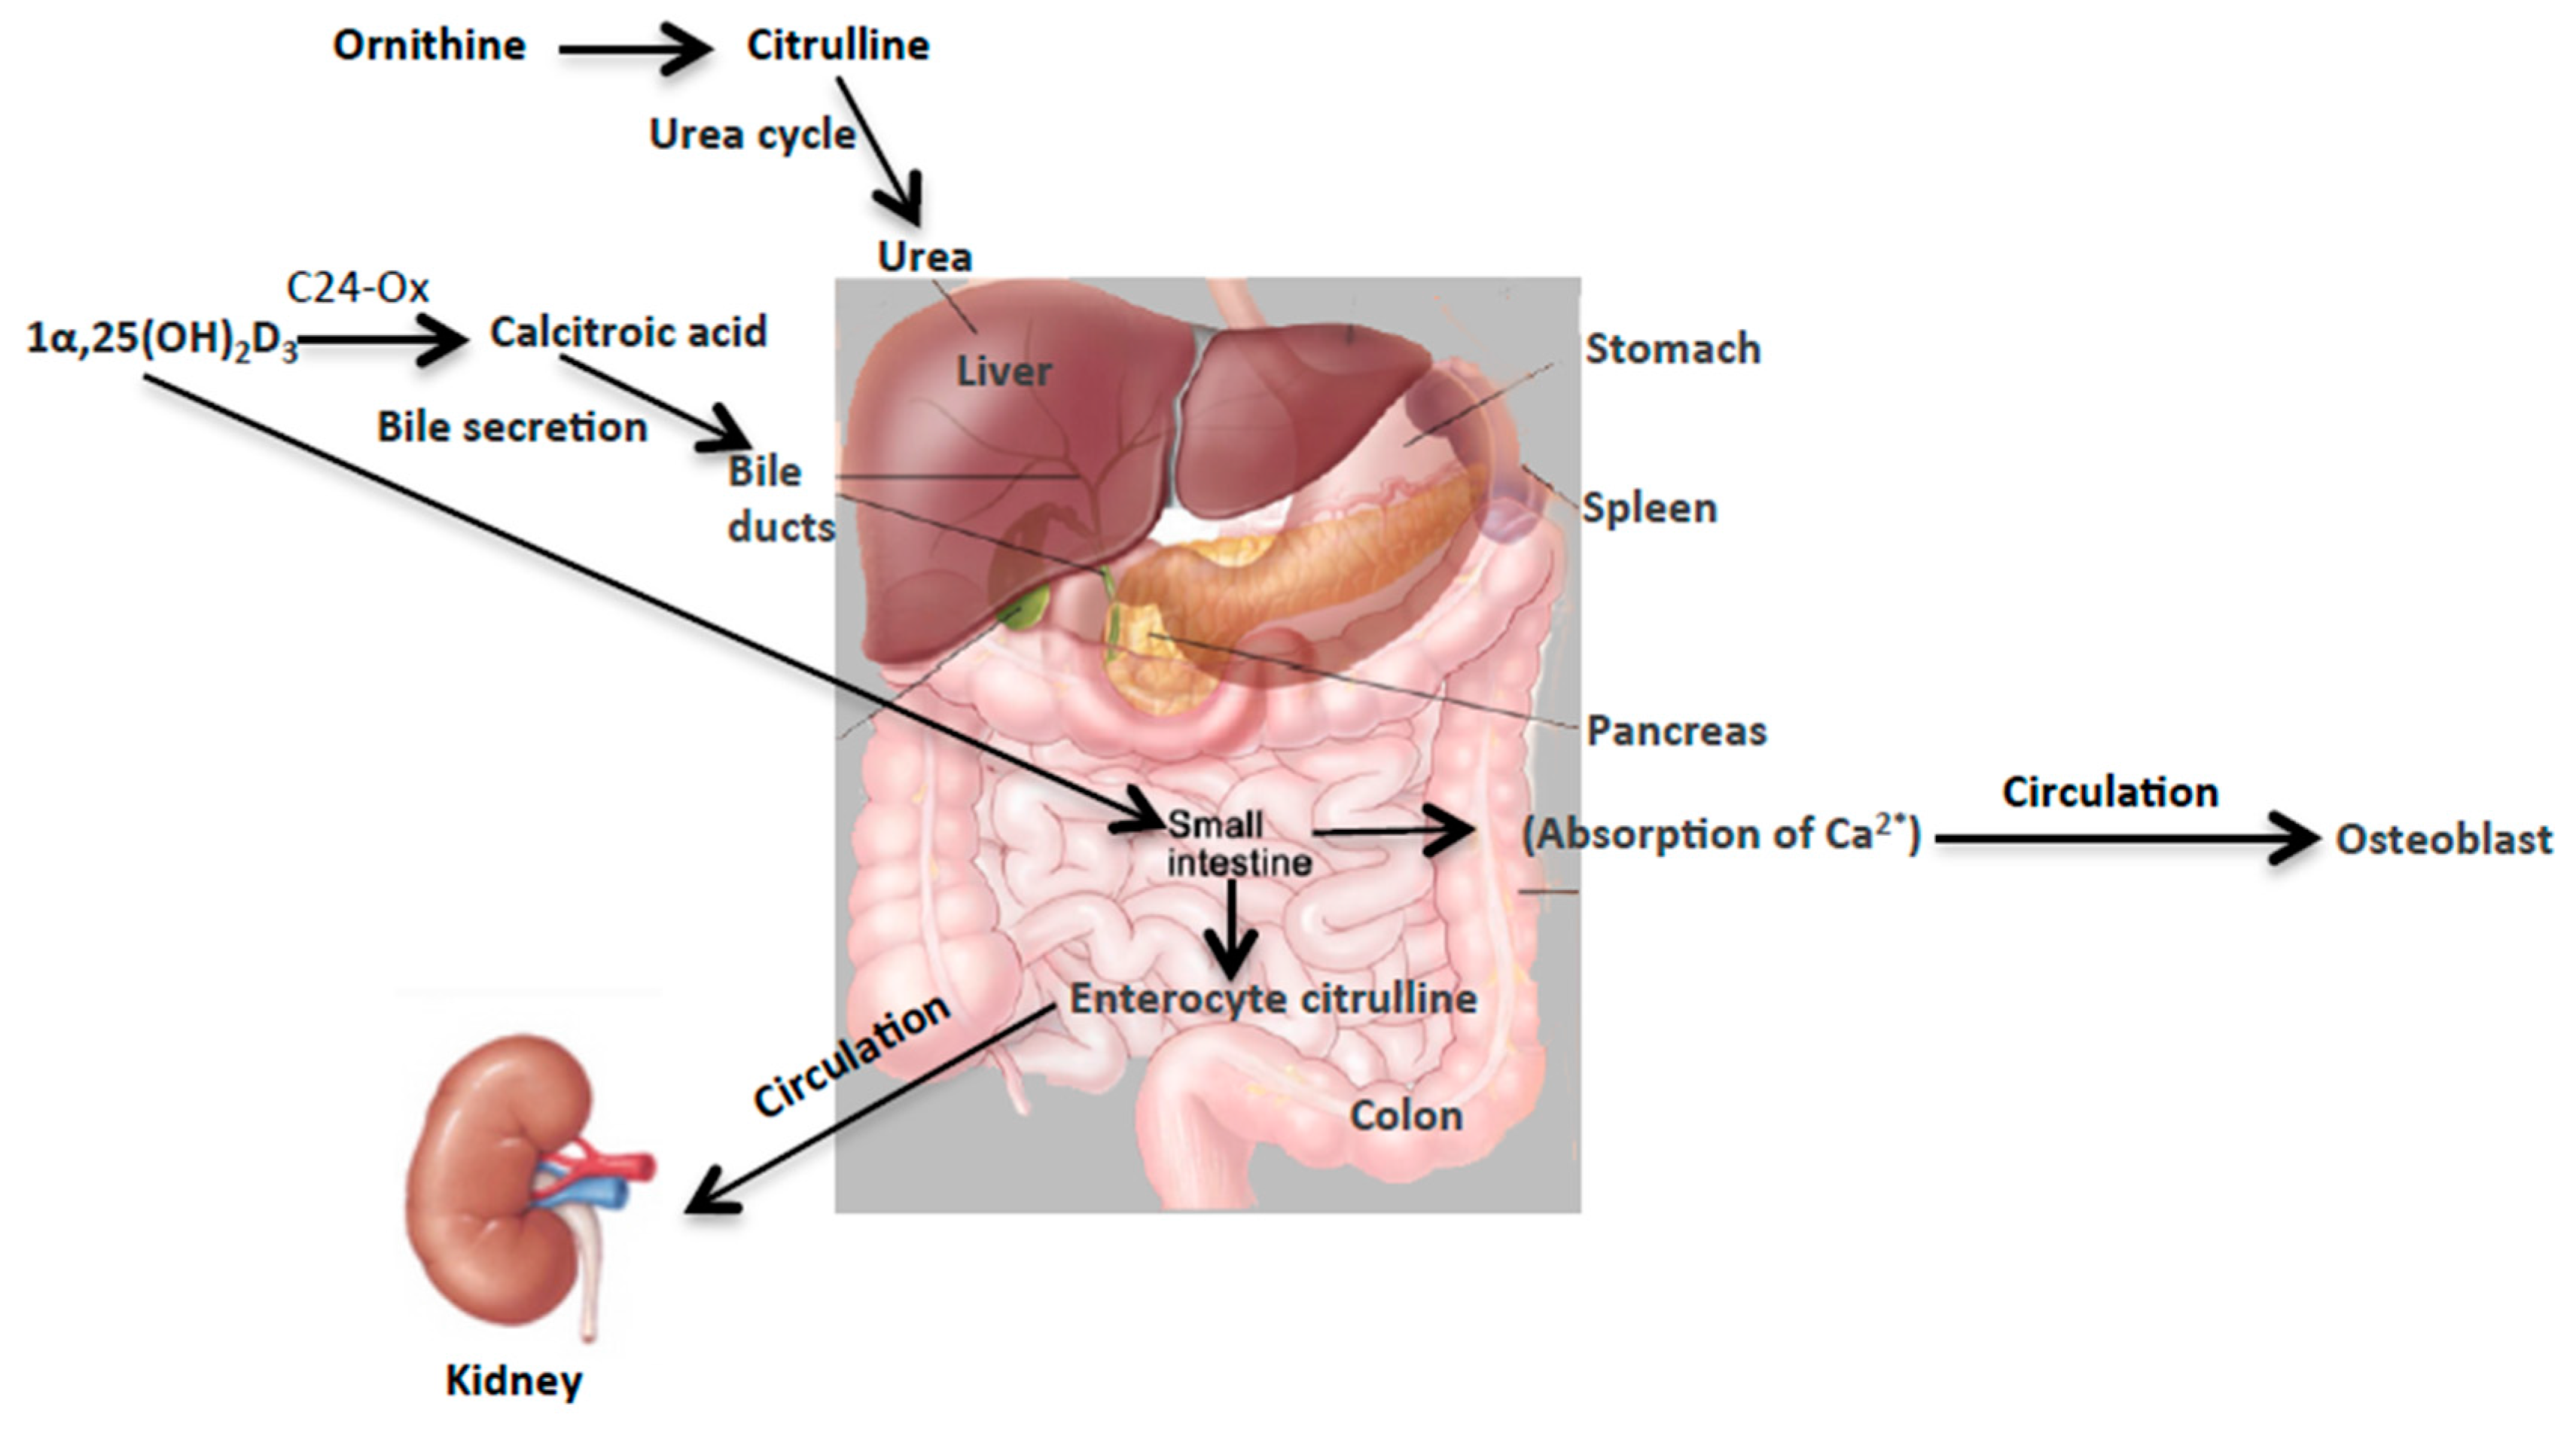
This study highlights the unique changes in the concentration of two urinary metabolites, citrullin and calcitroic acid, post exposure to internal emitters
90Sr and
137Cs, and X-ray irradiation (HDR and LDR). These robust changes, particularly in the case of internal emitters hint at perturbations in the overall metabolism of citrulline in the urea cycle and of calcitroic acid secretion into the bile (
Figure 6). Though the two biomarkers reported here are involved in two distinct metabolic processes together they may serve as reliable yet independent predictors of exposure, particularly for exposure to internal emitters. The observed differences in the exposure responses with respect to each of the two markers as noted in
Table 2 are due to differences in radiation quality, tissue exposure patterns, and varying dose rate, particularly in the case of the internal emitters. Exposure at low dose rates is suggested to dampen the metabolomic responses as it allows for ongoing DNA repair and is perhaps the reason why no changes were detected in the case of LDR exposure. Although exposure to ionizing radiaon induces changes in similar pathways with respect to internal and external exposure sources, the results of our previous studies on HDR exposure [
5] and exposure to
137Cs [
6] and
90Sr [
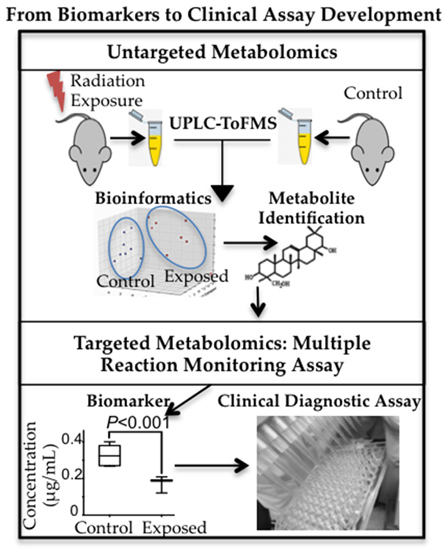
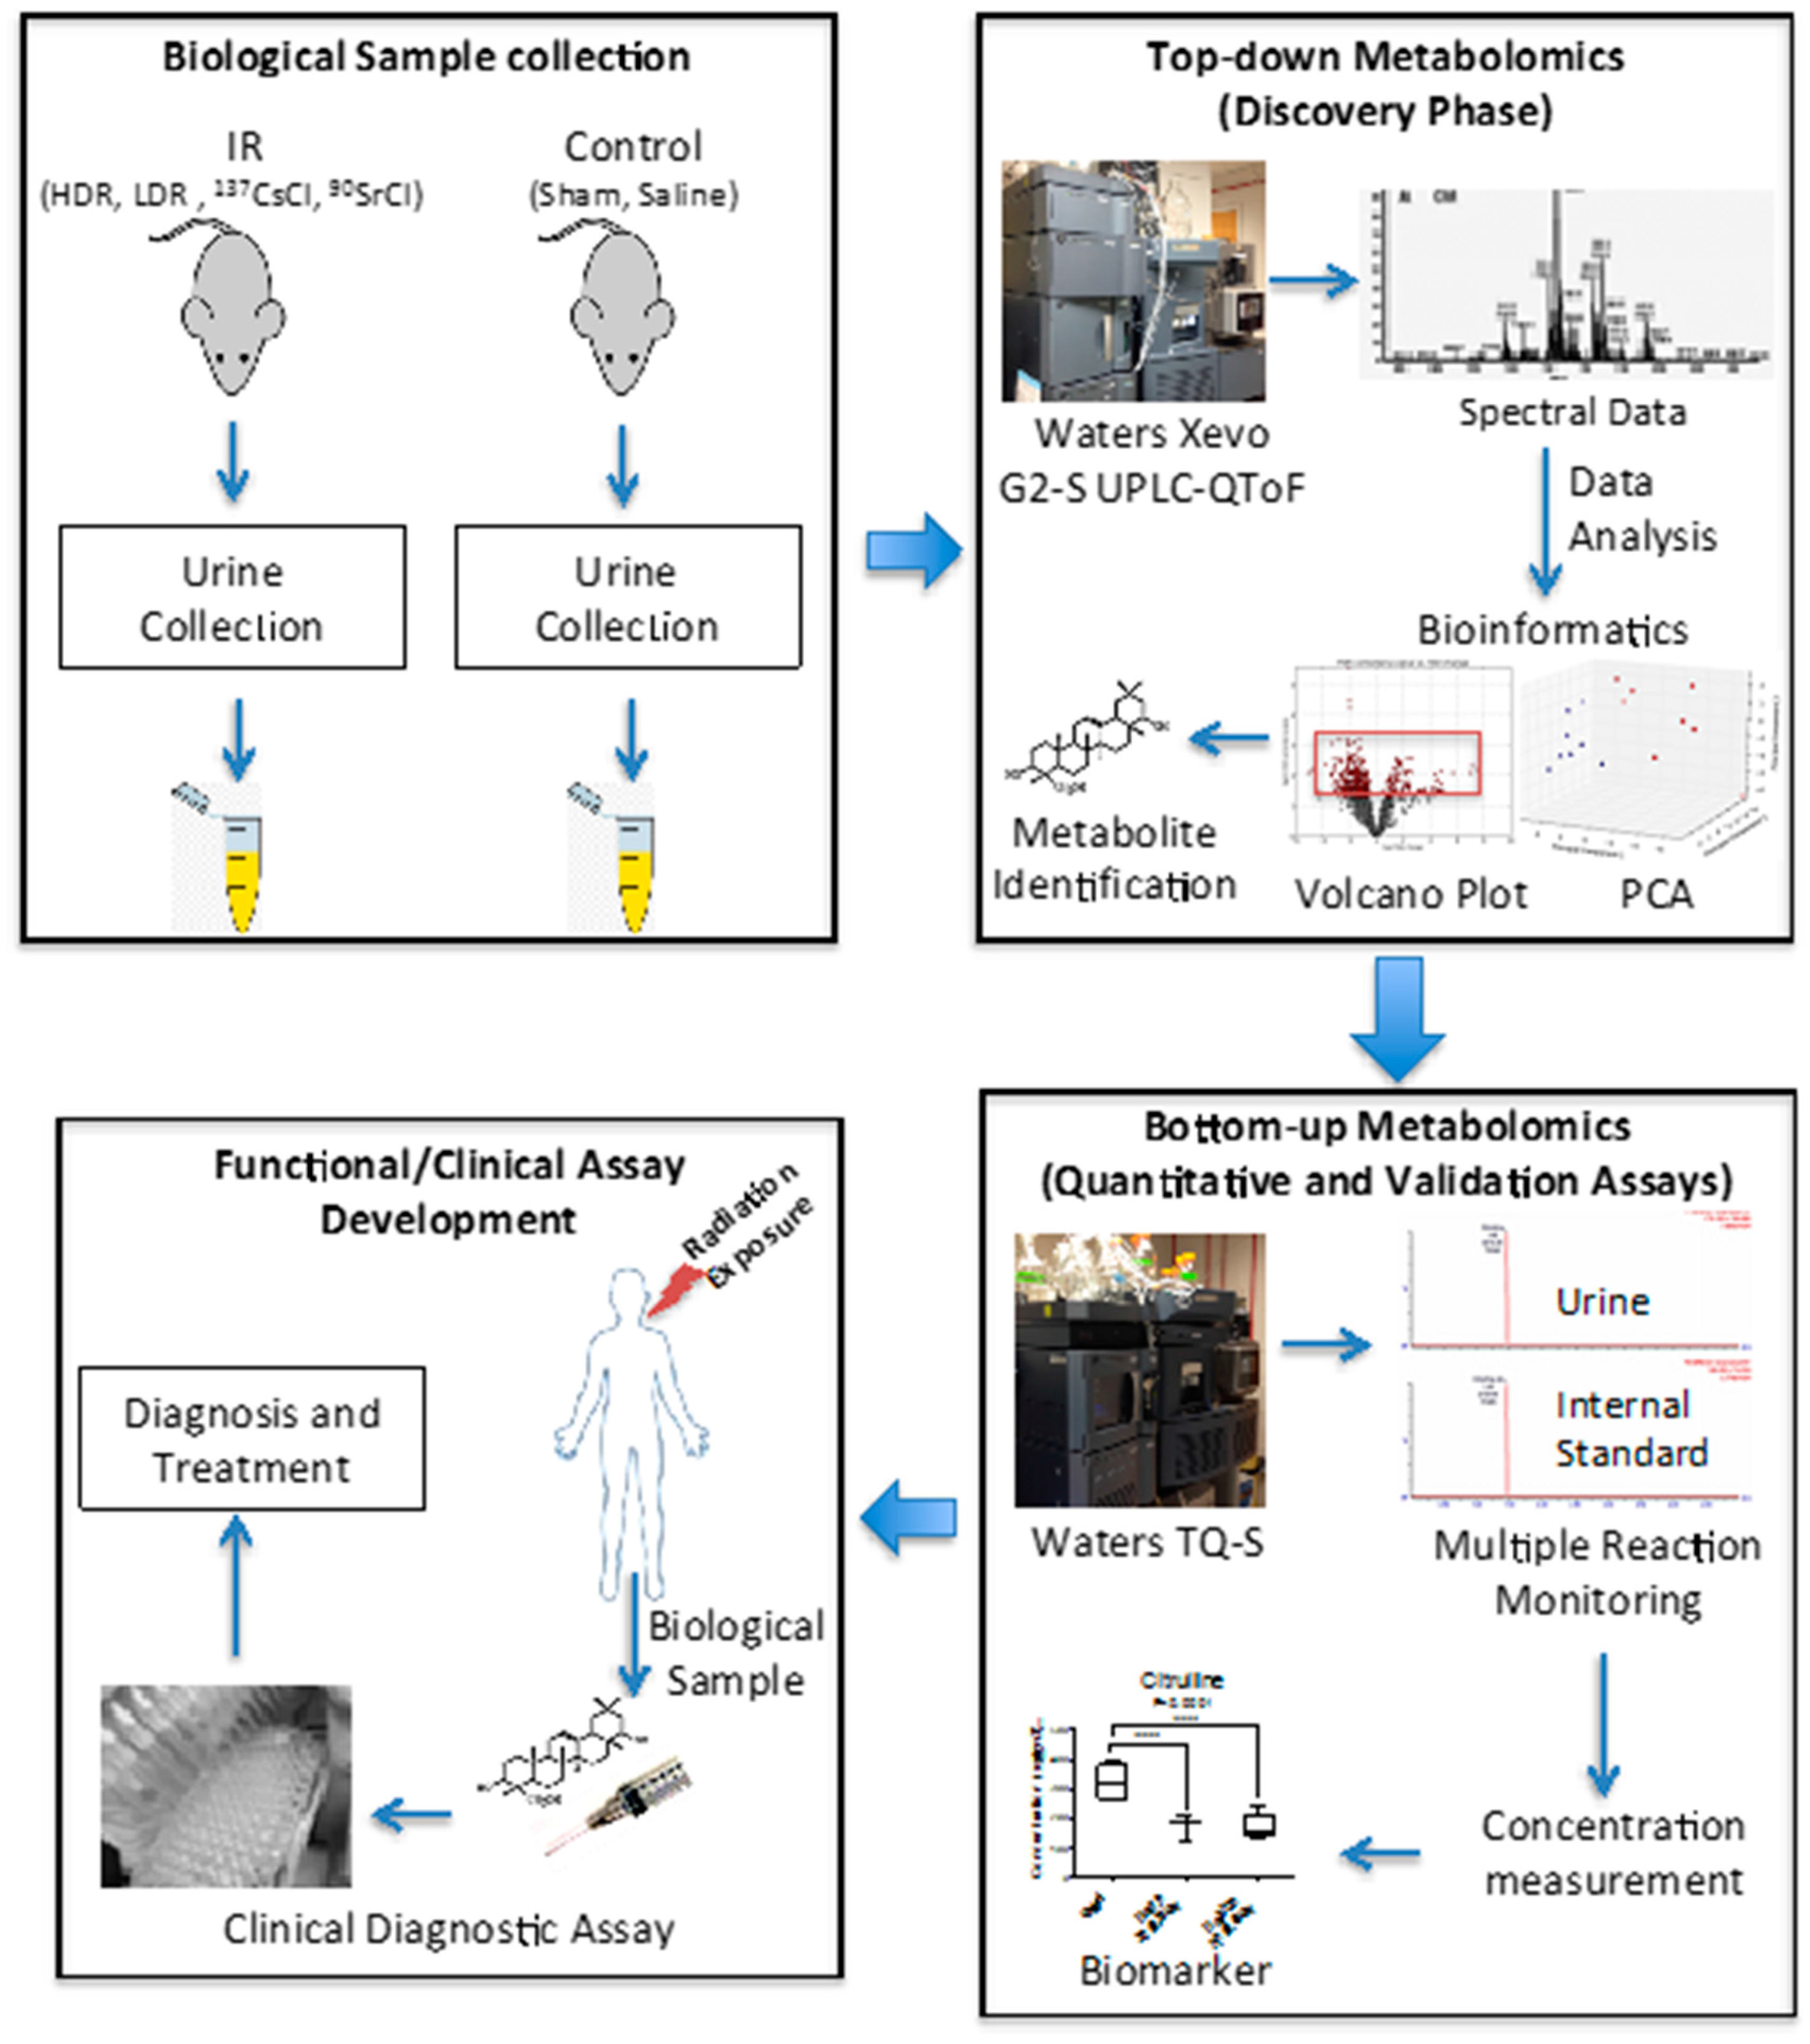
7] also suggested that the urinary metabolomic responses in mice induced by exposure to the two internal emitters have more in common with each other than with HDR exposure. This may be due to varying low dose rates and tissue exposure patterns in the case of the two internal emitters. This study was built on our previous comprehensive qualitative assessment of urinary metabolomic perturbations in mice after exposure to various types of IR exposures (top two panels of
Figure 7). These qualitative and discovery-phase studies highlighted the robust and statistically significant changes in the urinary excretion of two ions and laid the foundation for their identification and quantitative assessment as reported in the current study (bottom panels of
Figure 7). This study also aimed at the refinement of the previously established exposure metabolomic profiles and has the promise of clinical and biodosimetry applications. A refined and validated exposure signature in easily accessible biofluids will help clinical laboratories assess individual exposure after a nuclear/radiological event. Quick yet accurate high-throughput biodosimetry depends on exposure and dose specific biomarkers. Thus, candidate biomarkers such as those reported here are promising and, once independently validated, may be used as high throughput biodosimetry countermeasures.
4. Materials and Methods
UPLC-grade solvents were purchased from Fisher Scientific (Hanover Park, IL, USA). Citrulline was obtained from Sigma-Aldridge (St. Louis, MO, USA) and calcitroic acid was ordered from Toronto Research Chemicals Incorporated (Toronto, ON, Canada). Deuterium labeled citrulline (d4) was obtained from Cambridge Isotope Laboratories (Tewksbury, MA, USA) and 1α,25-Dihydroxyvitamin D3 (d3) was purchased from Isosciences (King of Prussia, PA, USA).
4.1. Animal Experiment and Sample Collection
We have previously described the details of the animal study and urine collection procedure [
5,
6,
7]. Briefly, in the case of the internal emitters, C57Bl/6 (Charles River Laboratories, Frederick, MD, USA) mice at approximate age of 10–12 weeks old, under applicable federal and state guidelines and with approval by the Lovelace Respiratory Research Institute (LRRI) (Albuquerque, NM, USA) Institutional Animal Care and Use Committee (IACUC), were quarantined for 14 days upon receipt and prior to exposure to
90Sr or
137Cs. The radionulclides were administered intravenously by tail vein injection. Mice were then housed individually in microisolator cages with lead shielding. After treatment, all animals had unlimited access to Teklad Certified Global Rodent Diet 2016 (Harlan
® Laboratories Inc., Madison, WI, USA) and water. No adverse effects were noted for any of the animals during the course of the study. On the scheduled necropsy days, animals were euthanatized and urine was collected directly from the bladder with a needle and syringe. In the case of X-ray irradiation, under appropriate IACUC approval by Columbia University Medical Center (New York, NY, USA), male C57BL/6N mice, aged 8–10 weeks were exposed to HDR IR by being placed in a box containing bedding and irradiated in an X-ray machine (X-Rad 320, Precision X-ray Inc, Branford, CT, USA) with a dose rate of 1.03 Gy/min. For total body LDR irradiations, the mice were placed in a specially designed mouse box with prior 24 h acclimation, and placed in the X-ray machine at 22 °C (±0.5 °C) with humidity at 30%–40%. LDR irradiation was at a dose rate of 0.00309 Gy/min. The LDR mice were exposed over a pre-determined time period at 0.00309 Gy/min to achieve the desired dose (e.g., 24 h for the dose of 4.4 Gy). We created a custom Thoraeus filter (1.25 mm Sn, 0.25 mm Cu, 1.5 mm Al) that was used to perform HDR and LDR experiments using the same quality of X-rays. This filter provides a dose rate of 1.03 Gy/min at 40 cm SSD (source to surface distance) and 3.09 mGy/min at the maximum SSD. Urine collections was performed in metabolic cages (Techniplast USA, Exon, PA, USA) by placing each mouse in a single metabolic cage and collecting over a period of 24 h at day 2 and day 5 after irradiation.
4.2. Sample Preparation and Mass Spectrometry Analysis
Urine samples, 20 μL in volume, were prepared by dilution 1:2 in 50% acetonitrile containing internal standards as described below, followed by centrifugation at maximum speed at 4 °C and recovery of the supernatant. The stock solutions for citrulline, internal standard citrulline-d4 (approximately 1 mg/mL each) and calcitroic acid and internal standard 1α,25-dihydroxyvitamin-D
3-d
3 were prepared in methanol and water, respectively. The serial dilutions for each of the standards were done for the study separately in methanol/LC grade water (50:50). Preparation of the calibration curve standards and quality samples (QC) were done by mixing the stock solutions in blank matrix. The final calibration concentration for citrulline ranges from 1 to 1000 ng/mL and for calcitroic acid ranges from 100 to 2000 ng/mL The high, medium and low QC concentration for citrulline are 750, 75 and 7.5 ng/mL respectively. The high, medium and low QC concentration for calcitroic acid are 1800, 1200 and 120 ng/mL, respectively. The targeted quantitation of citrulline and calcitroic acid was performed using multiple reactions monitoring mass spectrometry in urine. The samples (injection volume of 5 μL) were resolved on an Acquity UPLC BEH HILIC 1.7 µm, 2.1 × 100 mm column online with a triple quadrupole mass spectrometer (Xevo-TQ-S, Waters Corporation, Milford, MA, USA) operating in the multiple reaction monitoring (MRM) mode (LC chromatograms, Column conditions and mobile phase gradients are specified in
Table 1 and
Tables S1–S4). The sample cone voltage and collision energies were optimized for both analytes to obtain maximum ion intensity for parent and daughter ions using “IntelliStart” feature of MassLynx software (Waters Corporation, Milford, MA, USA). The instrument parameters were optimized to gain maximum specificity and sensitivity of ionization for the parent (
m/
z = 176.12 (Citrulline)) and daughter ions (
m/
z = 158.89 (Citrulline)). Signal intensities from all MRM Q1/Q3 ion pairs for both analytes were ranked to ensure selection of the most intense precursor and fragment ion pair for MRM-based quantitation. This approach resulted in selection of cone voltages and collision energies that maximized the generation of each fragment ion species; the MRM parameters are specified in
Table 1 and
Tables S1–S4. The metabolite ratios were calculated by normalizing the peak area of endogenous metabolites within samples normalized to the internal standard. Analysis was performed with a six- to eight-point calibration curve, the sample queue was randomized and solvent blanks were injected to assess sample carryover (
Figures S3 and S4). The analyte concentration linear range, recovery, accuracy, precision, and inter-batch repeatibility were also calculated (
Tables S5–S11 and
Figures S5 and S6). The matrix effect for each analyte and internal standard was determined by comparing the peak area in the presence of matrix measure by analyzing the blank matrix spiked after extraction with analyte to the peak area in the absence of the matrix (pure solution of the analyte). No significant change in the area was observed. The MRM data were processed using TargetLynx 4.1 (Waters, Milford, MA, USA). The relative quantification values of analytes were determined by calculating the ratio of peak areas of transitions of samples normalized to the peak area of the internal standard. These values for citrulline in the case of
90Sr exposure were calculated (mean ± SEM) for the control mice at 326.3 ± 24.6 ng/mL, for days 7–9 at cumulative skeleton dose of 2.0 Gy at 182.8 ± 10.7 ng/mL, and for days 25–30 at 5.0 Gy at 176.1 ± 18.8 ng/mL. The values in the case of calcitroic acid for the control mice was 13.6 ± 0.96 μg/mL, for days 7–9 at cumulative skeleton dose of 2.0 Gy was 8.4 ± 0.46 μg/mL, and for days 25–30 at 5.0 Gy was 7.5 ± 0.90 μg/mL.
4.3. Statistical Analysis
Our initial statistical analysis was carried out in MetaboLyzer (Washington, DC, USA) as described previously [
36]. Briefly, MetaboLyzer was used to select ions (
m/
z) that were present in at least 70% of the samples in all study groups with nonzero abundance values (complete-presence ions). This data was used to construct the singular value decomposition-based PCA in
Figure 1A using standard R graphics package. The data were then separately log transformed and analyzed using the nonparametric Mann–Whitney U test for statistical significance (
p < 0.05). The log transformed statistically significant complete-presence ion data were further utilized for principal component analysis (PCA) via singular value decomposition for the purpose of data visualization. Statistical significance testing for ions with nonzero abundance values in at least 70% of the samples in only one group (referred to as partial-presence ions) were analyzed as categorical variables for presence status (
i.e., nonzero abundance) via Fisher’s exact test (
p < 0.05). KEGG pathway annotatations for the statistically significant complete and partial presence ions were used to construct the Venn diagram in
Figure 1B.
Because both m/z at 176.1 (citrulline) and at 375.4 (calcitroic acid) provided the strongest and most persistent signal throughout the 90Sr study, we used these data to test the feasibility and predictability of these markers once they were chemically identified and quantified. The raw data from 7 mice (time-point days 7–9) for the statistically significant ions, citrulline and calcitroic acid, were utilized for constructing a receiver operating characteristic (ROC) curve in GraphPad Prism 6 statistical software (GraphPad Software INC, La Jolla, CA, USA). The sensitivity and specificity of these two markers for 90Sr exposure assessment were calculated at the cutoff value. In the ROC curves, the area under the curve (AUC) is representative of the ability of the marker to discriminate between control and exposed groups. The p-values were two-tailed and at less than 0.05 were considered statistically significant.


