Article

Genome-Wide Transcriptome Profiling of Mycobacterium smegmatis MC2 155 Cultivated in Minimal Media Supplemented with Cholesterol, Androstenedione or Glycerol

College of Life Sciences, Sichuan Normal University, Chengdu 610101, China
*
Author to whom correspondence should be addressed.
These authors equally contributed to this work.
Int. J. Mol. Sci. 2016, 17(5), 689; https://doi.org/10.3390/ijms17050689
Submission received: 24 February 2016 / Revised: 12 April 2016 / Accepted: 28 April 2016 / Published: 7 May 2016
(This article belongs to the Special Issue Microbial Genomics and Metabolomics)

Abstract

:
Mycobacterium smegmatis strain MC2 155 is an attractive model organism for the study of M. tuberculosis and other mycobacterial pathogens, as it can grow well using cholesterol as a carbon resource. However, its global transcriptomic response remains largely unrevealed. In this study, M. smegmatis MC2 155 cultivated in androstenedione, cholesterol and glycerol supplemented media were collected separately for a RNA-Sequencing study. The results showed that 6004, 6681 and 6348 genes were expressed in androstenedione, cholesterol and glycerol supplemented media, and 5891 genes were expressed in all three conditions, with 237 specially expressed in cholesterol added medium. A total of 1852 and 454 genes were significantly up-regulated by cholesterol compared with the other two supplements. Only occasional changes were observed in basic carbon and nitrogen metabolism, while almost all of the genes involved in cholesterol catabolism and mammalian cell entry (MCE) were up-regulated by cholesterol, but not by androstenedione. Eleven and 16 gene clusters were induced by cholesterol when compared with glycerol or androstenedione, respectively. This study provides a comprehensive analysis of the cholesterol responsive transcriptome of M. smegmatis. Our results indicated that cholesterol induced many more genes and increased the expression of the majority of genes involved in cholesterol degradation and MCE in M. smegmatis, while androstenedione did not have the same effect.

1. Introduction

Cholesterol is a terpenoid lipid formed by a carbon skeleton and four fused alicyclic rings. It plays an essential role as a structural component of animal cell membranes [1]. Cholesterol is frequently found in the biosphere with great relevance in biology, medicine and chemistry, not only because of its natural abundance, but also due to its high resistance to microbial degradation. Therefore, the catabolism of cholesterol by specific bacteria has attracted considerable attention, in part as a potential means of producing bioactive derivatives from this steroid [2,3].
As the leading cause of tuberculosis (TB), Mycobacterium tuberculosis can enter monolayers of HeLa, monkey kidney, human amnion cells and lung epithelial cells [4,5]. It uses different parts of the cholesterol molecule as the sole carbon source for energy and also for the biosynthesis of phthiocerol dimycocerosate (PDIM), a virulence-associated lipid [6]. Other mycobacteria and members of the Nocardia, Rhodococcus, and Streptomyces genera show the same ability to degrade cholesterol and have the potential to synthesize new steroid derivatives [7,8]. Biochemical and genetic studies have revealed that a suite of genes involved in cholesterol degradation are critical for the survival of M. tuberculosis in macrophages [9,10]. The MCE4 operon encodes a specific cholesterol uptake system in cholesterol degrading bacteria [6,11,12,13]. The subsequent pathway responsible for the aerobic degradation of cholesterol can be divided into four major steps [3]. The first step involves the oxidation of cholesterol to cholest-5-en-3-one followed by the isomerization to cholestenone [14,15]. The degradation of the alkyl side-chain can be initiated by the cytochromes Cyp125 [16,17] or Cyp142 [18,19], followed by a β-oxidation-like process initiated by an ATP-dependent sterol/steroid CoA ligase [16,20,21]. The third step is central catabolism. Once the aliphatic chain has been oxidized, androstenedione (AD) is converted to androsta-1,4-diene-3,17-dione (ADD) [22,23,24], followed by a sequential transformation yielding 2-hydroxyhexa-2,4-dienoic and 9,17-dioxo-1,2,3,4,10,19-hexanorandrostan-5-oic (DOHNAA) acids [3,10]. The last step involves the degradation of 2-hydroxyhexa-2,4-dienoic DOHNAA acids leading the metabolites to enter central metabolic pathways, however, the corresponding process remains largely uncharacterized [3].
Unlike M. tuberculosis, M. smegmatis is a non-pathogenic member of the genus Mycobacterium. It is not dependent on animal cells for growth, but is frequently found in soil, water and plants. Although it shares more than 2000 gene homologs with M. tuberculosis and shares the same unusual cell wall structure of M. tuberculosis and other mycobacterial species [25], M. smegmatis grows much more rapidly than other species. M. smegmatis strain MC2 155 is a mutant of M. smegmatis [26]. It can be much more efficiently transformed with plasmid vectors using electroporation (10 to 100 thousand times) than other strains of this species. Therefore, M. smegmatis MC2 155 has been developed as a very attractive model organism for research on M. tuberculosis and other mycobacterial pathogens in the laboratory, including genetic analyses and investigations of cholesterol catabolism.
Uhía et al. found that 89 M. smegmatis genes were up-regulated at least three fold when cells were grown on cholesterol compared with that growing on glycerol by using microarray [27], and 39 of the catabolic genes were organized into three specific clusters. However, there is only one study done in M. smegmatis and microarrays show some limitations on throughput and noise ratios [28]. A more analysis is urgently needed to investigate the genome-wide cholesterol response in this model bacterium. The inception of RNA-sequencing technology (RNA-Seq) in 2005 provides a new method to uncover transcriptomic data with a much higher throughput than previous technology [29]. It shows major advantages in robustness, resolution and inter-lab portability over several microarray platforms [30]. In the current study, M. smegmatis strain MC2 155 was cultured in chemically defined media supplemented with androstenedione, cholesterol or glycerol. Total RNAs were extracted from three corresponding samples and submitted to next-generation sequencing (NGS) platform for RNA-Seq study. The global expression patterns were carefully analyzed to characterize the genome-wide cholesterol response, and also whether androstenedione, a derivative of cholesterol, can stimulate the same response.

2. Results

2.1. RNA Sequencing and Global Expression Patterns

To analyze the response to different supplemental carbon sources, M. smegmatis MC2 155 cultures grown in liquid minimal media supplemented with androstenedione (AD), cholesterol (CHOL) or glycerol (GL) were collected for RNA-Seq. A total of 1.41 giga base pairs (Gb) of paired-end (PE) 90 bp clean reads were obtained from the three sequenced samples (Table 1). The clean reads data are deposited in NCBI’s Sequence Read Archive (SRA) under the accession numbers of SRR1976255, SRR1976286 and SRR1976288. All reads were aligned to the M. smegmatis MC2 155 genome sequence with Bowtie2 (v2.2.3) [31,32]. Based on the mapping results, the number of mapped reads was calculated and then normalized for genome-wide gene expression profiling. Gene annotations and expression level data for each gene were combined and used for the following analyses. The results showed that 3, 237 and 8 genes were specifically expressed in AD, CHOL and GL (Figure 1, Table S1). The 3 AD-specific genes were all annotated as hypothetical protein encoding genes, whereas the 8 GL-specific genes included seven hypothetical proteins and a rubredoxin encoding gene. GO (Gene Ontology, http://geneontology.org/) classification results showed that 21 genes specifically expressed in CHOL were involved in primary metabolic processes and 15 were involved in nitrogen compound metabolic process. These results indicated that almost all of the genes expressed in androstenedione or glycerol supplemented media were also expressed in cholesterol supplemented media, and that many more genes were induced in cholesterol supplemented media than the other two media.

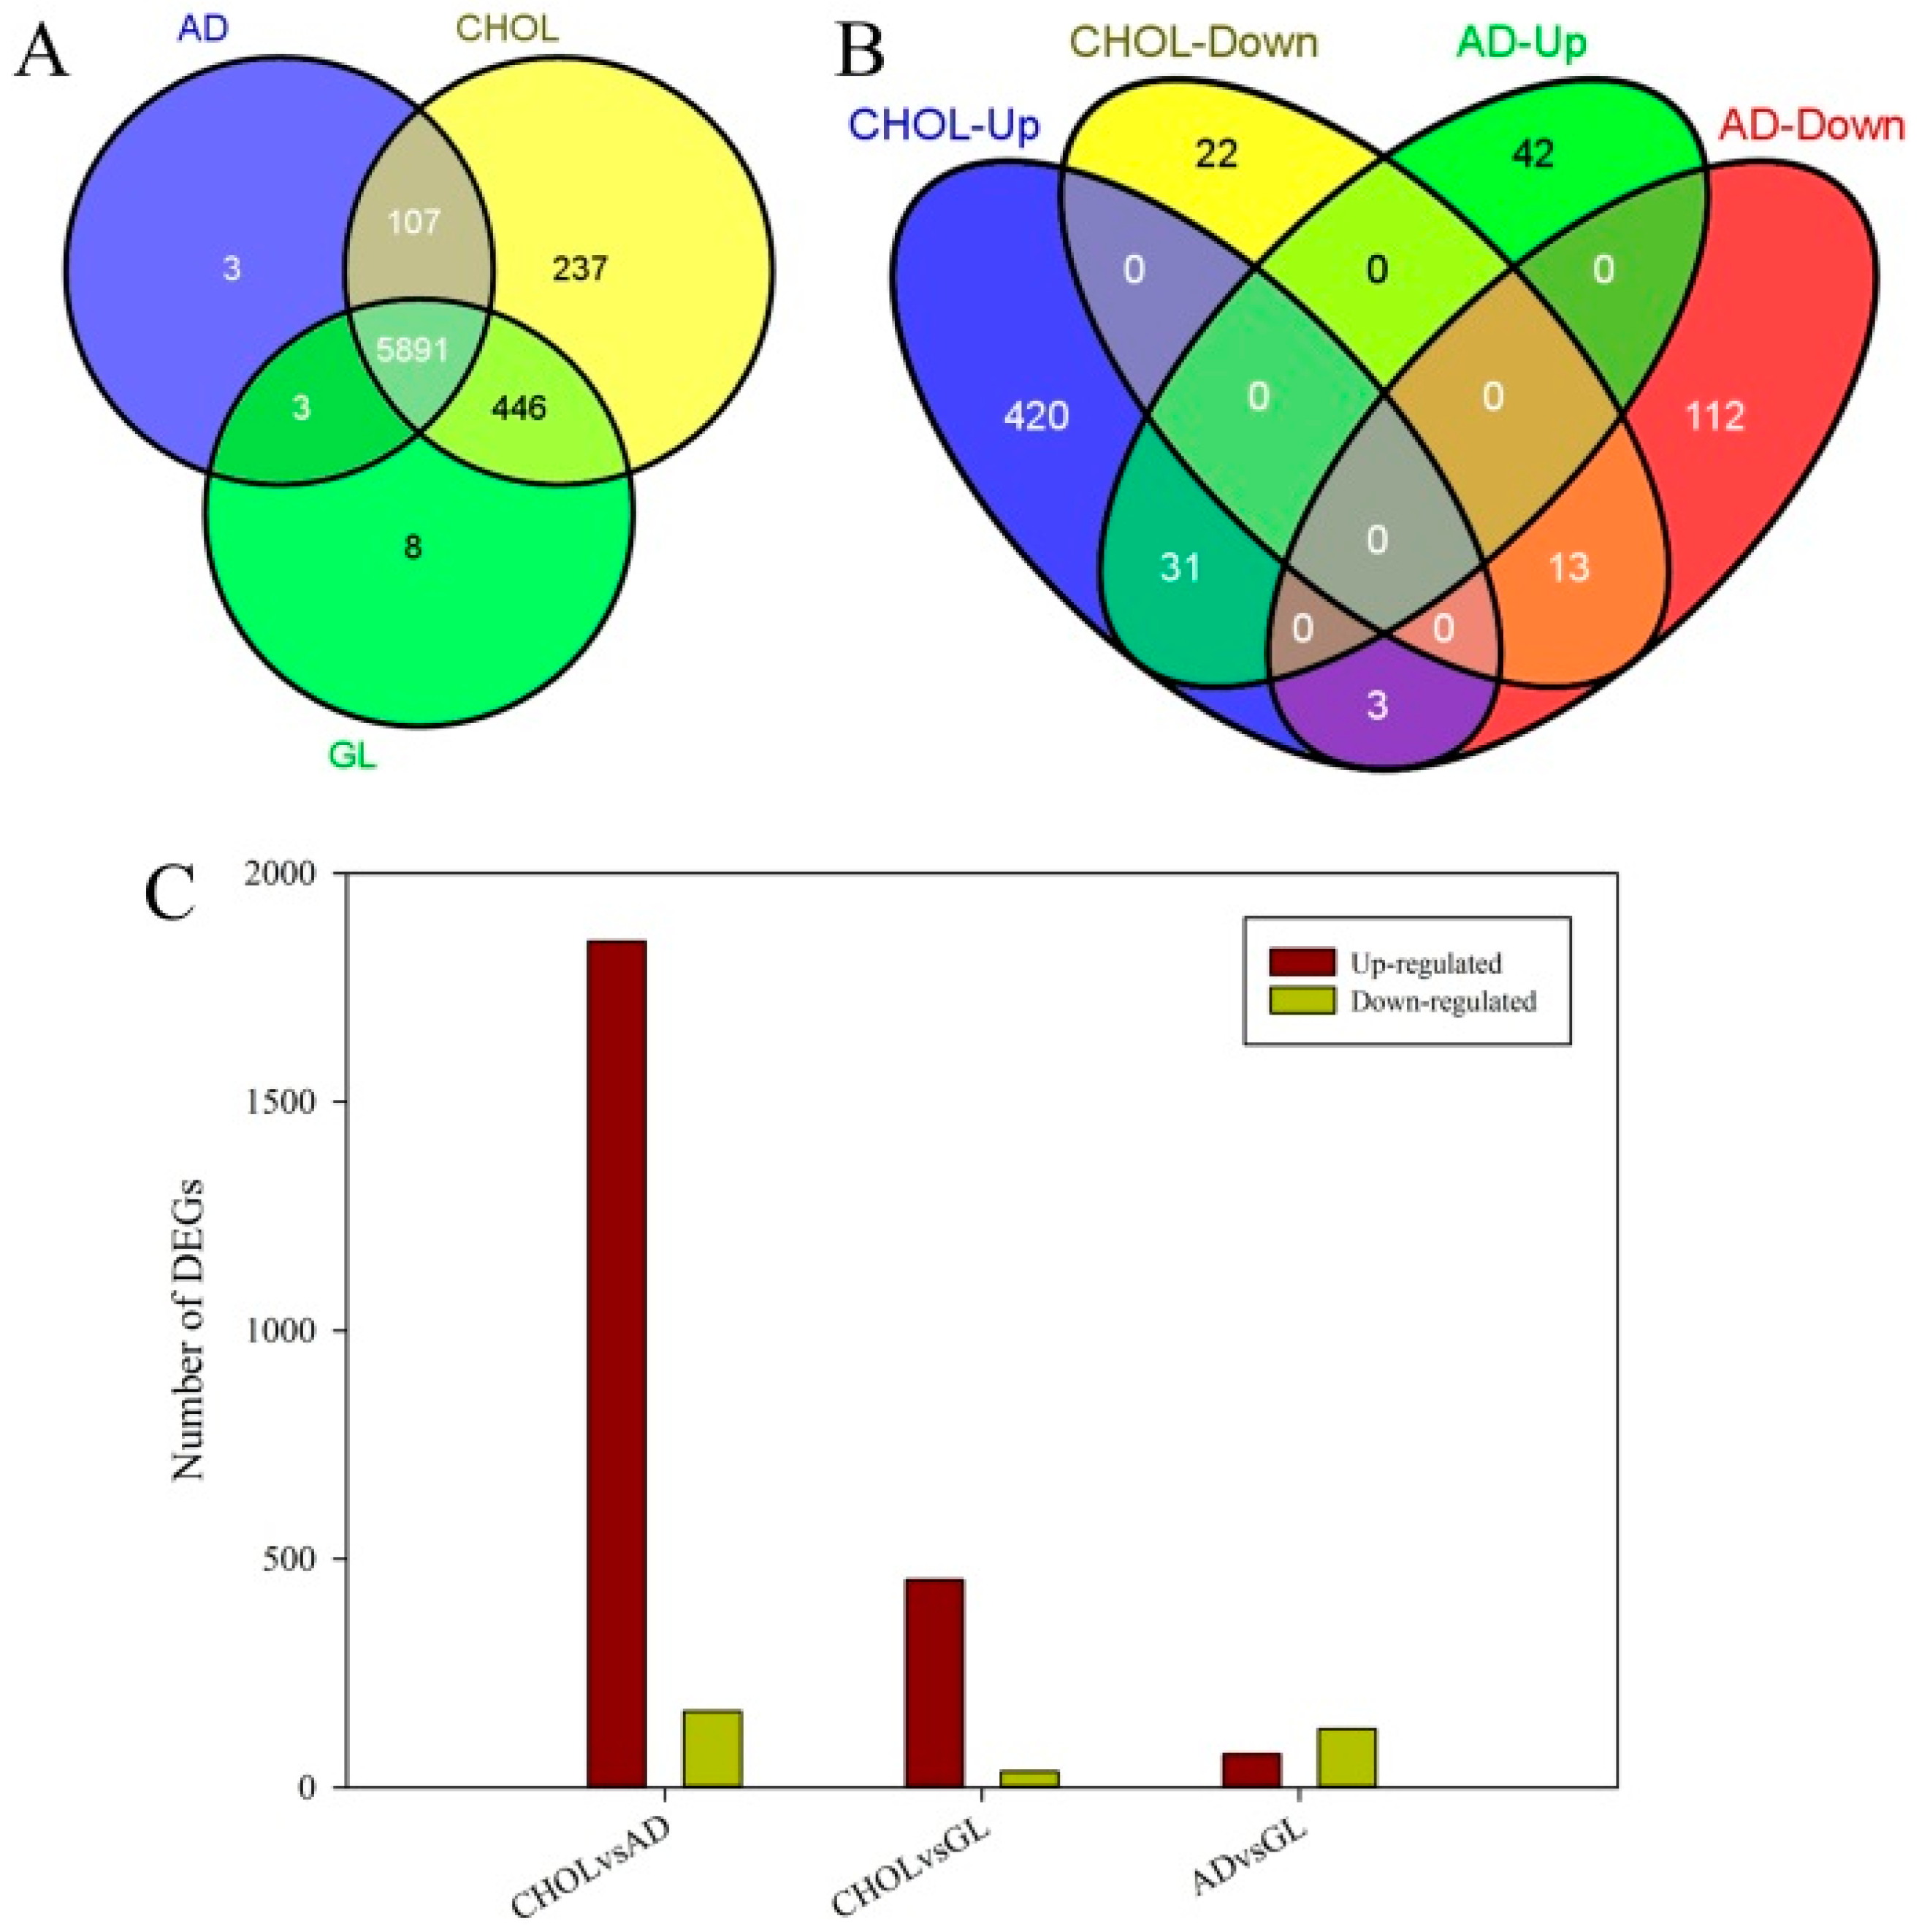
2.2. Differentially Expressed Genes and Functional Enrichment Analyses

To compare the expression patterns between each pairs of conditions, differentially expressed genes (DEGs) with log2 fold-change (log2FC) ≥1 and False Discovery Rate (FDR) ≤0.05 were identified pair-wisely by edgeR [34]. Results showed that 2019, 489 and 201 DEGs were identified in three comparisons, respectively (Figure 1, Table S2–S4). Compared with AD and GL, a total of 1852 and 454 DEGs were significantly up-regulated in CHOL. Moreover, regardless of the FDR value, a total of 2102 and 1695 genes were up-regulated at least two fold in CHOL when compared with AD and GL, respectively. Among the 1852 significantly up-regulated DEGs, 270 genes were involved in nitrogen compound metabolic processes, 170, 224, 203, 145 and 144 DEGs had oxidoreductase, transferase, hydrolase, nucleic acid binding and ion binding activity, respectively. When compared together, cholesterol appeared to up regulate many more genes than its derivative, androstenedione (Figure 1). A total of 420 genes were up-regulated by cholesterol specifically (CHOL-Up). Most of the CHOL-Up genes were up-regulated by CHOL specifically, including several cholesterol metabolism related genes and some mammalian cell entry related genes (explained further below).
To identify the enriched GO terms, a hypergeometric test was performed and the p-value was adjusted using the Bonferroni method [35]. DEGs identified between AD and CHOL were enriched in the GO term “regulation of response to stimulus”, whereas those identified between CHOL and GL were enriched in “tetrapyrrole binding and oxidoreductase activity”.
To verify the reliability of the RNA-Seq data, we repeated the bacterial cultivation and treatment, re-sampled three biological replicates and confirmed the data by qRT-PCR. qRT-PCR were performed using Ssofast Evagreen supermix (BIO-RAD, Hercules, CA, USA) on a CFX Connect Real-time PCR detection system (BIO-RAD) according to the user manual. A total of 52 genes were selected for qRT-PCR analyses, and 50 fragments were successfully amplified (Table S5, Figure S1). The results demonstrated that most of these genes showed changes consistent with the RNA-Seq data, confirming that the NGS based expression profiling gave reliable expression data in this study.

2.3. Nitrogen and Carbon Metabolism Related Genes

To detect whether the supplemented carbon source changed basic nitrogen and carbon metabolism, key genes involved in nitrogen and carbon metabolism were carefully analyzed. The assimilation and metabolism of inorganic nitrogen is a complex process involving a series of enzymes, including nitrate reductase (NR, EC:1.7.99.4), nitrite reductase (NiR, EC:1.7.1.4), glutamine synthetase (GS, EC:6.3.1.2), glutamate synthase (GOGAT, EC:1.4.1.13/1.4.1.14/1.4.7.1), glutamate dehydrogenase (GDH, EC:1.4.1.2/1.4.1.3/1.4.1.4), carbamoyl phosphate synthase (CPS, EC:6.3.4.16) et al. [36,37]. In this study, M. smegmatis strain MC2 155 was grown in chemically defined medium with ammonia-nitrogen as the sole nitrogen source, therefore, the assimilation of ammonia-nitrogen is necessary for maintaining basic metabolism. Three ammonium transporter (AMT) encoding genes were analyzed carefully (Table 2). MSMEG_4635 was the most highly expressed AMT, and its expression abundance under different culture conditions was not obviously different between the samples (22.86, 28.85 and 28.80). The absorbed ammonium can be then converted into nitrite by ammonia monooxygenase (EC:1.14.99.39) and hydroxylamine dehydrogenase (EC:1.7.2.6), and then converted into nitrate by NR. However, we could not identify ammonia monooxygenase and hydroxylamine dehydrogenase encoding genes in our RNA-Seq data. Five NR encoding genes were detected and were all highly expressed (Table 2 and Table S1). Among these genes, MSMEG_2837 was most highly expressed in AD, followed by GL and CHOL, while MSMEG_5140 and MSMEG_5139 were most highly expressed in CHOL. The absorbed ammonium can be also catalyzed by CPS, GS and GOGAT to produce carbamoyl phosphate and l-Glutamine. Three CPS encoding genes were all highly expressed in CHOL. Meanwhile, the most highly expressed GS (MSMEG_4294) had expression levels of 3744.30, 990.23 and 1818.46 under the three conditions, whereas the other two highly expressed GS genes (MSMEG_3561 and MSMEG_4290) were both most highly expressed in GL. In contrast to the expression pattern of MSMEG_4294, the two most highly expressed GOGATs, MSMEG_3225 and MSMEG_3226, were both up-regulated by GL, while the other four were all more highly expressed in CHOL. GDH catalyzes the reversible reaction between ammonium and l-Glutamine. However, no obvious difference was observed under different conditions for the most highly expressed GDH encoding gene (MSMEG_4699). Furthermore, key enzymes encoding genes involved in glycolysis and the citrate cycle were carefully analyzed, including the hexokinase (HXK, EC:2.7.1.1), 6-phosphofructokinase (PFK, EC:2.7.1.11), pyruvate kinase (PK, EC:2.7.1.40), citrate synthase (CS, EC:2.3.3.1), isocitrate dehydrogenase (IDH, EC:1.1.1.41), alpha-ketoglutarate decarboxylase (KGD, EC:1.2.4.2) and dihydrolipoamide dehydrogenase (DLD, EC:1.8.1.4). Results demonstrated that there were no apparent tendency was observed among three different conditions (Table S1). These results indicated that although different supplements resulted in some changes in gene expression, primary metabolism was not obviously affected. To verify these results, we measured the optical density (OD) value at different time points for three cultivation conditions. It was found that M. smegmatis MC2 155 showed an S-shaped growth curve in the three different supplemented media (Figure 2).

2.4. Glycerol and Androstenedione Metabolism

Glycerol kinase (EC:2.7.1.30) plays a critical role in glycerol metabolism by converting glycerol to glycerol 3-phosphate in an ATP dependent reaction [38]. In this study, we found that three glycerol kinase genes were expressed (Table S1). MSMEG_6229 was highly expressed under the three different culture conditions, whereas MSMEG_6756 was expressed at a lower level. MSMEG_6759 had low expression levels in AD (25.14) and CHOL (8.36), but was significantly up-regulated in GL (456.85). A total of five glycerol-3-phosphate dehydrogenase genes were expressed in this study, and three were highly expressed in all conditions (MSMEG_1736, MSMEG_1140 and MSMEG_2393), while MSMEG_6761 was up-regulated in GL when compared with the other conditions.
Glycerol dehydratase (EC:4.2.1.30) is the rate-limiting enzyme involved in 3-hydroxypropionic acid biosynthesis and glycerol can suppress the activity of glycerol dehydratase [39,40]. Three glycerol dehydratase large subunit encoding genes were identified in our data set (Table S1). MSMEG_6321 and MSMEG_0497 had the highest expression level in CHOL, whereas MSMEG_1547 was highly expressed in all three conditions. However, no glycerol dehydratase medium subunit gene was detected in this study. Four 3-ketosteroid-δ-1-dehydrogenase (EC:1.3.99.4) encoding genes, which are involved in the degradation of androstenedione, were all most highly expressed in CHOL.

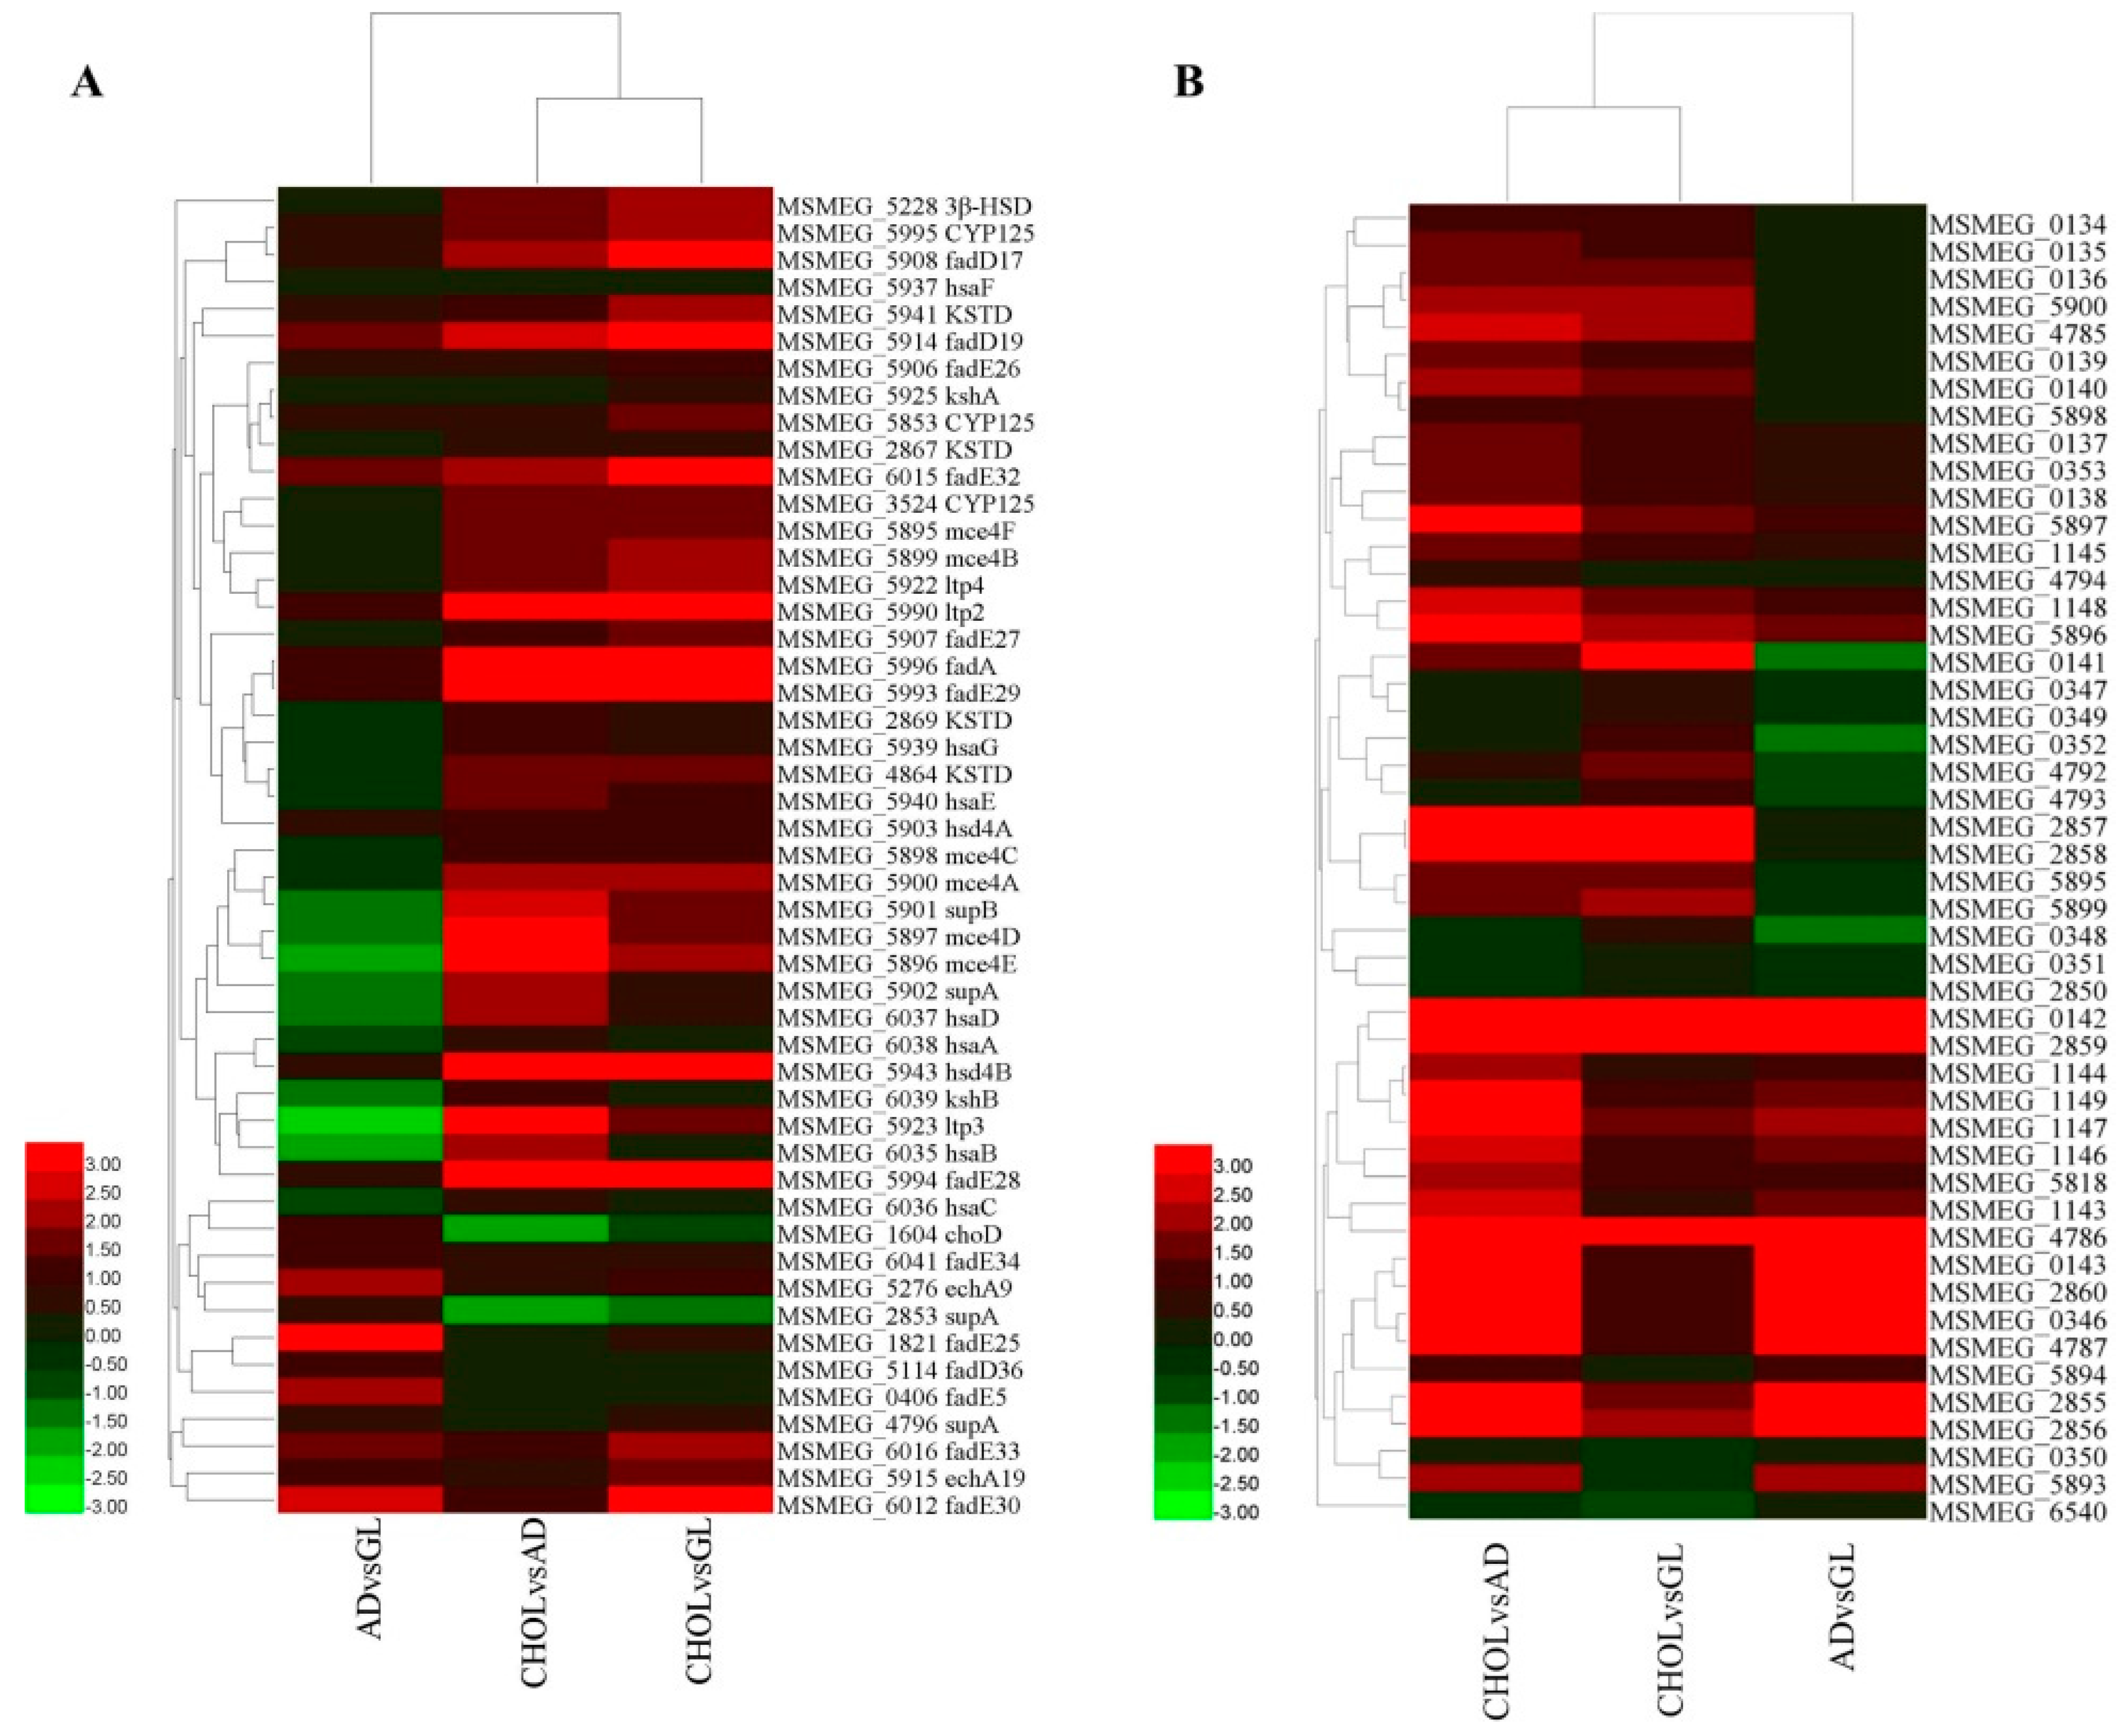
2.5. Cholesterol Metabolism Related Genes

In the classic cholesterol catabolism pathway, degradation is initiated by 3-beta hydroxysteroid dehydrogenase/isomerase (3β-HSD) and cholest-4-en-3-one 26-monooxygenase (CYP125, EC:1.14.13.141). In this study, one 3β-HSD encoding gene was found to be expressed (MSMEG_5228). When M. smegmatis was grown in cholesterol supplemented media, 3β-HSD was significantly up-regulated, and its expression level was 6.86, 26.34 and 5.96 in AD, CHOL and GL, respectively (Table S6). Three CYP125 encoding genes were detected and all had the highest expression levels in CHOL (MSMEG_3524, MSMEG_5853 and MSMEG_5995) (Figure 3, Table S6). The 3-ketosteroid-δ-1-dehydrogenase (KSTD, EC:1.3.99.4) can catalyze the conversion of androstenedione into androsta-1,4-diene-3,17-dione. When growth media were supplemented with androstenedione or cholesterol M. smegmatis strain MC2 155 increased the expression of several KSTD genes (MSMEG_2867, MSMEG_2869, MSMEG_4864 and MSMEG_5941) (Figure 3, Table S6). For example, the expression level of MSMEG_5941 was 20.86 in GL, but in androstenedione and cholesterol supplemented media, it was 41.15 and 115.42, respectively. MSMEG_2867 is another KSTD encoding gene that had an expression level of 25.14, 35.54 and 17.88 in AD, CHOL and GL, respectively. 3-Ketosteroid 9-α-hydroxylase (KshAB, EC:1.14.13.142), 3-hydroxy-9,10-secoandrosta-1,3,5(10)-triene-9,17-dione monooxygenase (HsaAB, EC:1.14.14.12), 3,4-dihydroxy-9,10-secoandrosta-1,3,5(10)-triene-9,17-dione 4,5-dioxygenase (HsaC, EC:1.13.11.25) and 4,5:9,10-diseco-3-hydroxy-5,9,17-trioxoandrosta-1(10), 2-diene-4-oate hydrolase (HsaD, EC:3.7.1.17) are the downstream enzymes involved in steroid degradation. However, all of these enzyme encoding genes were not detected based on the annotation information in the genome.
A recent study showed that a gene cluster is involved in the cholesterol catabolism [10], including KshAB, HsaA, HsaB, HsaC and HsaD genes mentioned above. In this study, these genes were firstly extracted from the genome of M. tuberculosis H37Rv and then used as a search query in a sequence similarity BLAST search against the deduced proteome of M. smegmatis MC2 155. A total of 26 homologous genes were successfully identified corresponding to 24 H37Rv genes (Figure 3, Table S6), including kasAB and hasA/B/C/D, which were not previously identified based on the annotation information present in the genome. Expression profiling showed that 24 of these 26 homologous genes were most highly expressed in CHOL, except choD and one of the three supA genes. Moreover, a MCE4 gene cluster was identified as being involved in cholesterol catabolism and was significantly up-regulated in the cholesterol supplemented sample. Compared with AD, these MCE4 cluster genes were up-regulated at least 2.72-fold, whereas that was 2.19-fold when compared with GL. Griffin et al. used high-resolution phenotypic profiling to reveal genes essential for growth with cholesterol in M. tuberculosis [41], including the genes involved in the catabolism of the side-chain and several other essential genes. Besides CYP125, a total of 15 side-chain degradation related genes were also identified in this study based on BLAST similarity search (Table S6), and most of them were most highly expressed in cholesterol supplemented media, except fadD36, fadE5, fadE25, fadE34 and echA9. In contrast to the report of Griffin et al., hsd4B of M. smegmatis MC2 155 was successfully detected and significantly up-regulated by cholesterol (18.29, 87.82 and 27.81 in AD, CHOL and GL). Sixty other genes, corresponding to 53 essential genes for growth on cholesterol listed by Griffin et al., were carefully analyzed. However, most of these did not show obvious differences among the three growth conditions (or were not up-regulated by cholesterol).

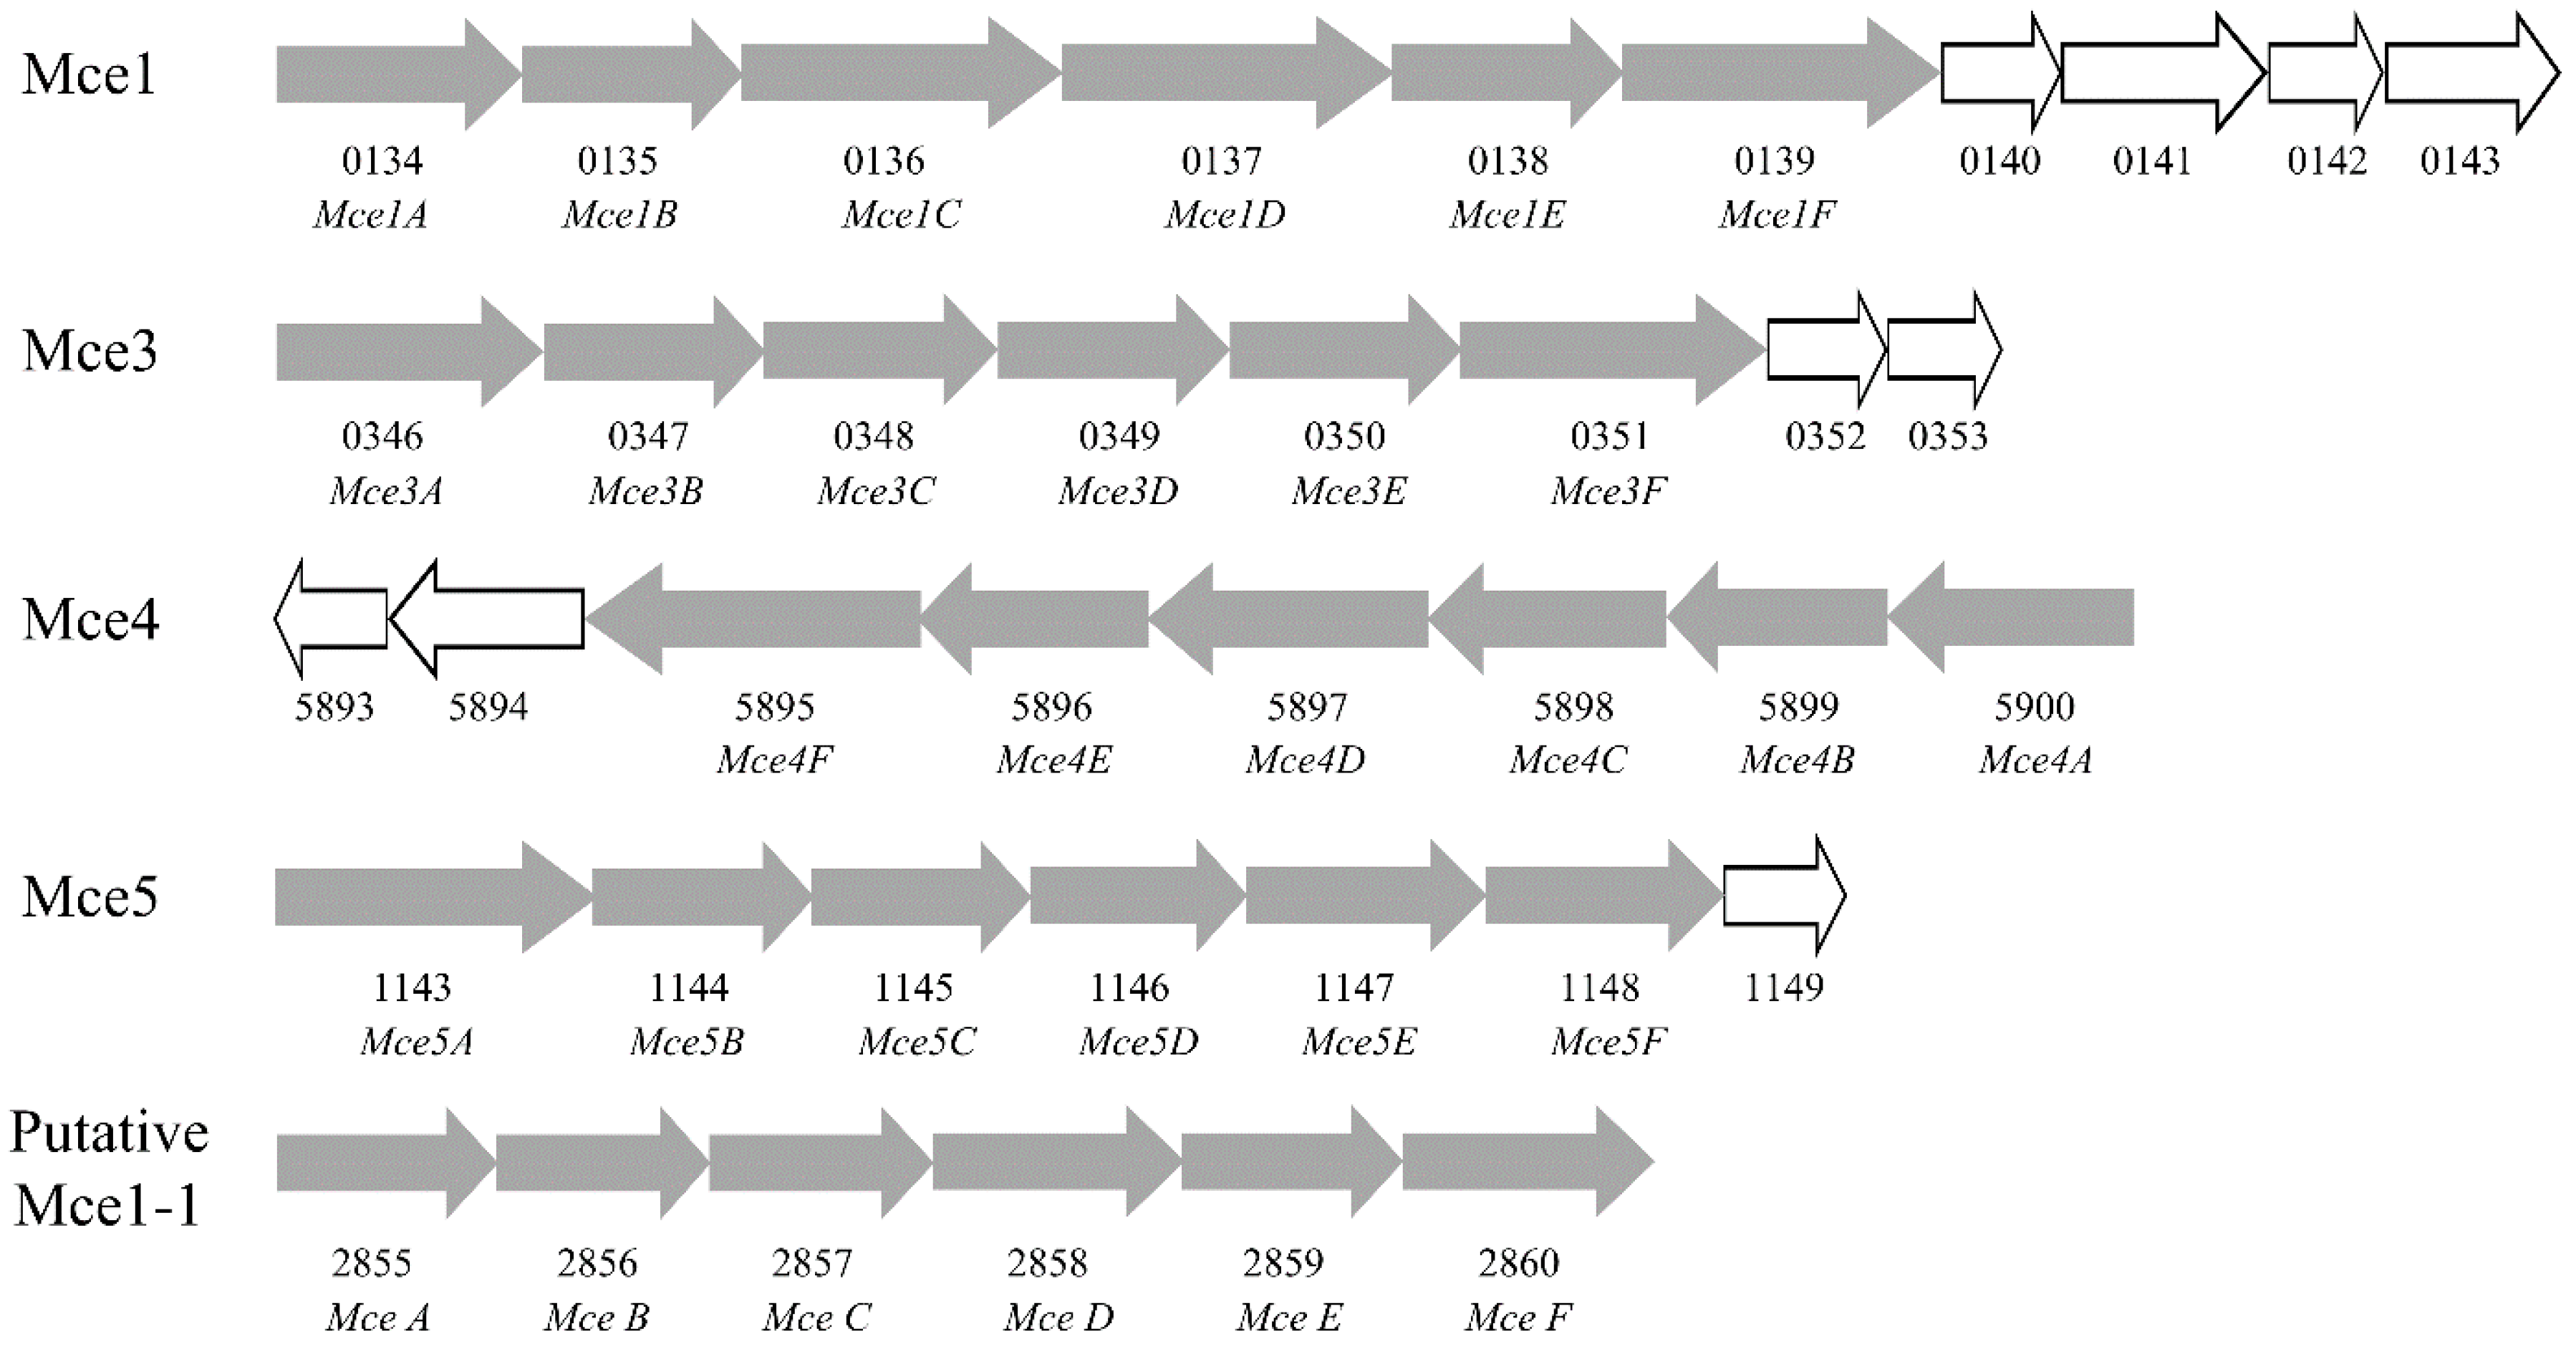
2.6. Mammalian Cell Entry Related Genes

Mammalian cell entry (MCE) is a protein family that is crucial for virulence of certain members of the genus Mycobacterium, which enables mycobacteria to derive carbon and energy from the cholesterol of host cell membranes and to enter mammalian cells [42]. In this study, 48 MCE related genes were detected. Combining the genome annotation results with the BLASTP similarity search results, a total of 11 MCE1, one MCE2, six MCE3, six MCE4 and six MCE5 genes were identified. To further analyze these MCE related genes, a phylogenetic tree was constructed using the Neighbor-Joining method in the MEGA6 program [43] (Figure 4). It was shown that the 48 MCE related genes can be clustered into seven groups, including group A–F, as well as an additional group (Figure 4, Table S7). The A group consisted of nine MCE A genes, B, C and D group had six MCE B, MCE C and MCE D separately, E and F group consisted of 12 and seven genes. The additional group (S) consisted of MSMEG_2850 and MSMEG_1147, which were annotated as MCE5E and MCE related family protein, respectively (Figure 4, Table S7).
Expression analyses showed that 43 of the 48 MCE related genes were most highly expressed in CHOL, whereas 11 of the 48 MCE genes were not expressed in AD, including the genes encoded by putative MCE1 operon. Forty-six MCE related genes were expressed in GL, and most of these had higher expression levels than in AD (Figure 4, Table S7). MSMEG_2857 and MSMEG_2858 were specifically expressed in CHOL, with an expression level of 12.55 and 12.96, respectively. According to the M. smegmatis MC2 155 genome annotation, MSMEG_2857 and MSMEG_2858 are both annotated as virulence factor MCE family proteins, but the phylogenetic analysis showed that they were separately clustered into groups C and D. The location of the 48 genes demonstrated that there are at least five MCE operons, including MCE1, MCE3, MCE4, MCE5 and a putative MCE1 operon (Figure 5). Apart from MCE4, all other operons were encoded on the plus strand. The expression levels of MSMEG_0134 to MSMEG_0139, which encode MCE1A to MCE1F, were all higher than 800 in CHOL (Table S7), indicating that the corresponding MCE1 operon should be dominant. According to the present RNA-Seq data, the expression values of the MCE4ABCDEF encoding genes (MSMEG_5900, MSMEG_5899, MSMEG_5898, MSMEG_5897, MSMEG_5896, and MSMEG_5895) were at a basal level in GL and AD (Table S7), and were up-regulated by cholesterol. The different expression levels of these operons reflected their different roles.

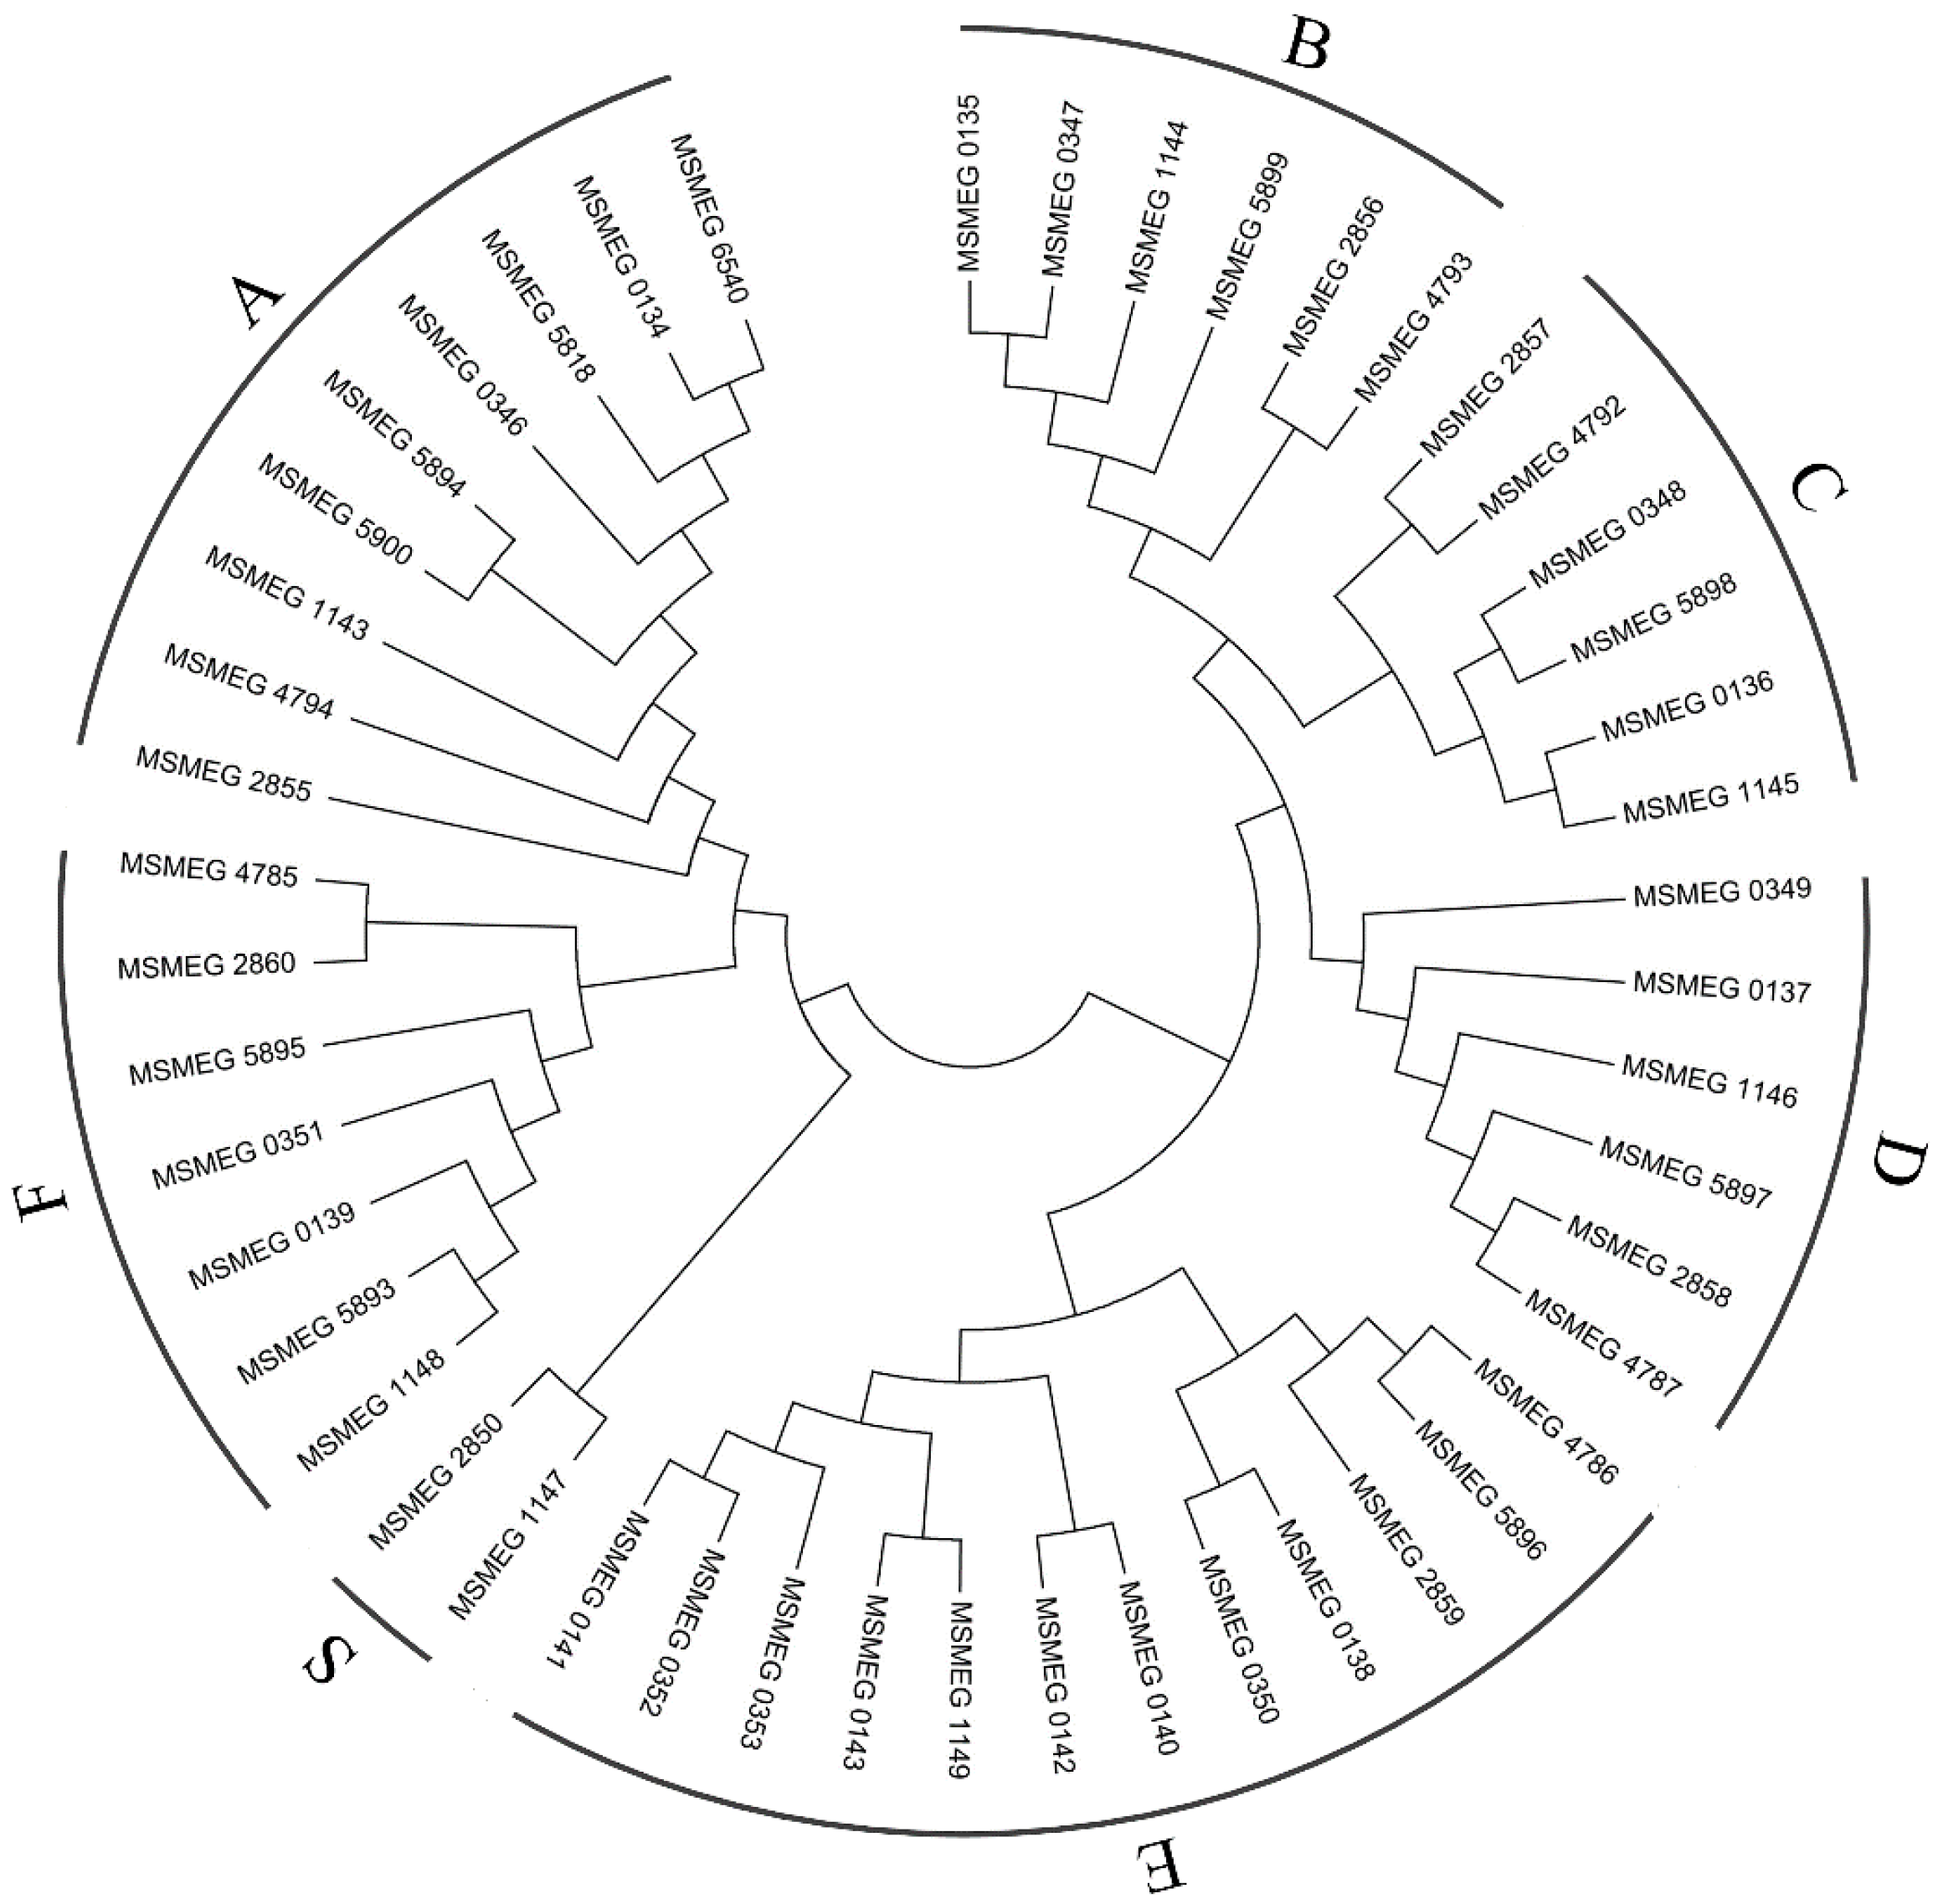
2.7. Gene Clusters Induced by Cholesterol

Uhía et al. [27] described three gene clusters in M. smegmatis MC2 155 that were induced by cholesterol when compared with glycerol. In this study, these gene clusters, including cluster 1 (MSMEG_59906017), cluster 2 (MSMEG_60336043) and cluster 3 (MSMEG_59035943), were also analyzed and most of these genes were up-regulated by cholesterol compared with that in glycerol supplemented medium. Moreover, most of these genes were also up-regulated by cholesterol when compared with androstenedione, the derivative of cholesterol (Table S1). As they have greater throughput, RNA-Seq methods can quantify more genes than microarray technology [30]. With threshold of log2FC ≥ 1, it was found that another eight gene clusters were induced by cholesterol when compared with glycerol, and another 13 gene clusters were induced by cholesterol compared with androstenedione (Table 3). The gene clusters MSMEG_01320144, MSMEG_1141–1150, MSMEG_2854–2865 and MSMEG_4414–4427 were induced by cholesterol when compared with either androstenedione or glycerol. Results showed that the four clusters all encoded MCE related genes. MSMEG_05000518 was found to encode several proteins related to carbohydrate metabolism, MSMEG_06380649 encodes several transporters, and MSMEG_1435–1448 encodes several ribosomal proteins.

3. Discussion

3.1. Genome-Wide Transcriptome Changes Response to Different Supplements

Uhía et al. found that 89 M. smegmatis genes were up-regulated at least three fold during growth on cholesterol compared with growth on glycerol by using microarray [27]. Microarray usually show limitations on throughput, while RNA-Seq has been proved to be a cost effective technology to characterize genome-wide transcription and has been widely used since its inception in 2005 [29,44,45]. Recently, RNA-Seq technology has also been used to detect the nitrogen limitation response and the GlnR regulon in M. smegmatis [46]. However, no systematic analysis has been performed to investigate the genome-wide cholesterol response in this model bacterium by using RNA-Seq technology. In this study, Illumina sequencing was employed to comprehensively reveal the cholesterol response in M. smegmatis MC2 155. Expression patterns of genes related to nitrogen and carbon metabolism were carefully analyzed, and although occasional changes were detected, no apparent tendency can be observed among three samples (Table S1). Moreover, M. smegmatis MC2 155 showed an S-shaped growth curve in androstenedione, cholesterol and glycerol supplemented media (Figure 2). These results suggested that M. smegmatis MC2 155 grew well in minimal medium with different supplements. Differential expression analyses showed that a total of 1852 and 454 genes were significantly up-regulated by cholesterol when compared with androstenedione and glycerol, respectively, and 237 genes were specifically expressed in cholesterol supplemented medium. The majority of genes in the three cholesterol induced clusters described by Uhía et al. [27] were also up-regulated by cholesterol, when compared with that in glycerol or androstenedione supplemented media. Besides, a total of 13 and eight new clusters were found to be induced by cholesterol when compared with the other two supplements, respectively (Table 3). These observations above showed that cholesterol up-regulated and induced a large number of genes, but androstenedione did not stimulate the same response. The gene clusters identified in this study should provide a new resource for further studies focusing on cholesterol metabolism.
The minimal medium used in this study contained all macroelements, including carbon, nitrogen, phosphorus, sulphur and magnesium, among others, which are sufficient to maintain basic metabolism and growth. With different molecular structure and a different number of carbon atoms, supplementation with androstenedione, glycerol and cholesterol modified the expression patterns of several genes or some genes involved in special metabolic pathways, such as glycerol, androstenedione and cholesterol metabolism (Figure 4, Table S1).

3.2. Cholesterol Catabolism and Mammalian Cell Entry Related Genes

Tak [47] and Turfitt [48] confirmed that mycobacteria are able to decompose cholesterol and that some mycobacteria can grow in medium with cholesterol as sole carbon source. Mycobacteria use different parts of the cholesterol molecule for energy and the biosynthesis of phthiocerol dimycocerosate (PDIM) [6]. MCE is a key gene family involved in this metabolic process and has been shown to be critical for the survival of M. tuberculosis in the macrophage [9,10]. It is a highly conserved gene family, which is widely distributed in the genus of Mycobacterium, including the non-pathogenic mycobacteria M. smegmatis [41,49]. Different from M. tuberculosis [6], 48 MCE genes were found to be distributed in at least five MCE operons in the genome of M. smegmatis MC2 155 (Figure 5). For each operon, at least six core genes (MCE A-F) were found to be expressed. However, MSMEG_4785, MSMEG_4786, MSMEG_4787, MSMEG_4792, MSMEG_4793 and MSMEG_4794 may be encoded by another operon, although MSMEG_4788, MSMEG_4789, MSMEG_4790 and MSMEG_4791 are annotated as non-MCE protein encoding genes. The 48 MCE genes were all expressed in cholesterol supplemented medium, and almost all of these MCE genes were up-regulated by cholesterol when compared with the other supplements (Figure 4). Particularly, the putative MCE1 operon encoded six genes were not expressed in androstenedione supplemented medium. Among the different MCE operons, the MCE4 operon has been characterized as an efficient cholesterol uptake system [6,12]. In M. tuberculosis, proteins encoded by these genes are implicated in the interaction of this pathogen with its human host. Therefore, the increased expression of the MCE4 operon in this study may allow more cholesterol to be transported into the cell and promote the expression of other MCE related genes. In Gordonia neofelifaecis, genes in the MCE4 operon showed low differential expression in cholesterol supplemented medium [50]. But in this study, the MCE4 genes were significantly up-regulated in cholesterol (more than 2-fold), and this was confirmed by quantitative real-time PCR (qRT-PCR).
MCE1 is considered to be involved in the import of fatty acids, but its role is still controversial, as the precise substrate transported by the MCE1 proteins and the contribution of this transporter to intracellular growth are still poorly understood. Several groups have investigated the expression of the MCE1 operon, and the results obtained by different groups are conflicting. Quantitative reverse transcriptase PCR analyses conduct by Casali et al. revealed that the MCE1 genes in M. tuberculosis are expressed during in vitro growth, but are significantly down-regulated in intracellular bacilli isolated from murine macrophages [51], and Kumar reported that the MCE1 operon is up-regulated in bacilli isolated from both mouse and rabbit lungs [52]. In this study, MCE1A, B, C, D, E, F and a putative MCE1 operon encoding genes were found to be up-regulated by cholesterol compared with the other two culture conditions. As a derivative of cholesterol without alkyl side-chain, androstenedione shares its ring A and B structure with cholesterol. However, androstenedione did not improve the expression of MCE1 genes. This can be partially explained by the lack of an efficient uptake system for androstenedione, as the MCE4 system can only recognize a side-chain with at least eight carbons [12]. Consequently, these results indicated that ring C and D or the aliphatic chain of cholesterol (that did not exist in androstenedione molecular structure) may play a crucial role in promoting the expression of these MCE genes. The alkyl side chain is degraded by a process similar to the β-oxidation of fatty acids and proceeds via CoA thioester intermediates. The absorbed cholesterol would then serve as a source of propionate in vivo and results in a sufficient intracellular pool of propionate to increase methyl-branched fatty acid biosynthesis [53].
Previous studies have found that 41 of the cholesterol degradation pathway genes of M. tuberculosis, including genes involved in the uptake system, catabolism initiation and catabolism of rings A/B/C/D, are among those specifically up-regulated during survival in the macrophage [10,54]. The majority of these genes were also identified in our M. smegmatis MC2 155 RNA-Seq data and were found to be up-regulated (except choD and one of the three supA gene) in cholesterol supplemented media when compared with the other supplements (Figure 4, Table S6). ChoD is reported to be involved in the initiation of cholesterol catabolism, and may act extracellularly or be associated with the cell-surface in some Mycobacterium strains [14,15]. The low expression level of choD in cholesterol supplemented medium may be due to choD being non-essential for growth in cholesterol for M. smegmatis MC2 155, as has been shown for M. tuberculosis H37Rv [41]. In fact, it has been demonstrated that choD found in some Mycobacteria does not play role in cholesterol degradation [41,55]. When grown in androstenedione supplemented medium, choD was highly expressed, indicating that choD may be involved in the initiation of the extracellular catabolism of androstenedione. However, this hypothesis requires further investigation. The other gene involved in the initiation of cholesterol catabolism, 3β-HSDs [56], was up-regulated by cholesterol, suggesting that the catabolism initiation can be catalyzed by 3β-HSDs in M. smegmatis MC2 155. However, genes involved in the degradation of rings A and B, including those that encode KstD, KshAB, HsaA, HsaB, HsaC and HsaD [2,57,58,59,60,61], were not up-regulated by androstenedione when compared with that in glycerol supplemented medium. This can also be partially explained by the lack of an efficient uptake system for androstenedione. In the study of Brzostek et al. in 2005 [22], a total of six putative KstD genes were described. However, all of these gene ID (MSMEG_2871, 2873, 4850, 4855, 5801, 5898) are no longer annotated as KstD in the improved genome annotation, but are annotated as a hypothetical protein, hypothetical protein, short-chain dehydrogenase/reductase (SDR), amidohydrolase, hydroxylase and virulence factor MCE family protein, respectively, which should be the results of improvement of genome annotation. According to the DEGs analyses, steroid-degrading genes showed a low differential expression in androstenedione supplemented medium compared with glycerol. Literatures showed that a TetR-type transcriptional repressor named KstR controls the expression of 83 catabolic genes, which might be involved in steroid degradation [62]. It was reported that the inducer of KstR in M. smegmatis MC2 155 is 3-oxo-4-cholestenoic acid, the first metabolic intermediate in cholesterol degradation, which binds KstR and results in up-regulation of steroid-degrading genes [63]. Compared with cholesterol, degradation of androstenedione and glycerol could not produce 3-oxo-4-cholestenoic acid, and this might be the reason that steroid-degrading genes were not up-regulated during growth on androstenedione compared with glycerol (Table S6). In consideration of different molecular structure of cholesterol and androstenedione, these results indicated that the side-chain mediated uptake play crucial role in stimulating the expression of cholesterol degradation related and some other genes. Griffin et al. used high-resolution phenotypic profiling to reveal genes essential for growth in cholesterol in M. tuberculosis [41]. Eighteen side-chain degradation related genes were also identified based on BLAST similarity searches (Table S6). However, some of those genes were not up-regulated by cholesterol in this study. As several degradation reactions can be catalyzed by different enzymes [41], functional redundancy should be the most likely reason. For example, fadD19, 36 are involved in the same reaction, but only fadD19 was up-regulated.
In this study, we did not use biological replicates but tried our best to minimize the sampling deviation by collecting M. smegmatis MC2 155 strains from three culture replicates. To verify the reliability of the RNA-Seq data, we repeated the bacterial cultivation and treatment, re-sampled three biological replicates and confirmed the data with qRT-PCR. Twenty-six of the 32 genes described above had the highest expression level in CHOL (Figure S1). Although there is still a small number of genes whose expression was inconsistent, such as MSMEG_2869, MSMEG_3561, MSMEG_4290, the consistently expressed genes between of the two quantitative technologies proved the trends observed in this study. Therefore, we can conclude that cholesterol increased the expression of most cholesterol degradation and MCE involved genes in M. smegmatis.

4. Materials and Methods

4.1. Bacterial Strains

M. smegmatis MC2 155 is a mutant of M. smegmatis [26]. It is invaluable in analyses of mycobacterial gene function, expression and replication due to its efficiently plasmid transformation rate. The strains used in this study were preserved in our laboratory.

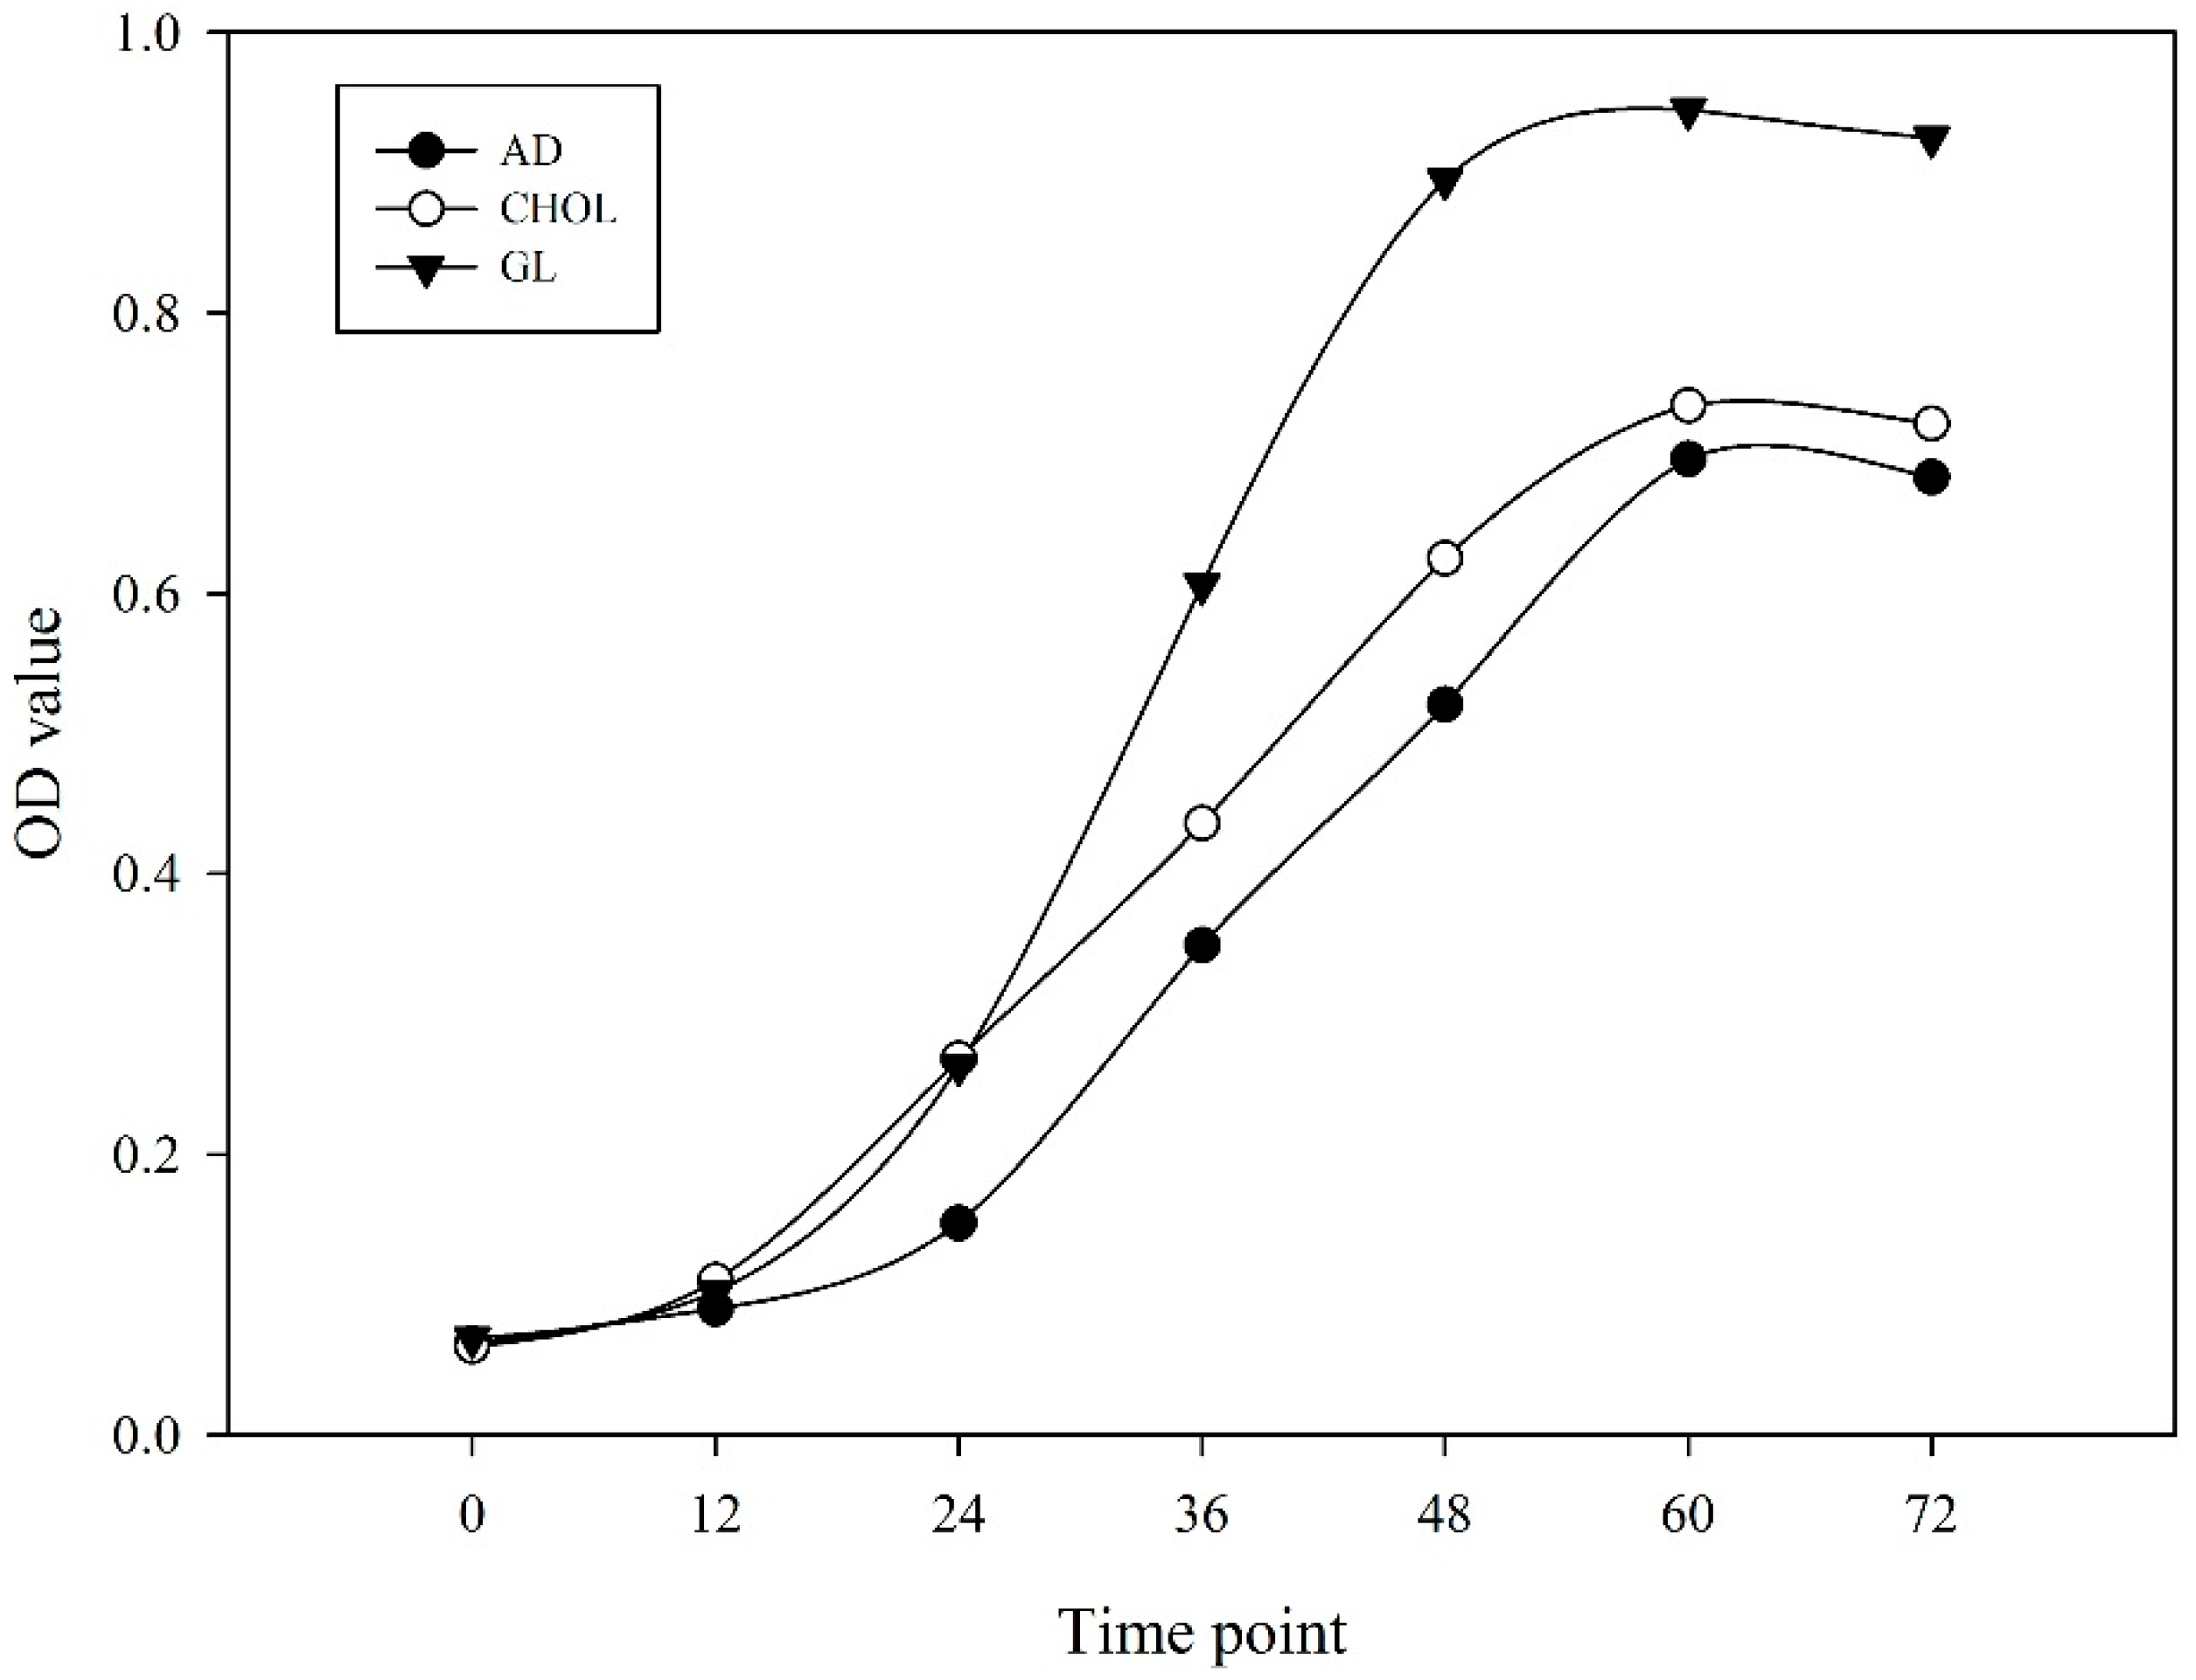
4.2. Bacterial Cultivation and Sampling

M. smegmatis MC2 155 was pre-cultured in 2 mL Luria-Bertan (LB) to OD600 = 1.0, then the cells were centrifuged down, collected and washed twice with minimal medium (1.5 g CH3COONH4, 0.2 g MgSO4·7H2O, 0.4 g K2HPO4, 0.8 g KH2PO4, 5.0 × 10⁻⁴ FeSO4·7H2O, 2.0 × 10⁻⁴ ZnSO4·7H2O, 5.0 × 10⁻⁵ MnCl2·4H2O). The cultures were subsequently divided into three groups: one was grown in 20 mL minimal medium plus with 1.75 mM (0.05%) androstenedione (AD) (Sigma, St. Louis, MO, USA), one in 20 mL minimal medium plus with 1.29 mM (0.05%) cholesterol (CHOL) (Sigma, St. Louis, MO, USA), and one in 20 mL minimal medium plus with 5.47 mM (0.05%) glycerol (GL) (Sigma, St. Louis, MO, USA). For optimum mixing of cholesterol and androstenedione in water, a certain amount of the steroid substrates were firstly mixed with cyclodextrin, and added to 5 mL of solution containing 50% Tween-80, sonicated for 30 min, then added to the minimal medium, and sonicated for a further 30 min. The final medium had a concentration of 0.9 mM cyclodextrin and 0.25% (v/v) Tween-80. The control sample containing glycerol also contained 0.9 mM of cyclodextrin and 0.25% of Tween-80. All of these M. smegmatis MC2 155 were cultivated at 30 °C in an orbital shaker at 180 rpm for 48 h. Three cultures were marked as AD, CHOL and GL.

4.3. RNA Extraction and Library Construction

Total RNA was isolated from M. smegmatis MC2 155 samples with the RNeasy Mini Kit (50) (Qiagen, Hilden, Germany) and then treated with the DNase I RNase-Free DNase Set (Qiagen) to remove genomic DNA contamination according to the manufacture’s protocols. For each sample, M. smegmatis MC2 155 strains were collected from three culture replicates and pooled together following RNA extraction, in order to minimize the sampling deviation. rRNA was removed by Ribo-Zero_rRNA Removal Kit (Epicentre Biotechnologies, Madison, WI, USA). The purity, concentration and RNA integrity number (RIN) were evaluated by Nanodrop ND-2000 (Nanodrop, Wilmington, NC, USA). The qualified mRNA was then fragmented in fragmentation buffer. Taking these short fragments as templates, random hexamer-primers were used to synthesize the first-strand cDNA. The second strands were synthesized using buffer, dNTPs, RNase H and DNA polymerase I. Short fragments were purified with the QiaQuick PCR extraction kit (Qiagen) and resolved with EB buffer for end repair. The short fragments were then ligated to Illumina sequencing adaptors. Fragments with different lengths were separated by agarose gel electrophoresis. The 200 bp cDNAs fragments were purified from a gel and used for the following template enrichment by PCR with two primers that anneal to the end of the sequencing adapters. Quality control analysis of the fragmented cDNA library was performed on an Agilent 2100 Bioanalyzer (Agilent Technologies, Palo Alto, CA, USA).

4.4. RNA Sequencing and Data Analyzing

The validated 200 bp fragment cDNA libraries were submitted to the Illumina Hiseq 2000 platform at Beijing Genome Institute (BGI, Shenzhen, China) to perform transcriptome sequencing. The Illumina sequencing by-synthesis, image analysis and base-calling procedures were used to obtain paired-end (PE) reads and base-calling quality values. The raw reads were cleaned by removing the reads with adapter sequence or excessive “N” bases (more than 10%), as well as low quality reads, for which the percentage of low quality bases is over 20% in a read. PE reads were then mapped to the entire genome of M. smegmatis MC2 155 [64] with Bowtie2 (v2.2.3) allowing no more than 1 mismatche in a read [31,32]. Based on the mapping results, reads mapped to each gene was calculated and used for the following expression profiling. The annotation information of the genome project and the expression value of each gene were combined and then used. The significant differentially expressed genes (DEGs) with log2 fold-change (log2FC) ≥ 1 and FDR ≤ 0.05 were identified between each pair of conditions by edgeR [34]. For each DEGs set, a hypergeometric test was performed and the p-value was adjusted using the Bonferroni method [35]. Compared with the reference genome, significantly enriched GO (Gene Ontology, http://geneontology.org/) terms and KEGG (Kyoto Encyclopedia of Genes and Genomes) [65] pathway were screened with threshold of corrected p-value (padj) ≤0.05.

Supplementary Materials

Supplementary materials can be found at https://www.mdpi.com/1422-0067/17/5/689/s1.

Acknowledgments

This work was supported by National Natural Science Foundation of China (No. 31271332). Sichuan provincial Science & Technology Department (Nos. 2009JY0067, 2012SZ0074), Sichuan provincial Department of Education (No. 13ZA0145), Sichuan Normal University (No. 2013-12).

Author Contributions

Wei Li conceived and designed the project. Qun Li and Fanglan Ge performed the experiments. Qun Li, Fanglan Ge, Yunya Tan, Guangxiang Zhang analyzed the data. Qun Li, Fanglan Ge, and Wei Li wrote the paper. All authors read and approved the final manuscript.

Conflicts of Interest

The authors declare no conflict of interest.

References

  1. Slaytor, M.; Bloch, K. Metabolic transformation of cholestenediols. J. Biol. Chem. 1965, 240, 4598–4602. [Google Scholar] [PubMed]
  2. Van der Geize, R.; Dijkhuizen, L. Harnessing the catabolic diversity of rhodococci for environmental and biotechnological applications. Curr. Opin. Microbiol. 2004, 7, 255–261. [Google Scholar] [CrossRef] [PubMed]
  3. Garcia, J.L.; Uhia, I.; Galan, B. Catabolism and biotechnological applications of cholesterol degrading bacteria. Microb. Biotechnol. 2012, 5, 679–699. [Google Scholar] [CrossRef] [PubMed]
  4. Shepard, C.C. Use of HeLa cells infected with tubercle bacilli for the study of anti-tuberculous drugs. J. Bacteriol. 1957, 73, 494–498. [Google Scholar] [PubMed]
  5. Kress, G. Combining dental training with medical training. J. Dent. Educ. 1995, 59, 1061. [Google Scholar] [PubMed]
  6. Pandey, A.K.; Sassetti, C.M. Mycobacterial persistence requires the utilization of host cholesterol. Proc. Natl. Acad. Sci. USA 2008, 105, 4376–4380. [Google Scholar] [CrossRef] [PubMed]
  7. Turfitt, G. Microbiological agencies in the degradation of steroids: I. The cholesterol-decomposing organisms of soils. J. Bacteriol. 1944, 47, 487. [Google Scholar] [PubMed]
  8. Turfitt, G. The microbiological degradation of steroids: 4. Fission of the steroid molecule. Biochem. J. 1948, 42, 376. [Google Scholar] [CrossRef] [PubMed]
  9. Rengarajan, J.; Bloom, B.R.; Rubin, E.J. Genome-wide requirements for Mycobacterium tuberculosis adaptation and survival in macrophages. Proc. Natl. Acad. Sci. USA 2005, 102, 8327–8332. [Google Scholar] [CrossRef] [PubMed]
  10. Van der Geize, R.; Yam, K.; Heuser, T.; Wilbrink, M.H.; Hara, H.; Anderton, M.C.; Sim, E.; Dijkhuizen, L.; Davies, J.E.; Mohn, W.W.; et al. A gene cluster encoding cholesterol catabolism in a soil actinomycete provides insight into Mycobacterium tuberculosis survival in macrophages. Proc. Natl. Acad. Sci. USA 2007, 104, 1947–1952. [Google Scholar] [CrossRef] [PubMed]
  11. Arruda, S.; Bomfim, G.; Knights, R.; Huima-Byron, T.; Riley, L.W. Cloning of an M. tuberculosis DNA fragment associated with entry and survival inside cells. Science 1993, 261, 1454–1457. [Google Scholar] [CrossRef] [PubMed]
  12. Mohn, W.W.; van der Geize, R.; Stewart, G.R.; Okamoto, S.; Liu, J.; Dijkhuizen, L.; Eltis, L.D. The actinobacterial MCE4 locus encodes a steroid transporter. J. Biol. Chem. 2008, 283, 35368–35374. [Google Scholar] [CrossRef] [PubMed]
  13. van der Geize, R.; de Jong, W.; Hessels, G.I.; Grommen, A.W.; Jacobs, A.A.; Dijkhuizen, L. A novel method to generate unmarked gene deletions in the intracellular pathogen Rhodococcus equi using 5-fluorocytosine conditional lethality. Nucleic Acids Res. 2008, 36, e151. [Google Scholar] [CrossRef] [PubMed]
  14. Kreit, J.; Sampson, N.S. Cholesterol oxidase: Physiological functions. FEBS J. 2009, 276, 6844–6856. [Google Scholar] [CrossRef] [PubMed]
  15. De las Heras, L.F.; Mascaraque, V.; Fernandez, E.G.; Navarro-Llorens, J.M.; Perera, J.; Drzyzga, O. ChoG is the main inducible extracellular cholesterol oxidase of Rhodococcus sp. strain CECT3014. Microbiol. Res. 2011, 166, 403–418. [Google Scholar] [CrossRef] [PubMed]
  16. Capyk, J.K.; Kalscheuer, R.; Stewart, G.R.; Liu, J.; Kwon, H.; Zhao, R.; Okamoto, S.; Jacobs, W.R., Jr.; Eltis, L.D.; Mohn, W.W. Mycobacterial cytochrome P450 125 (CYP125) catalyzes the terminal hydroxylation of c27 steroids. J. Biol. Chem. 2009, 284, 35534–35542. [Google Scholar] [CrossRef] [PubMed]
  17. Rosloniec, K.Z.; Wilbrink, M.H.; Capyk, J.K.; Mohn, W.W.; Ostendorf, M.; van der Geize, R.; Dijkhuizen, L.; Eltis, L.D. Cytochrome P450 125 (CYP125) catalyses c26-hydroxylation to initiate sterol side-chain degradation in Rhodococcus jostii rha1. Mol. Microbiol. 2009, 74, 1031–1043. [Google Scholar] [CrossRef] [PubMed]
  18. Driscoll, M.D.; McLean, K.J.; Levy, C.; Mast, N.; Pikuleva, I.A.; Lafite, P.; Rigby, S.E.J.; Leys, D.; Munro, A.W. Structural and biochemical characterization of Mycobacterium tuberculosis CYP142. J. Biol. Chem. 2010, 285, 38270–38282. [Google Scholar] [CrossRef] [PubMed]
  19. Johnston, J.B.; Ouellet, H.; Ortiz de Montellano, P.R. Functional redundancy of steroid C26-monooxygenase activity in Mycobacterium tuberculosis revealed by biochemical and genetic analyses. J. Biol. Chem. 2010, 285, 36352–36360. [Google Scholar] [CrossRef] [PubMed]
  20. Sih, C.J.; Wang, K.-C.; Tai, H.-H. Mechanisms of steroid oxidation by microorganisms. XIII. C22 acid intermediates in the degradation of the cholesterol side chain. Biochemistry 1968, 7, 796–807. [Google Scholar] [CrossRef] [PubMed]
  21. Sih, C.J.; Tai, H.-H.; Tsong, Y.Y.; Lee, S.S.; Coombe, R.G. Mechanisms of steroid oxidation by microorgansism. XIV. Pathway of cholesterol side-chain degradation. Biochemistry 1968, 7, 808–818. [Google Scholar] [CrossRef] [PubMed]
  22. Brzostek, A.; Sliwinski, T.; Rumijowska-Galewicz, A.; Korycka-Machala, M.; Dziadek, J. Identification and targeted disruption of the gene encoding the main 3-ketosteroid dehydrogenase in Mycobacterium smegmatis. Microbiology 2005, 151, 2393–2402. [Google Scholar] [CrossRef] [PubMed]
  23. Van der Geize, R.; Hessels, G.I.; van Gerwen, R.; Vrijbloed, J.W.; van der Meijden, P.; Dijkhuizen, L. Targeted disruption of the kstD gene encoding a 3-ketosteroid Δ1-dehydrogenase isoenzyme of Rhodococcus erythropolis strain SQ1. Appl. Environ. Microbiol. 2000, 66, 2029–2036. [Google Scholar] [CrossRef] [PubMed]
  24. Van der Geize, R.; Hessels, G.I.; Dijkhuizen, L. Molecular and functional characterization of the kstD2 gene of Rhodococcus erythropolis SQ1 encoding a second 3-ketosteroid Δ1-dehydrogenase isoenzyme. Microbiology 2002, 148, 3285–3292. [Google Scholar] [CrossRef] [PubMed]
  25. King, G.M. Uptake of carbon monoxide and hydrogen at environmentally relevant concentrations by mycobacteria. Appl. Environ. Microb. 2003, 69, 7266–7272. [Google Scholar] [CrossRef]
  26. Snapper, S.B.; Melton, R.E.; Mustafa, S.; Kieser, T.; Jacobs, W.R., Jr. Isolation and characterization of efficient plasmid transformation mutants of Mycobacterium smegmatis. Mol. Microbiol. 1990, 4, 1911–1919. [Google Scholar] [CrossRef] [PubMed]
  27. Uhia, I.; Galan, B.; Kendall, S.L.; Stoker, N.G.; Garcia, J.L. Cholesterol metabolism in Mycobacterium smegmatis. Environ. Microbiol. Rep. 2012, 4, 168–182. [Google Scholar] [CrossRef] [PubMed]
  28. Hurd, P.J.; Nelson, C.J. Advantages of next-generation sequencing versus the microarray in epigenetic research. Brief. Funct. Genom. 2009, 8, 174–183. [Google Scholar] [CrossRef] [PubMed]
  29. Wang, Z.; Gerstein, M.; Snyder, M. RNA-Seq: A revolutionary tool for transcriptomics. Nat. Rev. Genet. 2009, 10, 57–63. [Google Scholar] [CrossRef] [PubMed]
  30. ’t Hoen, P.A.C.; Ariyurek, Y.; Thygesen, H.H.; Vreugdenhil, E.; Vossen, R.H.; de Menezes, R.X.; Boer, J.M.; van Ommen, G.-J.B.; den Dunnen, J.T. Deep sequencing-based expression analysis shows major advances in robustness, resolution and inter-lab portability over five microarray platforms. Nucleic Acids Res. 2008, 36, e141. [Google Scholar] [CrossRef] [PubMed]
  31. Langmead, B.; Trapnell, C.; Pop, M.; Salzberg, S.L. Ultrafast and memory-efficient alignment of short DNA sequences to the human genome. Genome Biol. 2009, 10, R25. [Google Scholar] [CrossRef] [PubMed]
  32. Langmead, B.; Salzberg, S.L. Fast gapped-read alignment with Bowtie 2. Nat. Methods 2012, 9, 357–359. [Google Scholar] [CrossRef] [PubMed]
  33. Oliveros, J.C. Venny. An Interactive Tool for Comparing Lists with Venn Diagrams. Available online: http://bioinfogp.cnb.csic.es/tools/venny/ (accessed on 8 January 2015).
  34. Robinson, M.D.; McCarthy, D.J.; Smyth, G.K. Edger: A bioconductor package for differential expression analysis of digital gene expression data. Bioinformatics 2010, 26, 139–140. [Google Scholar] [CrossRef] [PubMed]
  35. Benjamini, Y.; Hochberg, Y. Controlling the false discovery rate: A practical and powerful approach to multiple testing. J. R Stat. Soc. Ser. B (Methodol.) 1995, 57, 289–300. [Google Scholar]
  36. Richardson, D.J.; Watmough, N.J. Inorganic nitrogen metabolism in bacteria. Curr. Opin. Chem. Biol. 1999, 3, 207–219. [Google Scholar] [CrossRef]
  37. Reitzer, L. Nitrogen assimilation and global regulation in Escherichia coli. Annu. Rev. Microbiol. 2003, 57, 155–176. [Google Scholar] [CrossRef] [PubMed]
  38. Crans, D.C.; Whitesides, G.M. Glycerol kinase: Synthesis of dihydroxyacetone phosphate, sn-glycerol-3-phosphate, and chiral analogs. J. Am. Chem. Soc. 1985, 107, 7019–7027. [Google Scholar] [CrossRef]
  39. Abbad-Andaloussi, S.; Guedon, E.; Spiesser, E.; Petitdemange, H. Glycerol dehydratase activity: The limiting step for 1,3-propanediol production by Clostridium butyricum DSM 5431. Lett. Appl. Microbiol. 1996, 22, 311–314. [Google Scholar] [CrossRef]
  40. Boenigk, R.; Bowien, S.; Gottschalk, G. Fermentation of glycerol to 1,3-propanediol in continuous cultures of Citrobacter freundii. Appl. Microbiol. Biotechnol. 1993, 38, 453–457. [Google Scholar] [CrossRef]
  41. Griffin, J.E.; Gawronski, J.D.; Dejesus, M.A.; Ioerger, T.R.; Akerley, B.J.; Sassetti, C.M. High-resolution phenotypic profiling defines genes essential for mycobacterial growth and cholesterol catabolism. PLoS Pathog. 2011, 7, e1002251. [Google Scholar] [CrossRef] [PubMed]
  42. Zhang, F.; Xie, J.P. Mammalian cell entry gene family of Mycobacterium tuberculosis. Mol. Cell. Biochem. 2011, 352, 1–10. [Google Scholar] [CrossRef] [PubMed]
  43. Tamura, K.; Stecher, G.; Peterson, D.; Filipski, A.; Kumar, S. MEGA6: Molecular evolutionary genetics analysis version 6.0. Mol. Biol. Evol. 2013, 30, 2725–2729. [Google Scholar] [CrossRef] [PubMed]
  44. Wang, L.; Li, P.; Brutnell, T.P. Exploring plant transcriptomes using ultra high-throughput sequencing. Brief. Funct. Genom. 2010, 9, 118–128. [Google Scholar] [CrossRef] [PubMed]
  45. Egan, A.N.; Schlueter, J.; Spooner, D.M. Applications of next-generation sequencing in plant biology. Am. J. Bot. 2012, 99, 175–185. [Google Scholar] [CrossRef] [PubMed]
  46. Jenkins, V.A.; Barton, G.R.; Robertson, B.D.; Williams, K.J. Genome wide analysis of the complete GlnR nitrogen-response regulon in Mycobacterium smegmatis. BMC Genom. 2013, 14, 301. [Google Scholar] [CrossRef] [PubMed]
  47. Tak, J. On bacteria decomposing cholesterol. Anton. Leeuw. 1942, 8, 32–40. [Google Scholar] [CrossRef]
  48. Turfitt, G. Microbiological agencies in the degradation of steroids: I. Steroid utilization by the microflora of soils. J. Bacteriol. 1947, 54, 557. [Google Scholar] [PubMed]
  49. De la Paz Santangelo, M.; Klepp, L.; Nunez-Garcia, J.; Blanco, F.C.; Soria, M.; Garcia-Pelayo, M.C.; Bianco, M.V.; Cataldi, A.A.; Golby, P.; Jackson, M.; et al. Mce3R, a TetR-type transcriptional repressor, controls the expression of a regulon involved in lipid metabolism in Mycobacterium tuberculosis. Microbiology 2009, 155, 2245–2255. [Google Scholar] [CrossRef] [PubMed]
  50. Li, W.; Ge, F.; Zhang, Q.; Ren, Y.; Yuan, J.; He, J.; Chen, G.; Zhang, G.; Zhuang, Y.; Xu, L. Identification of gene expression profiles in the actinomycete gordonia neofelifaecis grown with different steroids. Genome 2014, 57, 345–353. [Google Scholar] [CrossRef] [PubMed]
  51. Casali, N.; White, A.M.; Riley, L.W. Regulation of the Mycobacterium tuberculosis MCE1 operon. J. Bacteriol. 2006, 188, 441–449. [Google Scholar] [CrossRef] [PubMed]
  52. Kumar, A.; Bose, M.; Brahmachari, V. Analysis of expression profile of mammalian cell entry (MCE) operons of Mycobacterium tuberculosis. Infect. Immun. 2003, 71, 6083–6087. [Google Scholar] [CrossRef] [PubMed]
  53. Yang, X.; Nesbitt, N.M.; Dubnau, E.; Smith, I.; Sampson, N.S. Cholesterol metabolism increases the metabolic pool of propionate in Mycobacterium tuberculosis. Biochemistry 2009, 48, 3819–3821. [Google Scholar] [CrossRef] [PubMed]
  54. Schnappinger, D.; Ehrt, S.; Voskuil, M.I.; Liu, Y.; Mangan, J.A.; Monahan, I.M.; Dolganov, G.; Efron, B.; Butcher, P.D.; Nathan, C. Transcriptional adaptation of Mycobacterium tuberculosis within macrophages insights into the phagosomal environment. J. Exp. Med. 2003, 198, 693–704. [Google Scholar] [CrossRef] [PubMed]
  55. Uhia, I.; Galan, B.; Morales, V.; Garcia, J.L. Initial step in the catabolism of cholesterol by Mycobacterium smegmatis MC2 155. Environ. Microbiol. 2011, 13, 943–959. [Google Scholar] [CrossRef] [PubMed]
  56. Yang, X.X.; Dubnau, E.; Smith, I.; Sampson, N.S. Rv1106c from Mycobacterium tuberculosis is a 3 β-hydroxysteroid dehydrogenase. Biochemistry 2007, 46, 9058–9067. [Google Scholar] [CrossRef] [PubMed]
  57. Capyk, J.K.; D’Angelo, I.; Strynadka, N.C.; Eltis, L.D. Characterization of 3-ketosteroid 9α-hydroxylase, a rieske oxygenase in the cholesterol degradation pathway of Mycobacterium tuberculosis. J. Biol. Chem. 2009, 284, 9937–9946. [Google Scholar] [CrossRef] [PubMed]
  58. Yam, K.C.; D’Angelo, I.; Kalscheuer, R.; Zhu, H.; Wang, J.X.; Snieckus, V.; Ly, L.H.; Converse, P.J.; Jacobs, W.R., Jr.; Strynadka, N.; et al. Studies of a ring-cleaving dioxygenase illuminate the role of cholesterol metabolism in the pathogenesis of Mycobacterium tuberculosis. PLoS Pathog. 2009, 5, e1000344. [Google Scholar] [CrossRef] [PubMed]
  59. Van der Geize, R.; Hessels, G.I.; van Gerwen, R.; van der Meijden, P.; Dijkhuizen, L. Unmarked gene deletion mutagenesis of KstD, encoding 3-ketosteroid Δ1-dehydrogenase, in Rhodococcus erythropolis SQ1 using sacB as counter-selectable marker. FEMS Microbiol. Lett. 2001, 205, 197–202. [Google Scholar] [CrossRef]
  60. Van der Geize, R.; Hessels, G.; van Gerwen, R.; van der Meijden, P.; Dijkhuizen, L. Molecular and functional characterization of kshA and kshB, encoding two components of 3-ketosteroid 9α-hydroxylase, a class IA monooxygenase, in Rhodococcus erythropolis strain SQ1. Mol. Microbiol. 2002, 45, 1007–1018. [Google Scholar] [CrossRef] [PubMed]
  61. Gibson, D.; Wang, K.; Sih, C.J.; Whitlock, H. Mechanisms of steroid oxidation by microorganisms IX. On the mechanism of ring a cleavage in the degradation of 9,10-seco steroids by microorganisms. J. Biol. Chem. 1966, 241, 551–559. [Google Scholar] [PubMed]
  62. Kendall, S.L.; Withers, M.; Soffair, C.N.; Moreland, N.J.; Gurcha, S.; Sidders, B.; Frita, R.; Ten Bokum, A.; Besra, G.S.; Lott, J.S.; et al. A highly conserved transcriptional repressor controls a large regulon involved in lipid degradation in Mycobacterium smegmatis and Mycobacterium tuberculosis. Mol. Microbiol. 2007, 65, 684–699. [Google Scholar] [CrossRef] [PubMed]
  63. Garcia-Fernandez, E.; Medrano, F.J.; Galan, B.; Garcia, J.L. Deciphering the transcriptional regulation of cholesterol catabolic pathway in mycobacteria: Identification of the inducer of KstR repressor. J. Biol. Chem. 2014, 289, 17576–17588. [Google Scholar] [CrossRef] [PubMed]
  64. Mycobacterium smegmatis MC2 155 Genome. Available online: http://www.ncbi.nlm.nih.gov/nuccore/NC_008596.1 (accessed on 8 January 2015).
  65. Kanehisa, M.; Araki, M.; Goto, S.; Hattori, M.; Hirakawa, M.; Itoh, M.; Katayama, T.; Kawashima, S.; Okuda, S.; Tokimatsu, T.; et al. KEGG for linking genomes to life and the environment. Nucleic Acids Res. 2008, 36, D480–D484. [Google Scholar] [CrossRef] [PubMed]
Figure 1. Genes expression profiling in different M. smegmatis samples. (A) Overlap examinations were performed basing on the resulting gene lists of three samples by VENNY [33]; (B) overlap examinations of differentially expressed genes (DEGs) identified between cholesterol and glycerol, androstenedione and glycerol; (C) DEGs identified pair-wisely among three samples. AD, CHOL and GL correspond to three different conditions: 20 mL minimal medium plus with 1.75 mM androstenedione, 1.29 mM cholesterol and 5.47 mM glycerol respectively, respectively. CHOL-Up, CHOL-Down, AD-Up and AD-Down correspond to the DEGs up-regulated or down-regulated by CHOL or AD when compared with GL.
Ijms 17 00689 g001
Figure 2. Growth curve of M. smegmatis MC2 155 grown in different mediums. AD, CHOL and GL correspond to three different conditions: 20 mL minimal medium plus with 1.75 mM androstenedione, 1.29 mM cholesterol and 5.47 mM glycerol respectively.
Ijms 17 00689 g002
Figure 3. Expression patterns of cholesterol pathway (A) and mammalian cell entry (MCE) (B) related genes. Log2 fold-change (Log2FC) was calculated between each two conditions basing on the expression value. Heatmap was drawn by HemI.
Ijms 17 00689 g003
Figure 4. Phylogenetic analysis of 48 mammalian cell entry (MCE) related proteins. Protein sequences were deduced from 48 MCE related genes. Phylogenetic tree was constructed using the Neighbor–Joining method in MEGA6 program [43]. Group A, B, C, D, E, F are consisted of MCE A, B, C, D, E, F genes, respectively, group S means an additional group.
Ijms 17 00689 g004
Figure 5. The organization of the MCE operons in M. smegmatis MC2 155 genome. The operon structures of the five MCE operons are shown. The grey arrows represent MCE genes, while the white arrows represent other MCE related genes.
Ijms 17 00689 g005
Table 1. RNA-Sequencing read mapping. Androstenedione (AD), cholesterol (CHOL) and glycerol (GL) correspond to three different conditions: 20 mL minimal medium plus with 1.75 mM (0.05%) androstenedione, 1.29 mM (0.05%) cholesterol and 5.47 mM (0.05%) glycerol respectively. RNA-Seq reads were mapped to the genome and rRNA of M. smegmatis MC2 155 with Bowtie2 (v2.2.3) [31,32].
Read ClassificationADCHOLGL
Total Reads4,727,9625,524,2205,432,638
Mapped4,630,5665,403,2405,325,615
Unmapped97,396120,980107,023
rRNA Mapped38,76928,17419,557
Table 2. Expression level of nitrogen and carbon metabolism, and also glycerol and androstenedione metabolism related genes.
Gene NameGene_IDExpression Level
Myco_1Myco_2Myco_3
ammonium transporterMSMEG_463522.8628.8528.80
nitrate reductaseMSMEG_2837806.92166.85351.58
nitrate reductaseMSMEG_5139107.44326.17183.73
nitrate reductaseMSMEG_5140210.30614.29442.95
carbamoyl phosphate synthaseMSMEG_30466.8637.2212.91
carbamoyl phosphate synthaseMSMEG_304734.2973.6035.75
carbamoyl phosphate synthaseMSMEG_47260.000.420.00
glutamine synthetaseMSMEG_3561393.17392.24640.58
glutamine synthetaseMSMEG_4290416.03477.55685.27
glutamine synthetaseMSMEG_42943744.30990.231818.46
glutamate dehydrogenaseMSMEG_46991769.281946.591900.89
glutamate synthaseMSMEG_626329.7236.8023.84
glutamate synthaseMSMEG_64584.5723.005.96
glutamate synthaseMSMEG_3226240.02117.92295.96
glutamate synthaseMSMEG_3225985.22484.241505.62
glutamate synthaseMSMEG_559422.8682.3826.82
glutamate synthaseMSMEG_645925.1470.6730.79
hexokinaseMSMEG_5577313.17225.81397.26
6-phosphofructokinaseMSMEG_23661430.97288.54746.85
pyruvate kinaseMSMEG_32271312.101222.312115.41
citrate synthaseMSMEG_5676598.90155.14395.27
isocitrate dehydrogenaseMSMEG_16541675.561218.551752.91
alpha-ketoglutarate decarboxylaseMSMEG_50491398.972698.883475.03
dihydrolipoamide dehydrogenaseMSMEG_0903612.62425.70414.14
glycerol kinaseMSMEG_675925.148.36456.85
glycerol kinaseMSMEG_6229294.88271.81195.65
glycerol kinaseMSMEG_67560.0012.5512.91
glycerol-3-phosphate dehydrogenaseMSMEG_1736651.48705.87637.60
glycerol-4-phosphate dehydrogenaseMSMEG_676164.0138.05302.91
glycerol-5-phosphate dehydrogenaseMSMEG_1140777.201007.791057.71
glycerol-6-phosphate dehydrogenaseMSMEG_2393182.87110.82244.32
glycerol dehydrataseMSMEG_04970.0030.118.94
glycerol dehydrataseMSMEG_1547246.88221.63262.19
glycerol dehydrataseMSMEG_632148.00120.8557.60
3-ketosteroid-δ-1-dehydrogenaseMSMEG_286725.1435.5417.88
3-ketosteroid-δ-2-dehydrogenaseMSMEG_28699.1418.4010.92
3-ketosteroid-δ-3-dehydrogenaseMSMEG_48644.5717.155.96
3-ketosteroid-δ-4-dehydrogenaseMSMEG_594141.15115.4220.86
Table 3. Gene clusters induced by cholesterol. AD, CHOL and GL correspond to three different conditions: 20 mL minimal medium plus with 1.75 mM androstenedione, 1.29 mM cholesterol and 5.47 mM glycerol respectively.
CHOLvsADCHOLvsGL
StartEndStartEnd
MSMEG_0132MSMEG_0144MSMEG_0132MSMEG_0144
MSMEG_0329MSMEG_0346MSMEG_2705MSMEG_2714
MSMEG_0500MSMEG_0518
MSMEG_0638MSMEG_0649
MSMEG_1141MSMEG_1150MSMEG_1141MSMEG_1150
MSMEG_1364MSMEG_1375
MSMEG_1435MSMEG_1448
MSMEG_2705MSMEG_2713MSMEG_6115MSMEG_6125
MSMEG_2854MSMEG_2865MSMEG_2854MSMEG_2861
MSMEG_3997MSMEG_4005
MSMEG_4414MSMEG_4427MSMEG_4419MSMEG_4427
MSMEG_4835MSMEG_4843MSMEG_4461MSMEG_4468
MSMEG_5953MSMEG_5966MSMEG_4864MSMEG_4873

