
Quantitative Analysis of Mutant Subclones in Chronic Myeloid Leukemia: Comparison of Different Methodological Approaches

 ,
,
Abstract
:1. Introduction
2. Results
3. Discussion
4. Experimental Section
4.1. Material
Patient Material and Ethical Statement
4.2. Methods
Quantitative Analysis of Mutant BCR-ABL1 Subclones
4.3. Statistical Analysis
5. Conclusions
Acknowledgments
Authors Contributions
Conflicts of Interest
References
- Jabbour, E.J.; Cortes, J.E.; Kantarjian, H.M. Resistance to tyrosine kinase inhibition therapy for chronic myelogenous leukemia: A clinical perspective and emerging treatment options. Clin. Lymphoma Myeloma Leuk. 2013, 13, 515–529. [Google Scholar] [CrossRef] [PubMed]
- Radich, J.P. Monitoring response to tyrosine kinase inhibitor therapy, mutational analysis, and new treatment options in chronic myelogenous leukemia. J. Natl. Compr. Cancer Netw. JNCCN 2013, 11 (Suppl. 5), 663–666. [Google Scholar] [PubMed]
- Ernst, T.; Hochhaus, A. Chronic myeloid leukemia: Clinical impact of BCR-ABL1 mutations and other lesions associated with disease progression. Semin. Oncol. 2012, 39, 58–66. [Google Scholar] [CrossRef] [PubMed]
- Soverini, S.; Branford, S.; Nicolini, F.E.; Talpaz, M.; Deininger, M.W.; Martinelli, G.; Muller, M.C.; Radich, J.P.; Shah, N.P. Implications of BCR-ABL1 kinase domain-mediated resistance in chronic myeloid leukemia. Leuk. Res. 2014, 38, 10–20. [Google Scholar] [CrossRef] [PubMed]
- Khorashad, J.S.; Kelley, T.W.; Szankasi, P.; Mason, C.C.; Soverini, S.; Adrian, L.T.; Eide, C.A.; Zabriskie, M.S.; Lange, T.; Estrada, J.C.; et al. BCR-ABL1 compound mutations in tyrosine kinase inhibitor-resistant CML: Frequency and clonal relationships. Blood 2013, 121, 489–498. [Google Scholar] [CrossRef] [PubMed]
- Baccarani, M.; Castagnetti, F.; Gugliotta, G.; Rosti, G. A review of the European LeukemiaNet recommendations for the management of CML. Ann. Hematol. 2015, 94 (Suppl. 2), S141–S147. [Google Scholar] [CrossRef] [PubMed]
- Baccarani, M.; Deininger, M.W.; Rosti, G.; Hochhaus, A.; Soverini, S.; Apperley, J.F.; Cervantes, F.; Clark, R.E.; Cortes, J.E.; Guilhot, F.; et al. European LeukemiaNet recommendations for the management of chronic myeloid leukemia: 2013. Blood 2013, 122, 872–884. [Google Scholar] [CrossRef] [PubMed]
- O'Brien, S.; Radich, J.P.; Abboud, C.N.; Akhtari, M.; Altman, J.K.; Berman, E.; DeAngelo, D.J.; Deininger, M.; Devine, S.; Fathi, A.T.; et al. Chronic Myelogenous Leukemia, Version 1.2014. J. Natl. Compr. Cancer Netw. JNCCN 2013, 11, 1327–1340. [Google Scholar] [PubMed]
- Soverini, S.; Hochhaus, A.; Nicolini, F.E.; Gruber, F.; Lange, T.; Saglio, G.; Pane, F.; Muller, M.C.; Ernst, T.; Rosti, G.; et al. BCR-ABL kinase domain mutation analysis in chronic myeloid leukemia patients treated with tyrosine kinase inhibitors: Recommendations from an expert panel on behalf of European LeukemiaNet. Blood 2011, 118, 1208–1215. [Google Scholar] [CrossRef] [PubMed]
- Branford, S.; Hughes, T. Detection of BCR-ABL mutations and resistance to imatinib mesylate. Methods Mol. Med. 2006, 125, 93–106. [Google Scholar] [PubMed]
- Willis, S.G.; Lange, T.; Demehri, S.; Otto, S.; Crossman, L.; Niederwieser, D.; Stoffregen, E.P.; McWeeney, S.; Kovacs, I.; Park, B.; et al. High-sensitivity detection of BCR-ABL kinase domain mutations in imatinib-naive patients: Correlation with clonal cytogenetic evolution but not response to therapy. Blood 2005, 106, 2128–2137. [Google Scholar] [CrossRef] [PubMed]
- Khorashad, J.S.; Anand, M.; Marin, D.; Saunders, S.; Al-Jabary, T.; Iqbal, A.; Margerison, S.; Melo, J.V.; Goldman, J.M.; Apperley, J.F.; et al. The presence of a BCR-ABL mutant allele in CML does not always explain clinical resistance to imatinib. Leukemia 2006, 20, 658–663. [Google Scholar] [CrossRef] [PubMed]
- Jabbour, E.; Branford, S.; Saglio, G.; Jones, D.; Cortes, J.E.; Kantarjian, H.M. Practical advice for determining the role of BCR-ABL mutations in guiding tyrosine kinase inhibitor therapy in patients with chronic myeloid leukemia. Cancer 2011, 117, 1800–1811. [Google Scholar] [CrossRef] [PubMed]
- Kastner, R.; Zopf, A.; Preuner, S.; Proll, J.; Niklas, N.; Foskett, P.; Valent, P.; Lion, T.; Gabriel, C. Rapid identification of compound mutations in patients with Philadelphia-positive leukaemias by long-range next generation sequencing. Eur. J. Cancer 2014, 50, 793–800. [Google Scholar] [CrossRef] [PubMed]
- Preuner, S.; Mitterbauer, G.; Mannhalter, C.; Herndlhofer, S.; Sperr, W.R.; Valent, P.; Lion, T. Quantitative monitoring of BCR/ABL1 mutants for surveillance of subclone-evolution, -expansion, and -depletion in chronic myeloid leukaemia. Eur. J. Cancer 2012, 48, 233–236. [Google Scholar] [CrossRef] [PubMed]
- Soverini, S.; de Benedittis, C.; Machova Polakova, K.; Brouckova, A.; Horner, D.; Iacono, M.; Castagnetti, F.; Gugliotta, G.; Palandri, F.; Papayannidis, C.; et al. Unraveling the complexity of tyrosine kinase inhibitor-resistant populations by ultra-deep sequencing of the BCR-ABL kinase domain. Blood 2013, 1122, 1634–1648. [Google Scholar] [CrossRef] [PubMed]
- Machova Polakova, K.; Kulvait, V.; Benesova, A.; Linhartova, J.; Klamova, H.; Jaruskova, M.; de Benedittis, C.; Haferlach, T.; Baccarani, M.; Martinelli, G.; et al. Next-generation deep sequencing improves detection of BCR-ABL1 kinase domain mutations emerging under tyrosine kinase inhibitor treatment of chronic myeloid leukemia patients in chronic phase. J. Cancer Res. Clin. Oncol. 2015, 141, 887–899. [Google Scholar] [CrossRef] [PubMed]
- Alikian, M.; Gerrard, G.; Subramanian, P.G.; Mudge, K.; Foskett, P.; Khorashad, J.S.; Lim, A.C.; Marin, D.; Milojkovic, D.; Reid, A.; et al. BCR-ABL1 kinase domain mutations: Methodology and clinical evaluation. Am. J. Hematol. 2012, 87, 298–304. [Google Scholar] [CrossRef] [PubMed]
- Preuner, S.; Denk, D.; Frommlet, F.; Nesslboeck, M.; Lion, T. Quantitative monitoring of cell clones carrying point mutations in the BCR-ABL tyrosine kinase domain by ligation-dependent polymerase chain reaction (LD-PCR). Leukemia 2008, 22, 1956–1961. [Google Scholar] [CrossRef] [PubMed]
- Gruber, F.X.; Lamark, T.; Anonli, A.; Sovershaev, M.A.; Olsen, M.; Gedde-Dahl, T.; Hjort-Hansen, H.; Skogen, B. Selecting and deselecting imatinib-resistant clones: Observations made by longitudinal, quantitative monitoring of mutated BCR-ABL. Leukemia 2005, 19, 2159–2165. [Google Scholar] [CrossRef] [PubMed]
- Pelz-Ackermann, O.; Cross, M.; Pfeifer, H.; Deininger, M.; Wang, S.Y.; Al-Ali, H.K.; Niederwieser, D.; Lange, T. Highly sensitive and quantitative detection of BCR-ABL kinase domain mutations by ligation PCR. Leukemia 2008, 22, 2288–2291. [Google Scholar] [CrossRef] [PubMed]
- Oehler, V.G.; Qin, J.; Ramakrishnan, R.; Facer, G.; Ananthnarayan, S.; Cummings, C.; Deininger, M.; Shah, N.; McCormick, F.; Willis, S.; et al. Absolute quantitative detection of ABL tyrosine kinase domain point mutations in chronic myeloid leukemia using a novel nanofluidic platform and mutation-specific PCR. Leukemia 2009, 23, 396–399. [Google Scholar] [CrossRef] [PubMed]
- Nardi, V.; Raz, T.; Cao, X.; Wu, C.J.; Stone, R.M.; Cortes, J.; Deininger, M.W.; Church, G.; Zhu, J.; Daley, G.Q. Quantitative monitoring by polymerase colony assay of known mutations resistant to ABL kinase inhibitors. Oncogene 2008, 27, 775–782. [Google Scholar] [CrossRef] [PubMed]
- Hayette, S.; Michallet, M.; Baille, M.L.; Magaud, J.P.; Nicolini, F.E. Assessment and follow-up of the proportion of T315I mutant BCR-ABL transcripts can guide appropriate therapeutic decision making in CML patients. Leuk. Res. 2005, 29, 1073–1077. [Google Scholar] [CrossRef] [PubMed]
- Ferri, C.; Bianchini, M.; Icardi, G.; Belli, C.; Bengio, R.; Larripa, I. Early detection and quantification of mutations in the tyrosine kinase domain of chimerical BCR-ABL1 gene combining high-resolution melting analysis and mutant-allele specific quantitative polymerase chain reaction. Leuk. Lymphoma 2013, 54, 598–606. [Google Scholar] [CrossRef] [PubMed]
- Yamamoto, M.; Kakihana, K.; Ohashi, K.; Yamaguchi, T.; Tadokoro, K.; Akiyama, H.; Sakamaki, H. Serial monitoring of T315I BCR-ABL mutation by Invader assay combined with RT-PCR. Int. J. Hematol. 2009, 89, 482–488. [Google Scholar] [CrossRef] [PubMed]
- Cavelier, L.; Ameur, A.; Haggqvist, S.; Hoijer, I.; Cahill, N.; Olsson-Stromberg, U.; Hermanson, M. Clonal distribution of BCR-ABL1 mutations and splice isoforms by single-molecule long-read RNA sequencing. BMC Cancer 2015, 15. [Google Scholar] [CrossRef] [PubMed]
- Lange, T.; Ernst, T.; Gruber, F.X.; Maier, J.; Cross, M.; Muller, M.C.; Niederwieser, D.; Hochhaus, A.; Pfirrmann, M. The quantitative level of T315I mutated BCR-ABL predicts for major molecular response to second-line nilotinib or dasatinib treatment in patients with chronic myeloid leukemia. Haematologica 2013, 98, 714–717. [Google Scholar] [CrossRef] [PubMed]
- Hanfstein, B.; Muller, M.C.; Kreil, S.; Ernst, T.; Schenk, T.; Lorentz, C.; Schwindel, U.; Leitner, A.; Hehlmann, R.; Hochhaus, A. Dynamics of mutant BCR-ABL-positive clones after cessation of tyrosine kinase inhibitor therapy. Haematologica 2011, 96, 360–366. [Google Scholar] [CrossRef] [PubMed]
- Gabert, J.; Beillard, E.; van der Velden, V.H.; Bi, W.; Grimwade, D.; Pallisgaard, N.; Barbany, G.; Cazzaniga, G.; Cayuela, J.M.; Cave, H.; et al. Standardization and quality control studies of “real-time” quantitative reverse transcriptase polymerase chain reaction of fusion gene transcripts for residual disease detection in leukemia—A Europe Against Cancer program. Leukemia 2003, 17, 2318–2357. [Google Scholar] [CrossRef] [PubMed]
- Niklas, N.; Hafenscher, J.; Barna, A.; Wiesinger, K.; Proll, J.; Dreiseitl, S.; Preuner-Stix, S.; Valent, P.; Lion, T.; Gabriel, C. cFinder: Definition and quantification of multiple haplotypes in a mixed sample. BMC Res. Notes 2015, 8. [Google Scholar] [CrossRef] [PubMed]


| Sample Number | BCR-ABL1 % (IS) | Mutation | LD-PCR (% Mut) | Pyroseq (% Mut) | NGS MiSeq (% Mut) |
|---|---|---|---|---|---|
| 1-1 | 0.670 | p.E255K | 97 | 84 | 92 |
| 1-2 | 1.700 | p.E255K | 100 | 86 | 96 |
| 2-1 | 9.834 | p.E255K | 82 | pos | n.a. |
| 2-2 | 0.667 | p.E255K | 97 | 84 | 92 |
| 2-3 | 2.338 | p.E255K | 97 | 86 | n.a. |
| 3-1 | 1.670 | p.E255K | 41 | pos | 28 |
| 3-2 | 4.180 | p.E255K | 49 | pos | 22 |
| 3-3 | 5.800 | p.E255K | 61 | pos | 35 |
| 3-1 | 1.670 | p.Y253F | 27 | pos | 20 |
| 3-2 | 4.180 | p.Y253F | 27 | pos | 14 |
| 3-3 | 5.800 | p.Y253F | 7 | pos | 5 |
| 3-1 | 1.670 | p.T315I | 6 | pos | 8 |
| 3-2 | 4.180 | p.T315I | 9 | pos | 20 |
| 3-3 | 5.800 | p.T315I | 3 | pos | n.a. |
| 4-1 | 20.015 | p.T315I | 92 | 89 | n.a. |
| 4-2 | 15.692 | p.T315I | 56 | 50 | n.a. |
| 4-3 | 13.075 | p.T315I | 62 | 54 | n.a. |
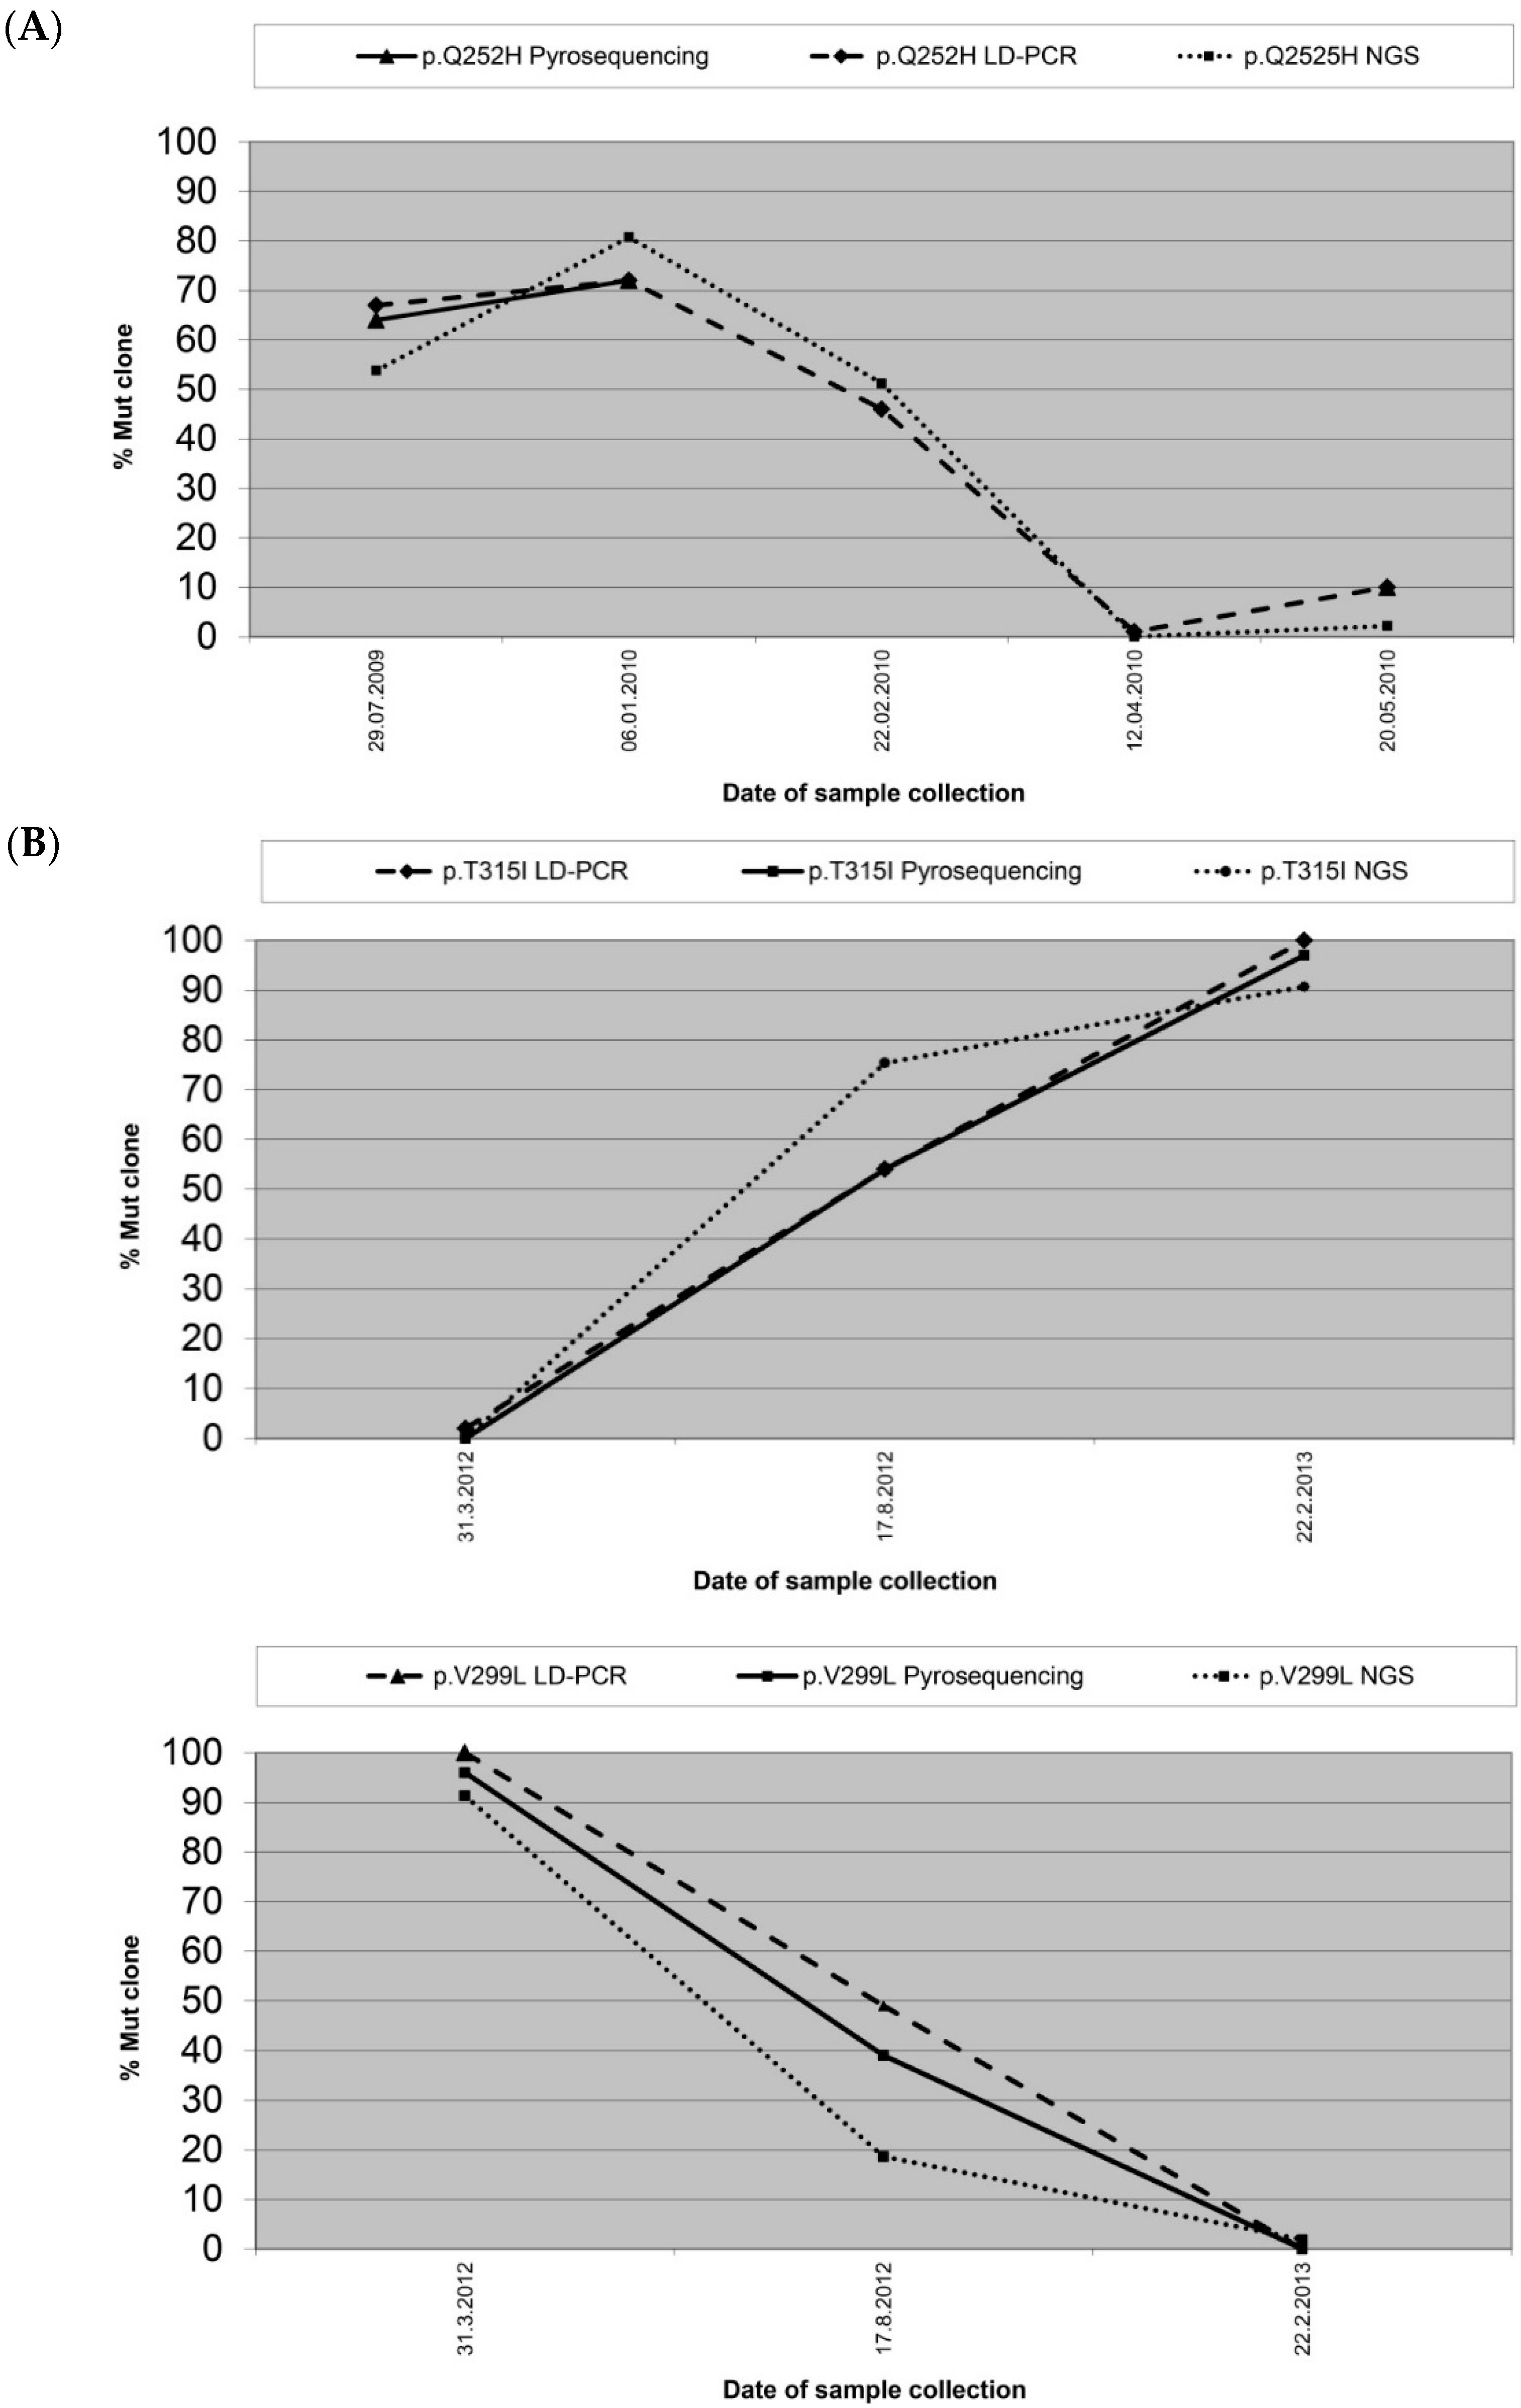
| 5-1 | 18.550 | p.V299L | 100 | 96 | 91 |
| 5-2 | 1.380 | p.V299L | 49 | 39 | 19 |
| 5-3 | 20.670 | p.V299L | 0 | 0 | 2 |
| 5-1 | 18.550 | p.T315I | 2 | 0 | 0 |
| 5-2 | 1.380 | p.T315I | 54 | 54 | 75 |
| 5-3 | 20.670 | p.T315I | 100 | 97 | 91 |
| 6-1 | 41.355 | p.F359V | 10 | 8 | n.a. |
| 6-2 | 29.897 | p.F359V | 51 | 60 | n.a. |
| 6-3 | 10.786 | p.F359V | 12 | 16 | n.a. |
| 6-4 | 11.302 | p.F359V | 0 | 0 | n.a. |
| 7-1 | 0.080 | p.F359V | n.a. | n.a. | 67 |
| 7-2 | 0.050 | p.F359V | 88 | 80 | 35 |
| 7-3 | 0.120 | p.F359V | 17 | 24 | 13 |
| 8 | 6.280 | p.G250E | n.d. | pos | 0 |
| 9 | 20.060 | p.T315I | 98 | 89 | 77 |
| 9 | 20.060 | p.G250E | n.a. | n.a. | 33 |
| 10-1 | 0.108 | p.Q252H | 67 | 64 | n.a. |
| 10-2 | 0.200 | p.Q252H | 72 | 72 | n.a. |
| 10-3 | 0.079 | p.Q252H | 46 | n.a. | 61 |
| 10-4 | 0.016 | p.Q252H | 1 | n.a. | n.a. |
| 10-5 | 0.020 | p.Q252H | 10 | 10 | n.a. |
| 11 | 1.990 | p.M244V | 90 | pos | 80 |
| 12 | 2.670 | p.T315I | 97 | 96 | 93 |
| 13 | 35.570 | p.E255K | 94 | 62 | 47 |
| 14 | 8.640 | p.M244V | 77 | 72 | 73 |
| 14 | 8.640 | p.Y253H | 9 | 10 | 7 |
| 15-1 | 18.218 | p.T315I | 0 | 0 | n.a. |
| 15-2 | 21.540 | p.T315I | 0 | 0 | n.a. |
| 15-3 | 15.313 | p.T315I | 37 | 45 | 44 |
| 16 | 18.500 | p.Y253H | 98 | 95 | 94 |
| 17 | 14.370 | p.T315I | 34 | 41 | 40 |
| 18 | 0.040 | p.Y253H | n.a. | 40 | 36 |
| 19 | 0.160 | p.T315I | 100 | 97 | 97 |
| Sample Number | BCR-ABL1 % (IS) | Mutation | LD-PCR (% Mut) | NGS GS Junior (% Mut) |
|---|---|---|---|---|
| 1-1 | 7.200 | p.M351T | 86 | 72 |
| 1-2 | 0.180 | p.M351T | n.a. | 26 |
| 1-1 | 7.200 | p.G250E | 5 | 5 |
| 1-2 | 0.180 | p.G250E | 1 | 0 |
| 2-1 | 5.900 | p.T315I | 26 | 26 |
| 2-2 | 15.000 | p.T315I | 66 | 69 |
| 2-1 | 5.900 | p.M351T | 1 | 6 |
| 2-2 | 15.000 | p.M351T | 1 | 0 |
| 2-1 | 5.900 | p.Y253H | 3 | 0 |
| 2-2 | 15.000 | p.Y253H | 6 | 17 |
| 3-1 | 0.140 | p.M351T | 48 | 59 |
| 3-2 | 2.300 | p.M351T | 16 | 9 |
| 3-3 | 8.400 | p.M351T | 1 | 0 |
| 3-1 | 0.140 | p.F359V | 35 | 30 |
| 3-2 | 2.300 | p.F359V | 4 | 5 |
| 3-3 | 8.400 | p.F359V | 0 | 2 |
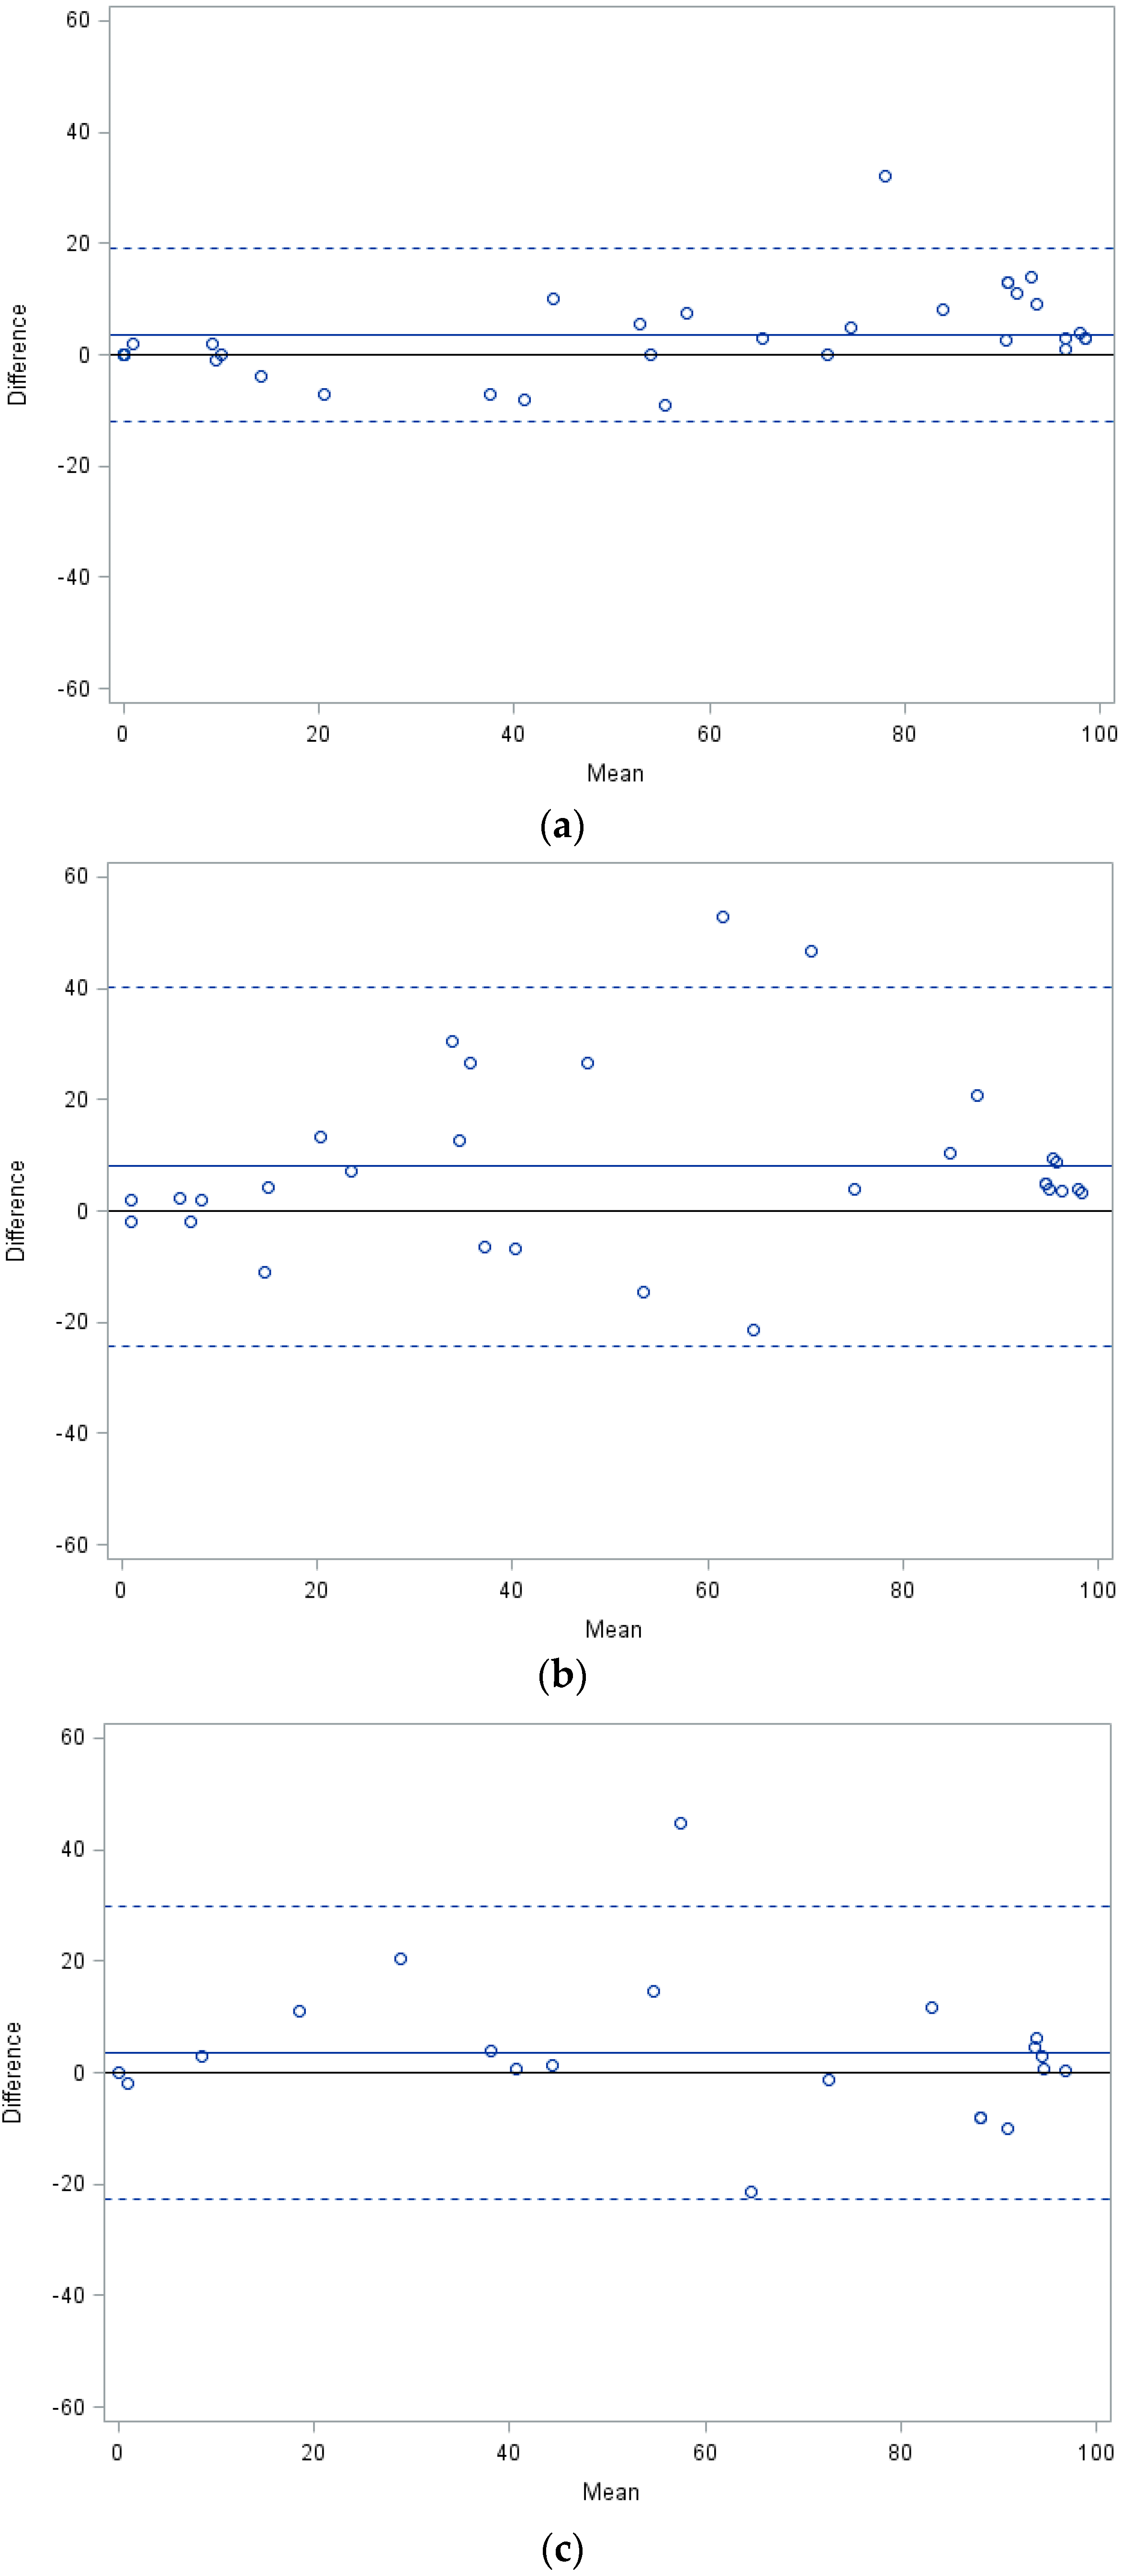
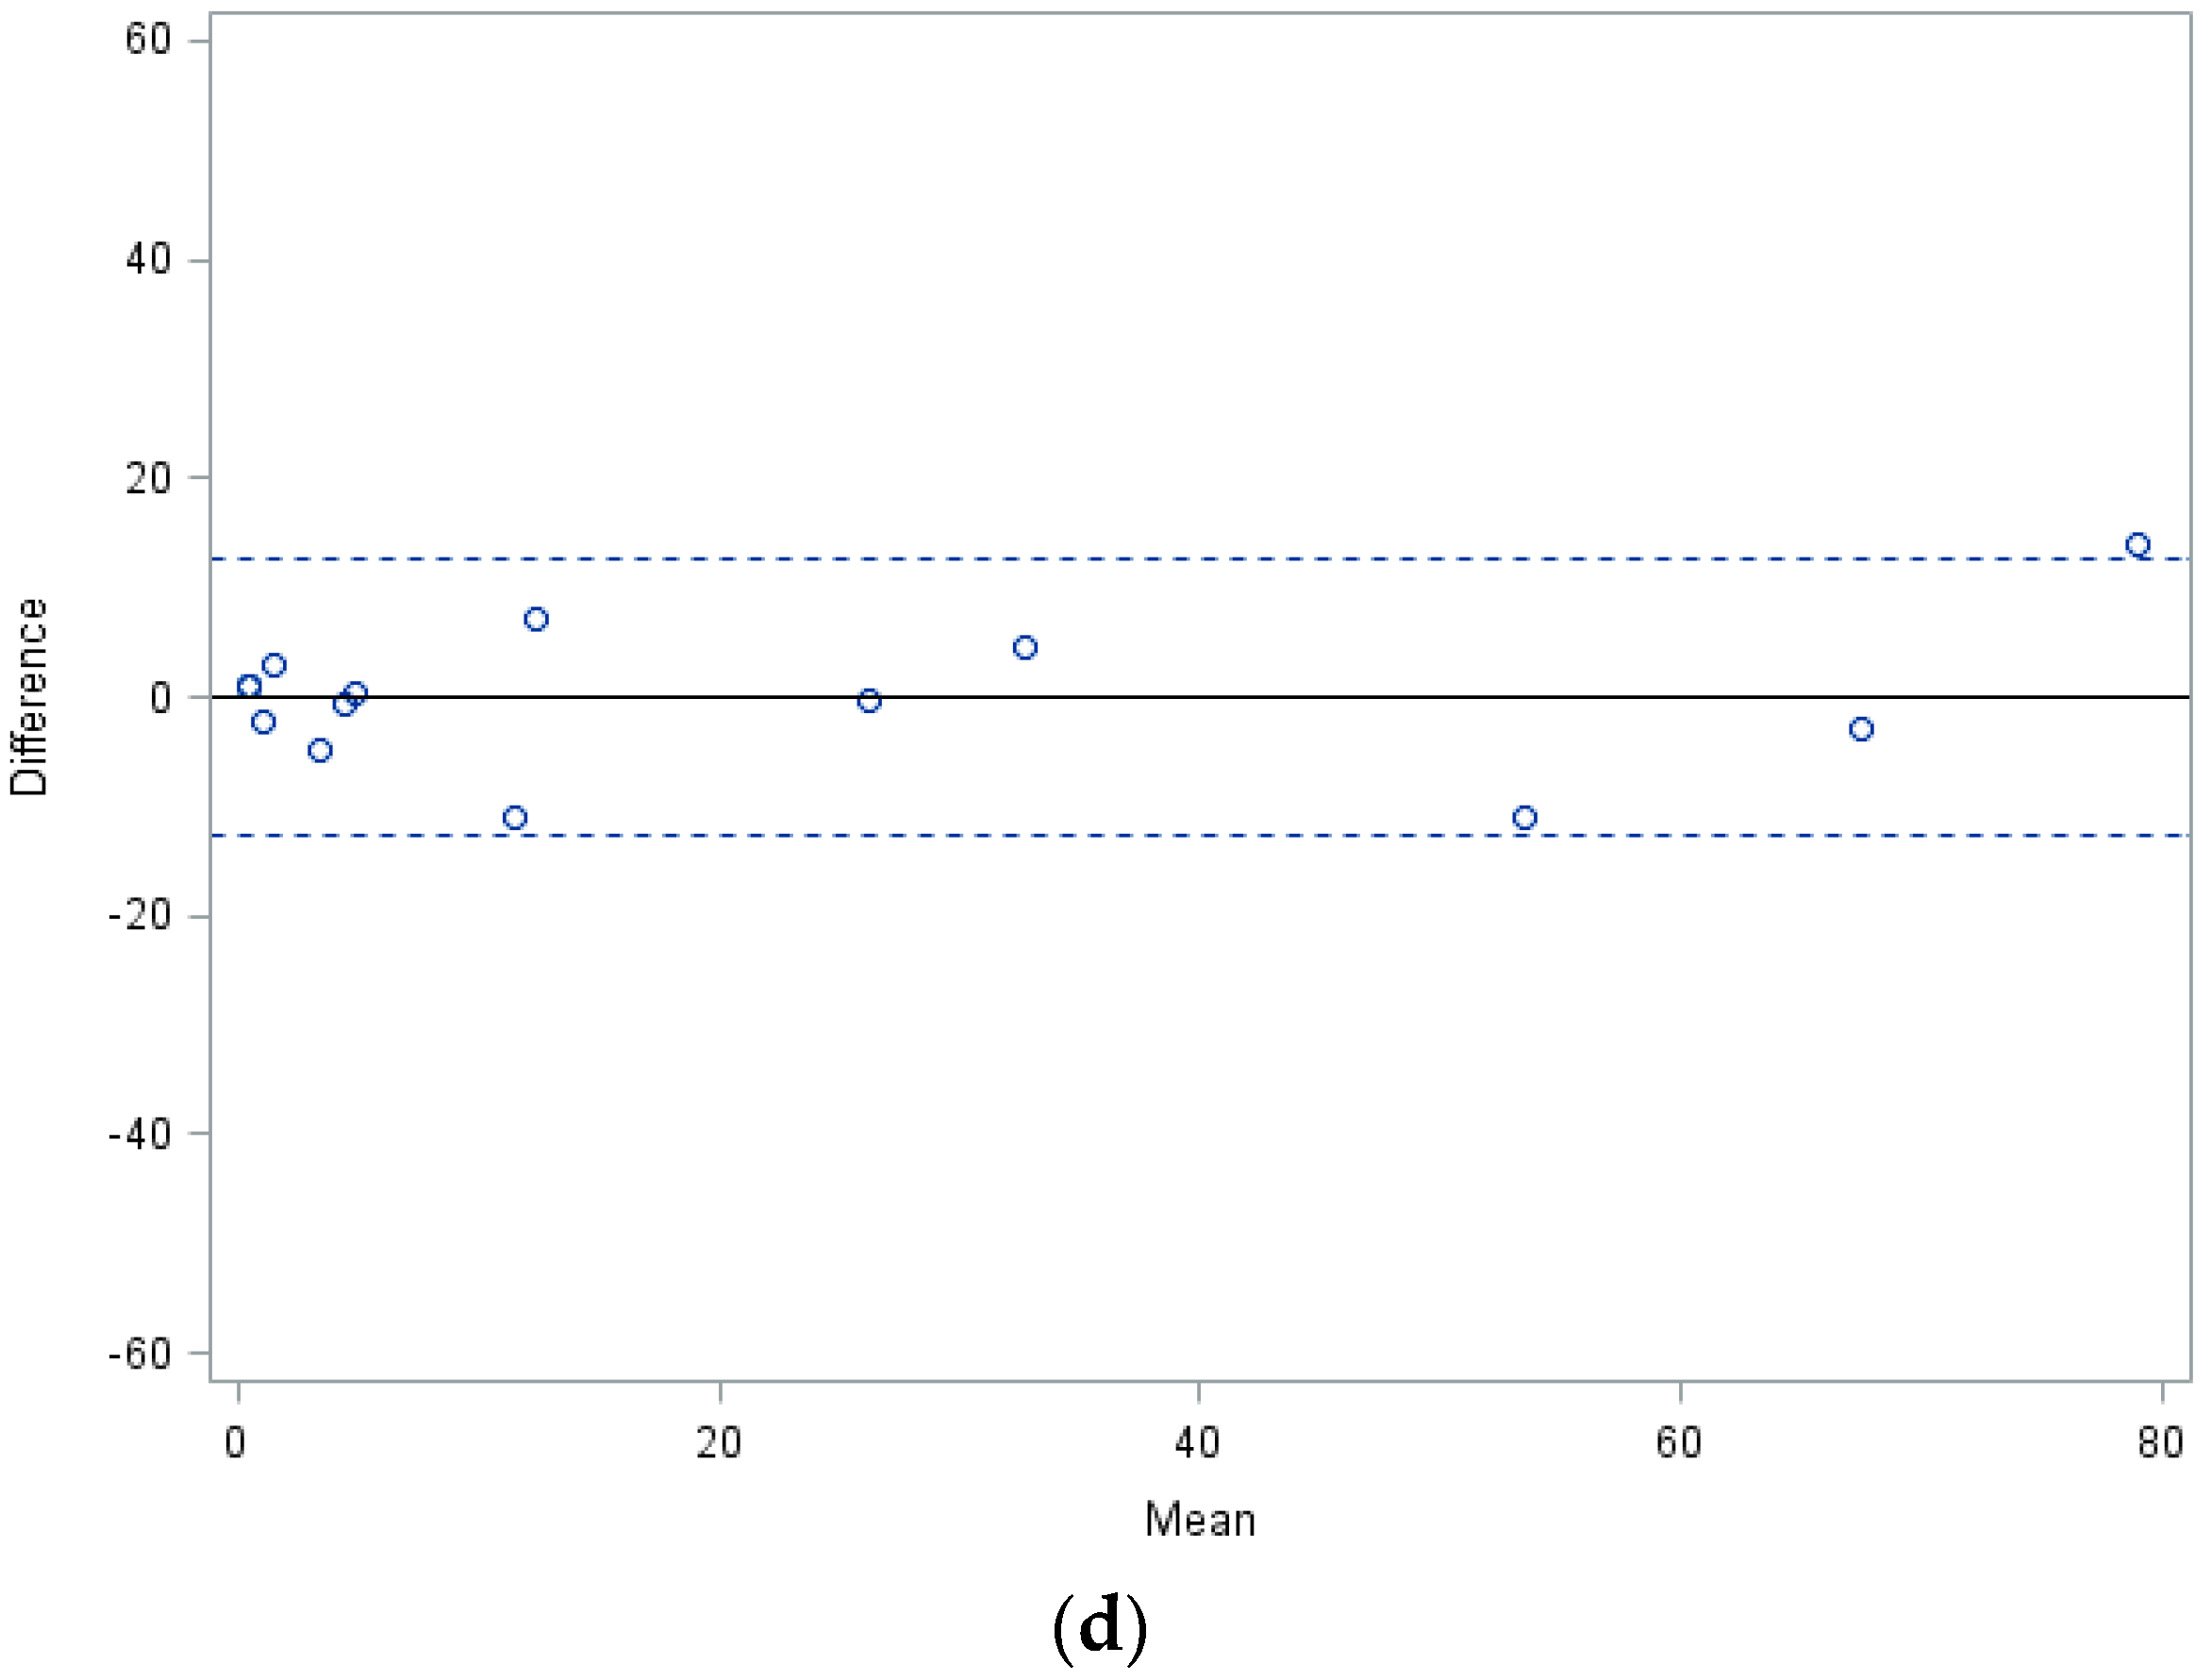
| Specifications | LD-PCR/Pyrosequencing | LD-PCR/NGS | Pyrosequencing/NGS |
|---|---|---|---|
| Number of samples compared (N) | 33 | 30 | 21 |
| Difference of mean values (∆M) | 3.5 | 8 | 3.6 |
| Standard deviation (SD) | 7.8 | 16.1 | 13.1 |
| Performance Features | LD-PCR | Pyrosequencing | NGS |
|---|---|---|---|
| Quantitative analysis of mutant subclones | yes | yes | yes |
| Prior knowledge of mutation required | yes | yes | no |
| Detection of multiple mutations in one reaction | no | yes | yes |
| Detection limit for mutant subclones | 1%–5% | 5% | 1% |
| Accuracy of quantification | ±5% | n.a. | n.a. |
© 2016 by the authors; licensee MDPI, Basel, Switzerland. This article is an open access article distributed under the terms and conditions of the Creative Commons Attribution (CC-BY) license (http://creativecommons.org/licenses/by/4.0/).
Share and Cite
Preuner, S.; Barna, A.; Frommlet, F.; Czurda, S.; Konstantin, B.; Alikian, M.; Machova Polakova, K.; Sacha, T.; Richter, J.; Lion, T.; et al. Quantitative Analysis of Mutant Subclones in Chronic Myeloid Leukemia: Comparison of Different Methodological Approaches. Int. J. Mol. Sci. 2016, 17, 642. https://doi.org/10.3390/ijms17050642
Preuner S, Barna A, Frommlet F, Czurda S, Konstantin B, Alikian M, Machova Polakova K, Sacha T, Richter J, Lion T, et al. Quantitative Analysis of Mutant Subclones in Chronic Myeloid Leukemia: Comparison of Different Methodological Approaches. International Journal of Molecular Sciences. 2016; 17(5):642. https://doi.org/10.3390/ijms17050642
Chicago/Turabian StylePreuner, Sandra, Agnes Barna, Florian Frommlet, Stefan Czurda, Byrgazov Konstantin, Mary Alikian, Katerina Machova Polakova, Tomasz Sacha, Johan Richter, Thomas Lion, and et al. 2016. "Quantitative Analysis of Mutant Subclones in Chronic Myeloid Leukemia: Comparison of Different Methodological Approaches" International Journal of Molecular Sciences 17, no. 5: 642. https://doi.org/10.3390/ijms17050642