
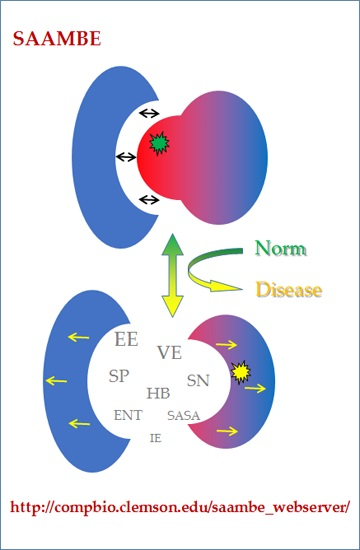
SAAMBE: Webserver to Predict the Charge of Binding Free Energy Caused by Amino Acids Mutations


Abstract
:
1. Introduction
2. Results
2.1. Scenario 1
2.2. Scenario 2
2.3. Scenario 3
2.4. Scenario 4
2.5. Scenario 5
2.6. Case Studies
3. Discussion
4. Materials and Methods
5. Webserver Architecture
5.1. Overview of SAAMBE Webserver
5.2. Client Interface
5.3. Server
5.4. Job Backend
5.5. Results
Supplementary Materials
Acknowledgments
Author Contributions
Conflicts of Interest
References
- Counihan, J.L.; Ford, B.; Nomura, D.K. Mapping proteome-wide interactions of reactive chemicals using chemoproteomic platforms. Curr. Opin. Chem. Biol. 2016, 30, 68–76. [Google Scholar] [CrossRef] [PubMed]
- Liu, Z.P.; Chen, L. Proteome-wide prediction of protein–protein interactions from high-throughput data. Protein Cell 2012, 3, 508–520. [Google Scholar] [CrossRef] [PubMed]
- Tuncbag, N.; Gursoy, A.; Nussinov, R.; Keskin, O. Predicting protein–protein interactions on a proteome scale by matching evolutionary and structural similarities at interfaces using PRISM. Nat. Protoc. 2011, 6, 1341–1354. [Google Scholar] [CrossRef] [PubMed]
- Nishi, H.; Tyagi, M.; Teng, S.; Shoemaker, B.A.; Hashimoto, K.; Alexov, E.; Wuchty, S.; Panchenko, A.R. Cancer missense mutations alter binding properties of proteins and their interaction networks. PLoS ONE 2013, 8, e66273. [Google Scholar]
- Panchenko, A.R.; Babu, M.M. Editorial overview: Linking protein sequence and structural changes to function in the era of next-generation sequencing. Curr. Opin. Struct. Biol. 2015, 32, viii–x. [Google Scholar] [CrossRef] [PubMed]
- Nussinov, R.; Panchenko, A.R.; Przytycka, T. Physics approaches to protein interactions and gene regulation. Phys. Biol. 2011, 8, 030301. [Google Scholar] [CrossRef] [PubMed]
- Alexov, E. Protein–protein interactions. Curr. Pharm. Biotechnol. 2008, 9, 55–56. [Google Scholar] [CrossRef] [PubMed]
- Kucukkal, T.G.; Yang, Y.; Chapman, S.C.; Cao, W.; Alexov, E. Computational and experimental approaches to reveal the effects of single nucleotide polymorphisms with respect to disease diagnostics. Int. J. Mol. Sci. 2014, 15, 9670–9717. [Google Scholar] [CrossRef] [PubMed]
- Teng, S.; Madej, T.; Panchenko, A.; Alexov, E. Modeling effects of human single nucleotide polymorphisms on protein–protein interactions. Biophys. J. 2009, 96, 2178–2188. [Google Scholar] [CrossRef] [PubMed]
- Teng, S.; Michonova-Alexova, E.; Alexov, E. Approaches and resources for prediction of the effects of non-synonymous single nucleotide polymorphism on protein function and interactions. Curr. Pharm. Biotechnol. 2008, 9, 123–133. [Google Scholar] [CrossRef] [PubMed]
- Zhang, Z.; Miteva, M.A.; Wang, L.; Alexov, E. Analyzing effects of naturally occurring missense mutations. Comput. Math. Methods Med. 2012, 2012, 805827. [Google Scholar] [CrossRef] [PubMed]
- Pires, D.E.; Ascher, D.B.; Blundell, T.L. mCSM: Predicting the effects of mutations in proteins using graph-based signatures. Bioinformatics 2014, 30, 335–342. [Google Scholar] [CrossRef] [PubMed]
- Moal, I.H.; Moretti, R.; Baker, D.; Fernandez-Recio, J. Scoring functions for protein–protein interactions. Curr. Opin. Struct. Biol. 2013, 23, 862–867. [Google Scholar] [CrossRef] [PubMed]
- Ascher, D.B.; Jubb, H.C.; Pires, D.E.V.; Ochi, T.; Higueruelo, A.; Blundell, T.L. Protein–Protein Interactions: Structures and Druggability. In Multifaceted Roles of Crystallography in Modern Drug Discovery; Springer Netherlands: Amsterdam, The Netherlands, 2015. [Google Scholar]
- Alexov, E.; Sternberg, M. Understanding molecular effects of naturally occurring genetic differences. J. Mol. Biol. 2013, 425, 3911–3913. [Google Scholar] [CrossRef] [PubMed]
- Stefl, S.; Nishi, H.; Petukh, M.; Panchenko, A.R.; Alexov, E. Molecular mechanisms of disease-causing missense mutations. J. Mol. Biol. 2013, 425, 3919–3936. [Google Scholar] [CrossRef] [PubMed]
- Bash, P.A.; Singh, U.C.; Brown, F.K.; Langridge, R.; Kollman, P.A. Calculation of the relative change in binding free energy of a protein-inhibitor complex. Science 1987, 235, 574–576. [Google Scholar] [CrossRef] [PubMed]
- Petukh, M.; Li, M.; Alexov, E. Predicting binding free energy change caused by point mutations with knowledge-modified MM/PBSA method. PLoS Comput. Biol. 2015, 11, e1004276. [Google Scholar] [CrossRef] [PubMed]
- Li, M.; Petukh, M.; Alexov, E.; Panchenko, A.R. Predicting the impact of missense mutations on protein–protein binding affinity. J. Chem. Theory Comput. 2014, 10, 1770–1780. [Google Scholar] [CrossRef] [PubMed]
- Peng, Y.; Suryadi, J.; Yang, Y.; Kucukkal, T.G.; Cao, W.; Alexov, E. Mutations in the KDM5C ARID Domain and Their Plausible Association with Syndromic Claes-Jensen-Type Disease. Int. J. Mol. Sci. 2015, 16, 27270–27287. [Google Scholar] [CrossRef] [PubMed]
- Petukh, M.; Wu, B.; Stefl, S.; Smith, N.; Hyde-Volpe, D.; Wang, L.; Alexov, E. Chronic Beryllium Disease: Revealing the role of beryllium ion and small peptides binding to HLA-DP2. PLoS ONE 2014, 9, e111604. [Google Scholar] [CrossRef] [PubMed]
- Takano, K.; Liu, D.; Tarpey, P.; Gallant, E.; Lam, A.; Witham, S.; Alexov, E.; Chaubey, A.; Stevenson, R.E.; Schwartz, C.E.; et al. An X-linked channelopathy with cardiomegaly due to a CLIC2 mutation enhancing ryanodine receptor channel activity. Hum. Mol. Genet. 2012, 21, 4497–4507. [Google Scholar] [CrossRef] [PubMed]
- Witham, S.; Takano, K.; Schwartz, C.; Alexov, E. A missense mutation in CLIC2 associated with intellectual disability is predicted by in silico modeling to affect protein stability and dynamics. Proteins 2011, 79, 2444–2454. [Google Scholar] [CrossRef] [PubMed]
- Zhang, Z.; Norris, J.; Schwartz, C.; Alexov, E. In silico and in vitro investigations of the mutability of disease-causing missense mutation sites in spermine synthase. PLoS ONE 2011, 6, e20373. [Google Scholar] [CrossRef] [PubMed]
- Zhang, Z.; Teng, S.; Wang, L.; Schwartz, C.E.; Alexov, E. Computational analysis of missense mutations causing Snyder-Robinson syndrome. Hum. Mutat. 2010, 31, 1043–1049. [Google Scholar] [CrossRef] [PubMed]
- Kucukkal, T.G.; Petukh, M.; Li, L.; Alexov, E. Structural and physico-chemical effects of disease and non-disease nsSNPs on proteins. Curr. Opin. Struct. Biol. 2015, 32, 18–24. [Google Scholar] [CrossRef] [PubMed]
- Petukh, M.; Kucukkal, T.G.; Alexov, E. On human disease-causing amino acid variants: Statistical study of sequence and structural patterns. Hum. Mutat. 2015, 36, 524–534. [Google Scholar] [CrossRef] [PubMed]
- Peng, Y.; Alexov, E. Investigating the linkage between disease-causing amino acid variants and their effect on protein stability and binding. Proteins 2016, 84, 232–239. [Google Scholar] [CrossRef] [PubMed]
- Moal, I.H.; Fernandez-Recio, J. SKEMPI: A structural kinetic and energetic database of mutant protein interactions and its use in empirical models. Bioinformatics 2012, 28, 2600–2607. [Google Scholar] [CrossRef] [PubMed]
- Dehouck, Y.; Kwasigroch, J.M.; Rooman, M.; Gilis, D. BeAtMuSiC: Prediction of changes in protein–protein binding affinity on mutations. Nucleic Acids Res. 2013, 41, W333–W339. [Google Scholar] [CrossRef] [PubMed]
- Schymkowitz, J.; Borg, J.; Stricher, F.; Nys, R.; Rousseau, F.; Serrano, L. The FoldX web server: An online force field. Nucleic Acids Res. 2005, 33, W382–W388. [Google Scholar] [CrossRef] [PubMed]
- Khan, S.; Vihinen, M. Performance of protein stability predictors. Hum. Mutat. 2010, 31, 675–684. [Google Scholar] [CrossRef] [PubMed]
- Landrum, M.J.; Lee, J.M.; Benson, M.; Brown, G.; Chao, C.; Chitipiralla, S.; Gu, B.; Hart, J.; Hoffman, D.; Hoover, J.; et al. ClinVar: Public archive of interpretations of clinically relevant variants. Nucleic Acids Res. 2016, 44, D862–D868. [Google Scholar] [CrossRef] [PubMed]
- Landrum, M.J.; Lee, J.M.; Riley, G.R.; Jang, W.; Rubinstein, W.S.; Church, D.M.; Maglott, D.R. ClinVar: Public archive of relationships among sequence variation and human phenotype. Nucleic Acids Res. 2014, 42, D980–D985. [Google Scholar] [CrossRef] [PubMed]
- Papageorgiou, A.C.; Shapiro, R.; Acharya, K.R. Molecular recognition of human angiogenin by placental ribonuclease inhibitor—An X-ray crystallographic study at 2.0 A resolution. EMBO J. 1997, 16, 5162–5177. [Google Scholar] [CrossRef] [PubMed]
- Pan, L.; Deng, X.; Ding, D.; Leng, H.; Zhu, X.; Wang, Z. Association between the Angiogenin (ANG) K17I variant and amyotrophic lateral sclerosis risk in Caucasian: A meta-analysis. Neurol. Sci. 2015, 36, 2163–2168. [Google Scholar] [CrossRef] [PubMed]
- Higashida, K.; Tsukie, T.; Fukazawa, H.; Fujikura, M.; Ono, S. Immunohistochemical studies of angiogenin in the skin of patients with amyotrophic lateral sclerosis. J. Neurol. Sci. 2013, 326, 18–23. [Google Scholar] [CrossRef] [PubMed]
- Zou, Z.Y.; Wang, X.N.; Liu, M.S.; Sun, Q.; Li, X.G.; Cui, L.Y.; Kong, J. Identification of a novel missense mutation in angiogenin in a Chinese amyotrophic lateral sclerosis cohort. Amyotroph. Lateral Scler. 2012, 13, 270–275. [Google Scholar] [CrossRef] [PubMed]
- Dalby, A.R.; Tolan, D.R.; Littlechild, J.A. The structure of human liver fructose-1,6-bisphosphate aldolase. Acta Crystallogr. D Biol. Crystallogr. 2001, 57, 1526–1533. [Google Scholar] [CrossRef] [PubMed]
- Coffee, E.M.; Tolan, D.R. Mutations in the promoter region of the aldolase B gene that cause hereditary fructose intolerance. J. Inherit. Metab. Dis. 2010, 33, 715–725. [Google Scholar] [CrossRef] [PubMed]
- Davit-Spraul, A.; Costa, C.; Zater, M.; Habes, D.; Berthelot, J.; Broue, P.; Feillet, F.; Bernard, O.; Labrune, P.; Baussan, C. Hereditary fructose intolerance: Frequency and spectrum mutations of the aldolase B gene in a large patients cohort from France—Identification of eight new mutations. Mol. Genet. Metab. 2008, 94, 443–447. [Google Scholar] [CrossRef] [PubMed]
- Gruchota, J.; Pronicka, E.; Korniszewski, L.; Stolarski, B.; Pollak, A.; Rogaszewska, M.; Ploski, R. Aldolase B mutations and prevalence of hereditary fructose intolerance in a Polish population. Mol. Genet. Metab. 2006, 87, 376–378. [Google Scholar] [CrossRef] [PubMed]
- Berman, H.; Henrick, K.; Nakamura, H.; Markley, J.L. The worldwide Protein Data Bank (wwPDB): Ensuring a single, uniform archive of PDB data. Nucleic Acids Res. 2007, 35, D301–D303. [Google Scholar] [CrossRef] [PubMed]


| Type of Mutaton and Mutation Site Location | Pearson Correlation Coefficient (R) | y-Intercept | Slope |
|---|---|---|---|
| Large-to-Small (173) | 0.489 | 0.328 | 0.692 |
| ALA-scanning (577) | 0.488 | 0.268 | 0.695 |
| COR, SUP (807) | 0.461 | 0.351 | 0.813 |
| RIM, SUR, INT (518) | 0.478 | −0.024 | 1.023 |
| ALL (1326) | 0.624 (0.716 ±2SD, 0.603 CV) | 1 | −2.31 × 10⁻⁵ |
| WT Residue | Position | MT Residue | Effect | ΔΔΔG | Location |
|---|---|---|---|---|---|
| Q | 36 | L | Disease | 0.00 | SUP |
| Y | 38 | H | Disease | −0.42 | INT |
| K | 41 | E | Disease | 1.04 | SUR |
| K | 41 | I | Disease | 0.29 | SUR |
| D | 46 | G | Disease | −1.25 | SUR |
| S | 52 | N | Disease | 0.00 | RIM-COR |
| R | 55 | K | Disease | 1.29 | COR |
| C | 63 | W | Disease | 0.07 | INT-SUP |
| K | 64 | I | Disease | 4.50 | COR |
| I | 70 | V | Unclassified | 0.42 | INT |
| K | 84 | E | Polymorphism | 0.81 | SUR |
| P | 136 | L | Disease | −0.06 | INT |
| V | 137 | I | Disease | 0.79 | SUP |
| H | 138 | R | Disease | −1.32 | COR |
| WT Residue | Position | MT Residue | Effect | ΔΔΔG(A) | ΔΔΔG(B) | ΔΔΔG(A + B) |
|---|---|---|---|---|---|---|
| I | 74 | T | Disease | 0.50 | 0.29 | 0.79 |
| R | 134 | S | Polymorphism | 0.32 | 0.64 | 0.96 |
| C | 135 | R | Disease | 0.48 | 0.01 | 0.48 |
| W | 148 | R | Unclassified | 0.13 | 0.74 | 0.88 |
| A | 150 | P | Disease | 0.52 | 0.74 | 1.27 |
| A | 175 | D | Disease | 0.56 | 0.52 | 1.08 |
| C | 178 | R | Disease | 0.46 | 0.00 | 0.46 |
| P | 185 | R | Disease | 0.03 | −0.01 | 0.03 |
| E | 207 | Q | Polymorphism | 0.35 | 0.15 | 0.49 |
| V | 222 | F | Disease | 0.32 | 0.61 | 0.93 |
| L | 229 | P | Disease | 0.86 | 0.85 | 1.72 |
| L | 257 | P | Disease | 0.80 | 0.69 | 1.49 |
| I | 268 | N | Polymorphism | 0.42 | 0.54 | 0.96 |
| L | 284 | P | Disease | 0.85 | 0.85 | 1.69 |
| R | 304 | Q | Disease | 0.39 | 0.22 | 0.61 |
| R | 304 | W | Disease | 0.27 | 0.24 | 0.52 |
| N | 335 | K | Disease | -0.12 | 0.00 | −0.12 |
| A | 338 | V | Disease | 0.20 | 0.07 | 0.27 |
| Location | Interface | Solvent Exposure | rSASAm | rSASAc | ΔrSASA |
|---|---|---|---|---|---|
| COR | Yes | No | >25% | <25% | >0 |
| SUP | Yes | No | <25% | <25% | >0 |
| RIM | Yes | Yes | any | >25% | >0 |
| INT | No | No | any | <25% | =0 |
| SUR | No | Yes | any | >25% | =0 |
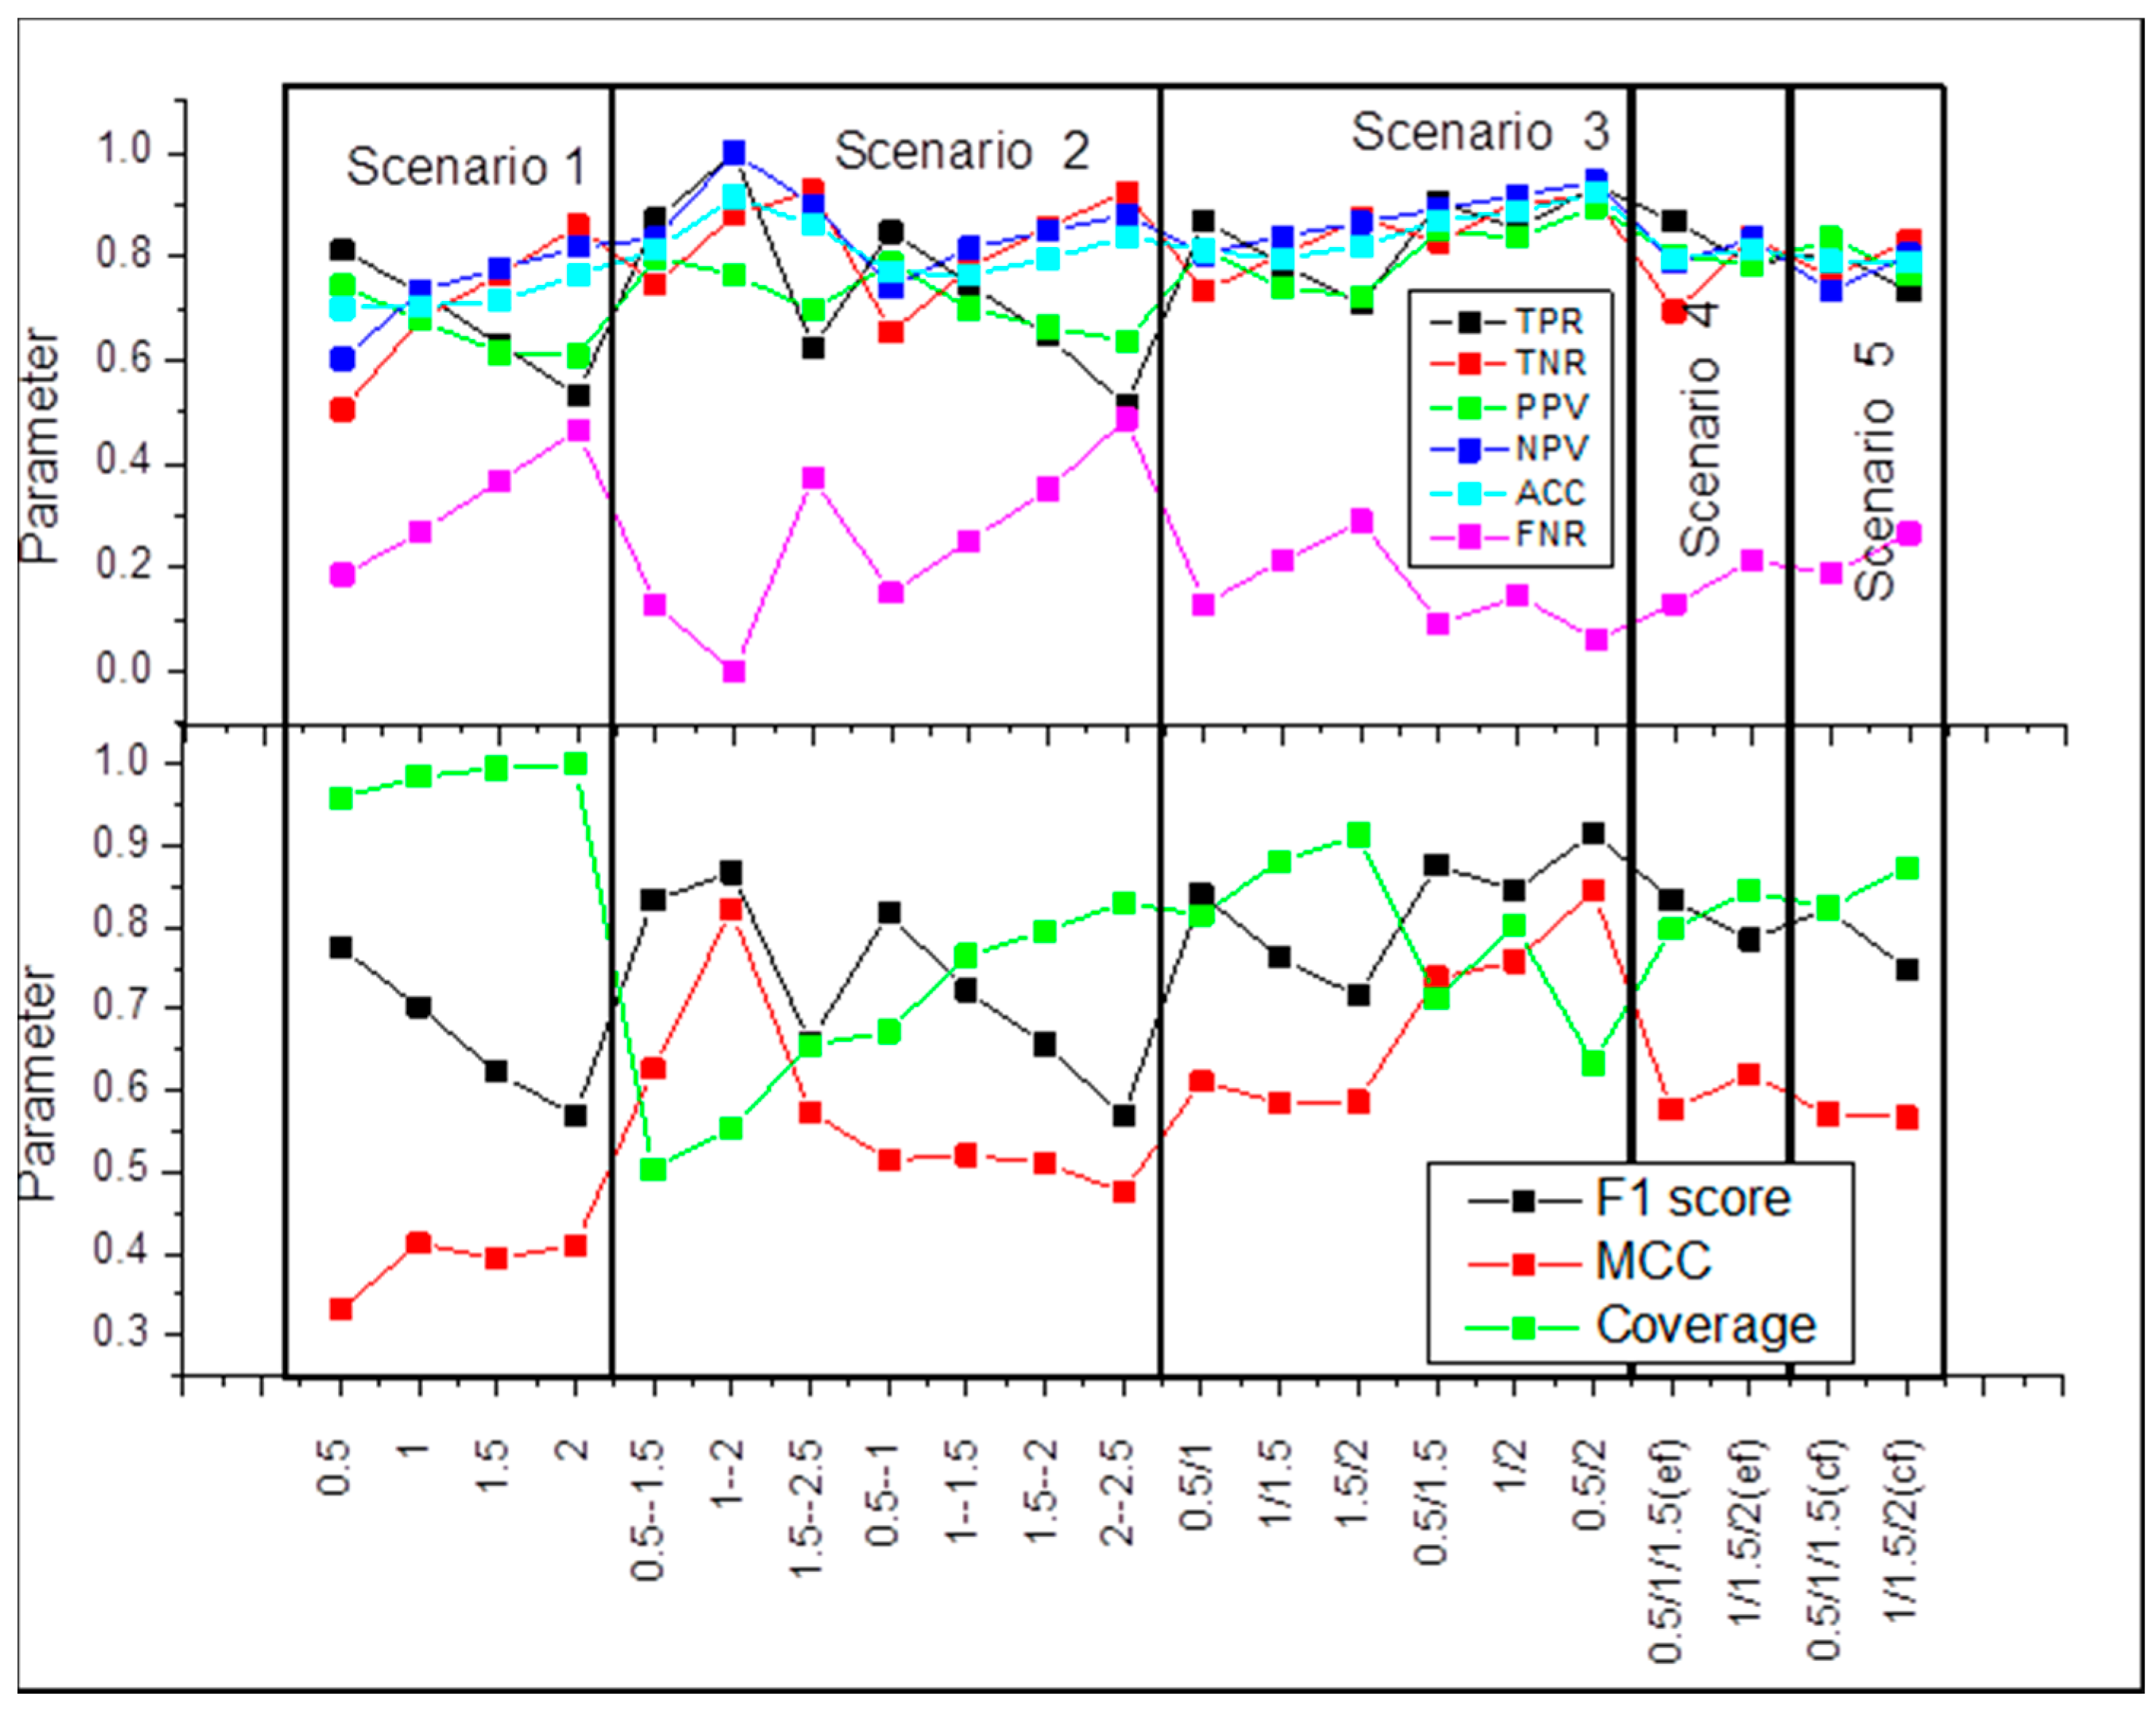
| ROC Parameters | Scenario 1 | Scenario 2 | Scenario 3 | Scenario 4 | Scenario 5 |
|---|---|---|---|---|---|
| tp | A ≥ x, B ≥ x, sign(A) = sign(B) | A ≥ y, B ≥ y, sign(A) = sign(B) | A ≥ x, B ≥ y, sign(A) = sign(B) | A ≥ x, B ≥ y, sign(A) = sign(B) | A ≥ y, B ≥ x, sign(A) = sign(B) |
| tn | A < x, B < x | A < x, B < x | A < y, B < x | A < z, B < y | A < y, B < z |
| fp | A ≥ x, B < x | A ≥ y, B < x | A ≥ y, B < x | A ≥ x, B < y | A ≥ y, B < z |
| fn | A < x, B ≥ x | A < x, B ≥ y | A < x, B ≥ y | A < z, B ≥ y | A < y, B ≥ x |
| example | 0.5 | 0.5–1 | 0.5/1.5 | 0.5/1/1.5 (ef) | 0.5/1/1.5 (cf) |
| parameter values | x = 0.5 | x = 0.5, y = 1 | x = 0.5, y = 1 | x = 0.5, y = 1, z = 1.5 | x = 0.5, y = 1, z = 1.5 |
© 2016 by the authors; licensee MDPI, Basel, Switzerland. This article is an open access article distributed under the terms and conditions of the Creative Commons by Attribution (CC-BY) license (http://creativecommons.org/licenses/by/4.0/).
Share and Cite
Petukh, M.; Dai, L.; Alexov, E. SAAMBE: Webserver to Predict the Charge of Binding Free Energy Caused by Amino Acids Mutations. Int. J. Mol. Sci. 2016, 17, 547. https://doi.org/10.3390/ijms17040547
Petukh M, Dai L, Alexov E. SAAMBE: Webserver to Predict the Charge of Binding Free Energy Caused by Amino Acids Mutations. International Journal of Molecular Sciences. 2016; 17(4):547. https://doi.org/10.3390/ijms17040547
Chicago/Turabian StylePetukh, Marharyta, Luogeng Dai, and Emil Alexov. 2016. "SAAMBE: Webserver to Predict the Charge of Binding Free Energy Caused by Amino Acids Mutations" International Journal of Molecular Sciences 17, no. 4: 547. https://doi.org/10.3390/ijms17040547