
Genome-Wide Mapping of Growth-Related Quantitative Trait Loci in Orange-Spotted Grouper (Epinephelus coioides) Using Double Digest Restriction-Site Associated DNA Sequencing (ddRADseq)


Abstract
:
1. Introduction
2. Results
2.1. Sequencing and Genotyping
2.2. Genetic Linkage Map
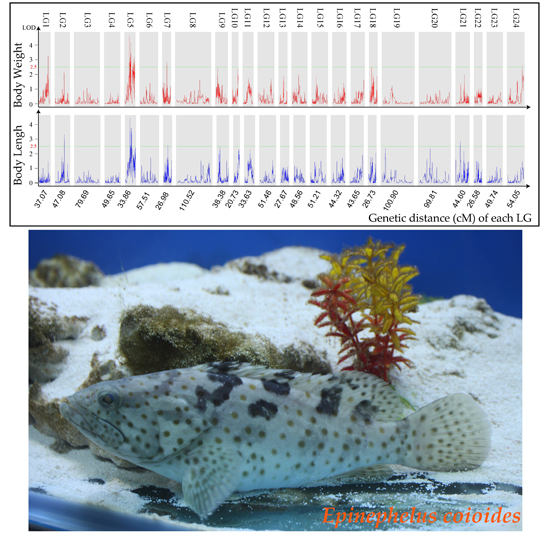
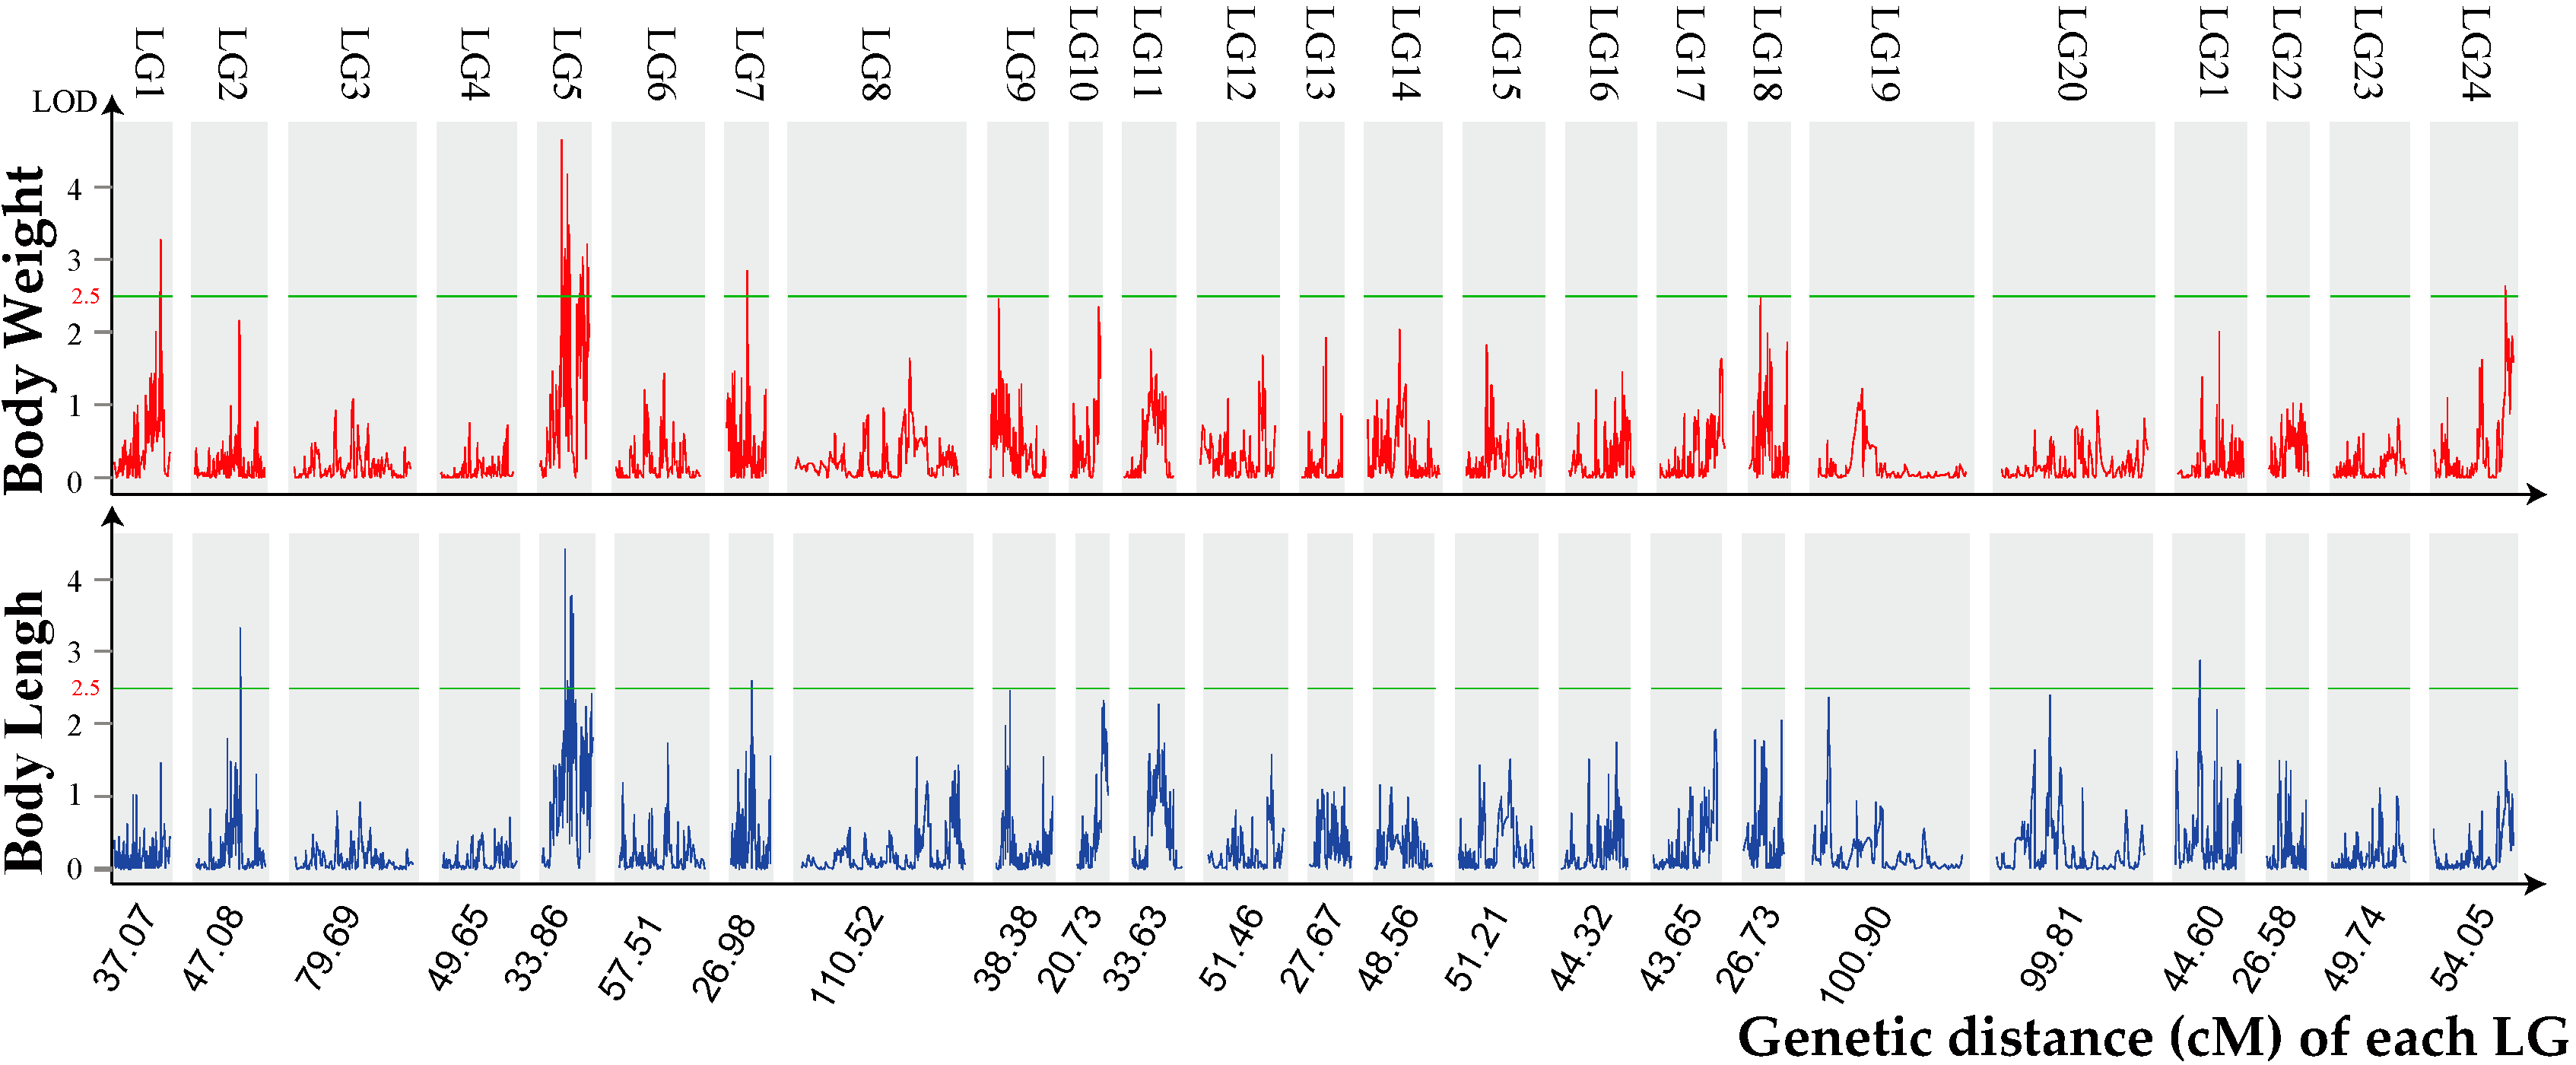
2.3. Growth Trait–Associated Quantitative Trait Loci (QTL) and Related Genes
3. Discussion
4. Materials and Methods
4.1. Sample Preparation
4.2. ddRAD Library Construction and Sequencing
4.3. SNP (Single-Nucleotide Polymorphism) Calling and Genotyping
4.4. High-Density Genetic Map Construction
4.5. QTL Mapping
4.6. Identification of the Genes on Growth Traits Associated QTLs
5. Conclusions
Supplementary Materials
Acknowledgments
Author Contributions
Conflicts of Interest
References
- Nelson, J.S. Fishes of the World; John Wiley and Sons, Inc.: New York, NY, USA, 1994. [Google Scholar]
- Wang, Y.D.; Huang, S.J.; Chou, H.N.; Liao, W.L.; Gong, H.Y.; Chen, J.Y. Transcriptome analysis of the effect of Vibrio alginolyticus infection on the innate immunity-related complement pathway in Epinephelus coioides. BMC Genom. 2014, 15. [Google Scholar] [CrossRef] [PubMed]
- Yue, G.H. Recent advances of genome mapping and marker-assisted selection in aquaculture. Fish Fish. 2014, 15, 376–396. [Google Scholar] [CrossRef]
- Eshel, O.; Shirak, A.; Weller, J.I.; Hulata, G.; Ron, M. Linkage and physical mapping of sex region on LG23 of nile tilapia (Oreochromis niloticus). G3 Bethesda 2012, 2, 35–42. [Google Scholar] [CrossRef] [PubMed]
- Tsai, H.Y.; Hamilton, A.; Guy, D.R.; Tinch, A.E.; Bishop, S.C.; Houston, R.D. The genetic architecture of growth and fillet traits in farmed Atlantic salmon (Salmo salar). BMC Genet. 2015, 16. [Google Scholar] [CrossRef] [PubMed]
- Liu, S.; Vallejo, R.L.; Gao, G.; Palti, Y.; Weber, G.M.; Hernandez, A.; Rexroad, C.E., 3rd. Identification of single-nucleotide polymorphism markers associated with cortisol response to crowding in rainbow trout. Mar. Biotechnol. 2015, 17, 328–337. [Google Scholar] [CrossRef] [PubMed]
- Geng, X.; Sha, J.; Liu, S.; Bao, L.; Zhang, J.; Wang, R.; Yao, J.; Li, C.; Feng, J.; Sun, F.; et al. A genome-wide association study in catfish reveals the presence of functional hubs of related genes within QTLs for columnaris disease resistance. BMC Genom. 2015, 16. [Google Scholar] [CrossRef] [PubMed]
- Liu, Q.; Sakamoto, T.; Kubota, S.; Okamoto, N.; Yamashita, H.; Takagi, M.; Shigenobu, Y.; Sugaya, T.; Nakamura, Y.; Sano, M.; et al. A genetic linkage map of kelp grouper (Epinephelus bruneus) based on microsatellite markers. Aquaculture 2013, 414–415, 63–81. [Google Scholar] [CrossRef]
- Dor, L.; Shirak, A.; Gorshkov, S.; Band, M.R.; Korol, A.; Ronin, Y.; Curzon, A.; Hulata, G.; Seroussi, E.; Ron, M. Construction of a microsatellites-based linkage map for the white grouper (Epinephelus aeneus). G3 Bethesda 2014, 4, 1455–1464. [Google Scholar] [CrossRef] [PubMed]
- Bourgeois, Y.X.; Lhuillier, E.; Cezard, T.; Bertrand, J.A.; Delahaie, B.; Cornuault, J.; Duval, T.; Bouchez, O.; Mila, B.; Thebaud, C. Mass production of SNP markers in a nonmodel passerine bird through RAD sequencing and contig mapping to the zebra finch genome. Mol. Ecol. Resour. 2013, 13, 899–907. [Google Scholar] [CrossRef] [PubMed]
- Stolting, K.N.; Nipper, R.; Lindtke, D.; Caseys, C.; Waeber, S.; Castiglione, S.; Lexer, C. Genomic scan for single nucleotide polymorphisms reveals patterns of divergence and gene flow between ecologically divergent species. Mol. Ecol. 2013, 22, 842–855. [Google Scholar] [CrossRef] [PubMed]
- Wang, J.; Luo, M.C.; Chen, Z.; You, F.M.; Wei, Y.; Zheng, Y.; Dvorak, J. Aegilops tauschii single nucleotide polymorphisms shed light on the origins of wheat D-genome genetic diversity and pinpoint the geographic origin of hexaploid wheat. New Phytol. 2013, 198, 925–937. [Google Scholar] [CrossRef] [PubMed]
- Davey, J.W.; Hohenlohe, P.A.; Etter, P.D.; Boone, J.Q.; Catchen, J.M.; Blaxter, M.L. Genome-wide genetic marker discovery and genotyping using next-generation sequencing. Nat. Rev. Genet. 2011, 12, 499–510. [Google Scholar] [CrossRef] [PubMed]
- You, X.; Shu, L.; Li, S.; Chen, J.; Luo, J.; Lu, J.; Mu, Q.; Bai, J.; Xia, Q.; Chen, Q.; et al. Construction of high-density genetic linkage maps for orange-spotted grouper Epinephelus coioides using multiplexed shotgun genotyping. BMC Genet. 2013, 14. [Google Scholar] [CrossRef] [PubMed]
- Ding, S.-X.; Wang, S.; Wang, D.; Wang, J. Analysis of the karyotype of Epinephalus coioides. J. Xiamen Univ. Nat. Sci. 2004, 43, 428. [Google Scholar]
- Peterson, B.K.; Weber, J.N.; Kay, E.H.; Fisher, H.S.; Hoekstra, H.E. Double digest RADseq: An inexpensive method for de novo SNP discovery and genotyping in model and non-model species. PLoS ONE 2012, 7, e37135. [Google Scholar] [CrossRef] [PubMed]
- Kai, W.; Nomura, K.; Fujiwara, A.; Nakamura, Y.; Yasuike, M.; Ojima, N.; Masaoka, T.; Ozaki, A.; Kazeto, Y.; Gen, K.; et al. A ddRAD-based genetic map and its integration with the genome assembly of Japanese eel (Anguilla japonica) provides insights into genome evolution after the teleost-specific genome duplication. BMC Genom. 2014, 15. [Google Scholar] [CrossRef] [PubMed]
- Zhou, X.; Xia, Y.; Ren, X.; Chen, Y.; Huang, L.; Huang, S.; Liao, B.; Lei, Y.; Yan, L.; Jiang, H. Construction of a SNP-based genetic linkage map in cultivated peanut based on large scale marker development using next-generation double-digest restriction-site-associated DNA sequencing (ddRADseq). BMC Genom. 2014, 15. [Google Scholar] [CrossRef] [PubMed]
- Pukk, L.; Ahmad, F.; Hasan, S.; Kisand, V.; Gross, R.; Vasemagi, A. Less is more: Extreme genome complexity reduction with ddRAD using Ion Torrent semiconductor technology. Mol. Ecol. Resour. 2015, 15, 1145–1152. [Google Scholar] [CrossRef] [PubMed]
- Alon, S.; Vigneault, F.; Eminaga, S.; Christodoulou, D.C.; Seidman, J.G.; Church, G.M.; Eisenberg, E. Barcoding bias in high-throughput multiplex sequencing of miRNA. Genome Res. 2011, 21, 1506–1511. [Google Scholar] [CrossRef] [PubMed] [Green Version]
- Craig, D.W.; Pearson, J.V.; Szelinger, S.; Sekar, A.; Redman, M.; Corneveaux, J.J.; Pawlowski, T.L.; Laub, T.; Nunn, G.; Stephan, D.A.; et al. Identification of genetic variants using bar-coded multiplexed sequencing. Nat. Methods 2008, 5, 887–893. [Google Scholar] [CrossRef] [PubMed]
- Andolfatto, P.; Davison, D.; Erezyilmaz, D.; Hu, T.T.; Mast, J.; Sunayama-Morita, T.; Stern, D.L. Multiplexed shotgun genotyping for rapid and efficient genetic mapping. Genome Res. 2011, 21, 610–617. [Google Scholar] [CrossRef] [PubMed]
- Palaiokostas, C.; Bekaert, M.; Khan, M.G.; Taggart, J.B.; Gharbi, K.; McAndrew, B.J.; Penman, D.J. A novel sex-determining QTL in Nile tilapia (Oreochromis niloticus). BMC Genom. 2015, 16. [Google Scholar] [CrossRef] [PubMed]
- Recknagel, H.; Elmer, K.R.; Meyer, A. A hybrid genetic linkage map of two ecologically and morphologically divergent Midas cichlid fishes (Amphilophus spp.) obtained by massively parallel DNA sequencing (ddRADSeq). G3 Bethesda 2013, 3, 65–74. [Google Scholar] [CrossRef] [PubMed]
- Franchini, P.; Fruciano, C.; Spreitzer, M.L.; Jones, J.C.; Elmer, K.R.; Henning, F.; Meyer, A. Genomic architecture of ecologically divergent body shape in a pair of sympatric crater lake cichlid fishes. Mol. Ecol. 2014, 23, 1828–1845. [Google Scholar] [CrossRef] [PubMed]
- Sharma, R.; Goossens, B.; Kun-Rodrigues, C.; Teixeira, T.; Othman, N.; Boone, J.Q.; Jue, N.K.; Obergfell, C.; O’Neill, R.J.; Chikhi, L. Two different high throughput sequencing approaches identify thousands of de novo genomic markers for the genetically depleted Bornean elephant. PLoS ONE 2012, 7, e49533. [Google Scholar] [CrossRef] [PubMed]
- Everett, M.V.; Seeb, J.E. Detection and mapping of QTL for temperature tolerance and body size in Chinook salmon (Oncorhynchus tshawytscha) using genotyping by sequencing. Evol. Appl. 2014, 7, 480–492. [Google Scholar] [CrossRef] [PubMed]
- Moghadam, H.K.; Poissant, J.; Fotherby, H.; Haidle, L.; Ferguson, M.M.; Danzmann, R.G. Quantitative trait loci for body weight, condition factor and age at sexual maturation in Arctic charr (Salvelinus alpinus): Comparative analysis with rainbow trout (Oncorhynchus mykiss) and Atlantic salmon (Salmo salar). Mol. Genet. Genom. 2007, 277, 647–661. [Google Scholar] [CrossRef] [PubMed]
- Kuttner, E.; Moghadam, H.K.; Skulason, S.; Danzmann, R.G.; Ferguson, M.M. Genetic architecture of body weight, condition factor and age of sexual maturation in Icelandic Arctic charr (Salvelinus alpinus). Mol. Genet. Genom. 2011, 286, 67–79. [Google Scholar] [CrossRef] [PubMed]
- Kessuwan, K.; Kubota, S.; Liu, Q.; Sano, M.; Okamoto, N.; Sakamoto, T.; Yamashita, H.; Nakamura, Y.; Ozaki, A. Detection of growth-related quantitative trait loci and high-resolution genetic linkage maps using simple sequence repeat markers in the kelp grouper (Epinephelus bruneus). Mar. Biotechnol. 2016, 18, 57–84. [Google Scholar] [CrossRef] [PubMed]
- Guo, L.; Xia, J.; Yang, S.; Li, M.; You, X.; Meng, Z.; Lin, H. GHRH, PRP-PACAP and GHRHR target sequencing via an Ion Torrent personal genome machine reveals an association with growth in orange-spotted grouper (Epinephelus coioides). Int. J. Mol. Sci. 2015, 16, 26137–26150. [Google Scholar] [CrossRef] [PubMed]
- Zhang, Y. Sun Yat-Sen University. Personal data. 2016.
- Akerberg, A.A.; Stewart, S.; Stankunas, K. Spatial and temporal control of transgene expression in zebrafish. PLoS ONE 2014, 9, e92217. [Google Scholar] [CrossRef] [PubMed]
- Cao, J.; Chen, J.; Jiang, Z.; Luo, Y.; Gan, X. Molecular cloning and expression analysis of FTZ-F1 in the GIFT tilapia, Oreochromis niloticus. Zool. Res. 2012, 33, E40–E46. [Google Scholar] [PubMed]
- Lopez de Abechuco, E.; Bilbao, E.; Soto, M.; Diez, G. Molecular cloning and measurement of telomerase reverse transcriptase (TERT) transcription patterns in tissues of European hake (Merluccius merluccius) and Atlantic cod (Gadus morhua) during aging. Gene 2014, 541, 8–18. [Google Scholar] [CrossRef] [PubMed]
- Renan, X.; Trejo-Martinez, J.; Caballero-Arango, D.; Brule, T. Growth stanzas in an Epinephelidae–Lutjanidae complex: Considerations to length-weight relationships. Rev. Biol. Trop. 2015, 63, 175–187. [Google Scholar] [CrossRef] [PubMed]
- Zhang, W.; Zhang, Y.; Zhang, L.; Zhao, H.; Li, X.; Huang, H.; Lin, H. The mRNA expression of P450 aromatase, gonadotropin beta-subunits and FTZ-F1 in the orange-spotted grouper (Epinephelus Coioides) during 17α-methyltestosterone-induced precocious sex change. Mol. Reprod. Dev. 2007, 74, 665–673. [Google Scholar] [CrossRef] [PubMed]
- Peterson, D.R.; Mok, H.O.; Au, D.W. Modulation of telomerase activity in fish muscle by biological and environmental factors. Comp. Biochem. Physiol. Toxicol. Pharmacol. 2015, 178, 51–59. [Google Scholar] [CrossRef] [PubMed]
- Song, W.; Pang, R.; Niu, Y.; Gao, F.; Zhao, Y.; Zhang, J.; Sun, J.; Shao, C.; Liao, X.; Wang, L.; et al. Construction of high-density genetic linkage maps and mapping of growth-related quantitative trail loci in the Japanese flounder (Paralichthys olivaceus). PLoS ONE 2012, 7, e50404. [Google Scholar] [CrossRef] [PubMed]
- Li, R.; Li, Y.; Fang, X.; Yang, H.; Wang, J.; Kristiansen, K.; Wang, J. SNP detection for massively parallel whole-genome resequencing. Genome Res. 2009, 19, 1124–1132. [Google Scholar] [CrossRef] [PubMed] [Green Version]
- Ao, J.; Li, J.; You, X.; Mu, Y.; Ding, Y.; Mao, K.; Bian, C.; Mu, P.; Shi, Q.; Chen, X. Construction of the high-density genetic linkage map and chromosome map of large yellow croaker (Larimichthys crocea). Int. J. Mol. Sci. 2015, 16, 26237–26248. [Google Scholar] [CrossRef] [PubMed]
- Shao, C.; Niu, Y.; Rastas, P.; Liu, Y.; Xie, Z.; Li, H.; Wang, L.; Jiang, Y.; Tai, S.; Tian, Y.; et al. Genome-wide SNP identification for the construction of a high-resolution genetic map of Japanese flounder (Paralichthys olivaceus): Applications to QTL mapping of Vibrio anguillarum disease resistance and comparative genomic analysis. DNA Res. 2015, 22, 161–170. [Google Scholar] [CrossRef] [PubMed]
- Silva Lda, C.; Wang, S.; Zeng, Z.B. Composite interval mapping and multiple interval mapping: Procedures and guidelines for using Windows QTL Cartographer. Methods Mol. Biol. 2012, 871, 75–119. [Google Scholar] [PubMed]
- Mei, Q.; Liu, J.; Liu, Y.; Li, C.; Wang, H.; Li, H.; Chen, X.; Lan, X. Expression of proline-rich coiled-coil 2B protein in developing rat brains. Neurosci. Lett. 2013. [Google Scholar] [CrossRef] [PubMed]
- Su, J.; Ekman, C.; Oskolkov, N.; Lahti, L.; Strom, K.; Brazma, A.; Groop, L.; Rung, J.; Hansson, O. A novel atlas of gene expression in human skeletal muscle reveals molecular changes associated with aging. Skelet. Muscle 2015, 5. [Google Scholar] [CrossRef] [PubMed]
- Dai, Z.; Aryal, U.K.; Shukla, A.; Qian, W.J.; Smith, R.D.; Magnuson, J.K.; Adney, W.S.; Beckham, G.T.; Brunecky, R.; Himmel, M.E.; et al. Impact of alg3 gene deletion on growth, development, pigment production, protein secretion, and functions of recombinant Trichoderma reesei cellobiohydrolases in Aspergillus niger. Fungal Genet. Biol. 2013, 61, 120–132. [Google Scholar] [CrossRef] [PubMed]
- Pan, H.; Mzhavia, N.; Devi, L.A. Endothelin converting enzyme-2: A processing enzyme involved in the generation of novel neuropeptides. Protein Pept. Lett. 2004, 11, 461–469. [Google Scholar] [CrossRef] [PubMed]
- Miners, J.S.; Palmer, J.C.; Love, S. Pathophysiology of hypoperfusion of the precuneus in early Alzheimer’s disease. Brain Pathol. 2015. [Google Scholar] [CrossRef] [PubMed]
- Yanagisawa, H.; Hammer, R.E.; Richardson, J.A.; Emoto, N.; Williams, S.C.; Takeda, S.; Clouthier, D.E.; Yanagisawa, M. Disruption of ECE-1 and ECE-2 reveals a role for endothelin-converting enzyme-2 in murine cardiac development. J. Clin. Investig. 2000, 105, 1373–1382. [Google Scholar] [CrossRef] [PubMed]
- Sim, K.; Chan, W.Y.; Woon, P.S.; Low, H.Q.; Lim, L.; Yang, G.L.; Lee, J.; Chong, S.A.; Sitoh, Y.Y.; Chan, Y.H.; et al. ARVCF genetic influences on neurocognitive and neuroanatomical intermediate phenotypes in Chinese patients with schizophrenia. J. Clin. Psychiatry 2012, 73, 320–326. [Google Scholar] [CrossRef] [PubMed]
- Xu, Z.Y.; Xiong, Y.Z.; Lei, M.G.; Li, F.E.; Zuo, B. Genetic polymorphisms and preliminary association analysis with production traits of the porcine SLC27A4 gene. Mol. Biol. Rep. 2009, 36, 1427–1432. [Google Scholar] [CrossRef] [PubMed]
- Tactacan, C.M.; Phua, Y.W.; Liu, L.; Zhang, L.; Humphrey, E.S.; Cowley, M.; Pinese, M.; Biankin, A.V.; Daly, R.J. The pseudokinase SgK223 promotes invasion of pancreatic ductal epithelial cells through JAK1/Stat3 signaling. Mol. Cancer 2015, 14. [Google Scholar] [CrossRef] [PubMed]
- Sugawara, K.; Fujikawa, M.; Yoshida, M. Screening of protein kinase inhibitors and knockdown experiments identified four kinases that affect mitochondrial ATP synthesis activity. FEBS Lett. 2013, 587, 3843–3847. [Google Scholar] [CrossRef] [PubMed]
- Chaki, S.; Shimazaki, T.; Nishiguchi, M.; Funakoshi, T.; Iijima, M.; Ito, A.; Kanuma, K.; Sekiguchi, Y. Antidepressant/anxiolytic potential and adverse effect liabilities of melanin-concentrating hormone receptor 1 antagonists in animal models. Pharmacol. Biochem. Behav. 2015, 135, 154–168. [Google Scholar] [CrossRef] [PubMed]
- Sherwood, A.; Holland, P.C.; Adamantidis, A.; Johnson, A.W. Deletion of Melanin Concentrating Hormone Receptor-1 disrupts overeating in the presence of food cues. Physiol. Behav. 2015, 152, 402–407. [Google Scholar] [CrossRef] [PubMed]
- Green, T.; Chen, X.; Ryan, S.; Asch, A.S.; Ruiz-Echevarria, M.J. TMEFF2 and SARDH cooperate to modulate one-carbon metabolism and invasion of prostate cancer cells. Prostate 2013, 73, 1561–1575. [Google Scholar] [CrossRef] [PubMed]
- Conover, C.A.; Bale, L.K.; Marler, R.J. Pregnancy-associated plasma protein-A deficiency improves survival of mice on a high fat diet. Exp. Gerontol. 2015, 70, 131–134. [Google Scholar] [CrossRef] [PubMed]
- Cheuk, Q.K.; Lo, T.K.; Wong, S.F.; Lee, C.P. Association between pregnancy-associated plasma protein-A levels in the first trimester and gestational diabetes mellitus in Chinese women. Hong Kong Med. J. 2016, 22, 30–38. [Google Scholar] [PubMed]
- Hancerliogullari, N.; Aktulay, A.; Engin-Ustun, Y.; Ozkan, M.S.; Oksuzoglu, A.; Danisman, N. Pregnancy-associated plasma protein a levels are decreased in obstetric cholestasis. Clin. Exp. Obstet. Gynecol. 2015, 42, 617–618. [Google Scholar] [PubMed]
- Wu, N.L.; Huang, D.Y.; Wang, L.F.; Kannagi, R.; Fan, Y.C.; Lin, W.W. Spleen tyrosine kinase mediates EGFR signaling to regulate keratinocyte terminal differentiation. J. Investig. Dermatol. 2016, 136, 192–201. [Google Scholar] [CrossRef] [PubMed]
- Lorenz, J.; Waldschmidt, J.; Wider, D.; Follo, M.; Ihorst, G.; Chatterjee, M.; May, A.M.; Duyster, J.; Rosenwald, A.; Wasch, R.; et al. From CLL to Multiple Myeloma—Spleen Tyrosine Kinase (SYK) influences multiple myeloma cell survival and migration. Br. J. Haematol. 2015. [Google Scholar] [CrossRef] [PubMed]
- Nakano, K.; Ando, H.; Kurokawa, S.; Hosohata, K.; Ushijima, K.; Takada, M.; Tateishi, M.; Yonezawa, A.; Masuda, S.; Matsubara, K.; et al. Association of decreased mRNA expression of multidrug and toxin extrusion protein 1 in peripheral blood cells with the development of flutamide-induced liver injury. Cancer Chemother. Pharmacol. 2015, 75, 1191–1197. [Google Scholar] [CrossRef] [PubMed]


| QTL | Trait | Genetic Position(cM) | Logarithm of Odds (LOD) | R2 (%) |
|---|---|---|---|---|
| qLG1 | BW | 30.8–31.0 | 3.3 | 19.6 |
| qLG2 | BL | 29.8–30.2 | 3.3 | 21 |
| qLG5_1 | BW | 15.1–15.6 | 4.7 | 24.3 |
| qLG5_2 | BW | 17.0–17.5 | 3.1 | 17.1 |
| qLG5_3 | BW | 17.0–17.5 | 2.8 | 16.5 |
| qLG5_4 | BW | 17.8–18.0 | 2.9 | 15.8 |
| qLG5_5 | BW | 18.7–19.4 | 3.2 | 19.1 |
| qLG5_6 | BW | 18.7–19.4 | 4.2 | 24.6 |
| qLG5_7 | BW | 19.9–20.2 | 3.5 | 20.8 |
| qLG5_8 | BW | 20.4–20.8 | 3.4 | 20 |
| qLG5_9 | BW | 27.4–27.9 | 2.6 | 21.5 |
| qLG5_10 | BW | 27.4–27.9 | 2.8 | 24.5 |
| qLG5_11 | BW | 28.1–28.3 | 2.8 | 28.3 |
| qLG5_12 | BW | 29.4–29.7 | 2.7 | 14.6 |
| qLG5_13 | BW | 29.4–29.7 | 3 | 29.1 |
| qLG5_14 | BW | 32.2–32.4 | 3.2 | 17.6 |
| qLG5_15 | BW | 33.0–33.3 | 2.9 | 15.6 |
| qLG5_16 | BL | 15.1–15.4 | 4.4 | 23.3 |
| qLG5_17 | BL | 17.0–17.1 | 2.6 | 14.5 |
| qLG5_18 | BL | 19.2–19.3 | 3.8 | 20.5 |
| qLG5_19 | BL | 19.9–20.2 | 3.4 | 20.3 |
| qLG5_20 | BL | 19.9–20.2 | 3.8 | 22.2 |
| qLG5_21 | BL | 20.4–20.8 | 3.5 | 20.8 |
| qLG7_1 | BW | 14.4–14.5 | 2.8 | 16.8 |
| qLG7_2 | BL | 14.4–14.5 | 2.6 | 15.1 |
| qLG21 | BL | 16.0–16.5 | 2.9 | 15.5 |
| qLG24 | BW | 48.8–49.0 | 2.6 | 14.4 |
| QTL | Gene ID | Gene Description | Gene Symbol | Physical Position |
|---|---|---|---|---|
| qLG1 | Eco_gene_10012941 | fasciculation and elongation protein ζ-2-like | fez2 | scaffold416 |
| qLG2 | Eco_gene_10013595 | Dol-P-Man: Man(5)GlcNAc(2)-PP-Dolα-1,3-mannosyltransferase | alg3 | scaffold438 |
| Eco_gene_10013597 | endothelin converting enzyme 2 | ece2 | scaffold438 | |
| qLG5_1 | Eco_gene_10014238 | armadillo repeat gene deleted in velocardiofacial syndrome | arvcf | scaffold468 |
| qLG5_3 | Eco_gene_10004531 | solute carrier family 27 (fatty acid transporter), member 4 | slc27a4 | scaffold1517 |
| Eco_gene_10005552 | tyrosine-protein kinase SgK223 | sgk223 | scaffold1706 | |
| qLG5_4 | Eco_gene_10002069 | calcium/calmodulin-dependent protein kinase 2 | camk2 | scaffold1180 |
| qLG5_5 | Eco_gene_10005555 | proline-rich coiled-coil 2B | prrc2b | scaffold1706 |
| Eco_gene_10000893 | melanin-concentrating hormone receptor 1 | mchr1 | scaffold1067 | |
| qLG5_19 | Eco_gene_10005043 | sarcosine dehydrogenase | sardh | scaffold1600 |
| qLG5_8 | Eco_gene_10018102 | pregnancy-associated plasma protein A | pappa | scaffold675 |
| qLG5_9 | Eco_gene_10014809 | spleen tyrosine kinase | syk | scaffold491 |
| qLG5_11 | Eco_gene_10002109 | telomerase reverse transcriptase | tert | scaffold1187 |
| qLG5_12 | Eco_gene_10005999 | WD repeat-containing protein 91-like | wdrcp91 | scaffold1804 |
| Eco_gene_10000470 | ftz transcription factor 1 | ftz-f1 | scaffold1023 | |
| qLG7 | Eco_gene_10021611 | multidrug and toxin extrusion protein 1-like | mate1 | scaffold919 |
| qLG21 | Eco_gene_10003094 | neurogenic locus notch homolog protein 1-like | notch1 | scaffold130 |
© 2016 by the authors; licensee MDPI, Basel, Switzerland. This article is an open access article distributed under the terms and conditions of the Creative Commons by Attribution (CC-BY) license (http://creativecommons.org/licenses/by/4.0/).
Share and Cite
Yu, H.; You, X.; Li, J.; Liu, H.; Meng, Z.; Xiao, L.; Zhang, H.; Lin, H.-R.; Zhang, Y.; Shi, Q. Genome-Wide Mapping of Growth-Related Quantitative Trait Loci in Orange-Spotted Grouper (Epinephelus coioides) Using Double Digest Restriction-Site Associated DNA Sequencing (ddRADseq). Int. J. Mol. Sci. 2016, 17, 501. https://doi.org/10.3390/ijms17040501
Yu H, You X, Li J, Liu H, Meng Z, Xiao L, Zhang H, Lin H-R, Zhang Y, Shi Q. Genome-Wide Mapping of Growth-Related Quantitative Trait Loci in Orange-Spotted Grouper (Epinephelus coioides) Using Double Digest Restriction-Site Associated DNA Sequencing (ddRADseq). International Journal of Molecular Sciences. 2016; 17(4):501. https://doi.org/10.3390/ijms17040501
Chicago/Turabian StyleYu, Hui, Xinxin You, Jia Li, Hankui Liu, Zining Meng, Ling Xiao, Haifa Zhang, Hao-Ran Lin, Yong Zhang, and Qiong Shi. 2016. "Genome-Wide Mapping of Growth-Related Quantitative Trait Loci in Orange-Spotted Grouper (Epinephelus coioides) Using Double Digest Restriction-Site Associated DNA Sequencing (ddRADseq)" International Journal of Molecular Sciences 17, no. 4: 501. https://doi.org/10.3390/ijms17040501