
Toll Like Receptor 2, 4, and 9 Signaling Promotes Autoregulative Tumor Cell Growth and VEGF/PDGF Expression in Human Pancreatic Cancer

Abstract
:
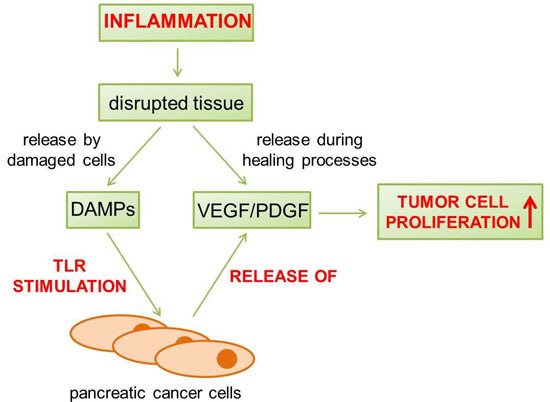
1. Introduction
2. Results
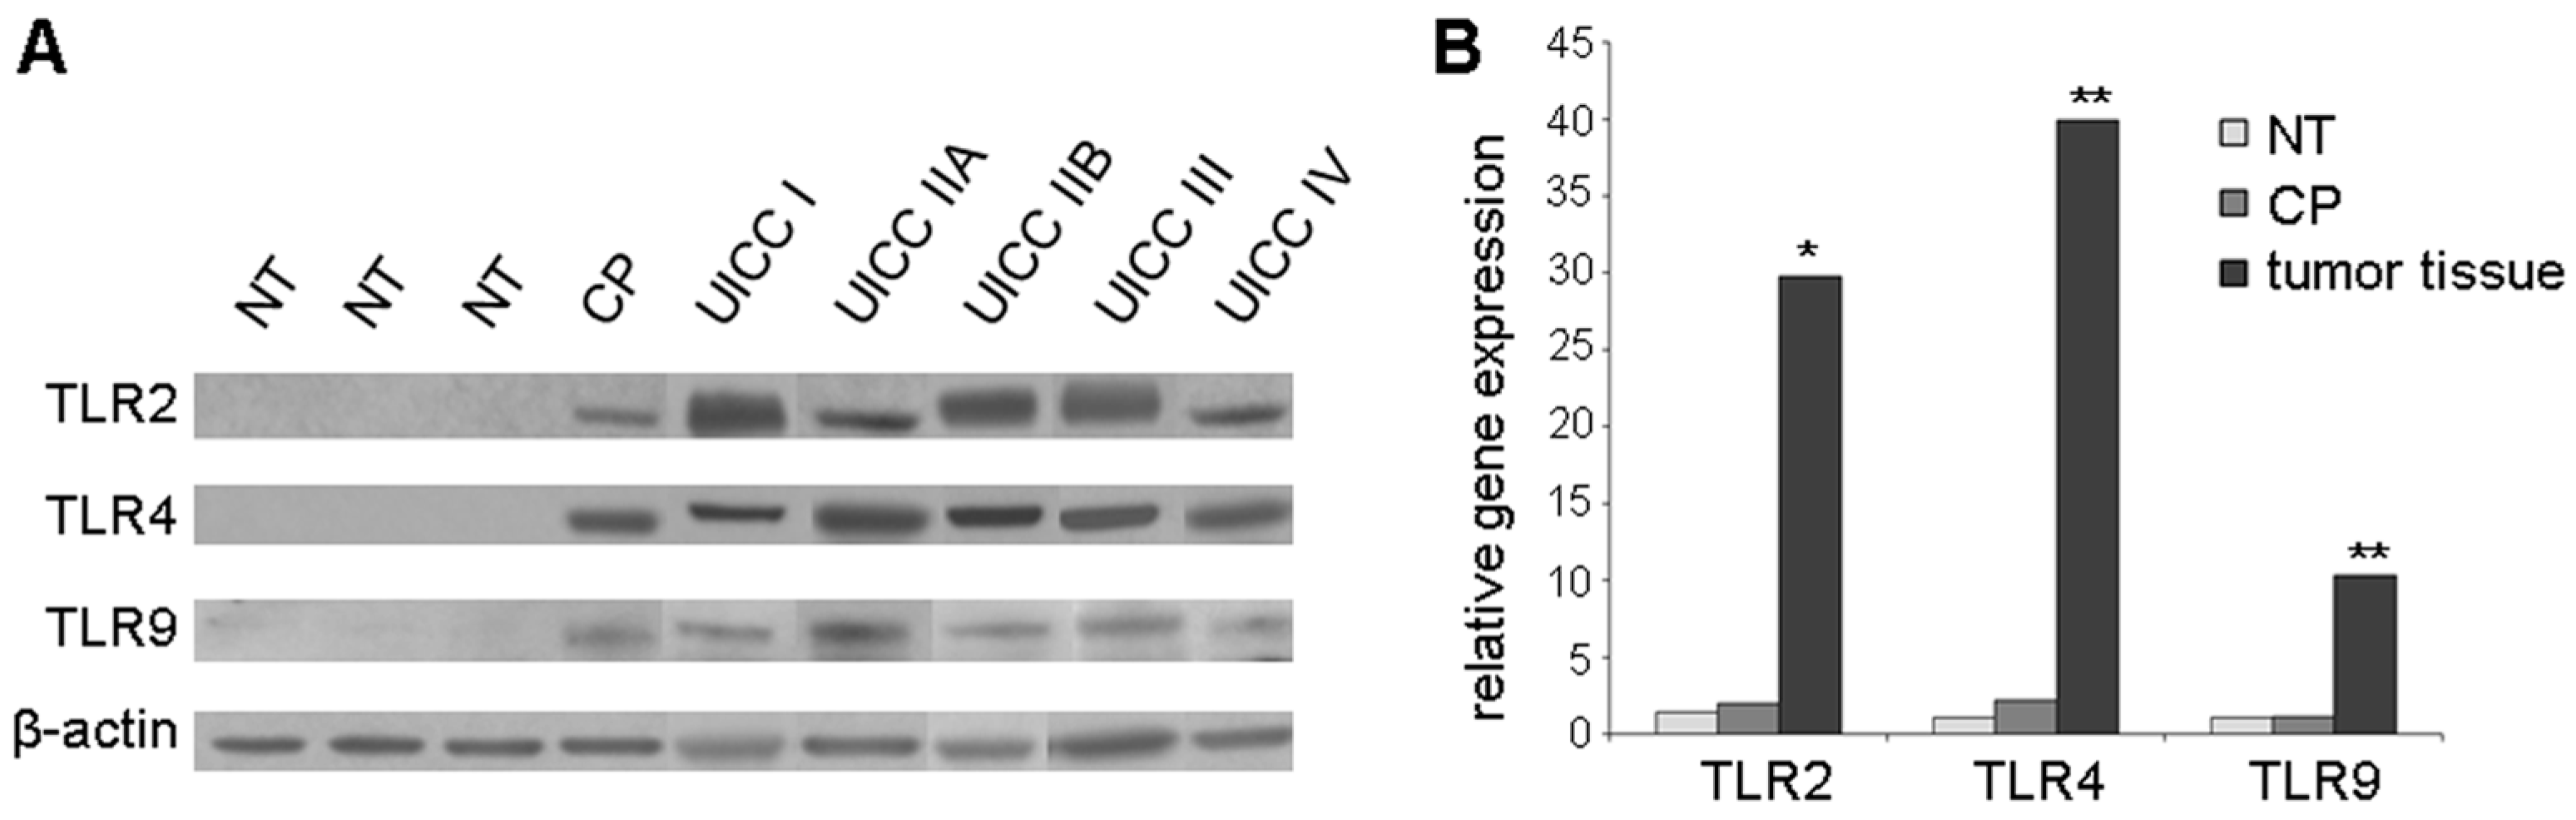
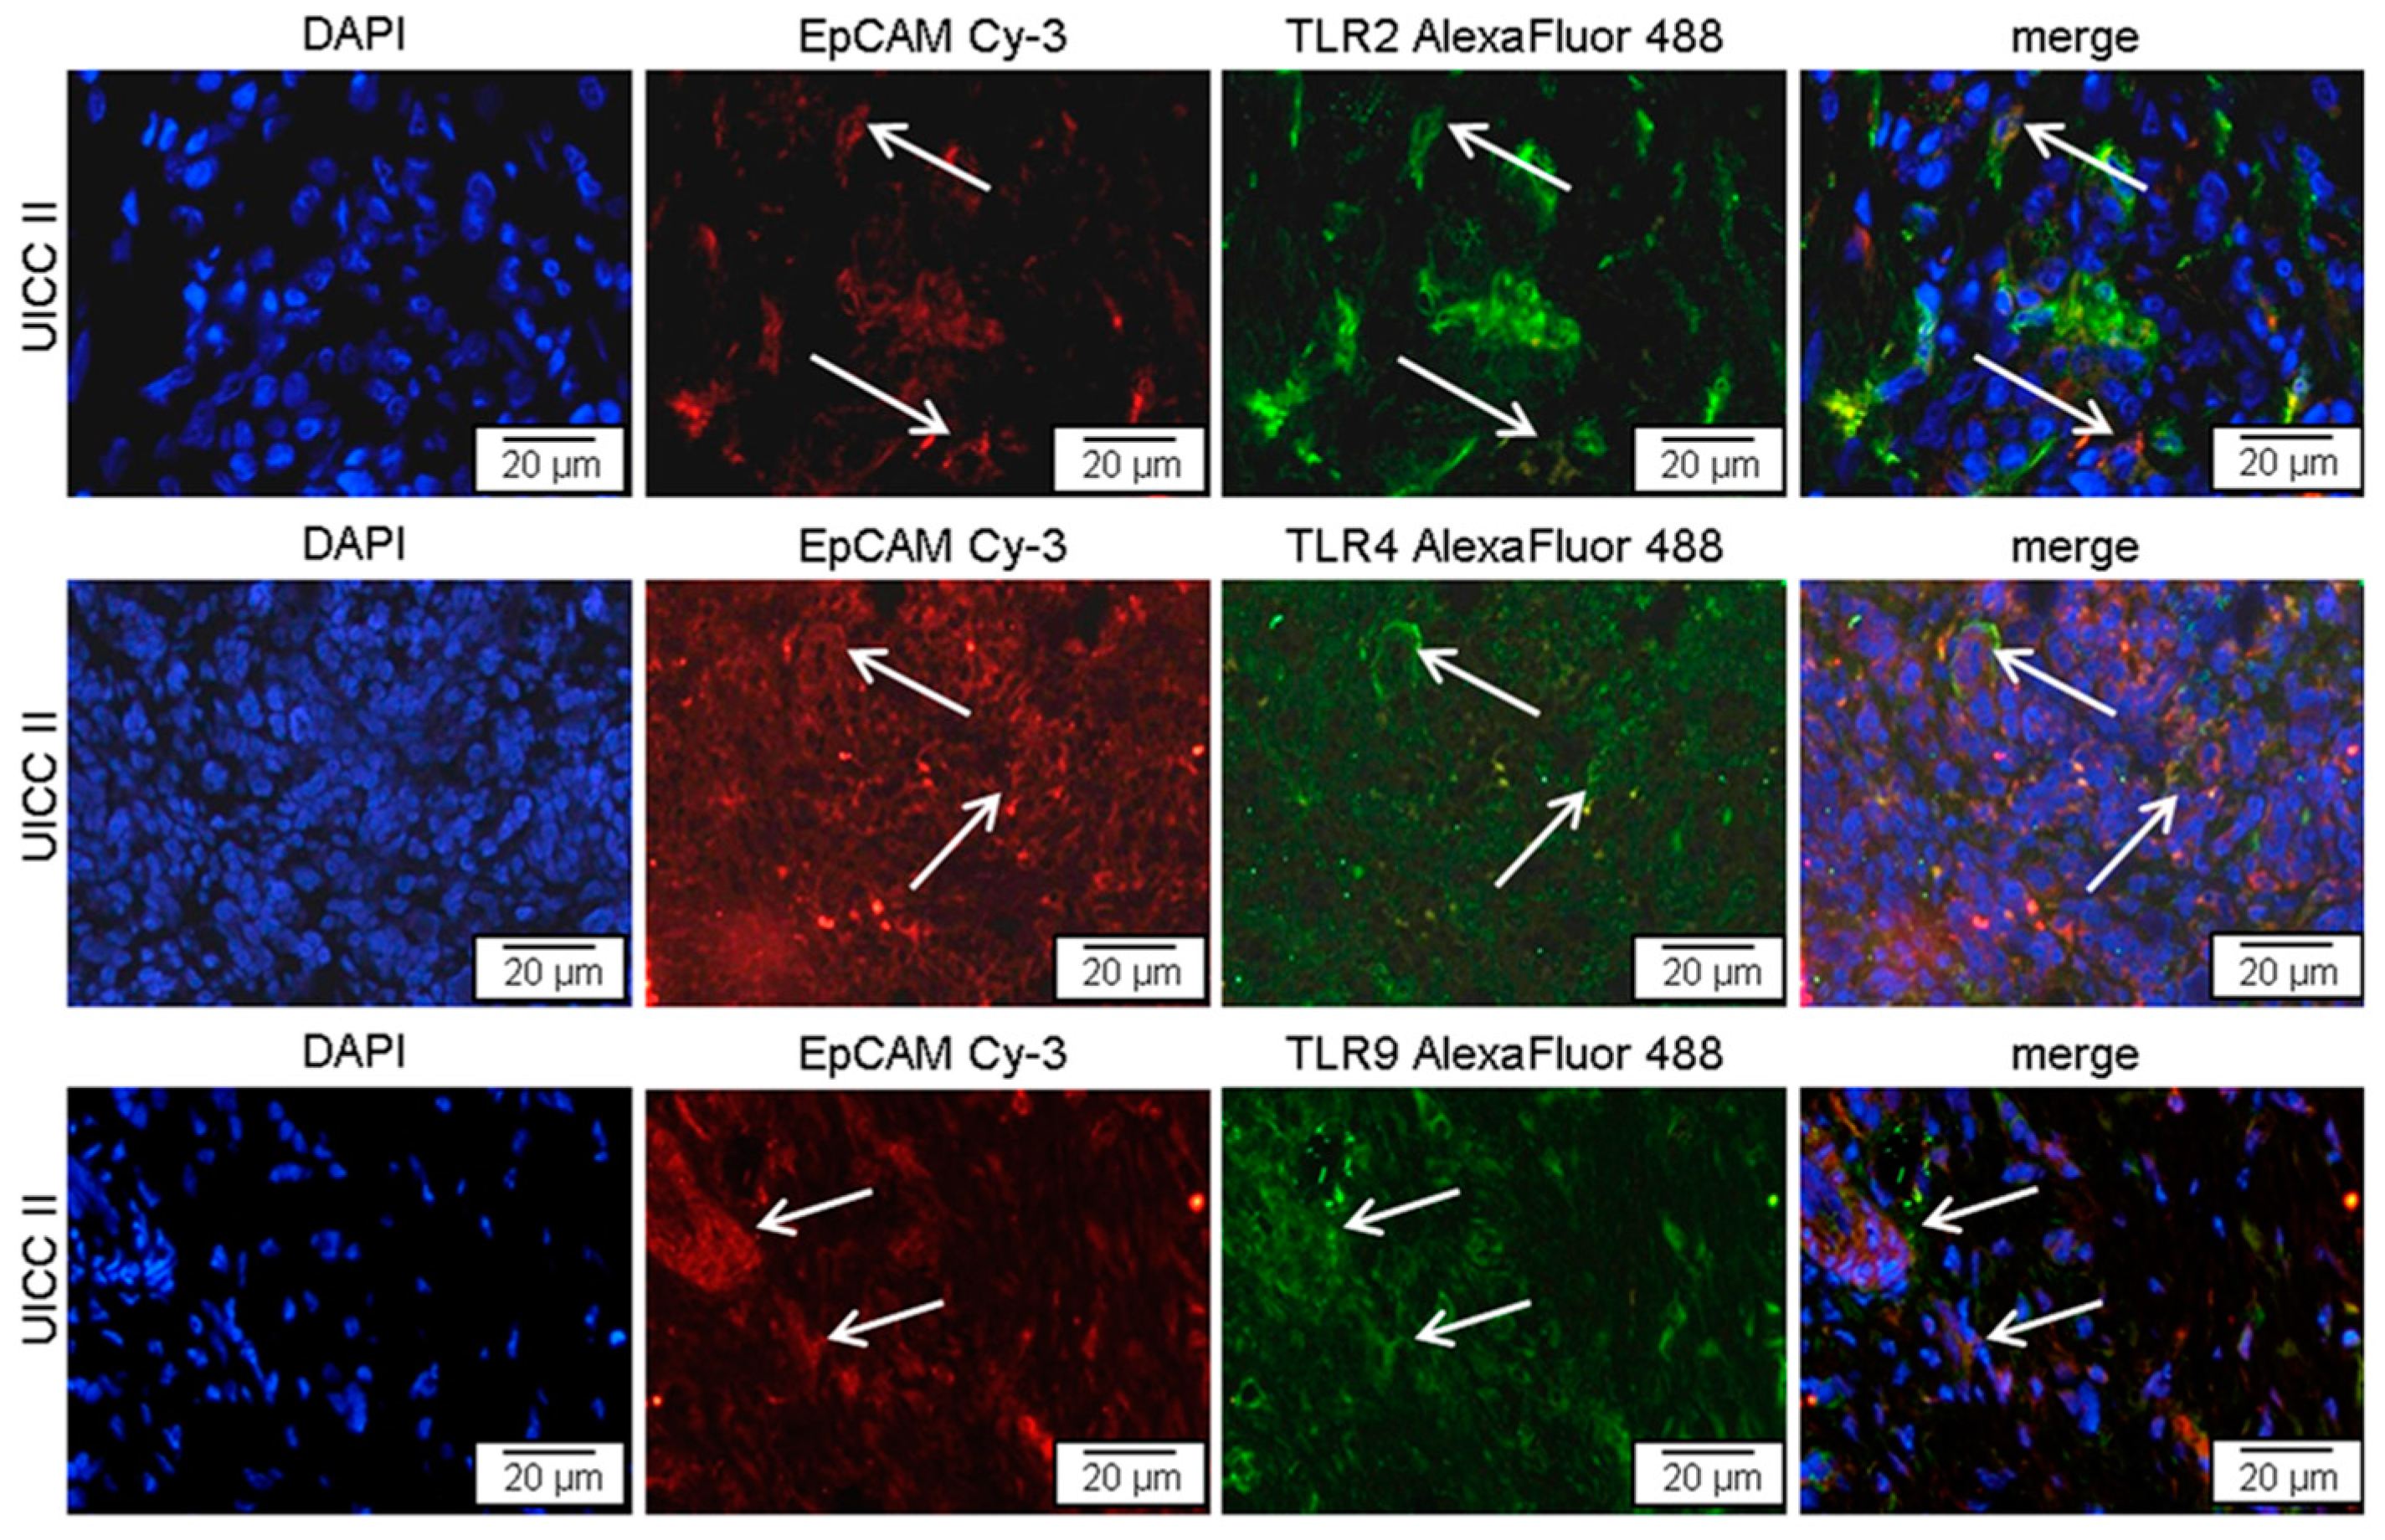
2.1. TLR2, -4, and -9 Are Expressed in Human Pancreatic Cancer Tissue
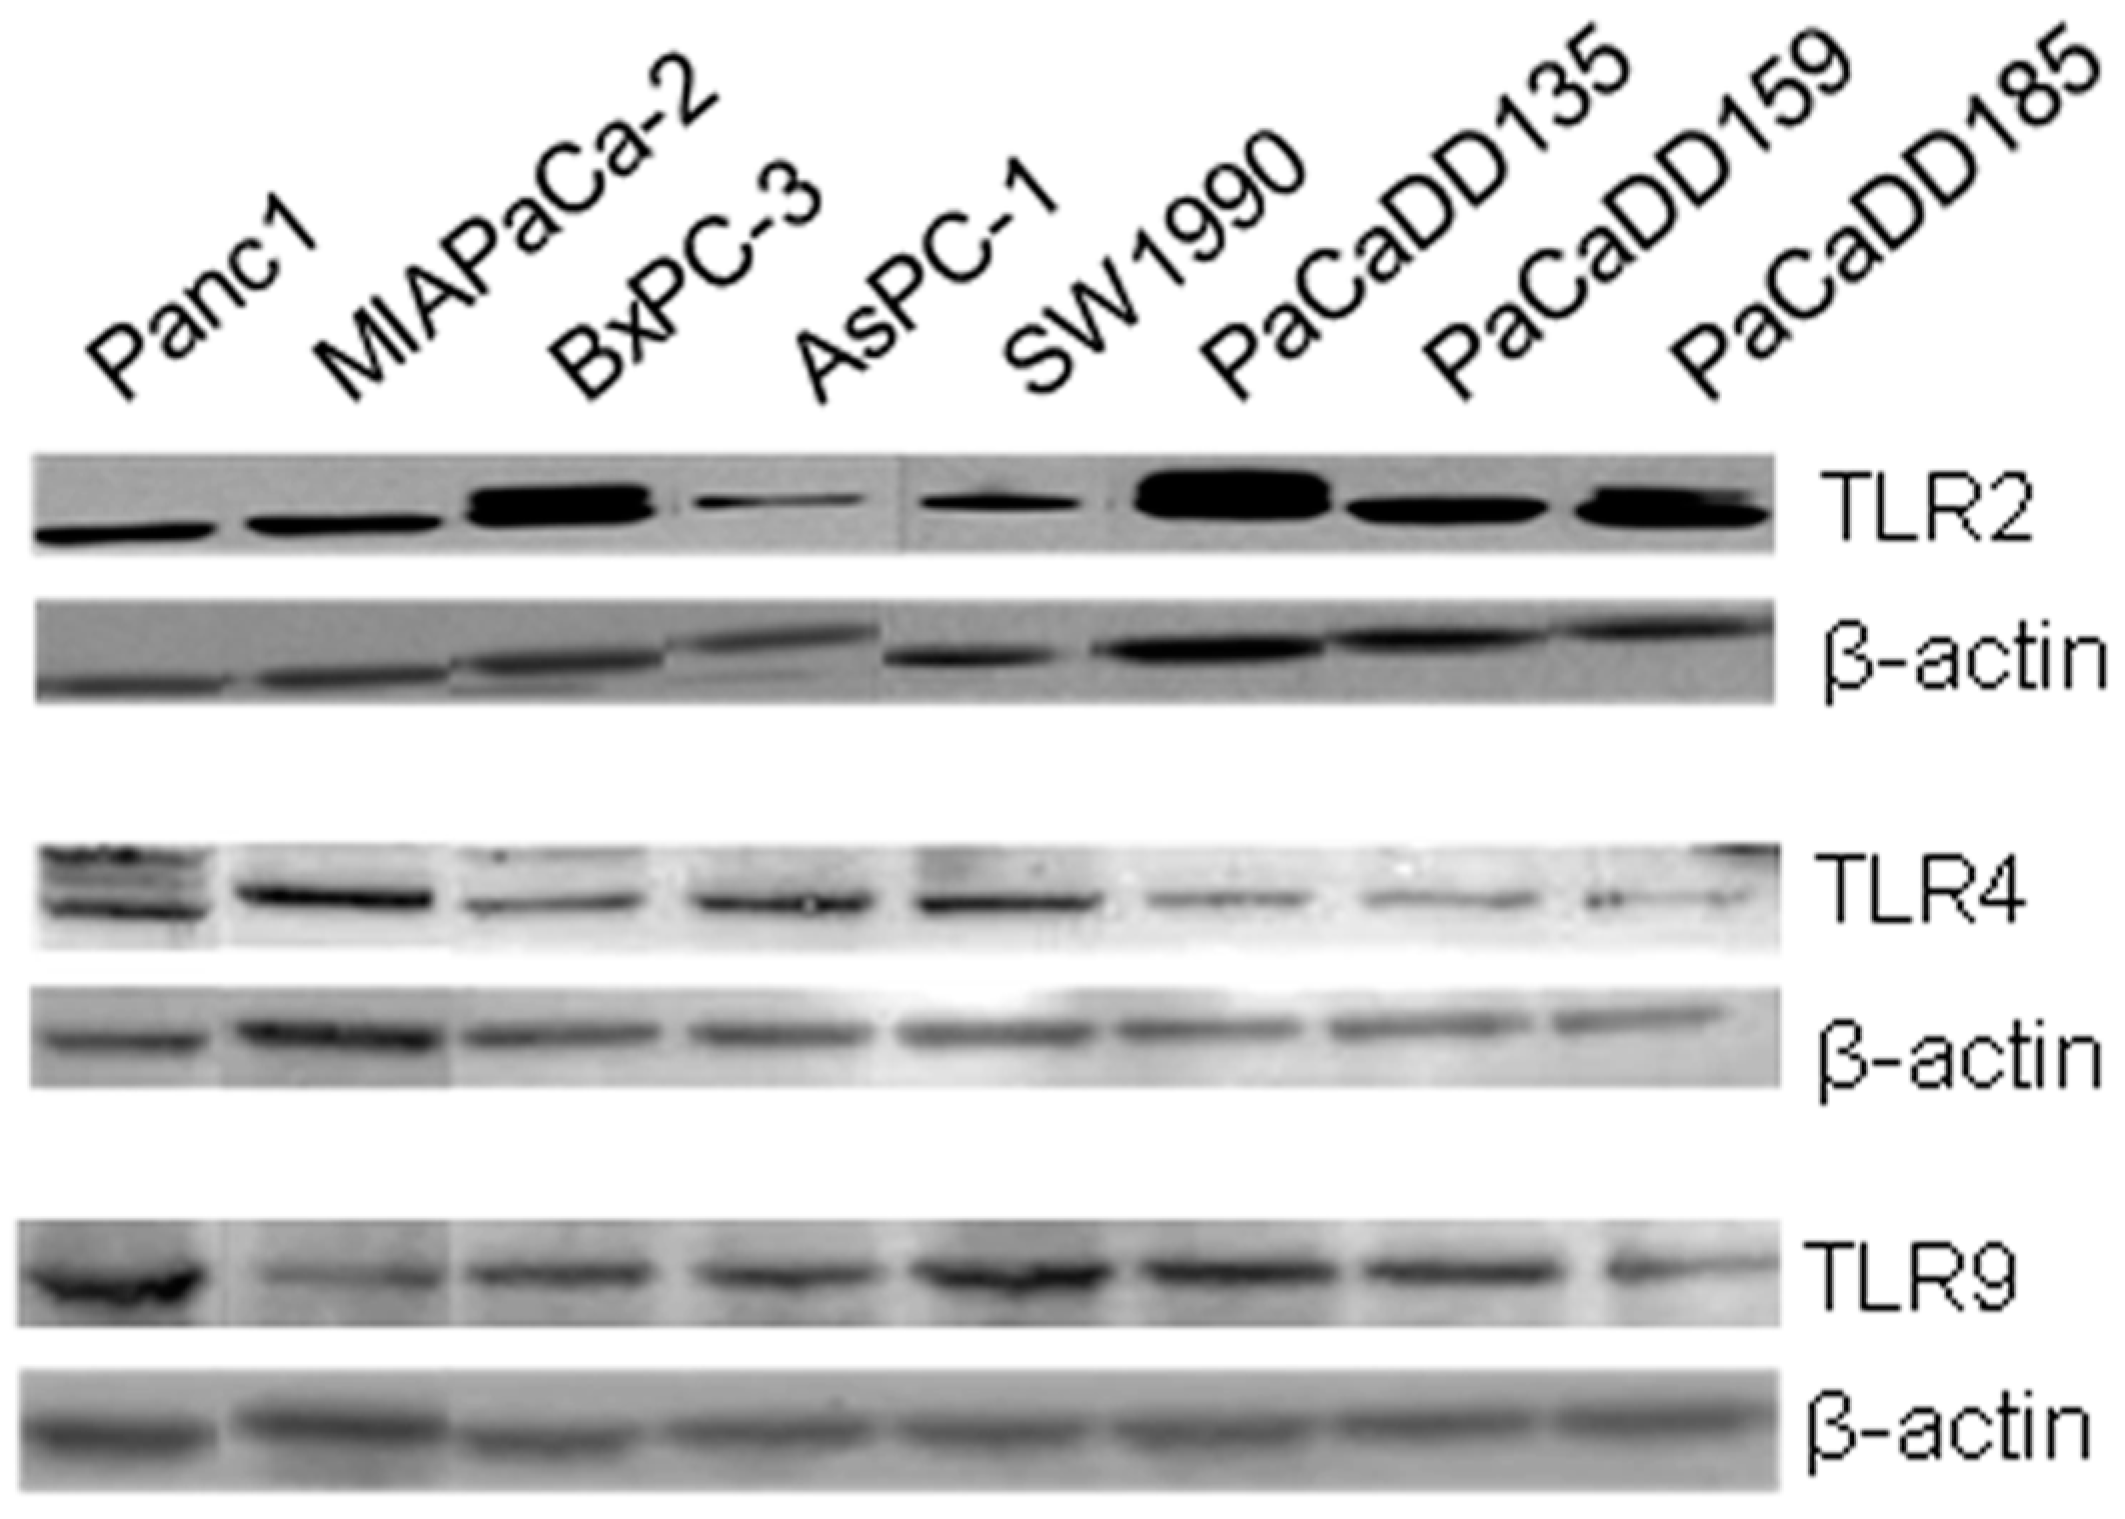
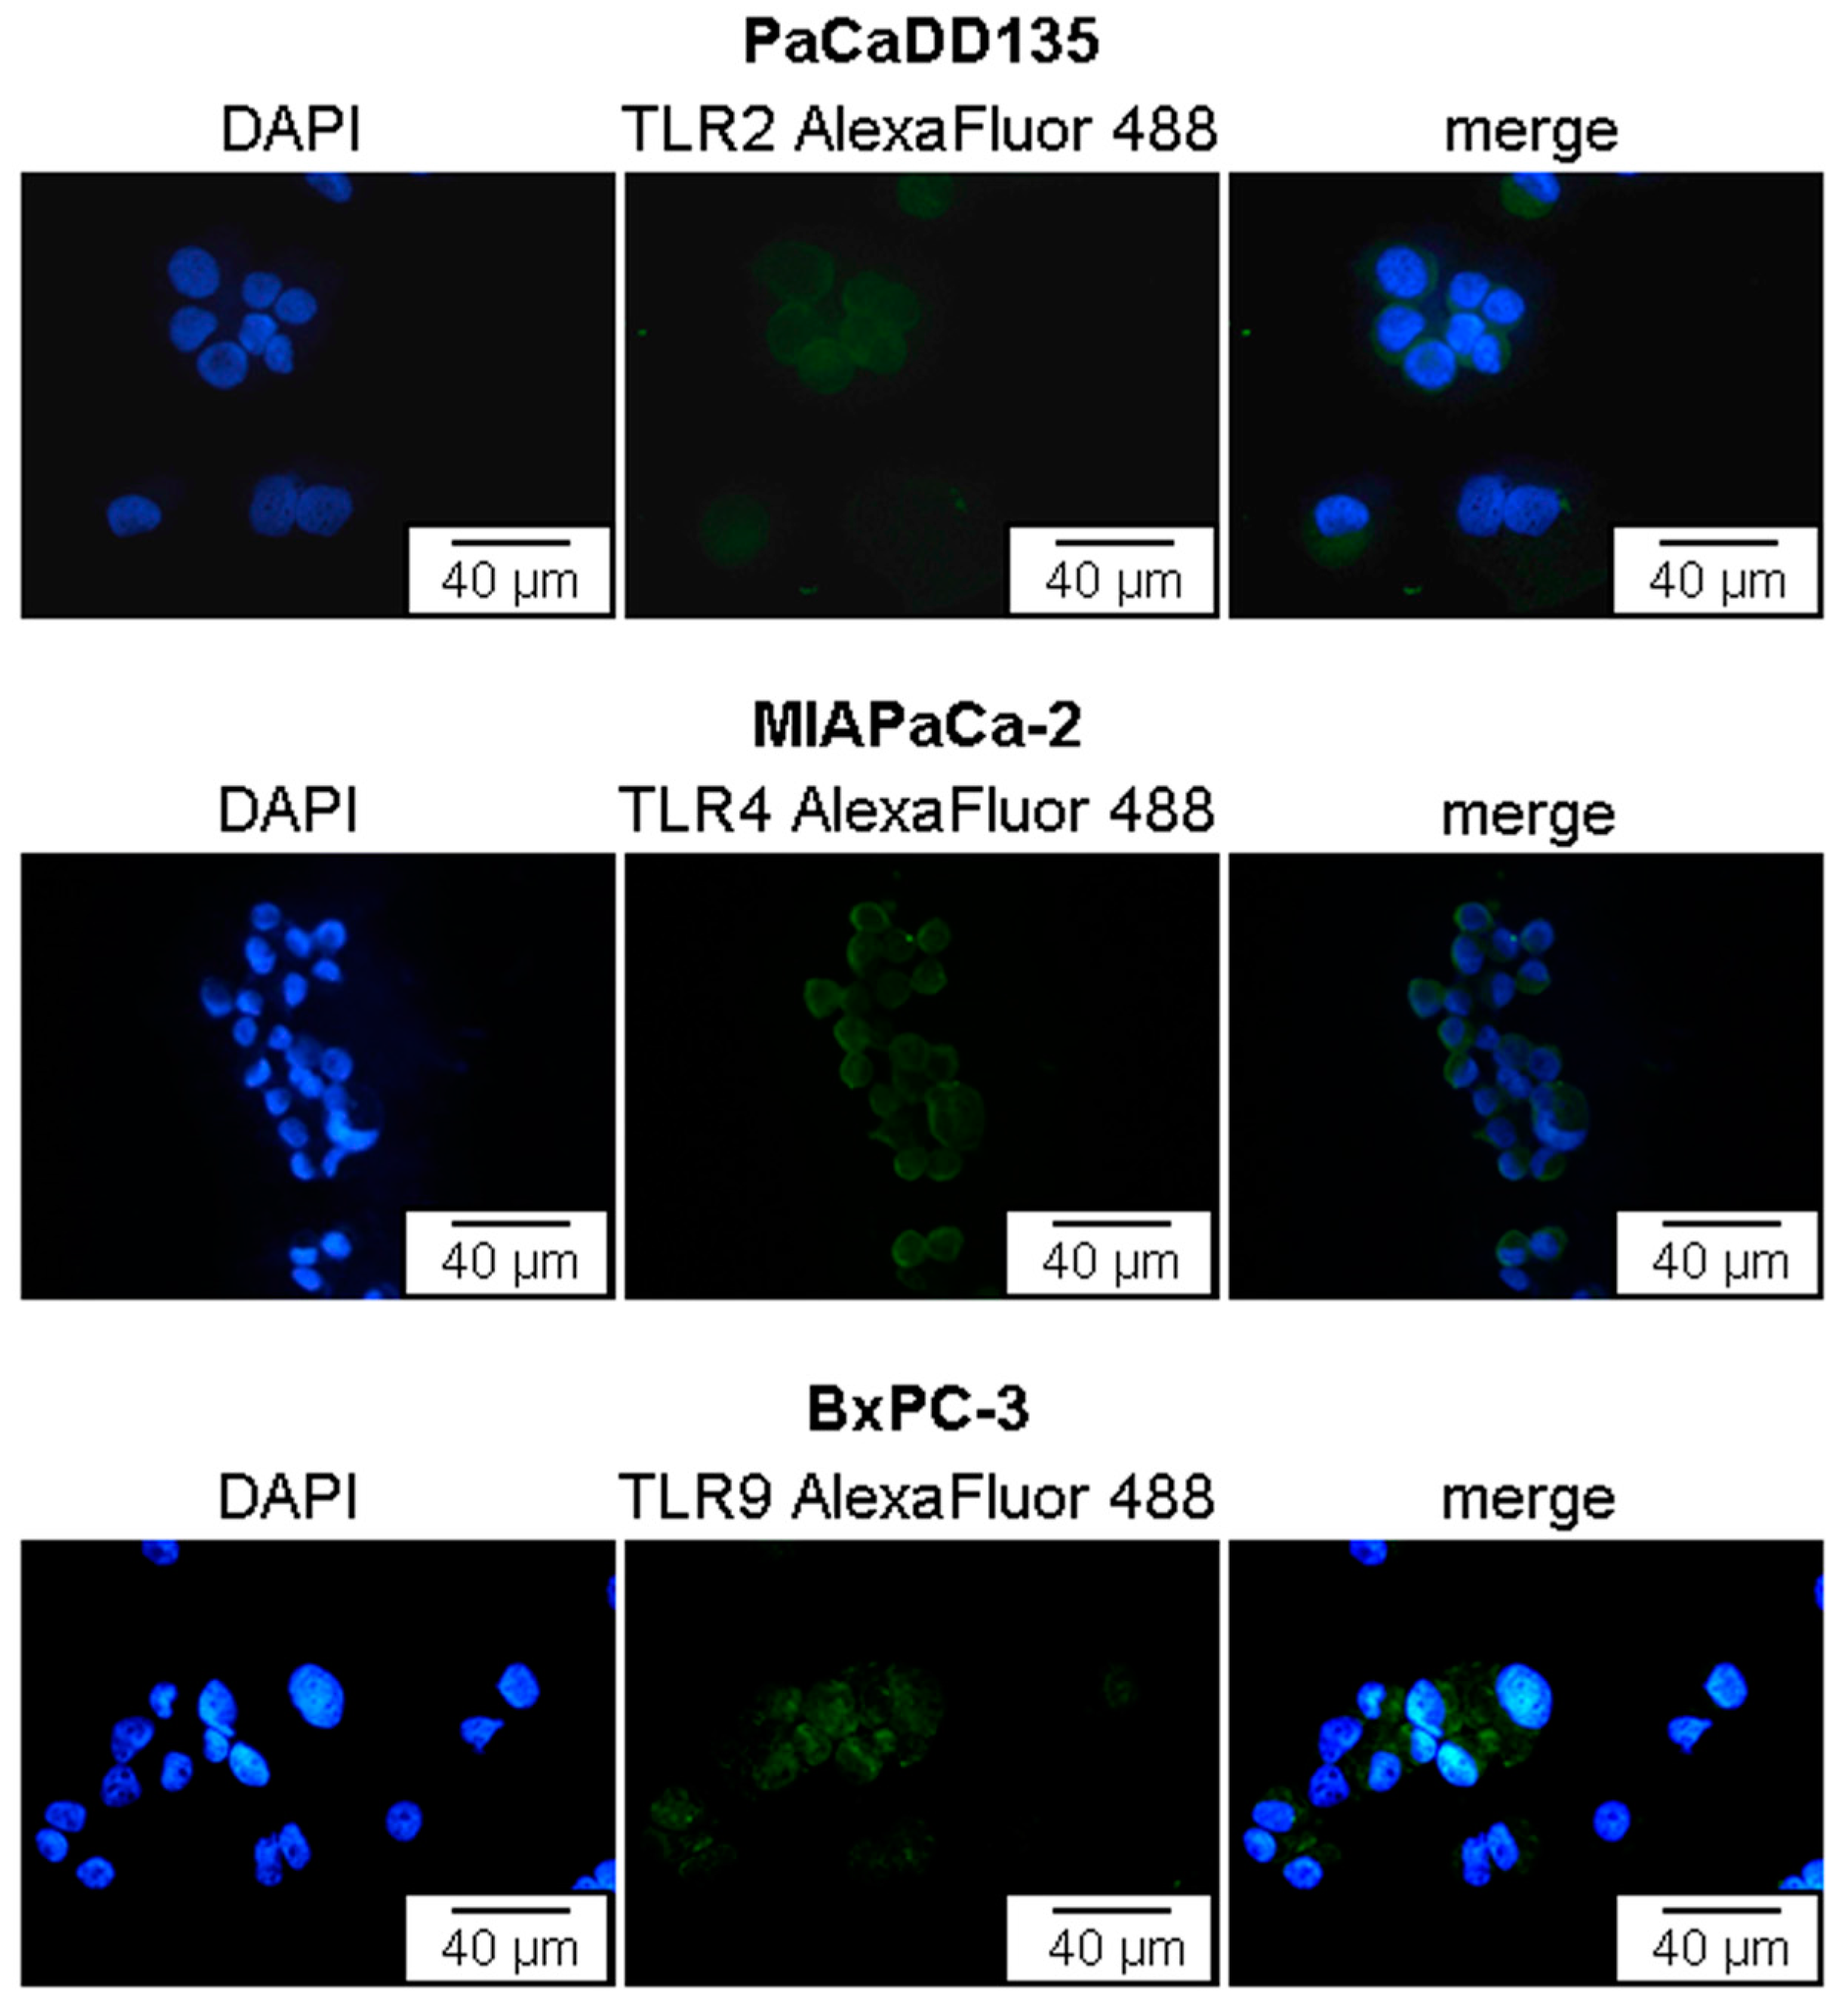
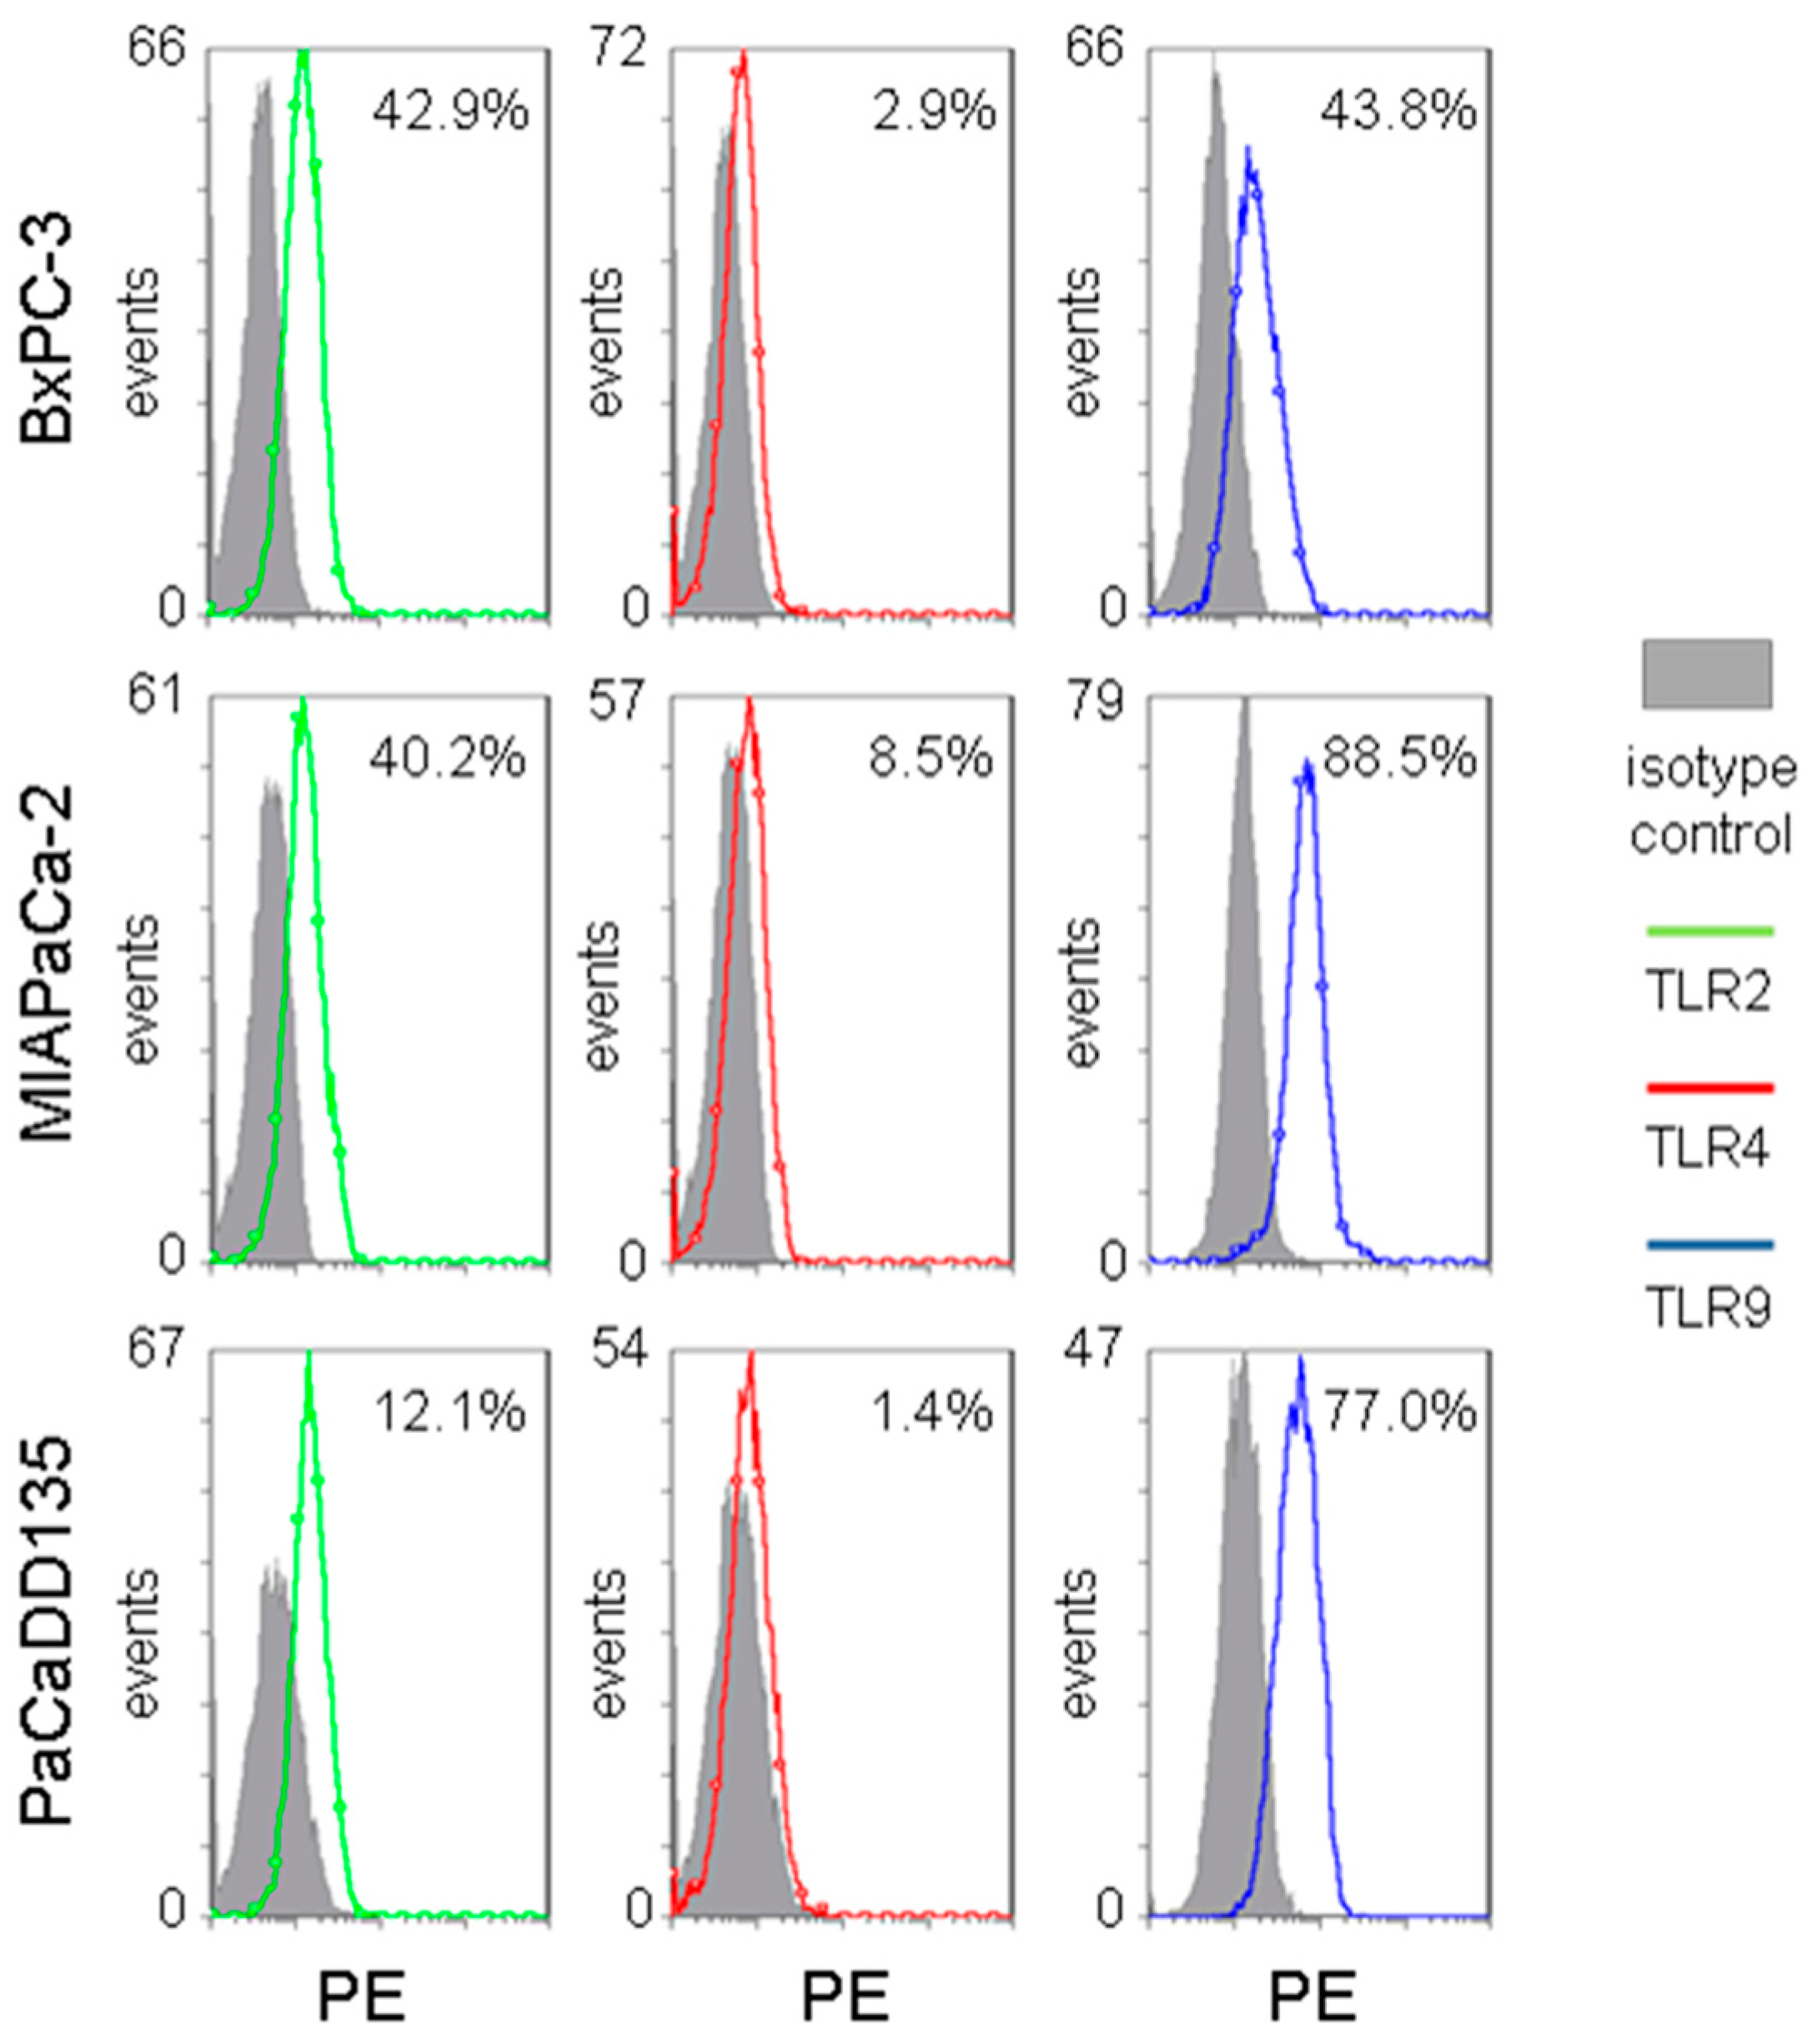
2.2. TLR2, -4, and -9 Are Expressed in Human Pancreatic Cancer Cell Lines
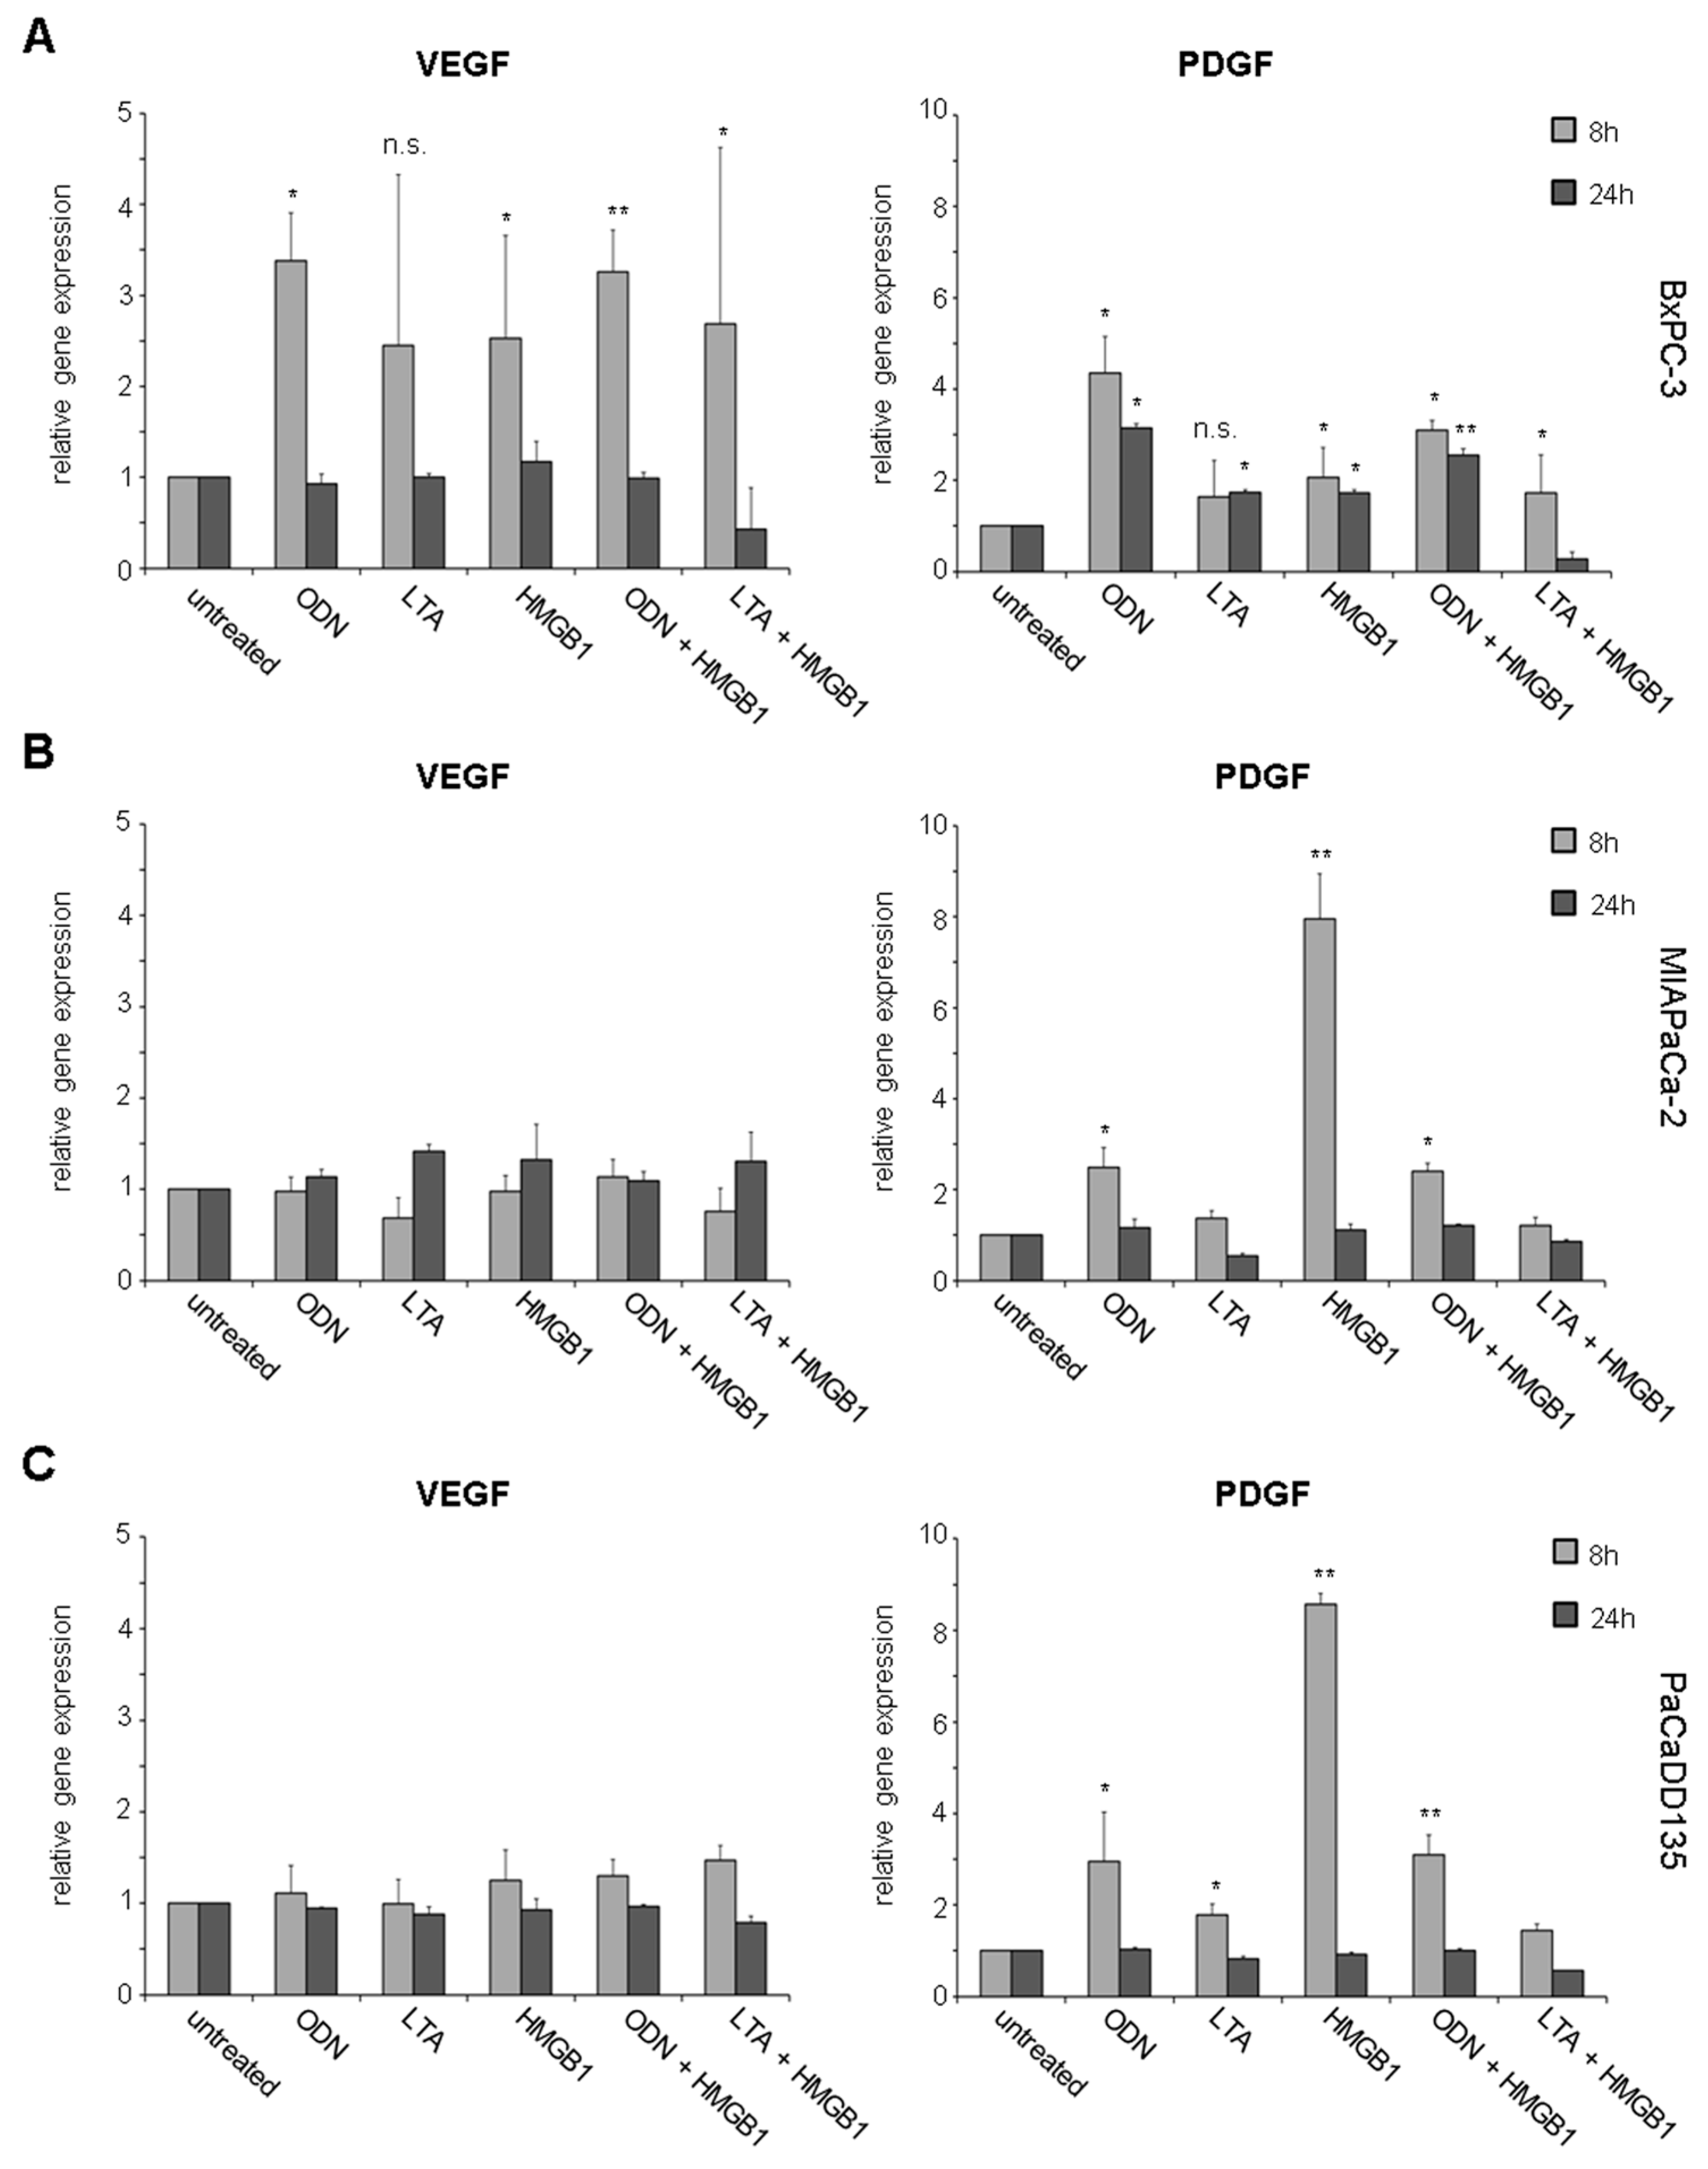
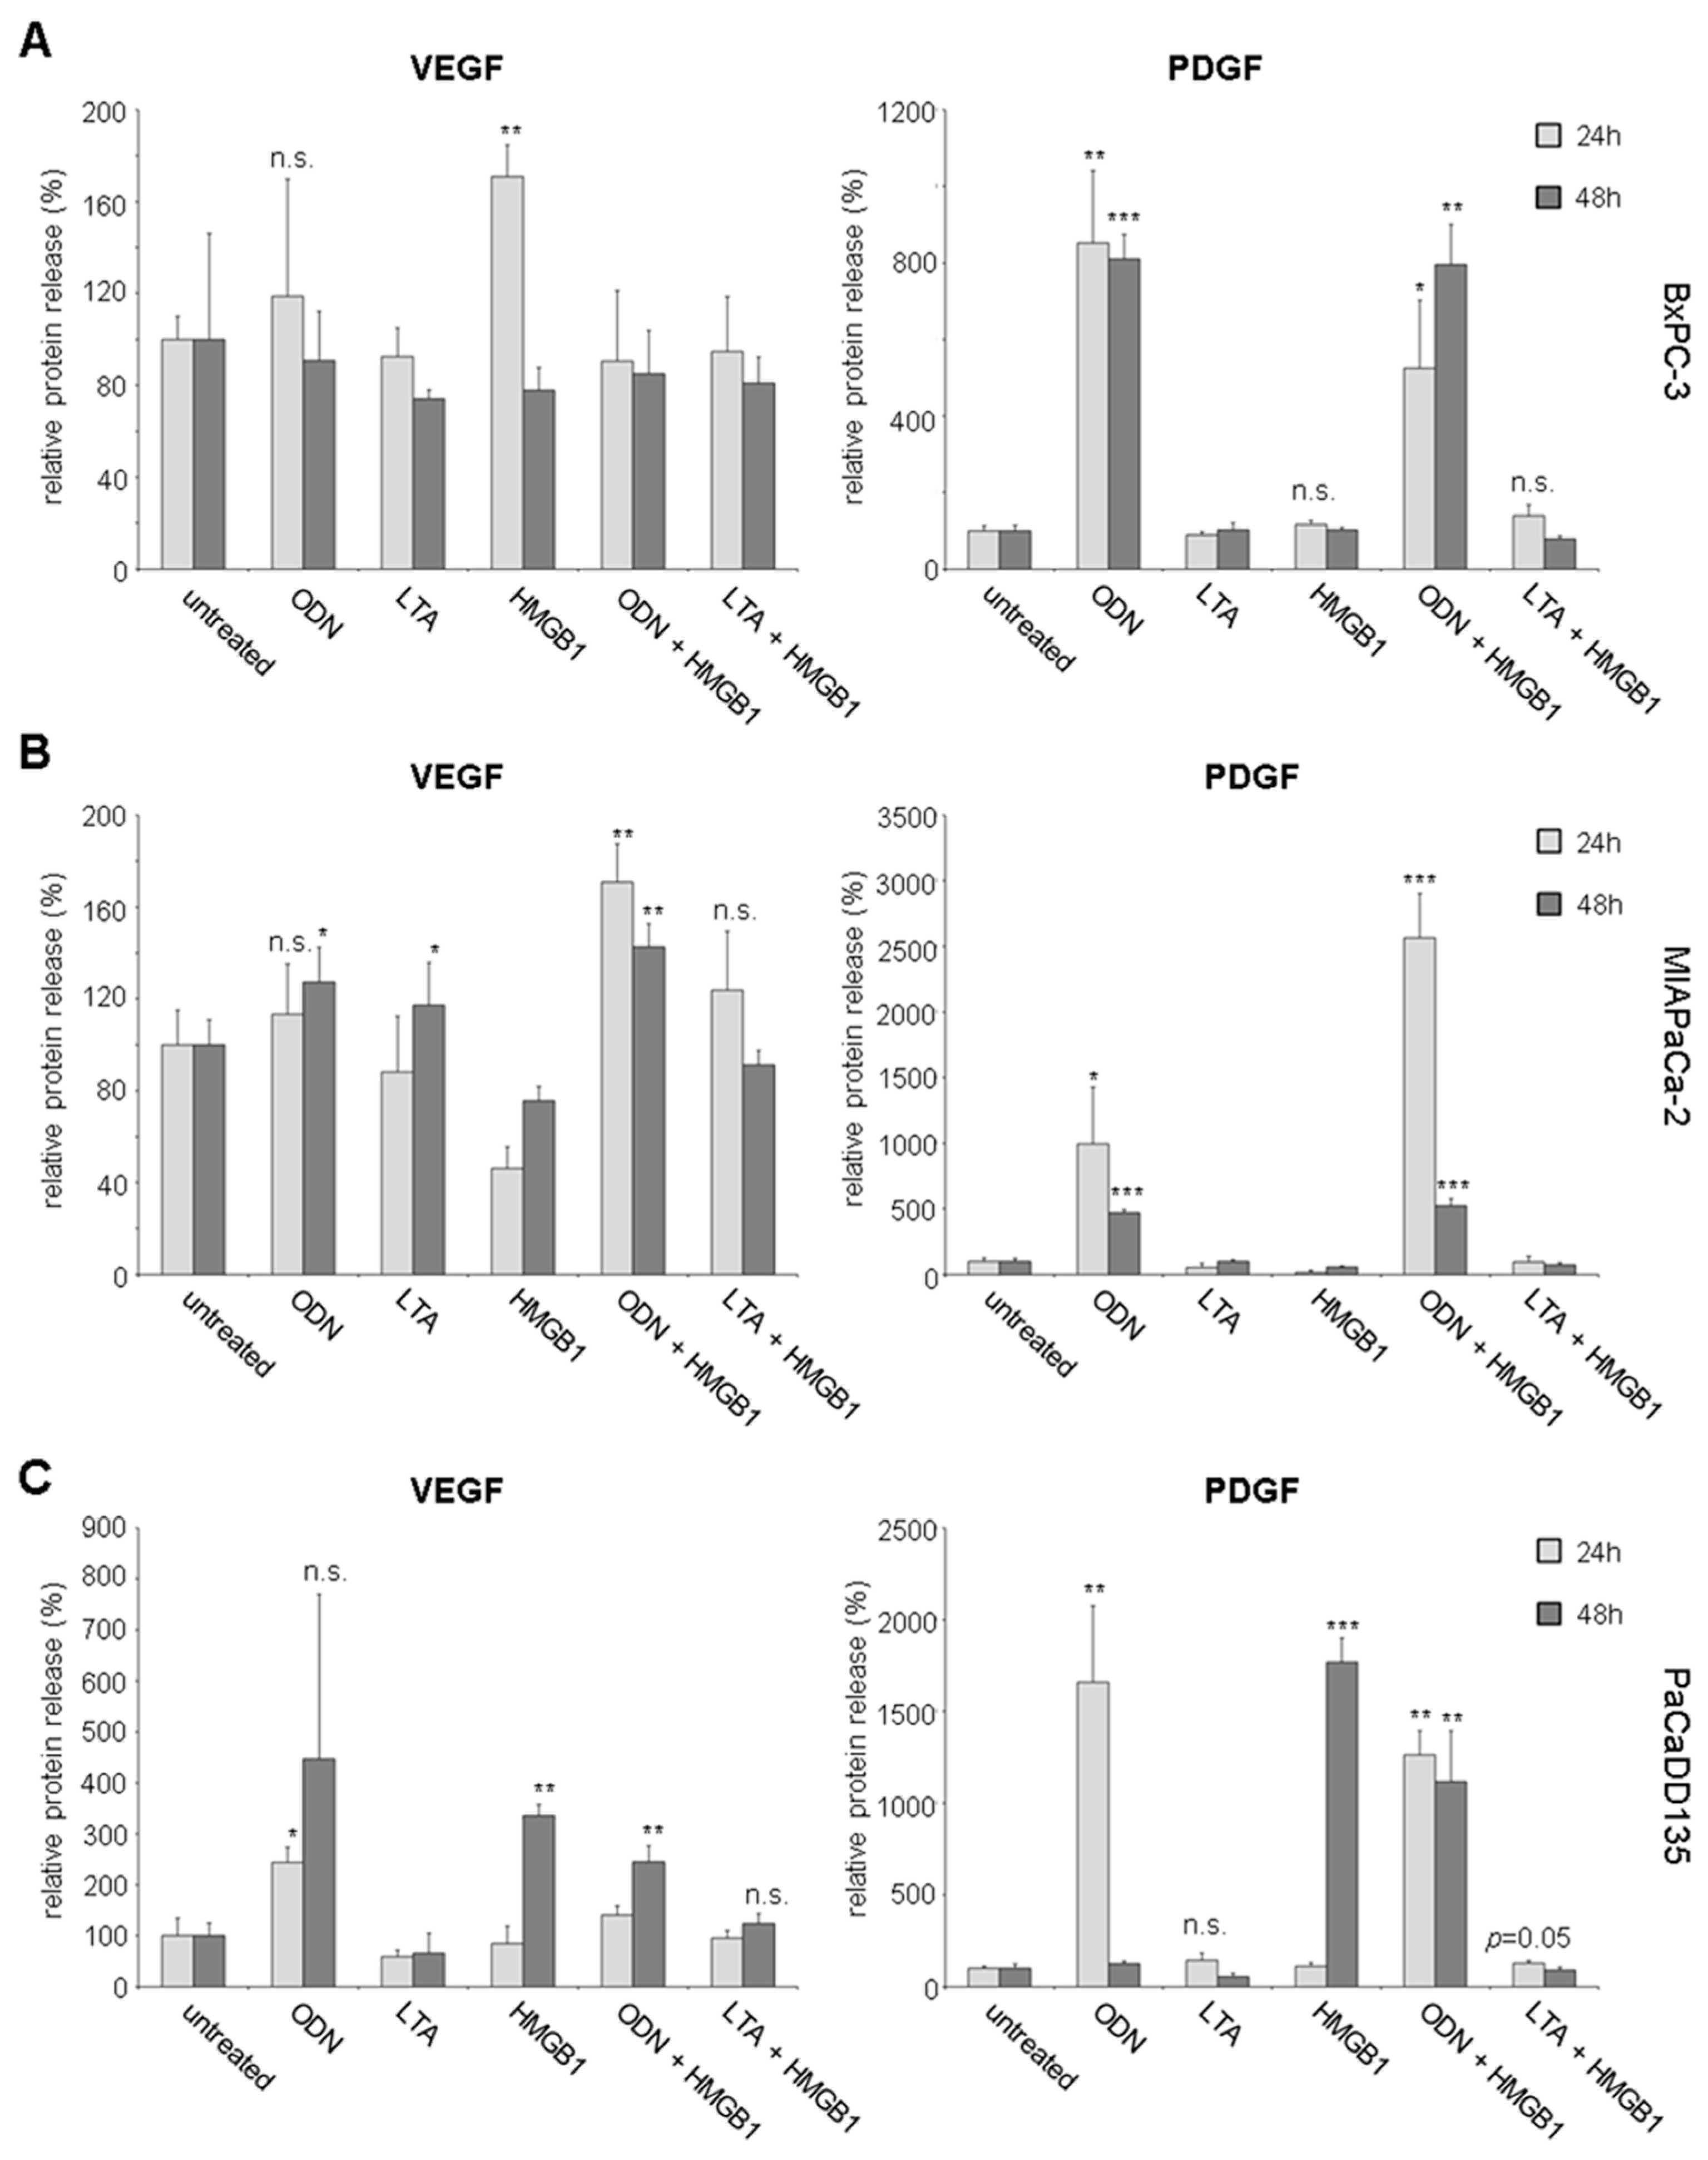
2.3. TLR Activation Results in Increased Growth Factor Expression and Release
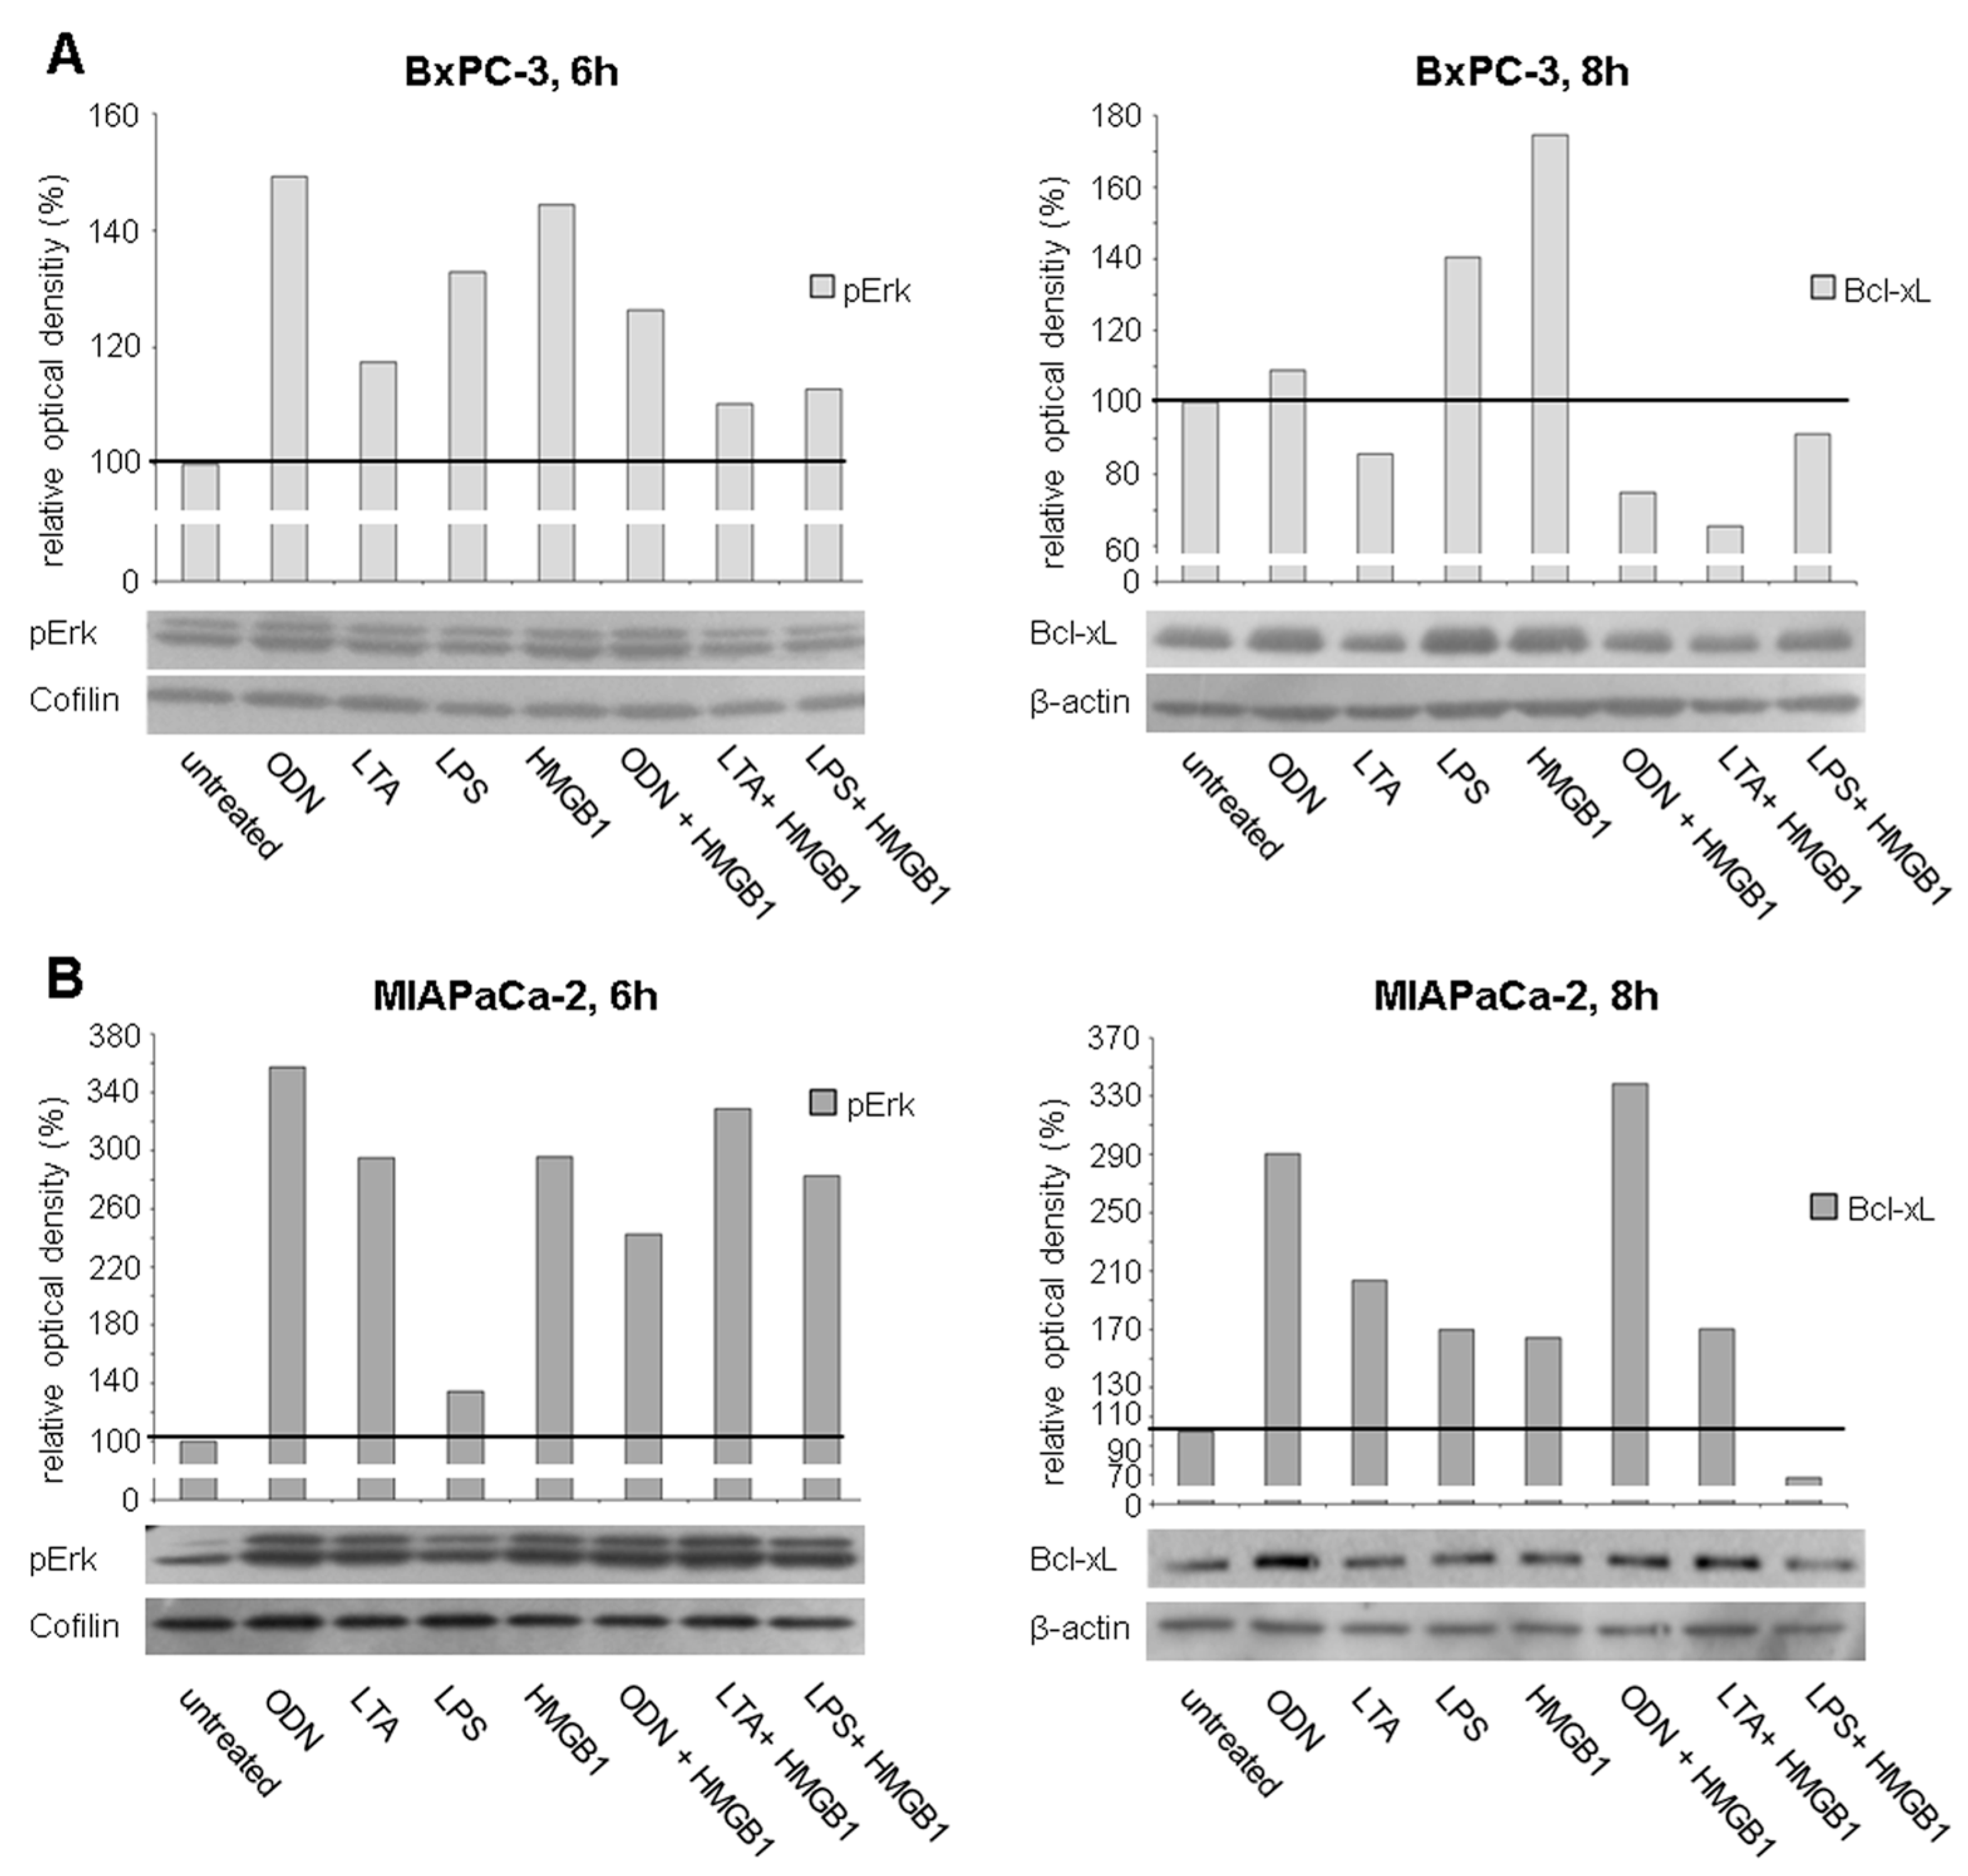
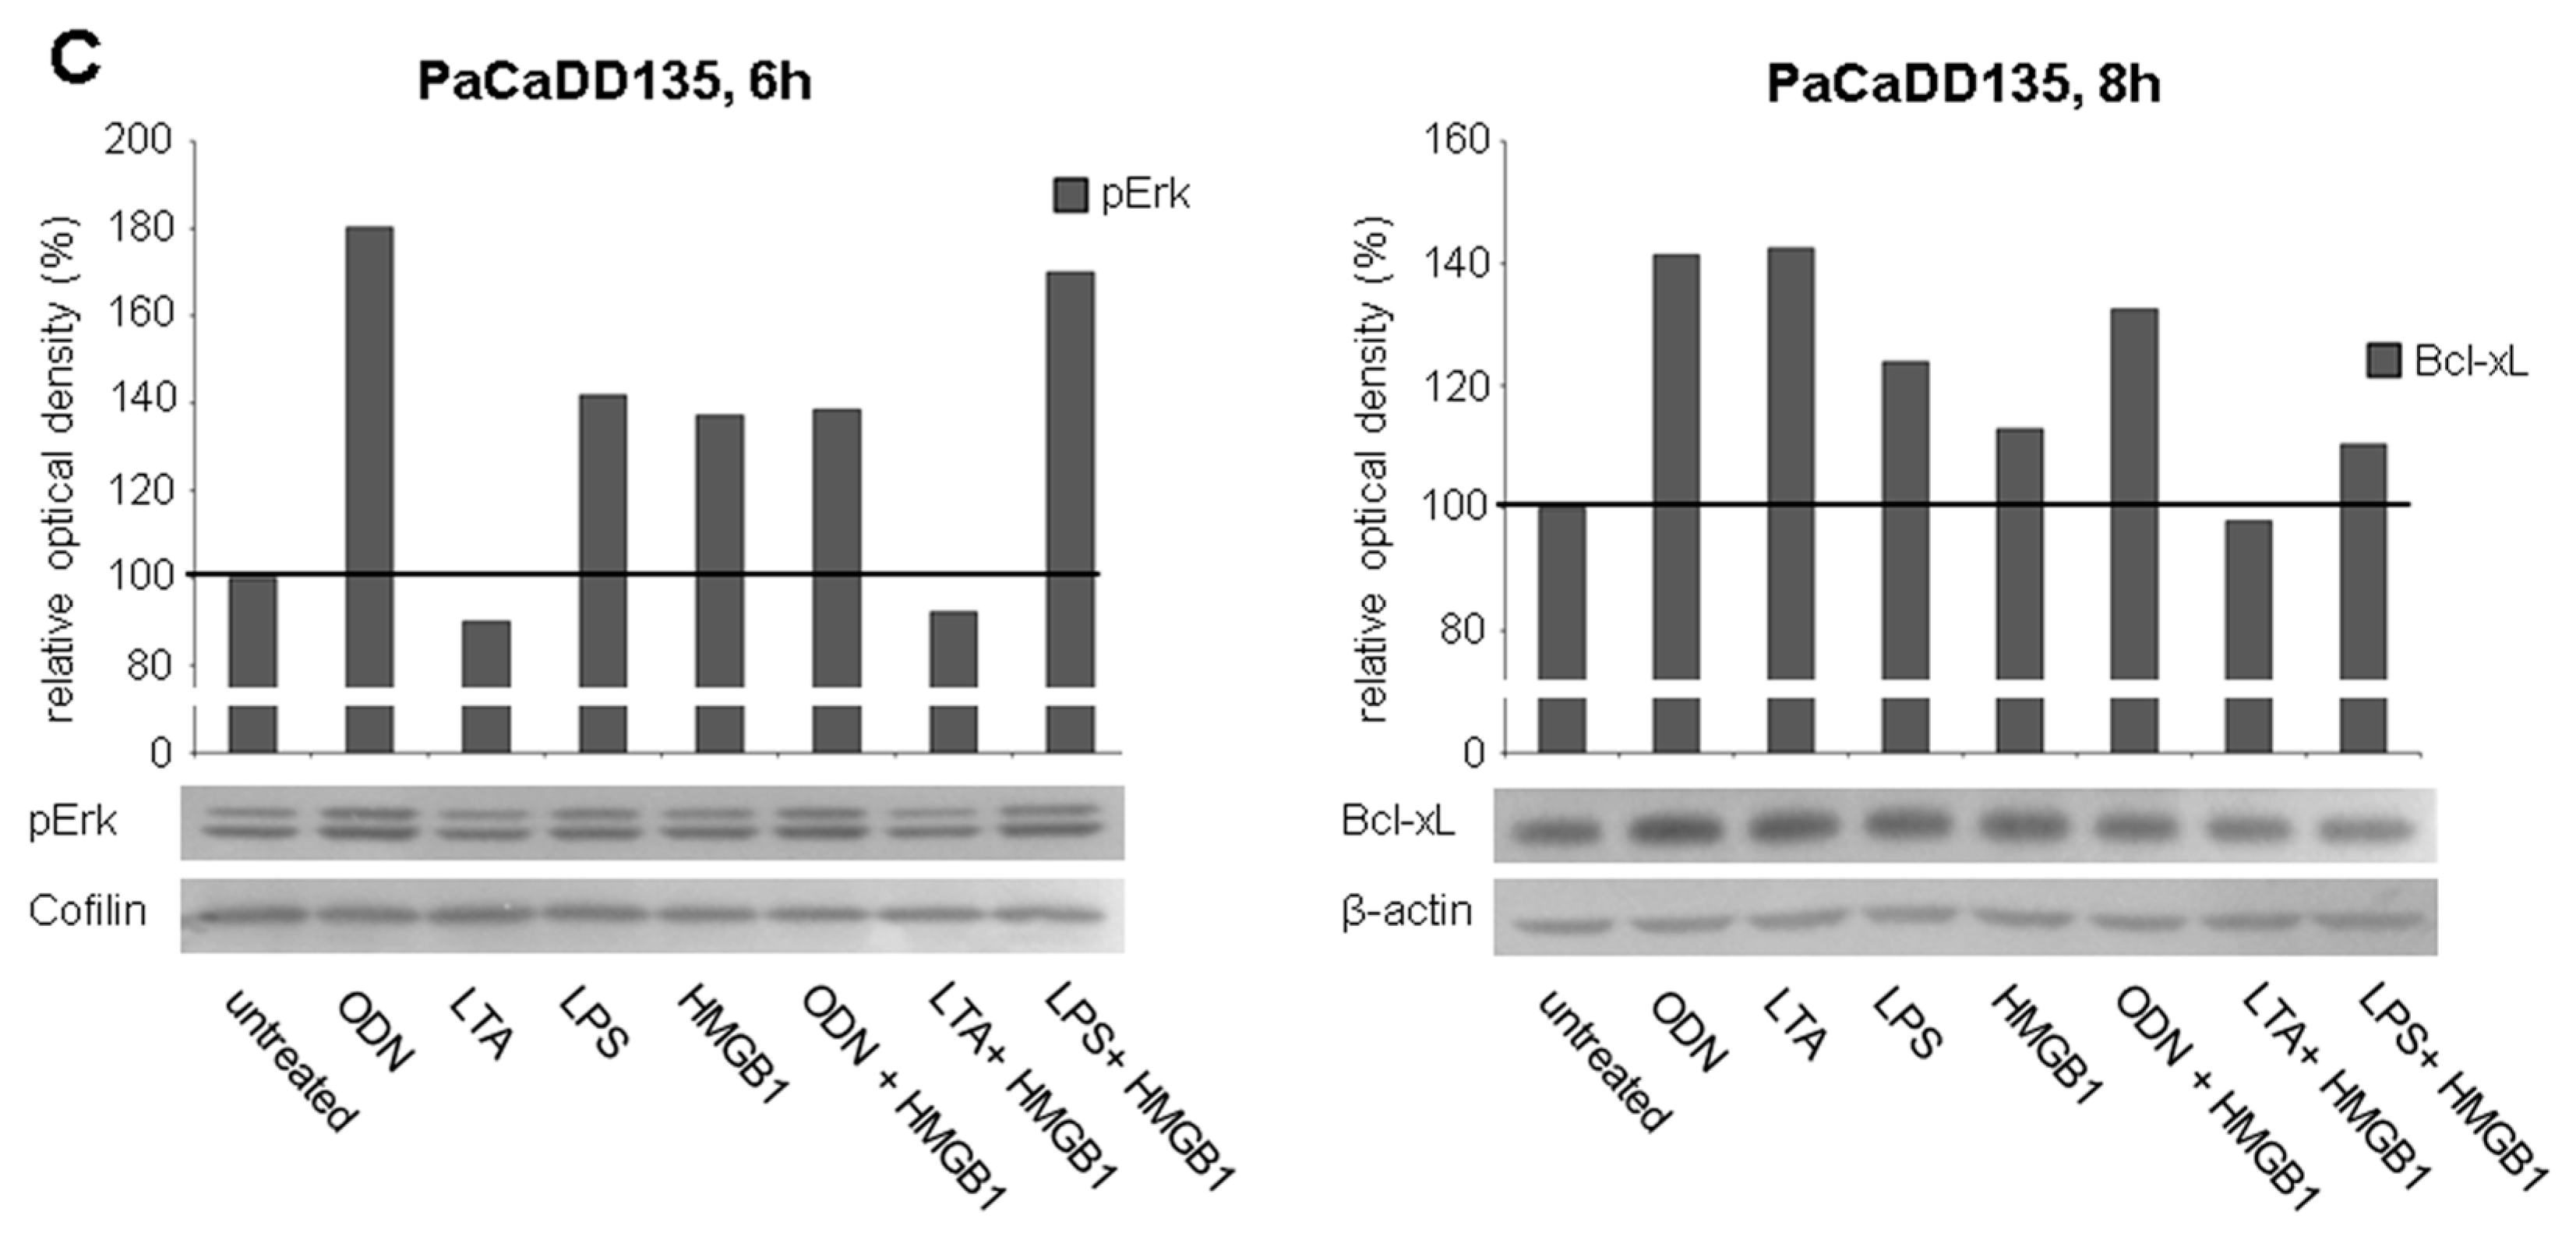
2.4. TLR Stimulation Leads to the Activation of MAPK Signaling and Increased Expression of Anti-Apoptotic Protein Bcl-xL
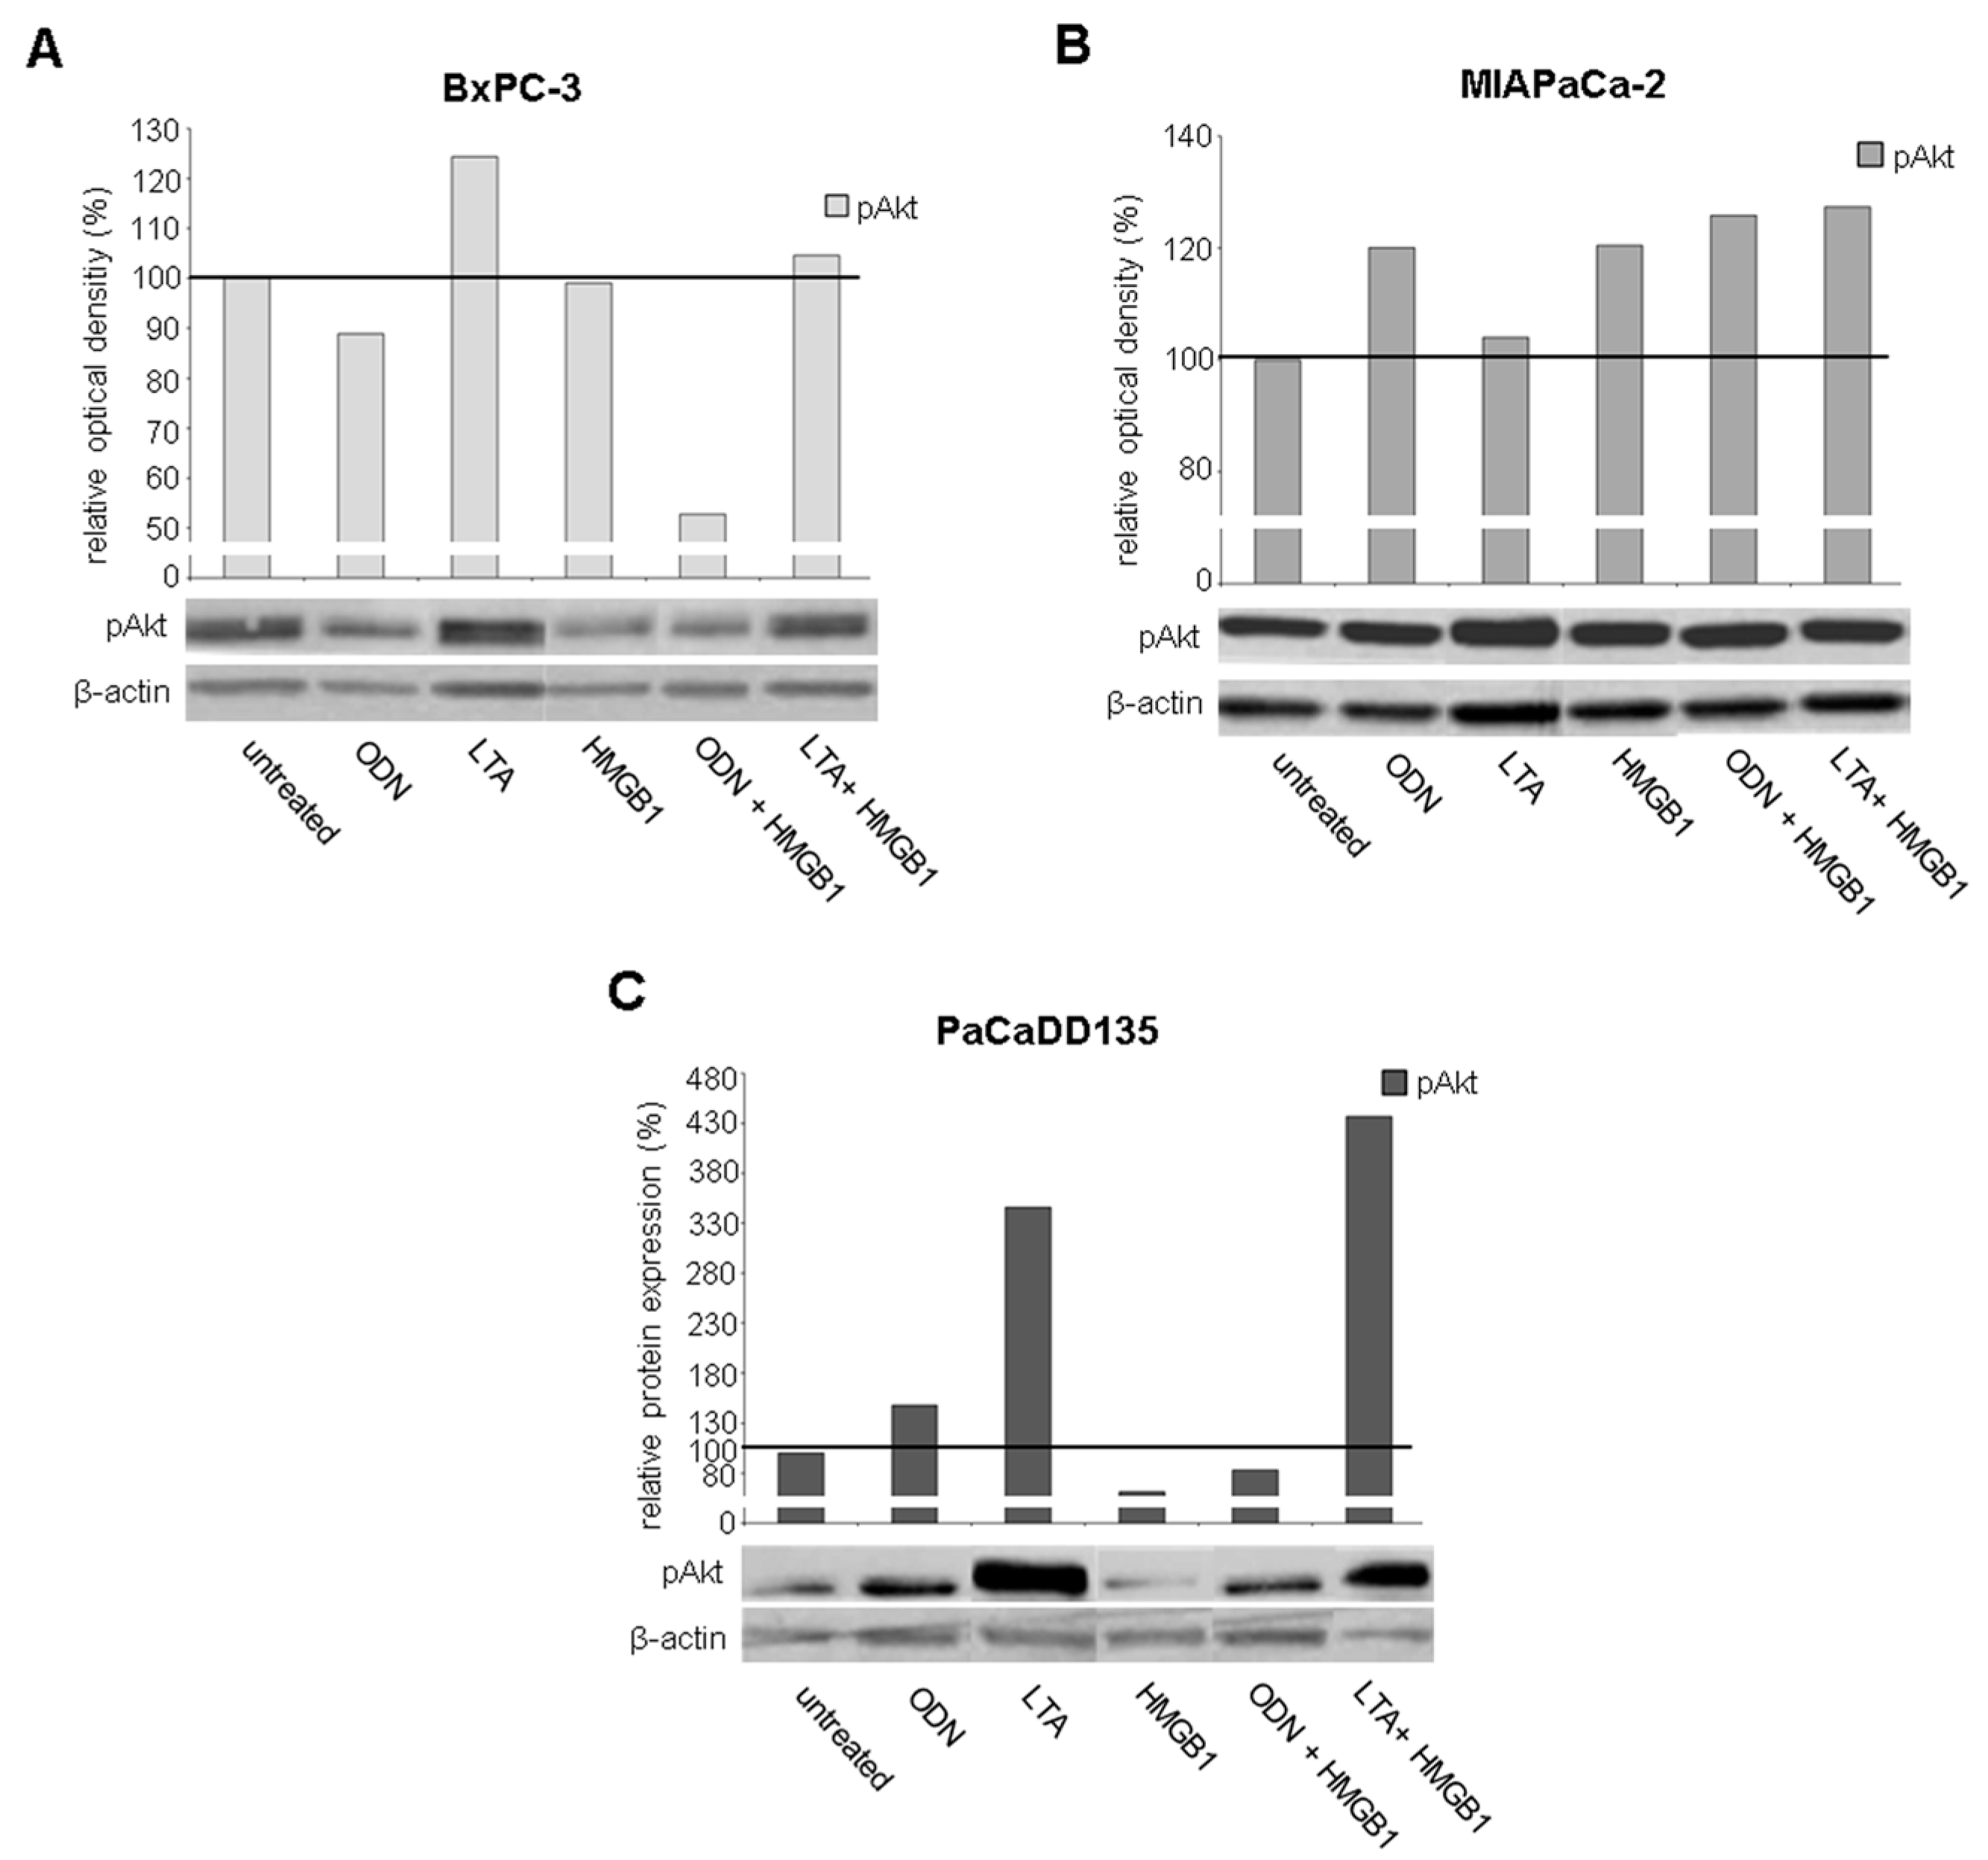
2.5. TLR Ligation Induces PI3K/Akt/mTOR Signaling
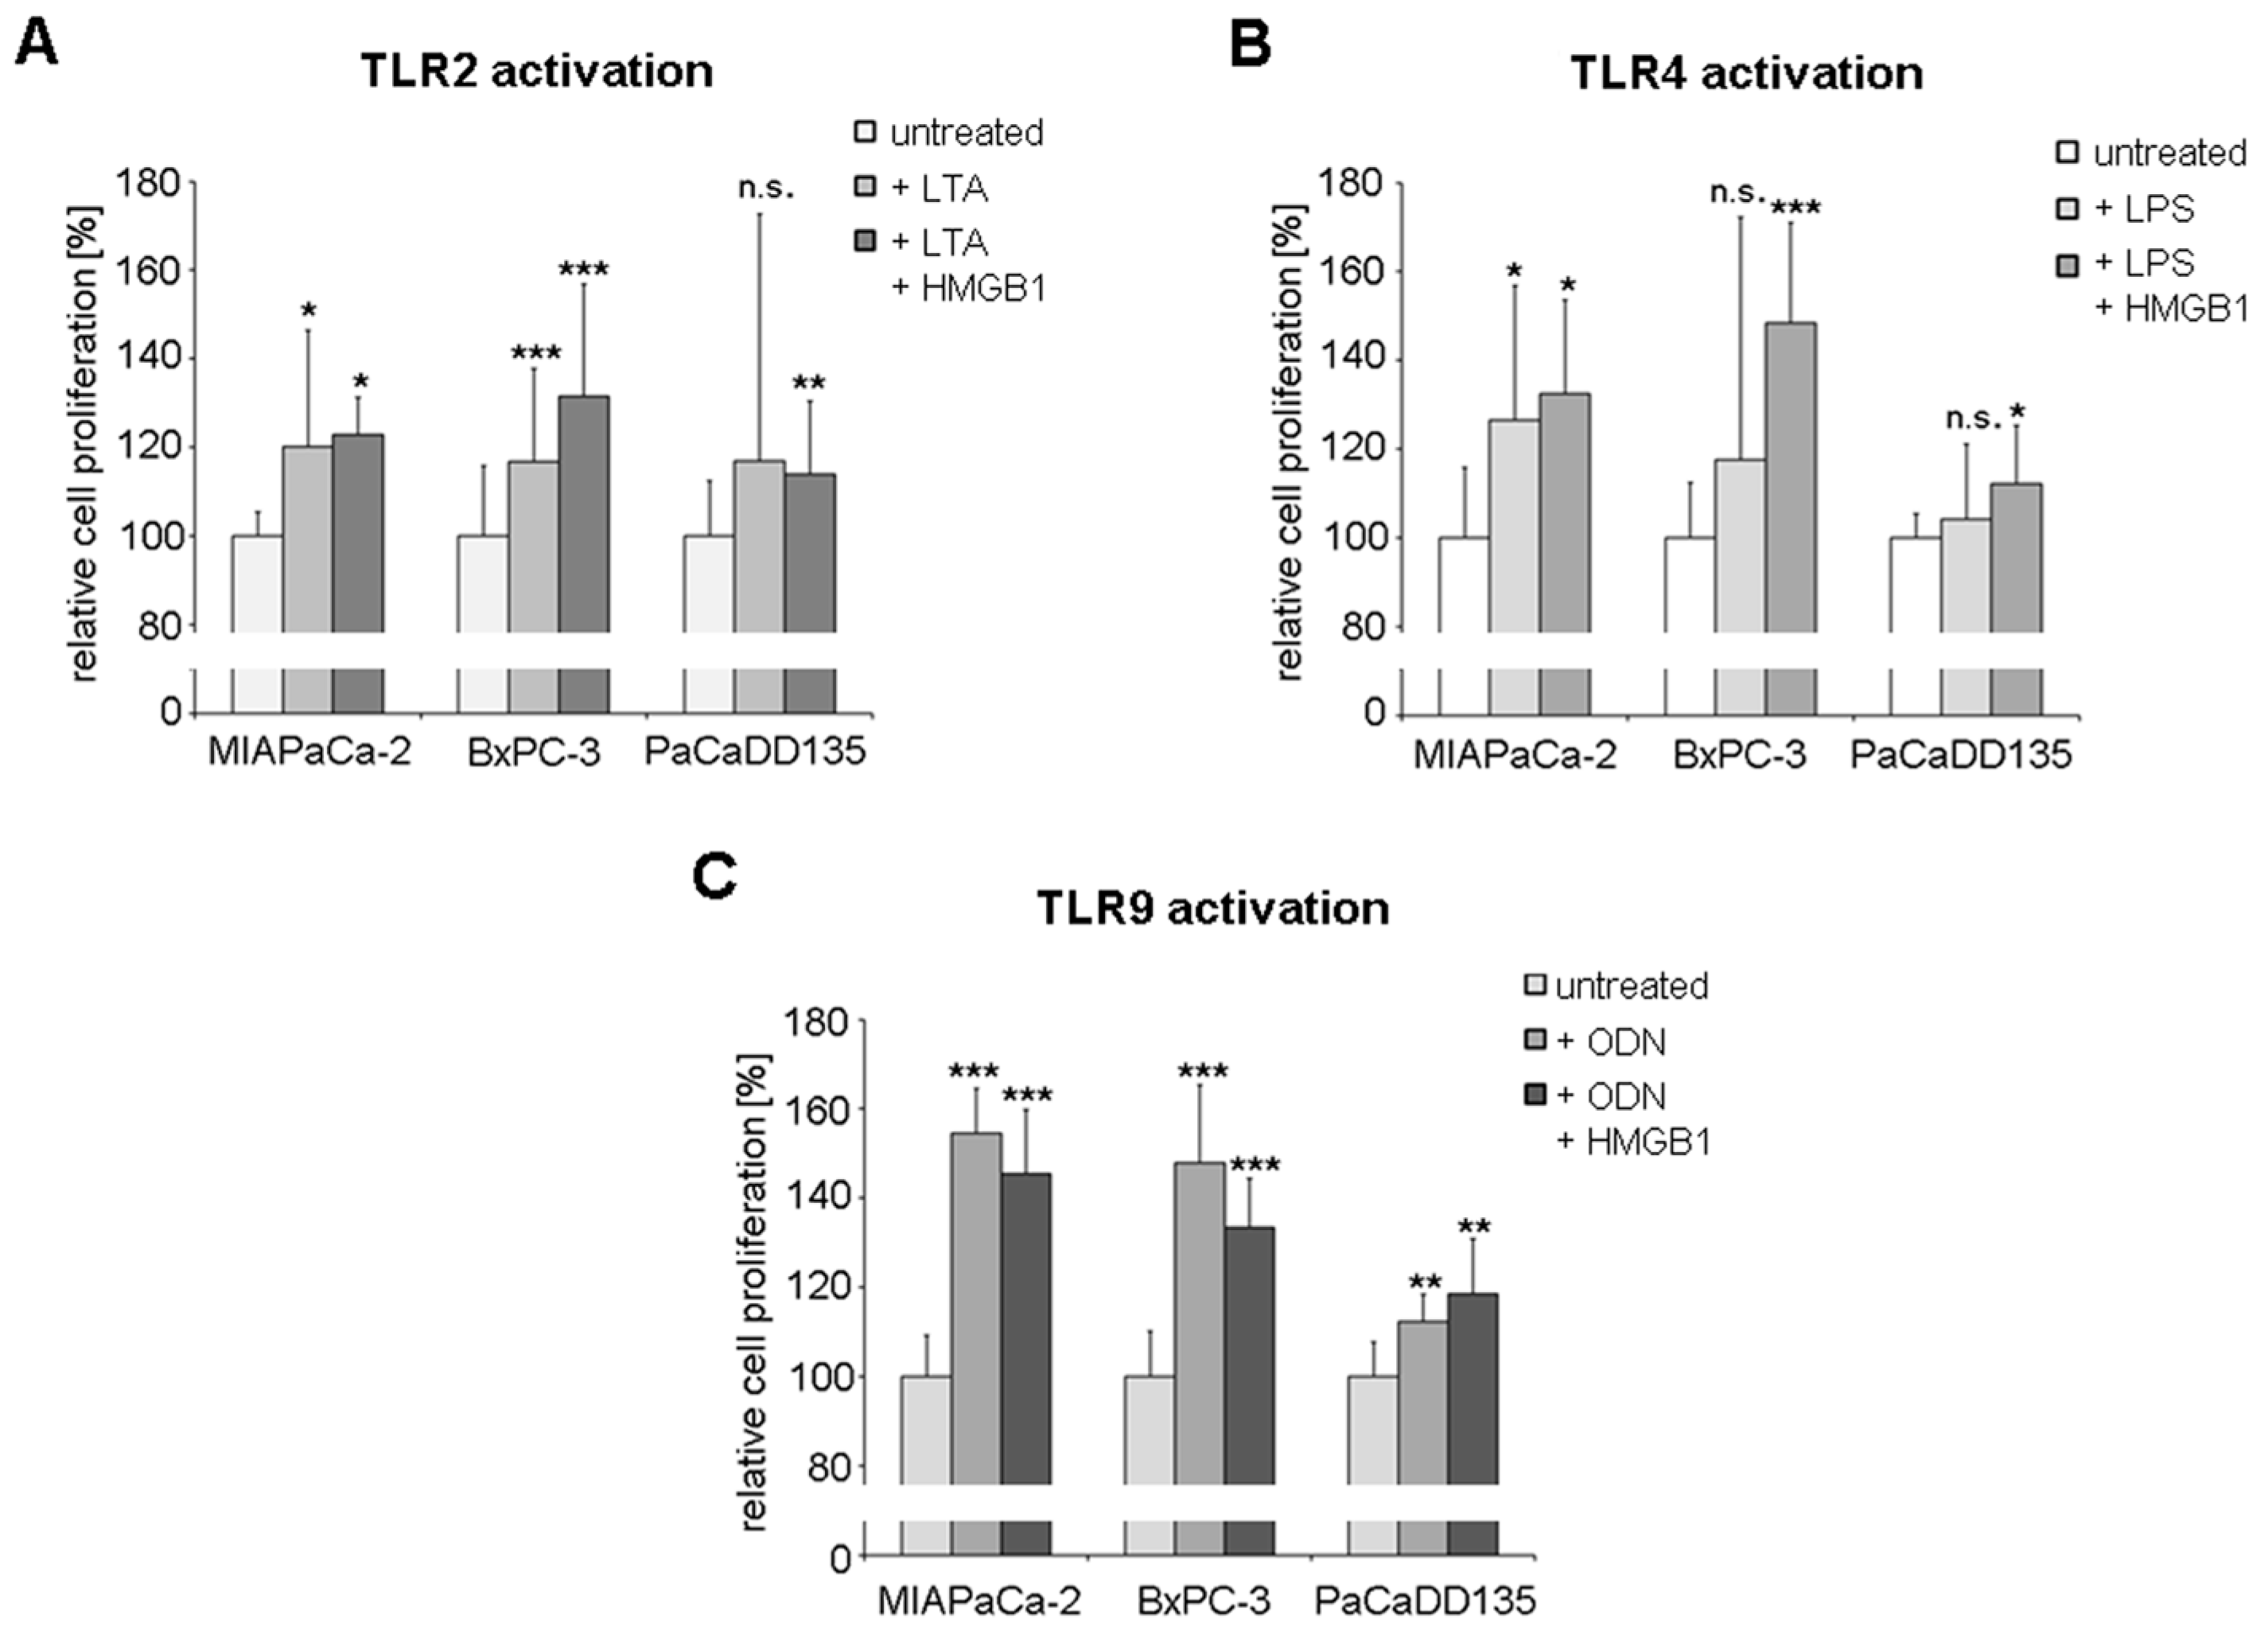
2.6. TLR Activation Results in Increased Tumor Cell Proliferation
3. Discussion
4. Materials and Methods
4.1. Patients and Human Tissues
4.2. Cell Culture
4.3. Immunofluorescence Staining
4.4. In Vitro Activation of TLR2, -4, and -9
4.5. Quantitative Real Time RT-qPCR
4.6. Western Blot
4.7. Flow Cytometry
4.8. Luminex Analysis
4.9. ATP Cell Proliferation Assay
Acknowledgments
Author Contributions
Conflicts of Interest
References
- Siegel, R.L.; Miller, K.D.; Jemal, A. Cancer statistics, 2015. CA Cancer J. Clin. 2015, 65, 5–29. [Google Scholar] [CrossRef] [PubMed]
- Malka, D.; Hammel, P.; Maire, F.; Rufat, P.; Madeira, I.; Pessione, F.; Levy, P.; Ruszniewski, P. Risk of pancreatic adenocarcinoma in chronic pancreatitis. Gut 2002, 51, 849–852. [Google Scholar] [CrossRef] [PubMed]
- Whitcomb, D.C. Inflammation and cancer V. Chronic pancreatitis and pancreatic cancer. Am. J. Physiol. Gastrointest. Liver Physiol. 2004, 287, G315–G319. [Google Scholar] [CrossRef] [PubMed]
- Farrow, B.; Evers, B.M. Inflammation and the development of pancreatic cancer. Surg. Oncol. 2002, 10, 153–169. [Google Scholar] [CrossRef]
- Janeway, C.A., Jr. Approaching the asymptote? Evolution and revolution in immunology. Cold Spring Harb. Symp. Quant. Biol. 1989, 54, 1–13. [Google Scholar] [CrossRef] [PubMed]
- Rubartelli, A.; Lotze, M.T. Inside, outside, upside down: Damage-associated molecular-pattern molecules (damps) and redox. Trends Immunol. 2007, 28, 429–436. [Google Scholar] [CrossRef] [PubMed]
- Grimm, M.; Kim, M.; Rosenwald, A.; Heemann, U.; Germer, C.T.; Waaga-Gasser, A.M.; Gasser, M. Toll-like receptor (TLR) 7 and TLR8 expression on CD133+ cells in colorectal cancer points to a specific role for inflammation-induced tlrs in tumourigenesis and tumour progression. Eur. J. Cancer 2010, 46, 2849–2857. [Google Scholar] [CrossRef] [PubMed]
- Grimmig, T.; Matthes, N.; Hoeland, K.; Tripathi, S.; Chandraker, A.; Grimm, M.; Moench, R.; Moll, E.M.; Friess, H.; Tsaur, I.; et al. TLR7 and TLR8 expression increases tumor cell proliferation and promotes chemoresistance in human pancreatic cancer. Int. J. Oncol. 2015, 47, 857–866. [Google Scholar] [CrossRef] [PubMed]
- Mai, C.W.; Kang, Y.B.; Pichika, M.R. Should a toll-like receptor 4 (TLR-4) agonist or antagonist be designed to treat cancer? TLR-4: Its expression and effects in the ten most common cancers. Onco Targets Ther. 2013, 6, 1573–1587. [Google Scholar] [PubMed]
- Muccioli, M.; Benencia, F. Toll-like receptors in ovarian cancer as targets for immunotherapies. Front. Immunol. 2014, 5, 341. [Google Scholar] [CrossRef] [PubMed]
- Dajon, M.; Iribarren, K.; Cremer, I. Toll-like receptor stimulation in cancer: A pro- and anti-tumor double-edged sword. Immunobiology 2016. [Google Scholar] [CrossRef] [PubMed]
- Gonzalez-Reyes, S.; Marin, L.; Gonzalez, L.; Gonzalez, L.O.; del Casar, J.M.; Lamelas, M.L.; Gonzalez-Quintana, J.M.; Vizoso, F.J. Study of TLR3, TLR4 and TLR9 in breast carcinomas and their association with metastasis. BMC Cancer 2010, 10. [Google Scholar] [CrossRef] [PubMed]
- Ridnour, L.A.; Cheng, R.Y.; Switzer, C.H.; Heinecke, J.L.; Ambs, S.; Glynn, S.; Young, H.A.; Trinchieri, G.; Wink, D.A. Molecular pathways: Toll-like receptors in the tumor microenvironment—Poor prognosis or new therapeutic opportunity. Clin. Cancer Res. 2013, 19, 1340–1346. [Google Scholar] [CrossRef] [PubMed]
- Sheyhidin, I.; Nabi, G.; Hasim, A.; Zhang, R.P.; Ainiwaer, J.; Ma, H.; Wang, H. Overexpression of TLR3, TLR4, TLR7 and TLR9 in esophageal squamous cell carcinoma. World J. Gastroenterol. 2011, 17, 3745–3751. [Google Scholar] [CrossRef] [PubMed]
- Park, H.D.; Lee, Y.; Oh, Y.K.; Jung, J.G.; Park, Y.W.; Myung, K.; Kim, K.H.; Koh, S.S.; Lim, D.S. Pancreatic adenocarcinoma upregulated factor promotes metastasis by regulating TLR/CXCR4 activation. Oncogene 2011, 30, 201–211. [Google Scholar] [CrossRef] [PubMed]
- Vaz, J.; Andersson, R. Intervention on toll-like receptors in pancreatic cancer. World J. Gastroenterol. 2014, 20, 5808–5817. [Google Scholar] [CrossRef] [PubMed]
- Eigenbrod, T.; Dalpke, A.H. TLR7 inhibition: A novel strategy for pancreatic cancer treatment? Jak-Stat 2013, 2, e23011. [Google Scholar] [CrossRef] [PubMed]
- Cherfils-Vicini, J.; Platonova, S.; Gillard, M.; Laurans, L.; Validire, P.; Caliandro, R.; Magdeleinat, P.; Mami-Chouaib, F.; Dieu-Nosjean, M.C.; Fridman, W.H.; et al. Triggering of TLR7 and TLR8 expressed by human lung cancer cells induces cell survival and chemoresistance. J. Clin. Investig. 2010, 120, 1285–1297. [Google Scholar] [CrossRef] [PubMed]
- Chiron, D.; Pellat-Deceunynck, C.; Amiot, M.; Bataille, R.; Jego, G. TLR3 ligand induces NF-κB activation and various fates of multiple myeloma cells depending on IFN-α production. J. Immunol. 2009, 182, 4471–4478. [Google Scholar] [CrossRef] [PubMed]
- Hsu, R.Y.; Chan, C.H.; Spicer, J.D.; Rousseau, M.C.; Giannias, B.; Rousseau, S.; Ferri, L.E. LPS-induced TLR4 signaling in human colorectal cancer cells increases β1 integrin-mediated cell adhesion and liver metastasis. Cancer Res. 2011, 71, 1989–1998. [Google Scholar] [CrossRef] [PubMed]
- Thuringer, D.; Hammann, A.; Benikhlef, N.; Fourmaux, E.; Bouchot, A.; Wettstein, G.; Solary, E.; Garrido, C. Transactivation of the epidermal growth factor receptor by heat shock protein 90 via toll-like receptor 4 contributes to the migration of glioblastoma cells. J. Biol. Chem. 2011, 286, 3418–3428. [Google Scholar] [CrossRef] [PubMed]
- Takahashi, Y.; Kitadai, Y.; Bucana, C.D.; Cleary, K.R.; Ellis, L.M. Expression of vascular endothelial growth factor and its receptor, KDR, correlates with vascularity, metastasis, and proliferation of human colon cancer. Cancer Res. 1995, 55, 3964–3968. [Google Scholar] [PubMed]
- Ferrara, N. Vascular endothelial growth factor: Basic science and clinical progress. Endocr. Rev. 2004, 25, 581–611. [Google Scholar] [CrossRef] [PubMed]
- Ho, Q.T.; Kuo, C.J. Vascular endothelial growth factor: Biology and therapeutic applications. Int. J. Biochem. Cell Biol. 2007, 39, 1349–1357. [Google Scholar] [CrossRef] [PubMed]
- Tsan, M.F.; Gao, B. Endogenous ligands of Toll-like receptors. J. Leukoc. Biol. 2004, 76, 514–519. [Google Scholar] [CrossRef] [PubMed]
- Liu, J.; Zhang, B.L.; Sun, C.L.; Wang, J.; Li, S.; Wang, J.F. High mobility group box1 protein is involved in acute inflammation induced by clostridium difficile toxin A. Acta Biochim. Biophys. Sin. 2016, 48, 554–562. [Google Scholar] [CrossRef] [PubMed]
- Shibuya, M. Vascular endothelial growth factor and its receptor system: Physiological functions in angiogenesis and pathological roles in various diseases. J. Biochem. 2013, 153, 13–19. [Google Scholar] [CrossRef] [PubMed]
- Shibuya, M.; Claesson-Welsh, L. Signal transduction by VEGF receptors in regulation of angiogenesis and lymphangiogenesis. Exp. Cell. Res. 2006, 312, 549–560. [Google Scholar] [CrossRef] [PubMed]
- Stuttfeld, E.; Ballmer-Hofer, K. Structure and function of VEGF receptors. IUBMB Life 2009, 61, 915–922. [Google Scholar] [CrossRef] [PubMed]
- Senger, D.R.; Galli, S.J.; Dvorak, A.M.; Perruzzi, C.A.; Harvey, V.S.; Dvorak, H.F. Tumor cells secrete a vascular permeability factor that promotes accumulation of ascites fluid. Science 1983, 219, 983–985. [Google Scholar] [CrossRef] [PubMed]
- Heldin, C.H. Targeting the PDGF signaling pathway in tumor treatment. Cell Commun. Signal. 2013, 11. [Google Scholar] [CrossRef] [PubMed]
- Moench, R.; Grimmig, T.; Kannen, V.; Tripathi, S.; Faber, M.; Moll, E.-M.; Chandraker, A.; Lissner, R.; Germer, C.-T.; Waaga-Gasser, A.M.; et al. Exclusive inhibition of PI3K/Akt/mTOR signaling is not sufficient to prevent PDGF-mediated effects on glycolysis and proliferation in colorectal cancer. Oncotarget 2016, 5. [Google Scholar] [CrossRef] [PubMed]
- Taeger, J.; Moser, C.; Hellerbrand, C.; Mycielska, M.E.; Glockzin, G.; Schlitt, H.J.; Geissler, E.K.; Stoeltzing, O.; Lang, S.A. Targeting FGFR/PDGFR/VEGFR impairs tumor growth, angiogenesis, and metastasis by effects on tumor cells, endothelial cells, and pericytes in pancreatic cancer. Mol. Cancer Ther. 2011, 10, 2157–2167. [Google Scholar] [CrossRef] [PubMed]
- Von Marschall, Z.; Cramer, T.; Hocker, M.; Burde, R.; Plath, T.; Schirner, M.; Heidenreich, R.; Breier, G.; Riecken, E.O.; Wiedenmann, B.; et al. De novo expression of vascular endothelial growth factor in human pancreatic cancer: Evidence for an autocrine mitogenic loop. Gastroenterology 2000, 119, 1358–1372. [Google Scholar] [CrossRef] [PubMed]
- Weissmueller, S.; Manchado, E.; Saborowski, M.; Morris, J.P.t.; Wagenblast, E.; Davis, C.A.; Moon, S.H.; Pfister, N.T.; Tschaharganeh, D.F.; Kitzing, T.; et al. Mutant p53 drives pancreatic cancer metastasis through cell-autonomous PDGF receptor β signaling. Cell 2014, 157, 382–394. [Google Scholar] [CrossRef] [PubMed]
- Nandy, D.; Mukhopadhyay, D. Growth factor mediated signaling in pancreatic pathogenesis. Cancers 2011, 3, 841–871. [Google Scholar] [CrossRef] [PubMed]
- Meteoglu, I.; Erdogdu, I.H.; Meydan, N.; Erkus, M.; Barutca, S. NF-κB expression correlates with apoptosis and angiogenesis in clear cell renal cell carcinoma tissues. J. Exp. Clin. Cancer Res. 2008, 27. [Google Scholar] [CrossRef] [PubMed]
- Zhang, Z.; Zheng, Y.; Zhu, R.; Zhu, Y.; Yao, W.; Liu, W.; Gao, X. The ERK/eIF4F/Bcl-XL pathway mediates SGP-2 induced osteosarcoma cells apoptosis in vitro and in vivo. Cancer Lett. 2014, 352, 203–213. [Google Scholar] [CrossRef] [PubMed]
- Shcheblyakov, D.V.; Logunov, D.Y.; Tukhvatulin, A.I.; Shmarov, M.M.; Naroditsky, B.S.; Gintsburg, A.L. Toll-Like Receptors (TLRs): The Role in Tumor Progression. Acta Naturae 2010, 2, 21–29. [Google Scholar] [PubMed]
- Street, S.E.; Cretney, E.; Smyth, M.J. Perforin and interferon-γ activities independently control tumor initiation, growth, and metastasis. Blood 2001, 97, 192–197. [Google Scholar] [CrossRef] [PubMed]
- Swann, J.B.; Hayakawa, Y.; Zerafa, N.; Sheehan, K.C.; Scott, B.; Schreiber, R.D.; Hertzog, P.; Smyth, M.J. Type I IFN contributes to NK cell homeostasis, activation, and antitumor function. J. Immunol. 2007, 178, 7540–7549. [Google Scholar] [CrossRef] [PubMed]
- Stockfleth, E.; Trefzer, U.; Garcia-Bartels, C.; Wegner, T.; Schmook, T.; Sterry, W. The use of Toll-like receptor-7 agonist in the treatment of basal cell carcinoma: An overview. Br. J. Dermatol. 2003, 149, 53–56. [Google Scholar] [CrossRef] [PubMed]
- Krieg, A.M. Toll-like receptor 9 (TLR9) agonists in the treatment of cancer. Oncogene 2008, 27, 161–167. [Google Scholar] [CrossRef] [PubMed]
- Kanzler, H.; Barrat, F.J.; Hessel, E.M.; Coffman, R.L. Therapeutic targeting of innate immunity with Toll-like receptor agonists and antagonists. Nat. Med. 2007, 13, 552–559. [Google Scholar] [CrossRef] [PubMed]
- Balkwill, F.; Coussens, L.M. Cancer: An inflammatory link. Nature 2004, 431, 405–406. [Google Scholar] [CrossRef] [PubMed]
- Rakoff-Nahoum, S.; Medzhitov, R. Role of toll-like receptors in tissue repair and tumorigenesis. Biochemistry 2008, 73, 555–561. [Google Scholar] [CrossRef] [PubMed]


© 2016 by the authors; licensee MDPI, Basel, Switzerland. This article is an open access article distributed under the terms and conditions of the Creative Commons Attribution (CC-BY) license (http://creativecommons.org/licenses/by/4.0/).
Share and Cite
Grimmig, T.; Moench, R.; Kreckel, J.; Haack, S.; Rueckert, F.; Rehder, R.; Tripathi, S.; Ribas, C.; Chandraker, A.; Germer, C.T.; et al. Toll Like Receptor 2, 4, and 9 Signaling Promotes Autoregulative Tumor Cell Growth and VEGF/PDGF Expression in Human Pancreatic Cancer. Int. J. Mol. Sci. 2016, 17, 2060. https://doi.org/10.3390/ijms17122060
Grimmig T, Moench R, Kreckel J, Haack S, Rueckert F, Rehder R, Tripathi S, Ribas C, Chandraker A, Germer CT, et al. Toll Like Receptor 2, 4, and 9 Signaling Promotes Autoregulative Tumor Cell Growth and VEGF/PDGF Expression in Human Pancreatic Cancer. International Journal of Molecular Sciences. 2016; 17(12):2060. https://doi.org/10.3390/ijms17122060
Chicago/Turabian StyleGrimmig, Tanja, Romana Moench, Jennifer Kreckel, Stephanie Haack, Felix Rueckert, Roberta Rehder, Sudipta Tripathi, Carmen Ribas, Anil Chandraker, Christoph T. Germer, and et al. 2016. "Toll Like Receptor 2, 4, and 9 Signaling Promotes Autoregulative Tumor Cell Growth and VEGF/PDGF Expression in Human Pancreatic Cancer" International Journal of Molecular Sciences 17, no. 12: 2060. https://doi.org/10.3390/ijms17122060