Article

Genetic Heterogeneity of HER2 Amplification and Telomere Shortening in Papillary Thyroid Carcinoma

1
Department of Biomedical Sciences, University of Cagliari, Cittadella Universitaria, Monserrato 09042, Italy
2
Department of Medical, Surgical and Neurological Sciences, University of Siena, Siena 53100, Italy
*
Author to whom correspondence should be addressed.
These authors contributed equally to this work.
Int. J. Mol. Sci. 2016, 17(10), 1759; https://doi.org/10.3390/ijms17101759
Submission received: 4 August 2016 / Revised: 20 September 2016 / Accepted: 12 October 2016 / Published: 21 October 2016
(This article belongs to the Special Issue Current Knowledge in Thyroid Cancer—From Bench to Bedside)

Abstract

:
Extensive research is dedicated to understanding if sporadic and familial papillary thyroid carcinoma are distinct biological entities. We have previously demonstrated that familial papillary thyroid cancer (fPTC) cells exhibit short relative telomere length (RTL) in both blood and tissues and that these features may be associated with chromosome instability. Here, we investigated the frequency of HER2 (Human Epidermal Growth Factor Receptor 2) amplification, and other recently reported genetic alterations in sporadic PTC (sPTC) and fPTC, and assessed correlations with RTL and BRAF mutational status. We analyzed HER2 gene amplification and the integrity of ALK, ETV6, RET, and BRAF genes by fluorescence in situ hybridization in isolated nuclei and paraffin-embedded formalin-fixed sections of 13 fPTC and 18 sPTC patients. We analyzed BRAFV600E mutation and RTL by qRT-PCR. Significant HER2 amplification (p = 0.0076), which was restricted to scattered groups of cells, was found in fPTC samples. HER2 amplification in fPTCs was invariably associated with BRAFV600E mutation. RTL was shorter in fPTCs than sPTCs (p < 0.001). No rearrangements of other tested genes were observed. These findings suggest that the association of HER2 amplification with BRAFV600E mutation and telomere shortening may represent a marker of tumor aggressiveness, and, in refractory thyroid cancer, may warrant exploration as a site for targeted therapy.

Graphical Abstract

1. Introduction

The most common histological subtype of non-medullary thyroid carcinoma (NMTC) is papillary thyroid carcinoma (PTC), which represents 75%–85% of all thyroid cancer. Although mostly sporadic (sPTC), there is some evidence for a familial form of PTC (fPTC) not associated with known Mendelian syndromes. Familial PTC is observed in approximately 5%–10% of NMTC cases [1] and, despite the extensive research dedicated to understand if it is a distinct biological entity than sPTC [2], this distinction remains controversial. Indeed, the most common somatic alterations, such as mutations in RAS and BRAF and rearrangements of RET/PTC and NTRK1, exhibit similar prevalence and distribution in both sPTC and fPTC [3]. No oncogenic germline mutations of these genes have been detected in fPTC cases [4]. However, there is an ongoing debate on the possible association of HAPB2 germline mutation to the predisposition to familial forms of NMTC [5,6,7,8]. Generally speaking, most PTC can be treated effectively with surgery and radioactive iodine therapy. However, for cases in which these treatments are not effective, targeted drugs might be considered. Kinase inhibitors, such as sorafenib and lenvatinib, are now used as targeted drugs [9,10]. Less frequent genetic alterations, such as rearrangements of ALK [11] and ETV6 [12], identified in sPTC, but not yet investigated in fPTC, also represent new therapeutic targets. In addition, the amplification of the HER2 gene, reported in highly-malignant PTC nodules [13], might be added to the list of drug-targetable genes. The HER2 amplification in PTC was observed by fluorescence in situ hybridization (FISH), and average telomere length in HER2-positive (HER2+) PTC was significantly shorter than HER2-negative (HER2−) PTC [13]. Of possible significance, shorter average telomere length has also been reported in fPTC compared to sPTC [14]. These observations prompted us to verify HER2 amplification and telomere length status in 13 fPTC and 18 sPTC. Tumors were also investigated for integrity of the RET gene, which is rearranged in 10%–40% of PTC, and ALK, ETV6, and BRAF genes, which are rearranged in a minority of PTC. BRAFV600E mutation, which is associated with an aggressive biological behavior [15], was also evaluated. Our results indicate an increased prevalence of occasional HER2 gene intermediate amplification in fPTC compared to sPTC, and shorter telomeres in all fPTC, including those with HER2 amplification, compared to sPTC. In addition, all HER2+ samples invariably possessed the BRAFV600E mutation, but not vice versa. The association might represent a marker of tumor aggressiveness and, in refractory thyroid cancer, may indicate possible exploration for targeted therapy. Additionally, the simultaneous occurrence of these three specific molecular alterations may be suggestive of the existence of a specific fPTC subgroup.

2. Results

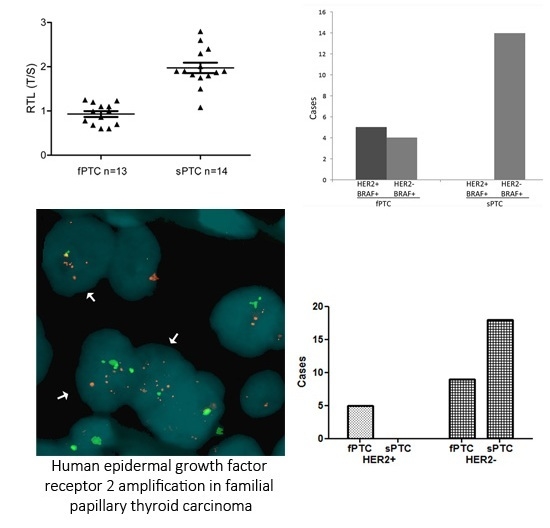
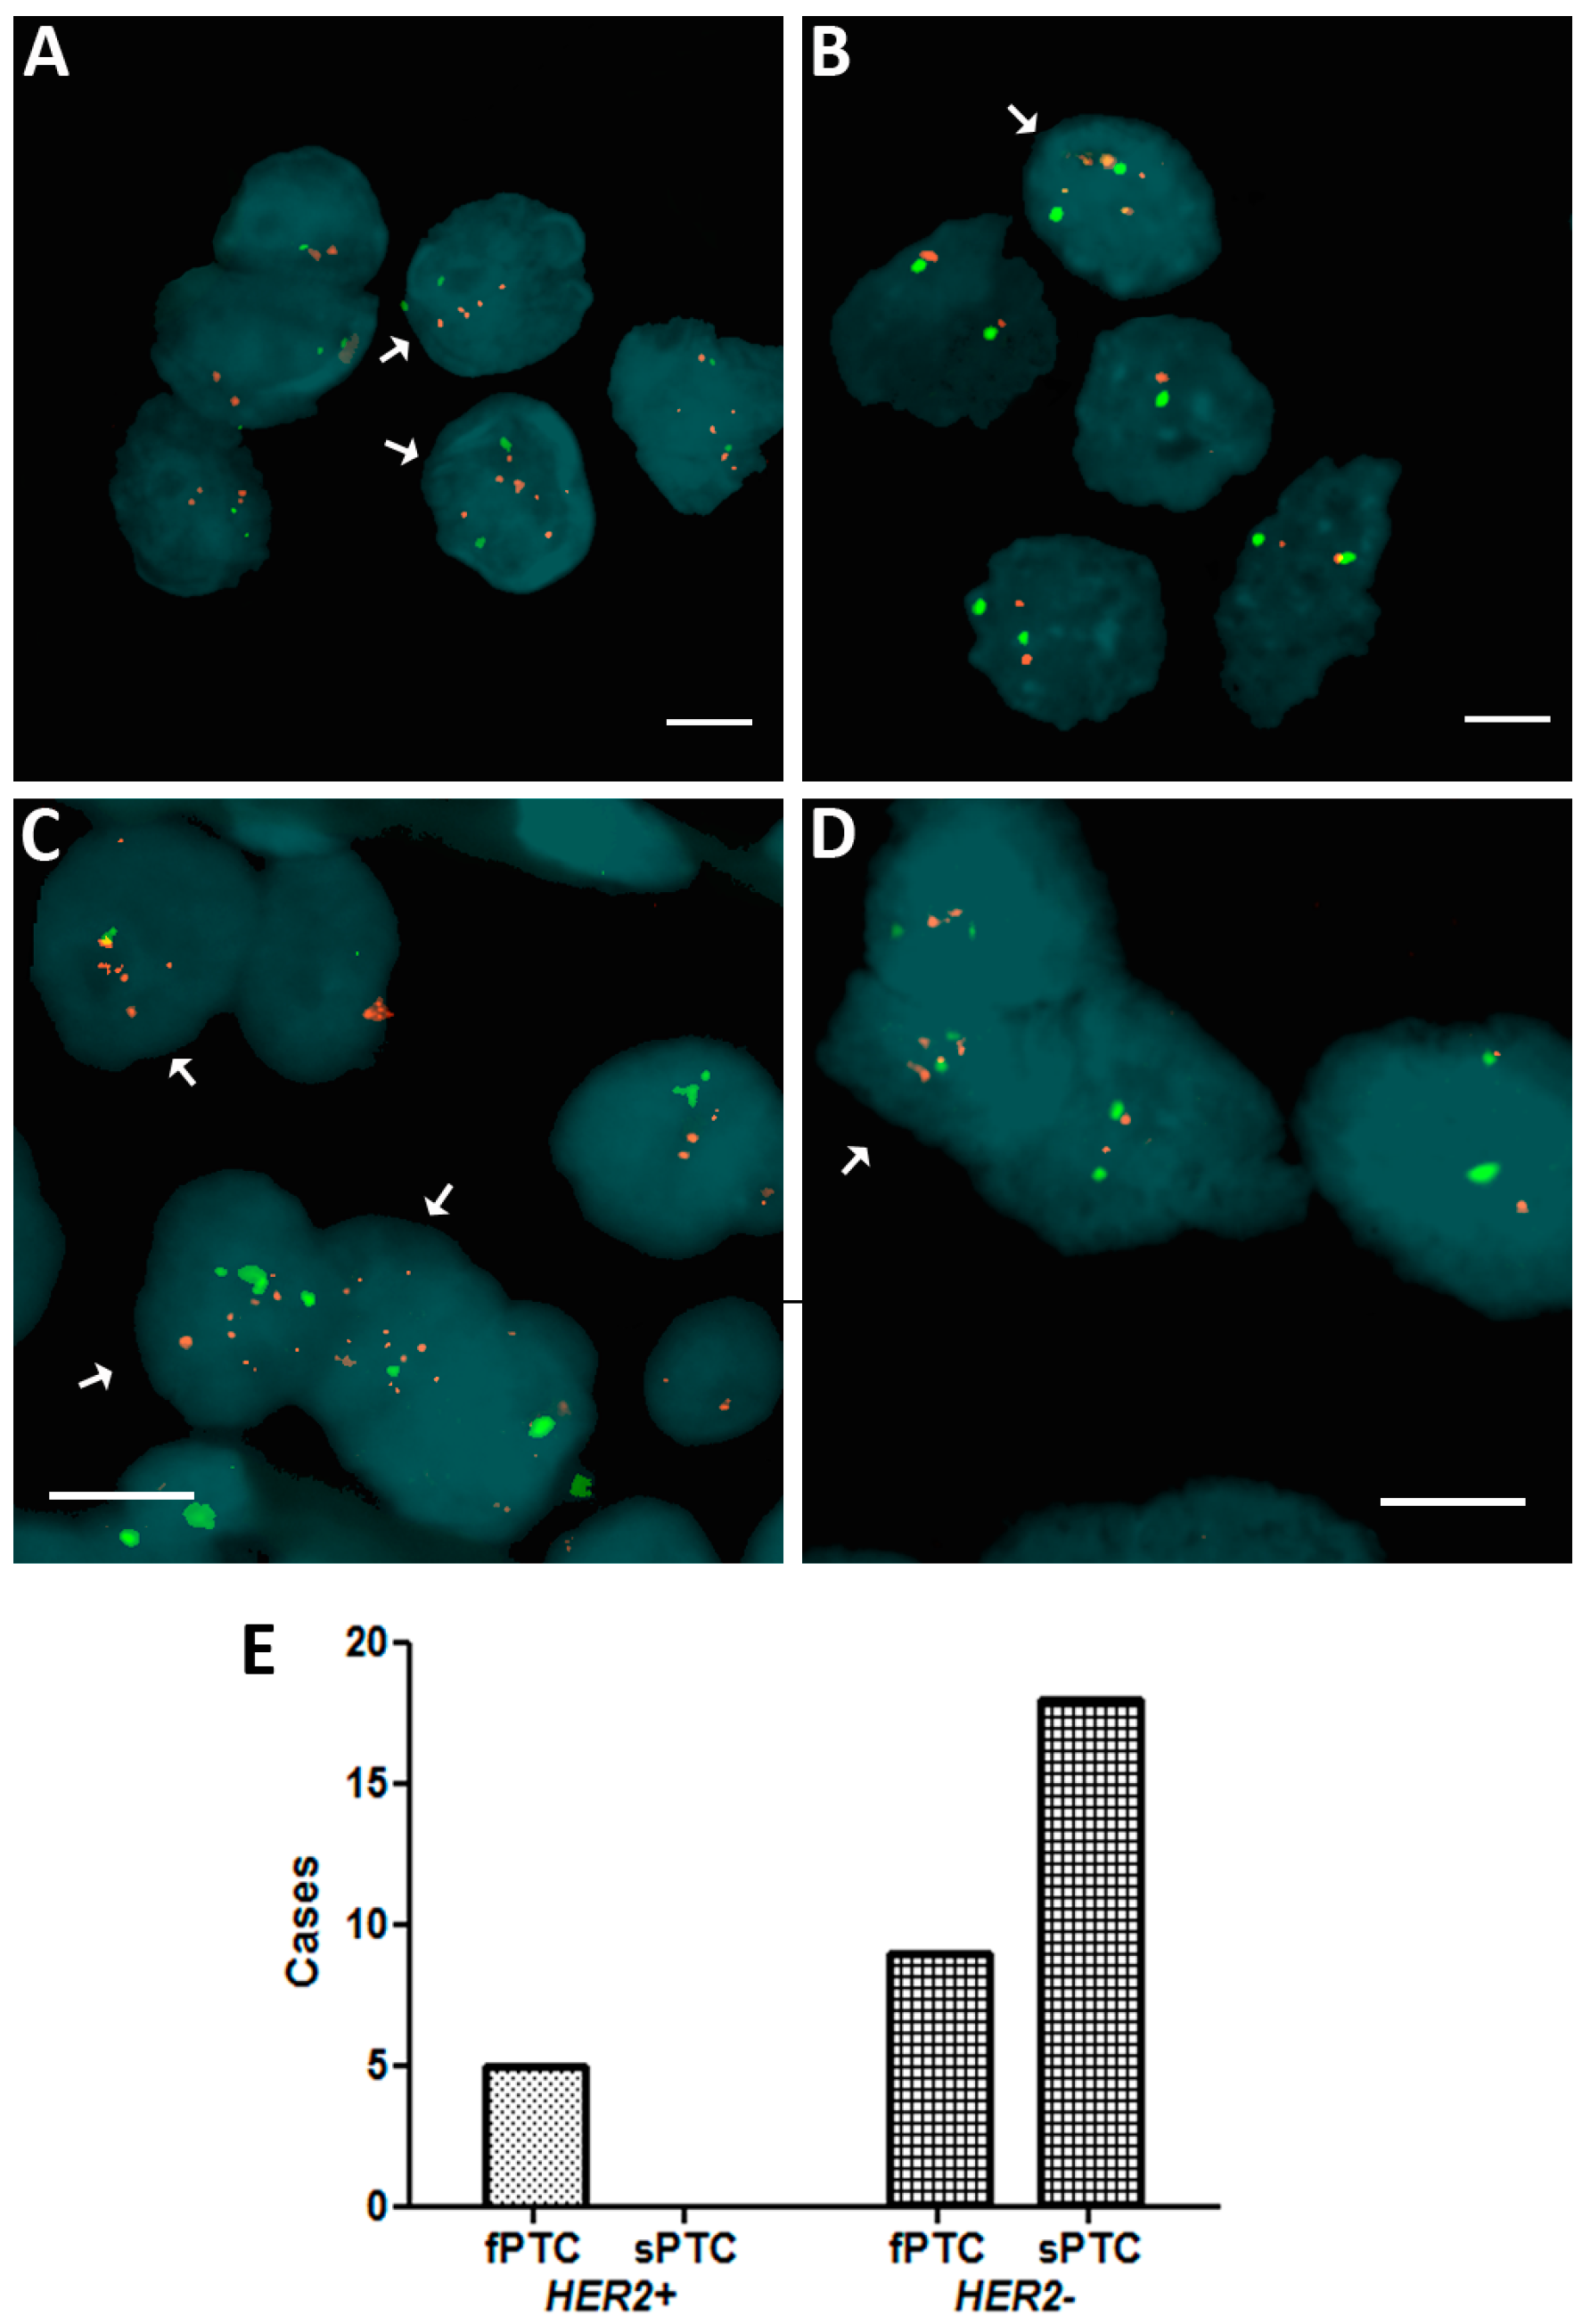
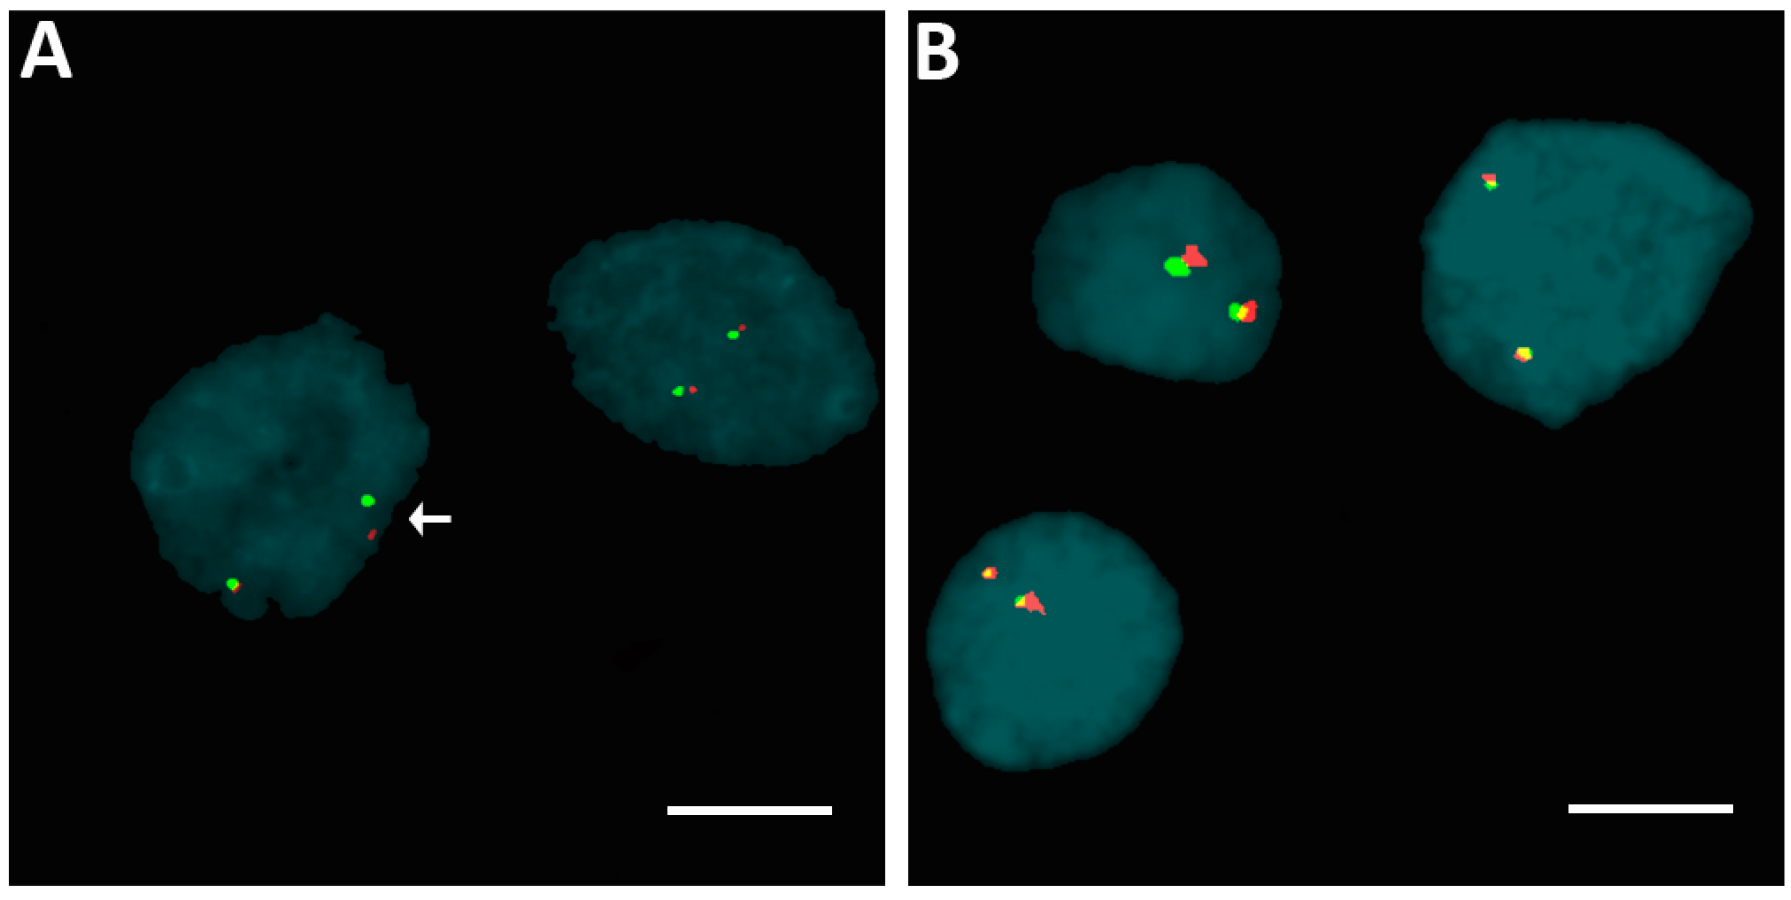
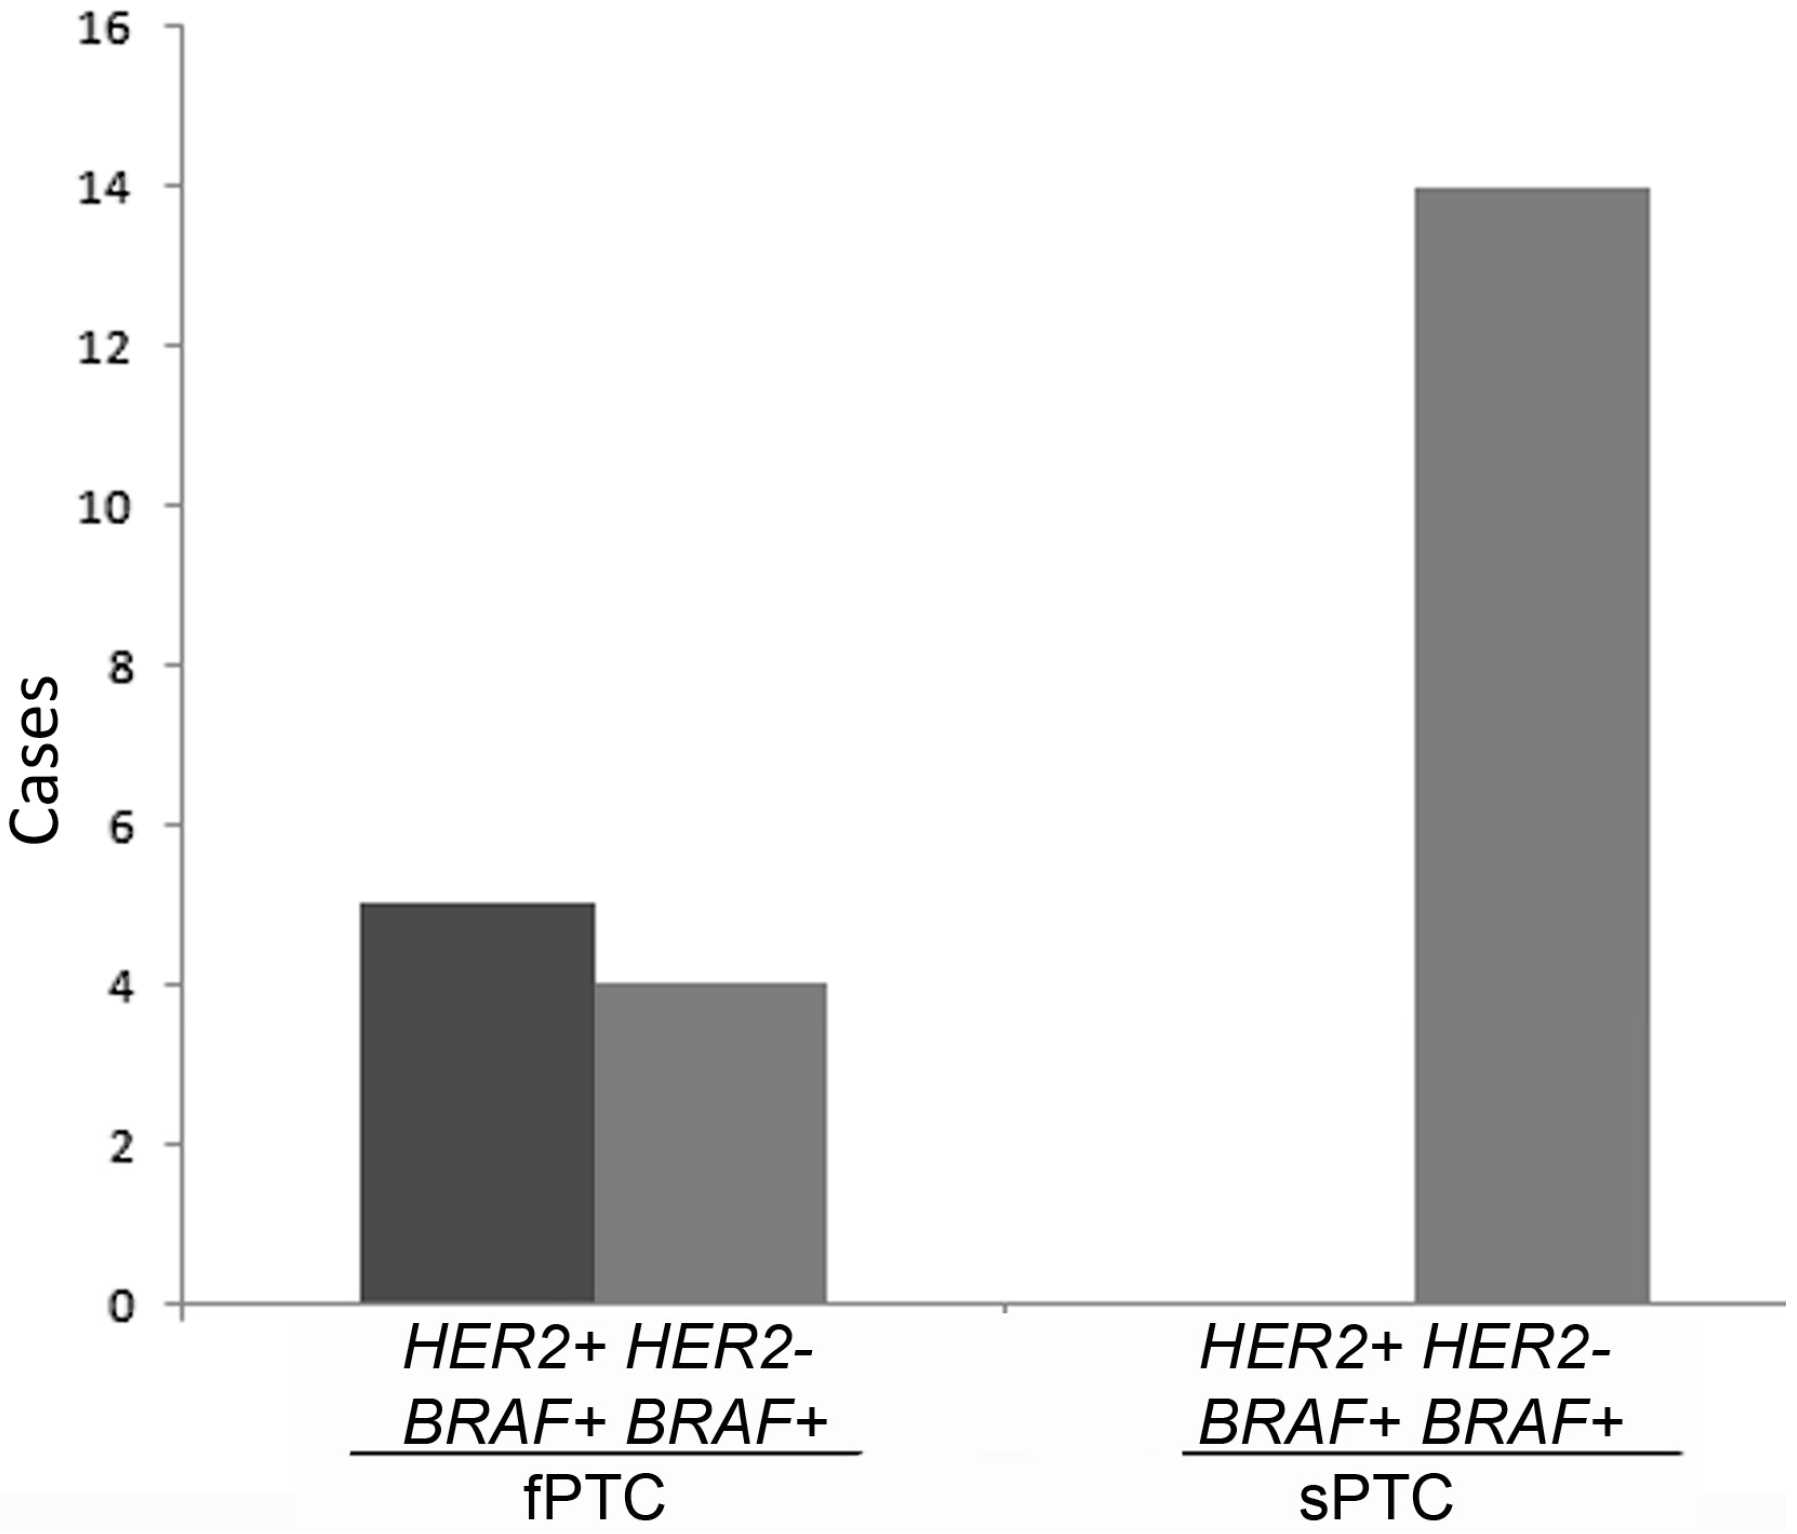
2.1. Human Epidermal Growth Factor Receptor 2 (HER2) Amplification in Familial Papillary Thyroid Carcinoma (fPTC) and Sporadic Papillary Thyroid Carcinoma (sPTC)

HER2 amplification was evaluated in 13 fPTC (seven females, mean age at diagnosis of 53.7 ± 14.2; six males, mean age at diagnosis 49.0 ± 21.5) and 18 sPTC (15 females, mean age at diagnosis 46.6 ± 7.8; three males, mean age at diagnosis 43.6 ± 13.6). We found that isolated fPTC and sPTC nuclei were HER2− according to the Wolff criteria (originally developed for breast cancer formalin-fixed paraffin-embedded (FFPE) examination) [16], although a number of cases showed scattered HER2+ cells, ranging from 1.4% to 9% in fPTC and from 1% to 2.4% in sPTC (Figure 1A,B). Based on these observations, and on the lack of specific criteria for the evaluation of HER2 amplification in thyroid tumors, we analyzed the distribution of HER2+ cells in these cases to determine if they met the criteria for the presence of genetic heterogeneity (>5% and <50%) according to Vance [17]. We found significant genetic heterogeneity in the distribution of HER2 amplification in fPTC compared to sPTC (p = 0.0076) (Figure 1C–E). We found that 5/13 (38.5%) fPTC cases showed 5.1% to 10% HER2+ cells. FISH on FFPE from sPTC confirmed the findings obtained from isolated nuclei that no sPTC case exceeded the cut-off value. When fPTCs were analyzed by immunohistochemistry using an anti-c-erbB2 antibody [18] to detect HER2 protein expression, inconsistent results compared to the FISH analysis were obtained. However, this result was possibly biased by the age of the available histological sections (7–20 years).

2.2. Rearrangements of ALK, BRAF, ETV6, and RET Genes

We found no rearrangements of ALK, BRAF, and ETV6 genes by fluorescence in situ hybridization. We found one case of sPTC with a RET rearrangement, the remaining cases exhibited neither disruptions nor numerical changes in RET gene (see examples in Figure 2A,B).

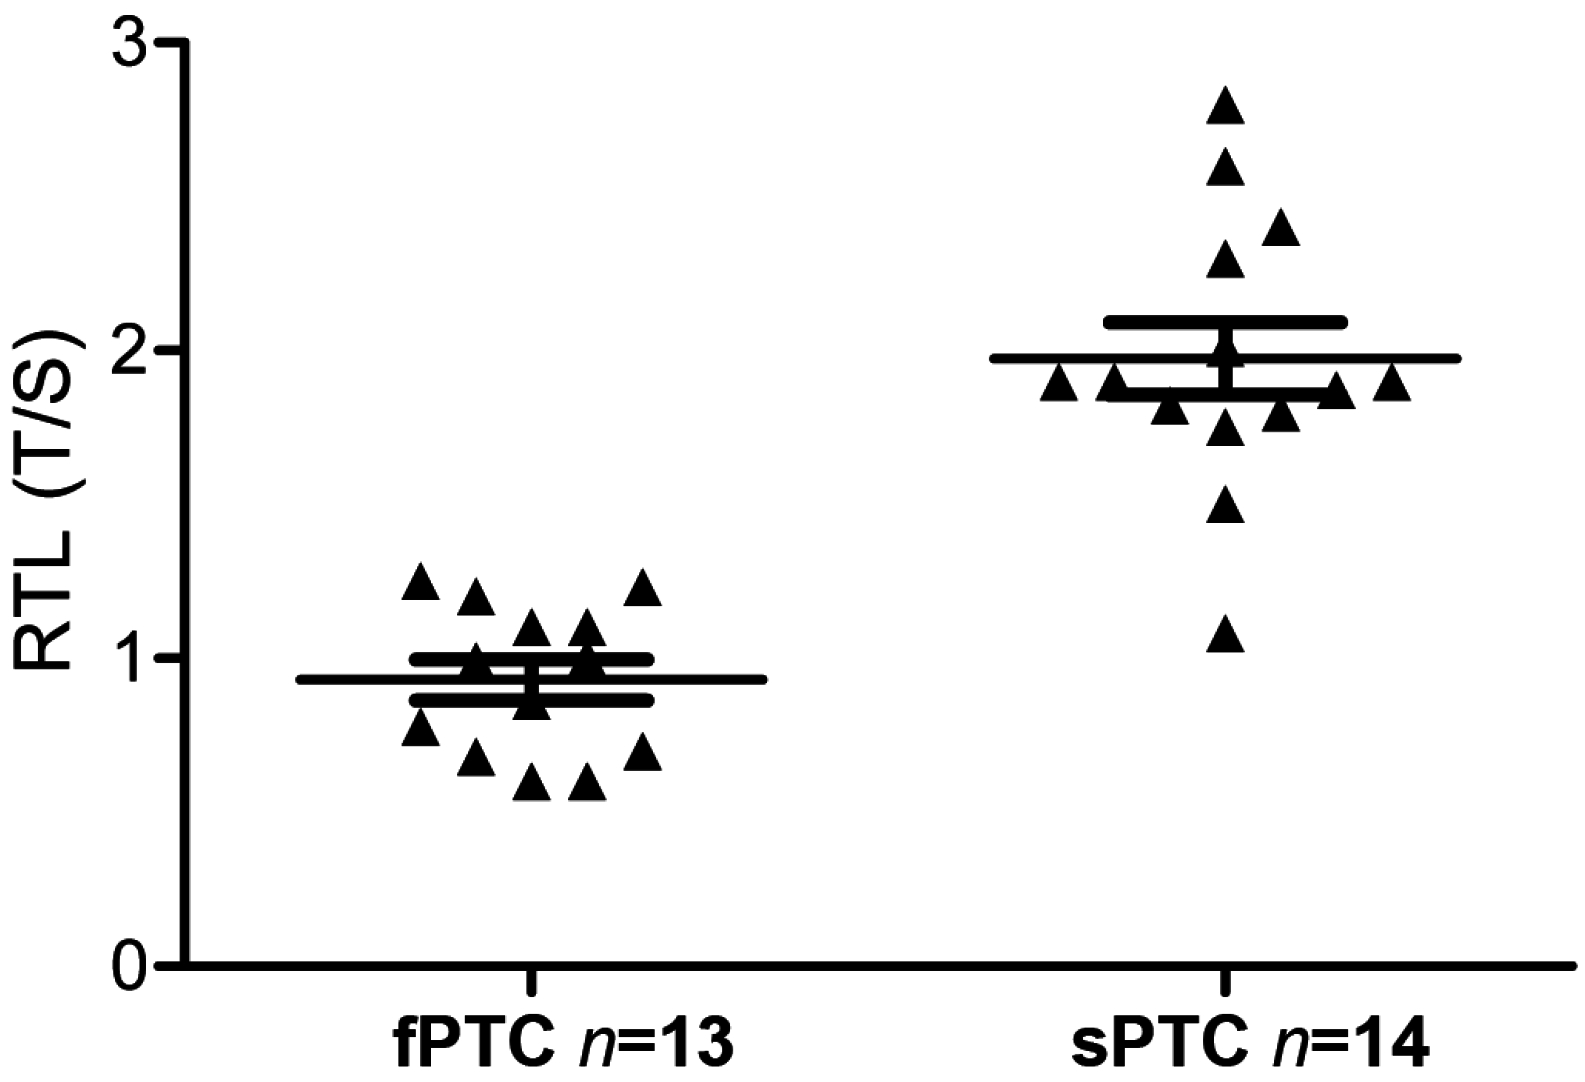
2.3. Telomere Length and BRAFV600E Mutation in fPTC and sPTC Patients

Relative telomere length was significantly shorter in fPTC samples than in sPTC samples: median = 0.93 (25th–75th percentile: 0.6–1.2) vs. 1.9 (25th–75th percentile: 1.8–2.3) for fPTC vs. sPTC, respectively (p < 0.001) (Figure 3). This result was not due to a difference in the patient’s age and sex, as sporadic cases were selected to be age/sex-matched with familial patients (Table 1).
BRAFV600E mutation was detected in 9/13 (69.0%) fPTC and 14/18 (78%) sPTC (p = 0.68), which was not statistically significant. All HER2+ fPTC were BRAFV600E-positive (BRAF+), although not all BRAF+ fPTC were HER2+ (Figure 4).

3. Discussion

Amplification of the HER2 gene in thyroid cancer was first uncovered by FISH analysis of follicular cells from highly malignant PTC nodules [13]. They observed that HER2+ PTC exhibited shorter telomeres than HER2− PTC. PTC is an entity mostly recognized as sporadic, although the familial form may account for approximately 5% of cases [1,2]. Familial PTC may occur in combination with other Mendelian cancer syndromes (familial adenomatous polyposis, Gardner’s syndrome, Peutz-Jeghers syndrome, and Cowden’s syndrome) or may be unassociated with other neoplasms in familial aggregates. However, although the risk of developing extra-thyroidal malignancy in non-Cowden’s syndrome is documented [21,22], the clinical correlation between sporadic breast cancer (20% of which are HER2+) [23] and PTC is still controversial [24,25], and the co-occurrence of both disorders in the same individual is a subject of extensive debate [26,27]. None of our fPTC patients had clinical or pathological evidence of hereditary syndromes associated with NMTC, breast cancer, or other types of sporadic tumors, except for one male patient who had a previous squamous cell carcinoma of the auricle. The thyroid cancer of this patient was not associated with any genetic alterations of the genes examined here. As more than 5%, but fewer than 50%, of nuclei were found to be amplified in our FFPE sections, we use the Vance criteria [17] in the interpretation of our results. Our data indicated a significant difference in HER2 amplification (p = 0.019) in fPTC compared to sPTC. This finding indicates a degree of genetic heterogeneity in the fPTC group and suggests that HER2+ cells in fPTC possibly undergo apoptosis to a lesser extent than in sPTC. The observation adds thyroid carcinoma to the list of tumors that exhibit HER2+. HER2+ is indeed observed in a growing number of other tumors, including advanced gastric and esophageal cancer [28], ovarian [29], colon [30], bladder, lung, uterine, cervix, head and neck, and endometrial cancer [31]. The extracellular domain of the HER2 receptor has an essential role in cell proliferation and anti-apoptotic processes, making HER2+ breast and gastric/gastroesophageal cancers more likely to respond to targeted therapies in combination with chemotherapy than HER2− tumors. A wide range of solid tumors showing deregulation of HER2 expression are regarded as biologically aggressive. Familial PTC is often associated with a more severe phenotype than its sporadic counterpart [32], and often harbor BRAFV600E mutation. BRAFV600E is considered to have a prognostic value in PTC [33], and usually identifies differentiated thyroid tumors with advanced clinicopathological features. BRAFV600E is also strongly associated with PTC patient mortality [15]. In contrast to lung adenocarcinoma, in which HER2 amplification and BRAFV600E mutation appear to be mutually exclusive events [34], here we found that all HER2+ fPTC bore the BRAFV600E mutation, although not all BRAFV600E-positive nodules had HER2 amplification. Of significance, none of the BRAFV600E-positive sPTC were HER2+, despite the high frequency of BRAFV600 mutations in this cohort. It is not entirely clear how this discrepancy should be interpreted, considering the limited size of our cohorts. In addition, we do not know whether HER2 amplification and BRAFV600E mutation coexist in the same cells within a tumor or if they are segregated in different clones. We do not know, either, if the condition is different in our HER2+ fPTC versus sPTC with HER2+ cells <5%.
The other evaluated genes, ALK, BRAF, ETV6, and RET, exhibited extensive integrity. The only case bearing a RET disruption was BRAFV600E-negative. Moreover, we found a significant difference (p < 0.001) of RTL in fPTC nodules compared to sPTC nodules, in agreement with our previous investigations [14,35]. Telomere length regulation plays a crucial role in genome instability and tumorigenesis [36]. Dysfunctional telomeres can increase chromosome instability by causing either fusion of chromosomes or fusion of sister chromatids, bringing the formation of anaphase bridges and the beginning of the so-called breakage-bridge-fusion cycles [37]. Although biased by the small number of patients investigated in our two cohorts (forced by the low frequency of fPTC), our data stigmatize significantly shorter RTL in fPTC cells versus sPTC cells. This result is in line with the reported predisposition of fPTC patients toward spontaneous chromosome fragility [35]. This observation poses the basis for further investigation exploring the existence of a possible specific three-dimensional (3D) altered telomere organization in fPTC. Telomere remodeling is a feature of cancer cells [38] and may identify tumor subgroups [39,40]. On the other hand, alterations in the telomere 3D profile have been reported in a murine model of thyroid tumors [41]. Recurrent somatic mutations in the promoter of TERT, the catalytic subunit of the enzyme telomerase, has been reported in PTC [42], often in concomitance with mutated BRAF [43]. A subclonal distribution in the rare PTC that harbor the alteration, in contrast to a clonal distribution in the poorly-differentiated and anaplastic tumors has been observed [44]. Unfortunately, the scanty material available from our cases prevented the possibility to establish a putative association of TERT promoter mutations with telomere length in our PTCs.
Our finding on RTL are, substantially, in keeping with the Sugishita data [13]. However, in contrast, 38.5% of our fPTC, but none of our sPTC, showed HER2 amplification, indicating an apparently preferential association with fPTC. In this regard, the small number of patients investigated in our two cohorts might constitute a bias. Nevertheless, as a whole, the finding of BRAFV600E mutation in association with HER2+ genetic heterogeneity, short telomere length, and prevalence of multifocal tumors seems to not be a rare molecular event in fPTC and may characterize a subgroup of fPTC. The response of refractory fPTC patients of this subgroup to target therapy of trastuzumab and lapatinib should be explored.

4. Materials and Methods

4.1. Sample Collection

The PTCs (13 fPTC and 18 sPTC) considered in the present study were selected from the pathological files of the University of Siena. Familial recurrence of the disease was defined as the presence of at least one first-degree relative with differentiated thyroid carcinoma in the absence of any other familial syndrome. None of the fPTC patients presented with any other sporadic tumor, including breast cancer, except for one male patient with a previous squamous cell carcinoma of the auricle. The histology of all tumor samples was classified according to the World Health Organization guidelines [20]. The fPTC cases were selected from 13 families, randomly choosing one affected subject from each family (the oldest affected subject): seven females (mean age at diagnosis of 53.7 ± 14.2, with an age range of 29–69 years) and six males (mean age at diagnosis of 49.0 ± 21.5, range 24–81). Four fPTC tumors were classified as follicular variants and nine were classical PTC. Seven out of the 13 families (53.8%) had three or more affected members, two out of 13 (15.3%) had two members with PTC and at least three members operated for multi-nodular goiter, and four out of 13 had only two members affected by thyroid cancer. In these cases, the phenomenon of genetic anticipation was observed with the second generation acquiring the disease at an earlier age and having more advanced disease at presentation.
The sPTC cases were from 15 females (mean age at diagnosis of 46.6 ± 7.8, range 31–64) and three males (mean age at diagnosis 43.6 ± 13.6, range 31–58). Fourteen were classified as classical PTC, two as follicular variants, one as a diffuse sclerosing variant, and one as a trabecular variant (Table 1). Informed consent was obtained from each patient after a full explanation of the purpose and nature of all of the procedures to be used. All data from the patients were handled in accordance with local ethical committee-approved protocols and in compliance with the Helsinki declaration

4.2. Fluorescence In Situ Hybridization

Thick sections (30 µm) were obtained from formalin-fixed paraffin-embedded (FFPE) tissue blocks of the thyroid nodules or, to assess probe cut-off, from the apparently tumor-free tissue of the contralateral lobe. Nuclei were isolated as reported [45], and were investigated by FISH, using specific probes and a standard protocol [46].

4.3. Detection of HER2 Gene Copy Number Alterations or Amplification

HER2 amplification was determined by counting the total numbers of HER2 and CEP17 (chromosome 17 centromere-specific alphoid repetitive DNA, Abbott Molecular, Abbott Park, IL, USA) signals per nucleus with a mean of 89.5 (range 34–175) nuclei. The ratio of HER2 signals to CEP17 (centromeric probe for chromosome 17) signals was calculated according to ASCO/CAP (American Society of Clinical Oncology/College of American Pathologists Guideline) criteria refined for breast cancer [16].
Nodules with, or suspected to have, HER2 amplification were then re-evaluated by FISH on 4 µm histological sections to assess the distribution of possible clones. The tumor area, marked by the pathologist [47], was entirely scored. As more than 5%, but fewer than 50%, of nuclei were found to be amplified, the Vance criteria were used to define the distribution of abnormal cells [17].
Consecutive histologic sections were used to assess HER2 expression by immunohistochemistry. The expression of HER2 protein was determined using anti-c-erbB2 antibody (Dako, Glostrup, Denmark) in accordance with the manufacturer’s instructions.
Detection of ALK, BRAF, ETV6, and RET rearrangements. Commercially available break-apart or single gene probes for ALK, BRAF (Abbott Molecular, Abbott Park, IL, USA), and ETV6 (Kreatech Diagnostic, Amsterdam, The Netherlands) were used to verify gene integrity in nuclei isolated from FFPE tissue blocks. An arbitrary cut-off of 3% was employed, as control cells showed no split signal in 200 scored nuclei per sample. For the RET gene, a homebrew probe and a previously described cut-off value were used [19]. Microscopic analysis was performed with an Olympus BX41 epifluorescence microscope and a charge-coupled device camera (Cohu, San Diego, CA, USA) interfaced with the CytoVision system (software version 3.9; Applied Imaging, Pittsburg, PA, USA).

4.4. Telomere Length and BRAFV600E Mutation

DNA was extracted from fresh or FFPE tissues, using the QIAamp® DNA Mini Kit (Qiagen, Milano, Italy) following the manufacturer’s instructions. RTL of sPTC was determined by quantitative PCR, carried out on 30 ng/μL genomic DNA using an MJ Mini Personal Thermal cycler (Bio-Rad, Milano, Italy) as described [14]. RTL values of the fPTC examined in the present study were reported previously [14]. Relative telomere length was calculated as the ratio of telomere repeats to a single-copy gene in experimental samples using standard curves. This ratio is proportional to the average telomere length. The 36B4 gene, which encodes acidic ribosomal phosphoprotein P0, was used as the single-copy gene [14]. For analysis of the BRAFV600E mutation, DNA was amplified in a final volume of 50 µL of 2× PCR Master Mix (AmpliTaq Gold® PCR Master Mix, Applied Biosystems, Milano, Italy) and a final primer concentration of 200 nM. Primer sequences, PCR conditions, and interpretation of results were as previously described [48].

4.5. Statistical Analyses

Mann-Whitney U-test (IBM SPSS Statistic version 2.1 software, Armonk, NY, USA) was used for statistical analysis of differences in RTL. Fisher exact test was used to compare HER2 gene amplification. All p-values were two-sided and p less than 0.05 was considered significant.
Epidemiological data are presented as the mean ± SD and median when necessary. The t-test for independent data was performed for normal variables. To evaluate significant differences in data frequency we analyzed 2 × 2 contingency tables by the Fisher exact test. Tables with sizes larger than 2 × 2 were examined by the Chi-squared test.

Acknowledgments

We thank Sandra Orrù from the Pathology Service Businco Hospital (Cagliari, Italy), Azienda Ospedaliera Brotzu for analysis of specimens by immunohistochemistry. This work was partially supported by the program “Projects of national interest (PRIN)” of the Italian Ministry of Education, University and Research (MIUR) (grant No 20122ZF7HE-002).

Author Contributions

Paola Caria, Daniela Virginia Frau, and Tinuccia Dettori carried out the FISH studies and drafted the manuscript. Silvia Cantara carried out the qPCR studies and the BRAFV600E mutational analysis. Silvia Cantara and Furio Pacini participated in the design of the study and took care of the clinical approach to patients. Roberta Vanni and Tinuccia Dettori conceived of the study, participated in its design and coordination, and drafted the manuscript. All authors read and approved the final version.

Conflicts of Interest

The authors declare no conflict of interest.

References

  1. Thyroid Disease Manager. Available online: http://www.thyroidmanager.org/ (accessed on 31 July 2016).
  2. Bonora, E.; Tallini, G.; Romeo, G. Genetic predisposition to familial nonmedullary thyroid cancer: An update of molecular findings and state-of-the-art studies. J. Oncol. 2010, 385206. [Google Scholar] [CrossRef] [PubMed]
  3. Moses, W.; Weng, J.; Kebebew, E. Prevalence, clinicopathologic features, and somatic genetic mutation profile in familial versus sporadic nonmedullary thyroid cancer. Thyroid 2011, 21, 367–371. [Google Scholar] [CrossRef] [PubMed]
  4. Hou, P.; Xing, M. Absence of germline mutations in genes within the MAP kinase pathway in familial non medullary thyroid cancer. Cell Cycle 2006, 5, 2036–2039. [Google Scholar] [CrossRef] [PubMed]
  5. Gara, S.K.; Jia, L.; Merino, M.J.; Agarwa, S.K.; Zhang, L.; Cam, M.; Patel, D.; Kebebew, E. Germline HABP2 mutation causing familial non medullary thyroid cancer. N. Engl. J. Med. 2015, 373, 448–455. [Google Scholar] [CrossRef] [PubMed]
  6. Carvajal-Carmona, L.G.; Tomlinson, I.; Sahasrabudhe, R. Re: HABP2 G534E mutation in familial nonmedullary thyroid cancer. J. Natl. Cancer Inst. 2016, 108, djw108. [Google Scholar] [CrossRef] [PubMed]
  7. Weeks, A.L.; Wilson, S.G.; Ward, L.; Goldblatt, J.; Hui, J.; Walsh, J.P. HABP2 germline variants are uncommon in familial nonmedullary thyroid cancer. BMC Med. Genet. 2016, 17, 60. [Google Scholar] [CrossRef] [PubMed]
  8. Tomsic, J.; Fultz, R.; Liyanarachchi, S.; He, H.; Senter, L.; de la Chapelle, A. HABP2 G534E variant in papillary thyroid carcinoma. PLoS ONE 2016, 11, e0146315. [Google Scholar] [CrossRef] [PubMed]
  9. Fallahi, P.; Mazzi, V.; Vita, R.; Ferrari, S.M.; Materazzi, G.; Galleri, D.; Benvenga, S.; Miccoli, P.; Antonelli, A. New therapies for dedifferentiated papillary thyroid cancer. Int. J. Mol. Sci. 2015, 16, 6153–6182. [Google Scholar] [CrossRef] [PubMed]
  10. Bikas, A.; Vachhani, S.; Jensen, K.; Vasko, V.; Burman, K.D. Targeted therapies in thyroid cancer: An extensive review of the literature. Expert Rev. Clin. Pharmacol. 2016, 15, 1–15. [Google Scholar] [CrossRef] [PubMed]
  11. Nikiforov, Y.E. Thyroid cancer in 2015: Molecular landscape of thyroid cancer continues to be deciphered. Nat. Rev. Endocrinol. 2016, 12, 67–68. [Google Scholar] [CrossRef] [PubMed]
  12. Ricarte-Filho, J.C.; Li, S.; Garcia-Rendueles, M.E.; Montero-Conde, C.; Voza, F.; Knauf, J.A.; Heguy, A.; Viale, A.; Bogdanova, T.; Thomas, G.A.; Mason, C.E.; et al. Identification of kinase fusion oncogenes in post-Chernobyl radiation-induced thyroid cancers. J. Clin. Investig. 2013, 123, 4935–4944. [Google Scholar] [CrossRef] [PubMed]
  13. Sugishita, Y.; Kammori, M.; Yamada, O.; Poon, S.S.; Kobayashi, M.; Onoda, N.; Yamazaki, K.; Fukumori, T.; Yoshikawa, K.; Onose, H.; et al. Amplification of the human epidermal growth factor receptor 2 gene in differentiated thyroid cancer correlates with telomere shortening. Int. J. Oncol. 2013, 42, 1589–1596. [Google Scholar] [PubMed]
  14. Capezzone, M.; Cantara, S.; Marchisotta, S.; Busonero, G.; Formichi, C.; Benigni, M.; Capuano, S.; Toti, P.; Pazaitou-Panayiotou, K.; Caruso, G.; et al. Telomere length in neoplastic and nonneoplastic tissues of patients with familial and sporadic papillary thyroid cancer. J. Clin. Endocrinol. Metab. 2011, 96, E1852–E1856. [Google Scholar] [CrossRef] [PubMed]
  15. Xing, M.; Haugen, B.R.; Schlumberger, M. Progress in molecular-based management of differentiated thyroid cancer. Lancet 2013, 381, 1058–1069. [Google Scholar] [CrossRef]
  16. Wolff, A.C.; Hammond, M.E.H.; Hicks, D.G.; Dowsett, M.; McShane, L.M.; Allison, K.H.; Allred, D.C.; Bartlett, J.M.S.; Bilous, M.; Fitzgibbons, P.; et al. Recommendations for human epidermal growth factor receptor 2 testing in breast cancer: American Society of Clinical Oncology/College of American Pathologists clinical practice guideline update. J. Clin. Oncol. 2013, 31, 3997–4013. [Google Scholar] [CrossRef] [PubMed]
  17. Vance, G.H.; Barry, T.S.; Bloom, K.J.; Fitzgibbons, P.L.; Hicks, D.G.; Jenkins, R.B.; Persons, D.L.; Tubbs, R.R.; Hammond, M.E.H. Genetic heterogeneity in HER2 testing in breast cancer panel summary and guidelines. Arch. Pathol. Lab. Med. 2009, 133, 611–612. [Google Scholar] [PubMed]
  18. Wright, C.; Angus, B.; Nicholson, S.; Sainsbury, J.R.; Cairns, J.; Gullick, W.J.; Kelly, P.; Harris, A.L.; Horne, C.H. Expression of c-erbB-2 oncoprotein: A prognostic indicator in human breast cancer. Cancer Res. 1989, 49, 2087–2090. [Google Scholar] [PubMed]
  19. Caria, P.; Dettori, T.; Frau, D.V.; Borghero, A.; Cappai, A.; Riola, A.; Lai, M.L.; Boi, F.; Calò, P.; Nicolosi, A.; et al. Assessing RET/PTC in thyroid nodule fine-needle aspirates: The FISH point of view. Endocr. Relat. Cancer 2013, 20, 527–536. [Google Scholar] [CrossRef] [PubMed]
  20. De Lellis, R.A. WHO Classification of Tumours, Pathology and Genetics of Tumours of Endocrine Organs, 3rd ed.; Ronald, A., de Lellis, R.A., Riccardo, V.L., Philipp, U.H., Charis, E., Eds.; IARC Press: Lyon, France, 2004; Volume 8, p. 230. [Google Scholar]
  21. Ronckers, C.M.; McCarron, P.; Ron, E. Thyroid cancer and multiple primary tumors in the SEER cancer registries. Int. J. Cancer 2005, 117, 281–288. [Google Scholar] [CrossRef] [PubMed]
  22. Omür, O.; Ozcan, Z.; Yazici, B.; Akgün, A.; Oral, A.; Ozkiliç, H. Multiple primary tumors in differentiated thyroid carcinoma and relationship to thyroid cancer outcome. Endocr. J. 2008, 55, 365–372. [Google Scholar] [CrossRef] [PubMed]
  23. Burstein, H.J. The distinctive nature of HER2-positive breast cancers. N. Engl. J. Med. 2005, 353, 1652–1654. [Google Scholar] [CrossRef] [PubMed]
  24. Joseph, K.R.; Edirimanne, S.; Eslick, G.D. The association between breast cancer and thyroid cancer: A meta-analysis. Breast Cancer Res. Treat. 2015, 152, 173–181. [Google Scholar] [CrossRef] [PubMed]
  25. Sogaard, M.; Farkas, D.K.; Ehrenstein, V.; Jørgensen, J.O.; Dekkers, O.M.; Sorensen, H.T. Hypothyroidism and hyperthyroidism and breast cancer risk: A nationwide cohort study. Eur. J. Endocrinol. 2016, 174, 409–414. [Google Scholar] [CrossRef] [PubMed]
  26. Brown, A.P.; Chen, J.; Hitchcock, Y.J.; Szabo, A.; Shrieve, D.C.; Tward, J.D. The risk of second primary malignancies up to three decades after the treatment of differentiated thyroid cancer. J. Clin. Endocrinol. Metab. 2008, 93, 504–515. [Google Scholar] [CrossRef] [PubMed]
  27. Verkooijen, R.B.; Smit, J.W.; Romijn, J.A.; Stokkel, M.P. The incidence of second primary tumors in thyroid cancer patients is increased, but not related to treatment of thyroid cancer. Eur. J. Endocrinol. 2006, 155, 801–806. [Google Scholar] [CrossRef] [PubMed]
  28. Nagaraja, V.; Eslick, G.D. HER2 expression in gastric and oesophageal cancer: A metaanalytic review. J. Gastrointest. Cancer 2015, 6, 143–154. [Google Scholar]
  29. Verri, E.; Guglielmini, P.; Puntoni, M.; Perdelli, L.; Papadia, A.; Lorenzi, P.; Rubagotti, A.; Ragni, N.; Boccardo, F. HER2/neuoncoprotein overexpression in epithelial ovarian cancer: Evaluation of its prevalence and prognostic significance. Oncology 2005, 68, 154–161. [Google Scholar] [CrossRef] [PubMed]
  30. Seo, A.N.; Kwak, Y.; Kim, D.W.; Kang, S.B.; Choe, G.; Kim, W.H.; Lee, H.S. HER2 status in colorectal cancer: Its clinical significance and the relationship between HER2 gene amplification and expression. PLoS ONE 2014, 9, e98528. [Google Scholar] [CrossRef] [PubMed]
  31. Iqbal, N.; Iqbal, N. Human epidermal growth factor receptor 2 (HER2) in cancers: Overexpression and therapeutic implications. Mol. Biol. Int. 2014, 2014, 1–9. [Google Scholar] [CrossRef] [PubMed]
  32. Capezzone, M.; Marchisotta, S.; Cantara, S.; Busonero, G.; Brilli, L.; Pazaitou-Panayiotou, K.; Carli, A.F.; Caruso, G.; Toti, P.; Capitani, S.; et al. Familial non-medullary thyroid carcinoma displays the features of clinical anticipation suggestive of a distinct biological entity. Endocr. Relat. Cancer 2008, 15, 1075–1081. [Google Scholar] [CrossRef] [PubMed]
  33. Xing, M.; Alzahrani, A.S.; Carson, K.A.; Shong, Y.K.; Kim, T.Y.; Viola, D.; Elisei, R.; Bendlová, B.; Yip, L.; Mian, C.; et al. Association between BRAF V600E mutation and recurrence of papillary thyroid cancer. J. Clin. Oncol. 2015, 33, 42–50. [Google Scholar] [CrossRef] [PubMed]
  34. Shan, L.; Qiu, T.; Ling, Y.; Guo, L.; Zheng, B.; Wang, B.; Li, W.; Li, L.; Ying, J. Prevalence and clinicopathological characteristics of HER2 and BRAF mutation in Chinese patients with lung adenocarcinoma. PLoS ONE 2015, 10, e0130447. [Google Scholar] [CrossRef] [PubMed]
  35. Cantara, S.; Pisu, M.; Frau, D.V.; Caria, P.; Dettori, T.; Capezzone, M.; Capuano, S.; Vanni, R.; Pacini, F. Telomere abnormalities and chromosome fragility in patients affected by familial papillary thyroid cancer. J. Clin. Endocrinol. Metab. 2012, 97, E1327–E1331. [Google Scholar] [CrossRef] [PubMed]
  36. Meeker, A.K.; Hicks, J.L.; Iacobuzio-Donahue, C.A.; Montgomery, E.A.; Westra, W.H.; Chan, T.Y.; Ronnett, B.M.; De Marzo, A.M. Telomere length abnormalities occur early in the initiation of epithelial carcinogenesis. Clin. Cancer Res. 2004, 10, 3317–3326. [Google Scholar] [CrossRef] [PubMed]
  37. Gisselsson, D.; Jonson, T.; Petersen, A.; Strombeck, B.; Dal Cin, P.; Hoglund, M.; Mitelman, F.; Mertens, F.; Mandahl, N. Telomere dysfunction triggers extensive DNA fragmentation and evolution of complex chromosome abnormalities in human malignant tumors. Proc. Natl. Acad. Sci. USA 2001, 98, 12683–12688. [Google Scholar] [CrossRef] [PubMed]
  38. Gadji, M.; Vallente, R.; Klewes, L.; Righolt, C.; Wark, L.; Kongruttanachok, N.; Knecht, H.; Mai, S. Nuclear Remodeling as a Mechanism for Genomic Instability in Cancer; Gisselsson, D., Ed.; Academic Press: New York, NY, USA, 2011; Volume 112, pp. 77–126. [Google Scholar]
  39. Gadji, M.; Adebayo Awe, J.; Rodrigues, P.; Kumar, R.; Houston, D.S.; Klewes, L.; Dièye, T.N.; Rego, E.M.; Passetto, R.F.; de Oliveira, F.M.; et al. Profiling three-dimensional nuclear telomeric architecture of myelodysplastic syndromes and acute myeloid leukemia defines patient subgroups. Clin. Cancer Res. 2012, 18, 3293–3304. [Google Scholar] [CrossRef] [PubMed]
  40. Kuzyk, A.; Gartner, J.; Mai, S. Identification of neuroblastoma subgroups based on three-dimensional telomere organization. Transl. Oncol. 2016, 9, 348–356. [Google Scholar] [CrossRef] [PubMed]
  41. Wark, L.; Danescu, A.; Natarajan, S.; Zhu, X.; Cheng, S.Y.; Hombach-Klonisch, S.; Mai, S.; Klonisch, T. Three-dimensional telomere dynamics in follicular thyroid cancer. Thyroid 2014, 24, 296–304. [Google Scholar] [CrossRef] [PubMed]
  42. Liu, R.; Xing, M. TERT promoter mutations in thyroid cancer. Endocr. Relat. Cancer 2016, 23, R143–R155. [Google Scholar] [PubMed]
  43. Liu, R.; Bishop, J.; Zhu, G.; Zhang, T.; Ladenson, P.W.; Xing, M. Mortality risk stratification by combining BRAF V600E and TERT promoter mutations in papillary thyroid cancer: Genetic duet of BRAF and TERT promoter mutations in thyroid cancer mortality. JAMA Oncol. 2016. [Google Scholar] [CrossRef] [PubMed]
  44. Landa, I.; Ibrahimpasic, T.; Boucai, L.; Sinha, R.; Knauf, J.A.; Shah, R.H.; Dogan, S.; Ricarte-Filho, J.C.; Krishnamoorthy, G.P.; Xu, B.; et al. Genomic and transcriptomic hallmarks of poorly differentiated and anaplastic thyroid cancers. J. Clin. Investig. 2016, 126, 1052–1066. [Google Scholar] [CrossRef] [PubMed]
  45. Petersen, B.L.; Sorensen, M.C.; Pedersen, S.; Rasmussen, M. Fluorescence in situ hybridization on formalin-fixed and paraffin-embedded tissue: Optimizing the method. Appl. Immunohistochem. Mol. Morphol. 2004, 12, 259–265. [Google Scholar] [CrossRef] [PubMed]
  46. Caria, P.; Frau, D.V.; Dettori, T.; Boi, F.; Lai, M.L.; Mariotti, S.; Vanni, R. Optimizing detection of RET and PPARg rearrangements in thyroid neoplastic cells using a home-brew tetracolor probe. Cancer Cytopathol. 2014, 122, 377–385. [Google Scholar] [CrossRef] [PubMed] [Green Version]
  47. Hastings, R.; Bown, N.; Tibiletti, M.G.; Debiec-Rychter, M.; Vanni, R.; Espinet, B.; van Roy, N.; Roberts, P.; van den Berg-de-Ruiter, E.; Bernheim, A.; et al. Guidelines for cytogenetic investigations in tumours. Eur. J. Hum. Genet. 2015, 24, 1–8. [Google Scholar] [CrossRef] [PubMed]
  48. Cantara, S.; Capezzone, M.; Marchisotta, S.; Capuano, S.; Busonero, G.; Toti, P.; di Santo, A.; Caruso, G.; Carli, A.F.; Brilli, L.; et al. Impact of proto-oncogene mutation detection in cytological specimens from thyroid nodules improves the diagnostic accuracy of cytology. J. Clin. Endocrinol. Metab. 2010, 95, 1365–1369. [Google Scholar] [CrossRef] [PubMed]
Figure 1. Distribution of HER2 (human epidermal growth factor receptor 2) amplification in familial papillary thyroid carcinoma (fPTC) and sporadic papillary thyroid carcinoma (sPTC) nuclei. Arrows point to isolated nuclei with extra copies of the HER2 gene (red spots) in the presence of disomy 17 (chromosome 17 centromere-specific alphoid repetitive DNA, green spots) in fPTC (A); and sPTC (B); and in nuclei in formalin-fixed paraffin-embedded (FFPE) sections of fPTC (C); and sPTC (D). The distribution of the amplification in FFPE sections of fPTC versus sPTC was significant (p = 0.0076) (Fisher exact test) and indicative of genetic heterogeneity heterogeneity according to Vance criteria [17] (E). Scare bar = 10 µm.
Ijms 17 01759 g001
Figure 2. Examples of fluorescence in situ hybridization (FISH) in isolated nuclei for the identification of genes specifically rearranged in papillary thyroid carcinoma (PTC). Arrows point to the split of the red/green signal of a RET break-apart [19] probe in the case of sPTC, indicating broken RET (A); and to un-split red/green signals of an ALK break-apart probe in the case of fPTC, indicating unbroken ALK (B). Red spot: 300 kb probe DNA fragment; Green spot: 442 kb probe DNA fragment; Scare bar = 10 µm.
Ijms 17 01759 g002
Figure 3. fPTC and sPTC relative telomere length (RTL). RTL was measured by q-PCR, and was expressed as the ratio (T/S) of the telomere (T) repeat copy number to a single-copy gene (S). The difference in RLT between fPTC and sPTC samples was significant (p < 0.001) (Mann-Whitney U-test). Triangles represent the RTL of each case; the upper and lower lines represent the interquartile range of the distribution (25th–75th percentile); the middle line represents the median.
Ijms 17 01759 g003
Figure 4. Distribution of HER2 amplification and BRAFV600E mutation in fPTC and sPTC tumors.
Ijms 17 01759 g004
Table 1. Characteristics of patients.
TumorAge at Diagnosis (Mean ± SD)Sex (Males %)PTC Size (Median/IQR)TNMExtrathyroidal Invasion N (%)Multifocality N (%)Lymphonode Metastases at Diagnosis N (%)Final Outcome * N (%)Follow-up (Mean Years)Histology
fPTC (n = 13)51.5 ± 17.06 (46.1%)11/11.5pT1 8 (61.5%)
pT2 2 (11.7%)
pT3 3 (23.0%)
5 (38.5%)7 (53.8%)3 (23%)Remission 9 (69.2%)
Persistent disease 4 (30.8%)
7.59 ± 3.99 CV-PTC
4 FV-PTC
sPTC (n = 18)46.1 ± 8.53 (16.6%)9.5/8.5pT1 8 (44.4%)
pT2 1 (5.5%)
pT3 9 (50.%)
9 (50%)6 (33.3%)5 (27.7%)Remission 11 (61.1%)
Persistent disease 2 (11.1%)
5.5 ± 2.814 CV-PTC
2 FV-PTC
1 SV-PTC
1 TR-PTC
CV-PTC—classical variant of papillary thyroid carcinoma; fPTC—familial papillary thyroid carcinoma; FV-PTC—follicular variant of papillary thyroid carcinoma; IQR—Inter Quartile Range; N—number of cases; PTC—papillary thyroid carcinoma; sPTC—sporadic papillary thyroid carcinoma; SV-PTC—sclerosing variant of papillary thyroid carcinoma; TNM—(Tumor (limph) Node Metastasis) classification [20]; TR-PTC: trabecular variant of papillary thyroid carcinoma; *—six patients were lost to follow-up.

