Technical Note

Development of 12 Microsatellite Markers in Dorcus titanus castanicolor (Motschulsky, 1861) (Lucanidae, Coleoptera) from Korea Using Next-Generation Sequencing

1
Animal Resources Division, National Institute of Biological Resources, 42, Hwangyeong-ro, Seo-gu, Incheon 22689, Korea
2
Department of Life Science, College of Natural Science, Kyonggi University, 154-42, Gwanggyosan-ro, Yeongtong-gu, Suwon 16227, Korea
3
Biological Resources Research Department, National Institute of Biological Resources, 42, Hwangyeong-ro, Seo-gu, Incheon 22689, Korea
*
Authors to whom correspondence should be addressed.
Int. J. Mol. Sci. 2016, 17(10), 1621; https://doi.org/10.3390/ijms17101621
Submission received: 10 June 2016 / Revised: 10 September 2016 / Accepted: 15 September 2016 / Published: 23 September 2016
(This article belongs to the Section Biochemistry)

Abstract

:
In the present study, we used next-generation sequencing to develop 12 novel microsatellite markers for genetic structural analysis of Dorcus titanus castanicolor (Lucanidae; Coleoptera), a popular pet insect in China, Korea, and Japan. We identified 52,357 microsatellite loci in 339,287,381 bp of genomic sequence and selected 19 of the loci based on their PCR amplification efficiency and polymorphism. The 19 selected markers were then tested for the presence of null alleles and linkage disequilibrium. We did not detect any evidence of null alleles; however, four pairs of loci (DT03 and DT11, DT05 and DT26, DT08 and DT26, DT26 and DT35) exhibited linkage disequilibrium. Thus, we assessed the genetic diversity of a D. titanus castanicolor population from the Daejeon region of Korea (n = 22) using 13 markers. Among them, one marker (DT17) deviated from Hardy-Weinberg equilibrium. Therefore, 12 markers may be useful for further analyzing the genetic diversity of D. titanus castanicolor.

Graphical Abstract

1. Introduction

Dorcus titanus castanicolor [1] is a subspecies of stag beetle that is distributed in northeast China, Korea, and Tsushima Island, Japan [2,3,4] and is distinguished from the other subspecies by a distinctly bilobed clypeus and flattened last abdominal sternite in males and moderately punctured elytra and straight protibiae in females [4] (Figure 1). In Korea, the subspecies is distributed throughout the country and is commonly found during local fauna and monitoring surveys [3,4].
Marketing campaigns from the insect industry have contributed to a rapid increase in the number of pet insects [5,6,7]. D. titanus castanicolor is a popular pet insect [7], and the rearing method of the subspecies is well documented [8]. In China and Japan, many stag beetle breeders have reared large-sized individuals of D. titanus [9]. Japan has 12 subspecies of D. titanus, which were interbred to select for large individuals. Consequently, four foreign subspecies (D. titanus platymelus, D. titanus pilifer, D. titanus palawanicus, and D. titanus titanus) were introduced to Japan without prior ecological assessment. Thus, ecological problems, such as decreases in the populations of native subspecies, have occurred, owing to competition with the introduced subspecies [9].
Recently, several Southeast Asian subspecies, such as D. titanus palawanicus, were introduced into Korea. Kim and Kim [4] conducted a comparative analysis of the male genitalia through a taxonomic review of the Korean Lucanidae and reported that the Korean subspecies (D. titanus castanicolor) might actually be a distinct species. A different case was reported for Dorcus hopei [10]. Thus, seven microsatellite markers were developed in order to help conserve the Korean population and used to compare the genetic structure of the Korean Dorcus hopei with other regional populations [11]. Recently, the Korean Quarantine Agency also used the markers for a quarantine inspection of foreign Dorcus hopei. Therefore, the goal of this study was to develop microsatellite markers for D. titanus castanicolor that could be used for population genetic analysis and origin testing.

2. Results and Discussion

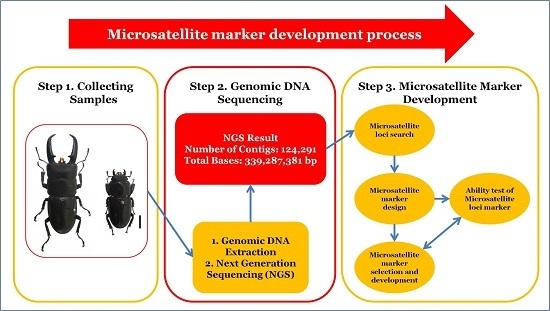
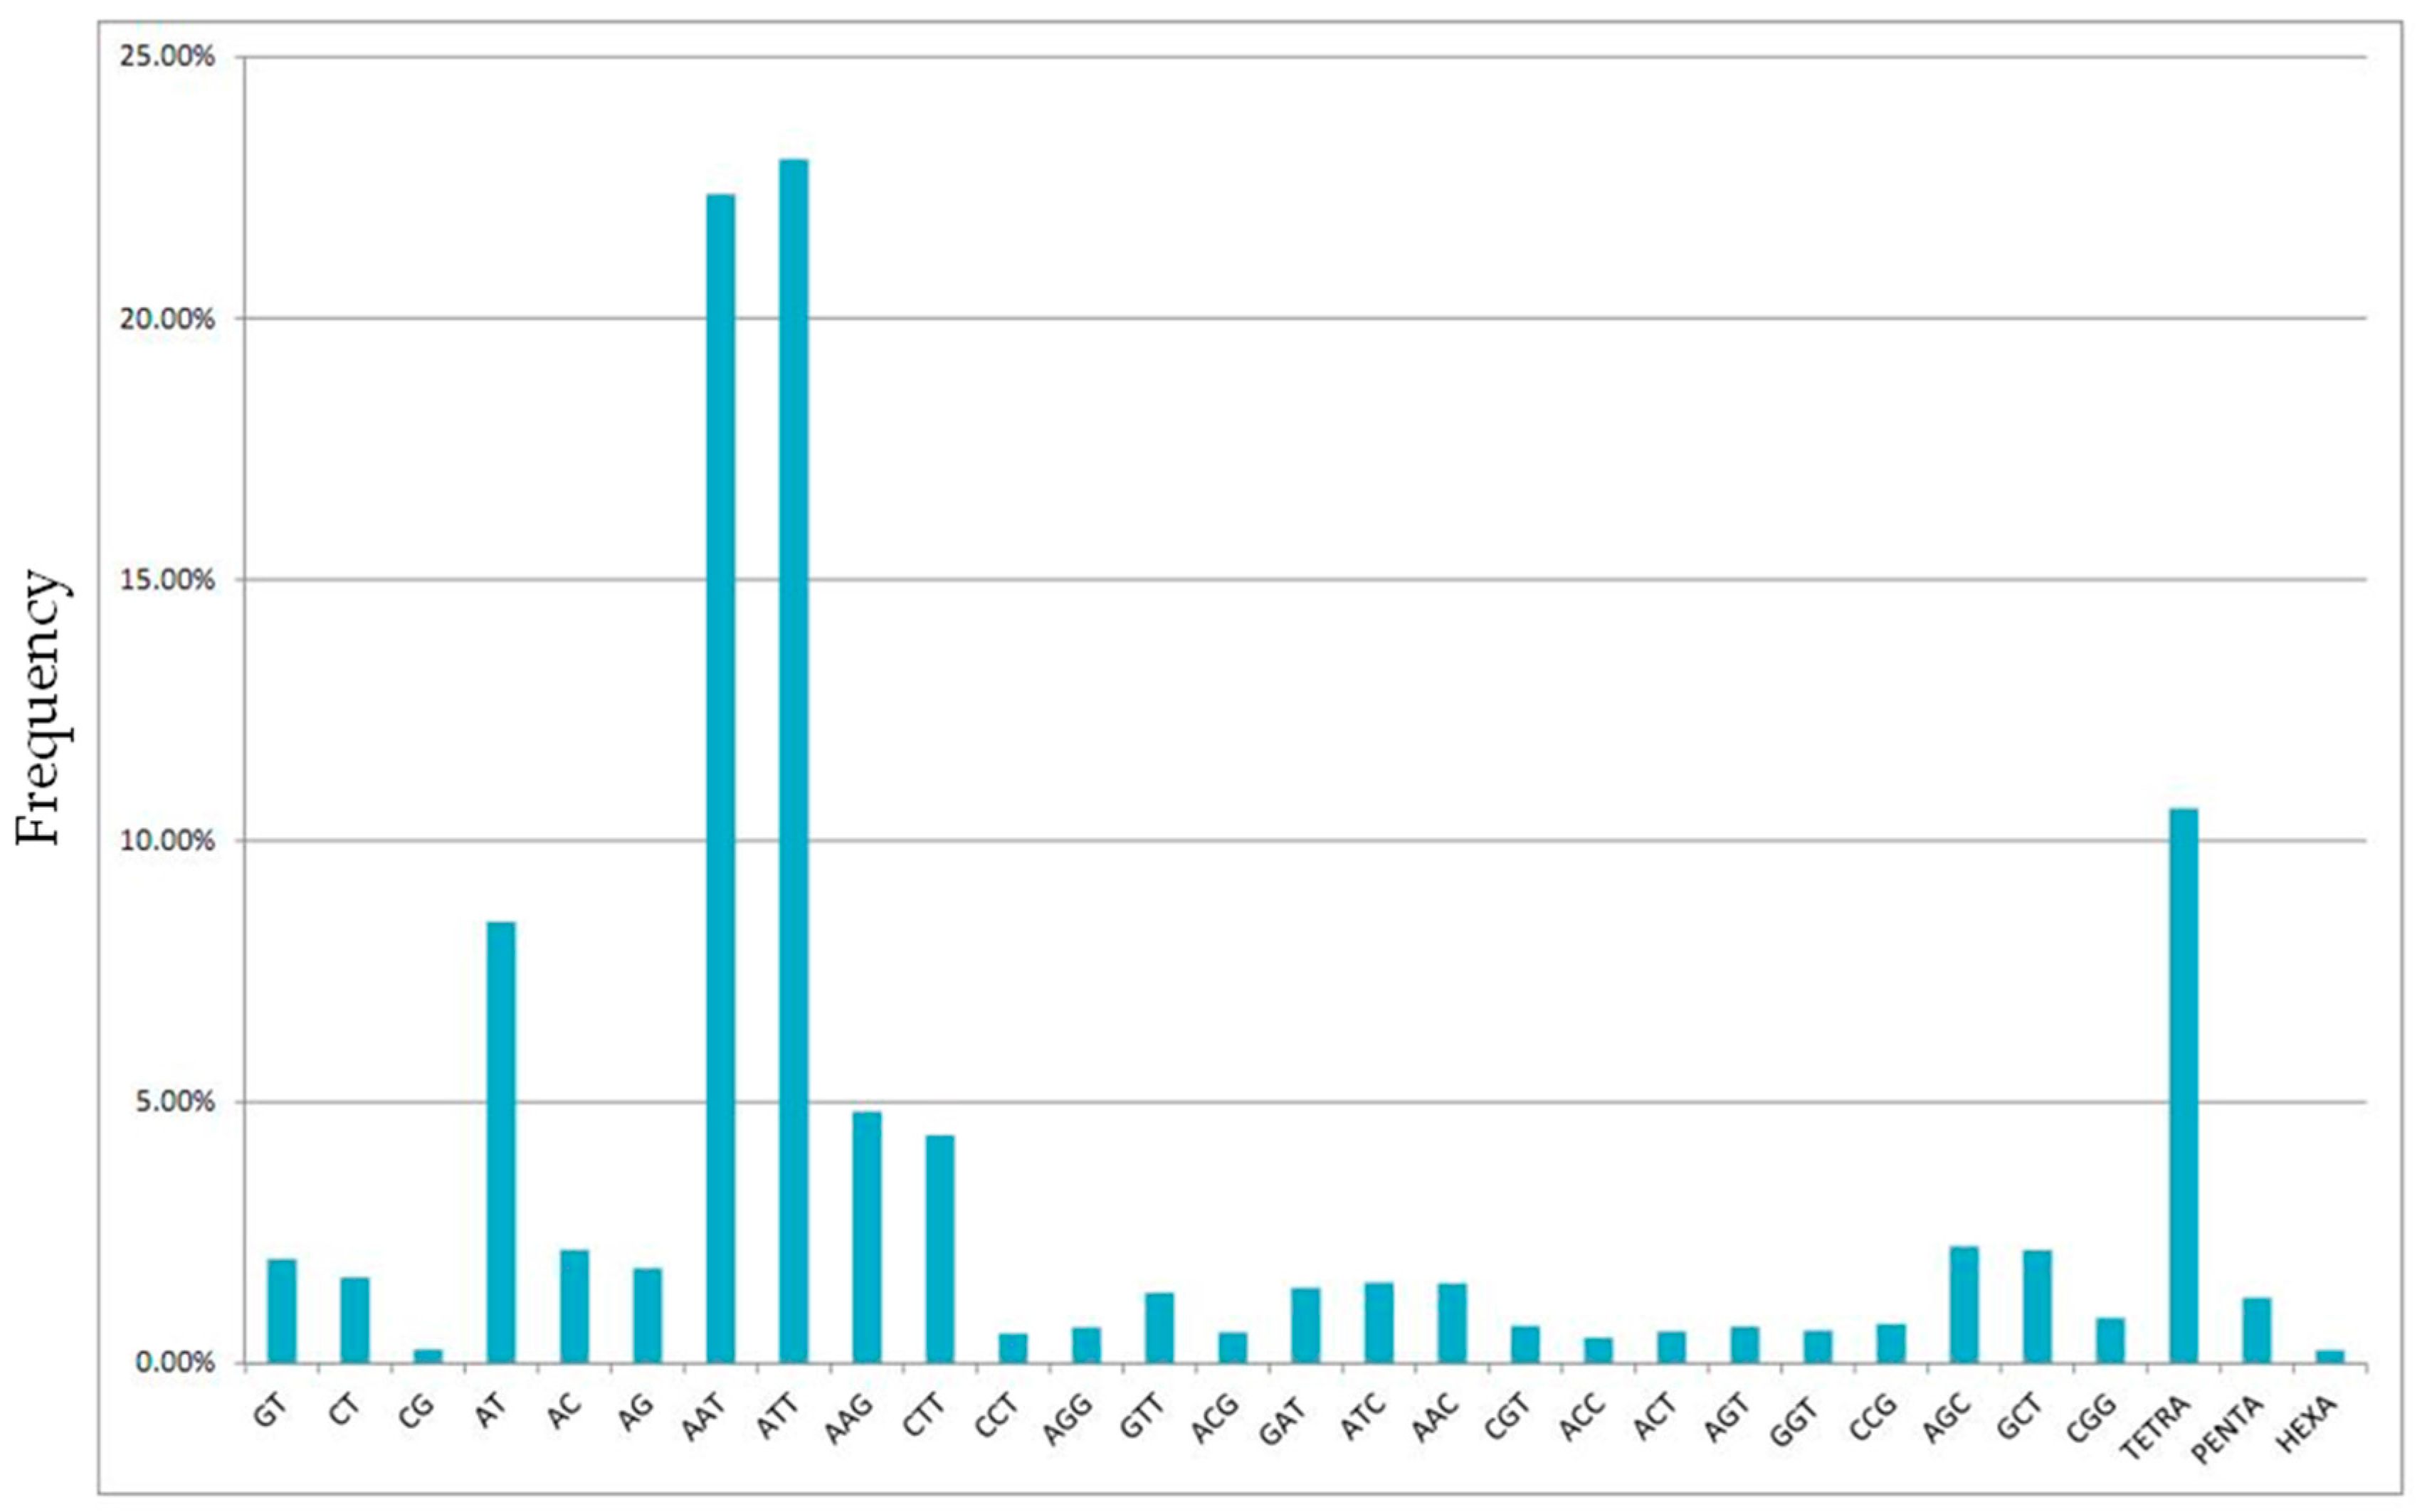
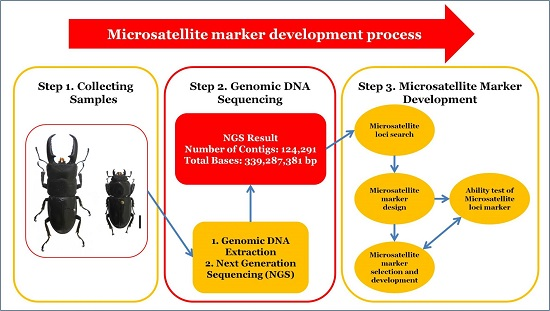
2.1. Next-Generation Sequencing and Microsatellite Loci Identification

Through Illumina sequencing of D. titanus castanicolor genomic DNA, the number of contigs with length >1000 bp was 123,291. The maximum length was 103,231 bp, and the mean length was 2729 bp. We obtained 339,287,381 bp of genomic DNA sequence with a GC content of 38.98% (Table 1).
Searching the genomic DNA sequence yielded 52,357 microsatellite loci with 14,644 di-, tri-, and tetra-repeat sequence motifs, 186 penta-repeat loci, and 37 hexa-repeat loci. The relative frequencies of the specific repeated sequences were as follows: ATT, 24%; AAT, 23%; AT, 8%; and remaining motifs, below 5% (Figure 2).
The 14,644 searched microsatellite loci were filtered with two conditions. First, the loci composed of AT repeat were excluded because of difficulty in PCR. Second, the loci composed of 24–96 bases were selected. Using these two filtering conditions, we selected 316 microsatellite loci, and using the primer design software PRIMER3 version 0.4.0 [12,13], we designed primer sets for 301 loci. Eighty-five markers were selected based on the GC contents of the product sequences and melting temperatures of the designed primer sets and were subsequently tested for specificity and polymorphism. Finally, 19 markers were selected and the forward primers of each selected loci were labeled with a fluorescent dye (FAM) at the 5′ end [14] (Table 2).

2.2. Microsatellite Marker Assessment

The genetic diversity of the Korean D. titanus castanicolor (n = 22) was assessed, using the 19 selected markers. We determined the genotypes of 22 individuals using a 3730XL DNA analyzer (Applied Biosystems®, Foster City, CA, USA) (Table S1). Each marker was tested for PCR errors and the presence of null alleles (Table 3). Then, the linkage disequilibrium analysis was conducted for each locus. From these results, linkage disequilibrium was detected in four pairs of loci (DT03 and DT11, DT05 and DT26, DT08 and DT26, and DT08 and DT35), which were excluded from further analysis. Thus, we considered that the 13 remaining microsatellite loci might be suitable for analyzing the population genetic structure of Korean D. titanus castanicolor.

2.3. Genetic Diversity of the Korean Dorcus titanus castanicolor Population

Genetic diversity metrics for the 13 selected markers were calculated using PowerMarker version 3.25 [15] (Table 4). The genotype number, allele number, expected heterozygosity, and observed heterozygosity ranged from 3–11, 3–9, 0.3140–0.7789, and 0.3636–1.0000, respectively. Significant departure of genotype frequencies from Hardy-Weinberg equilibrium (HWE) was determined after sequential Bonferroni corrections for the significance level (critical p = 0.003). We found that only one locus (DT17) significantly deviated from HWE (Table 4). Increasing the benefit as a pet insect, the wild population of the Korean D. titanus castanicolor is decreasing because of over-collecting by the Korean breeders. Some Korean breeders surreptitiously made crosses between the Korean and exotic subspecies (such as D. titanus palawanicus) for body size and mandible morphology, like in Japan [9]. For these reasons, we anticipated that there could be multiple non-HWE markers. Although our data did not suggest this, further surveys are necessary using the 12 markers and additional populations of Korean D. titanus castanicolor.

3. Materials and Methods

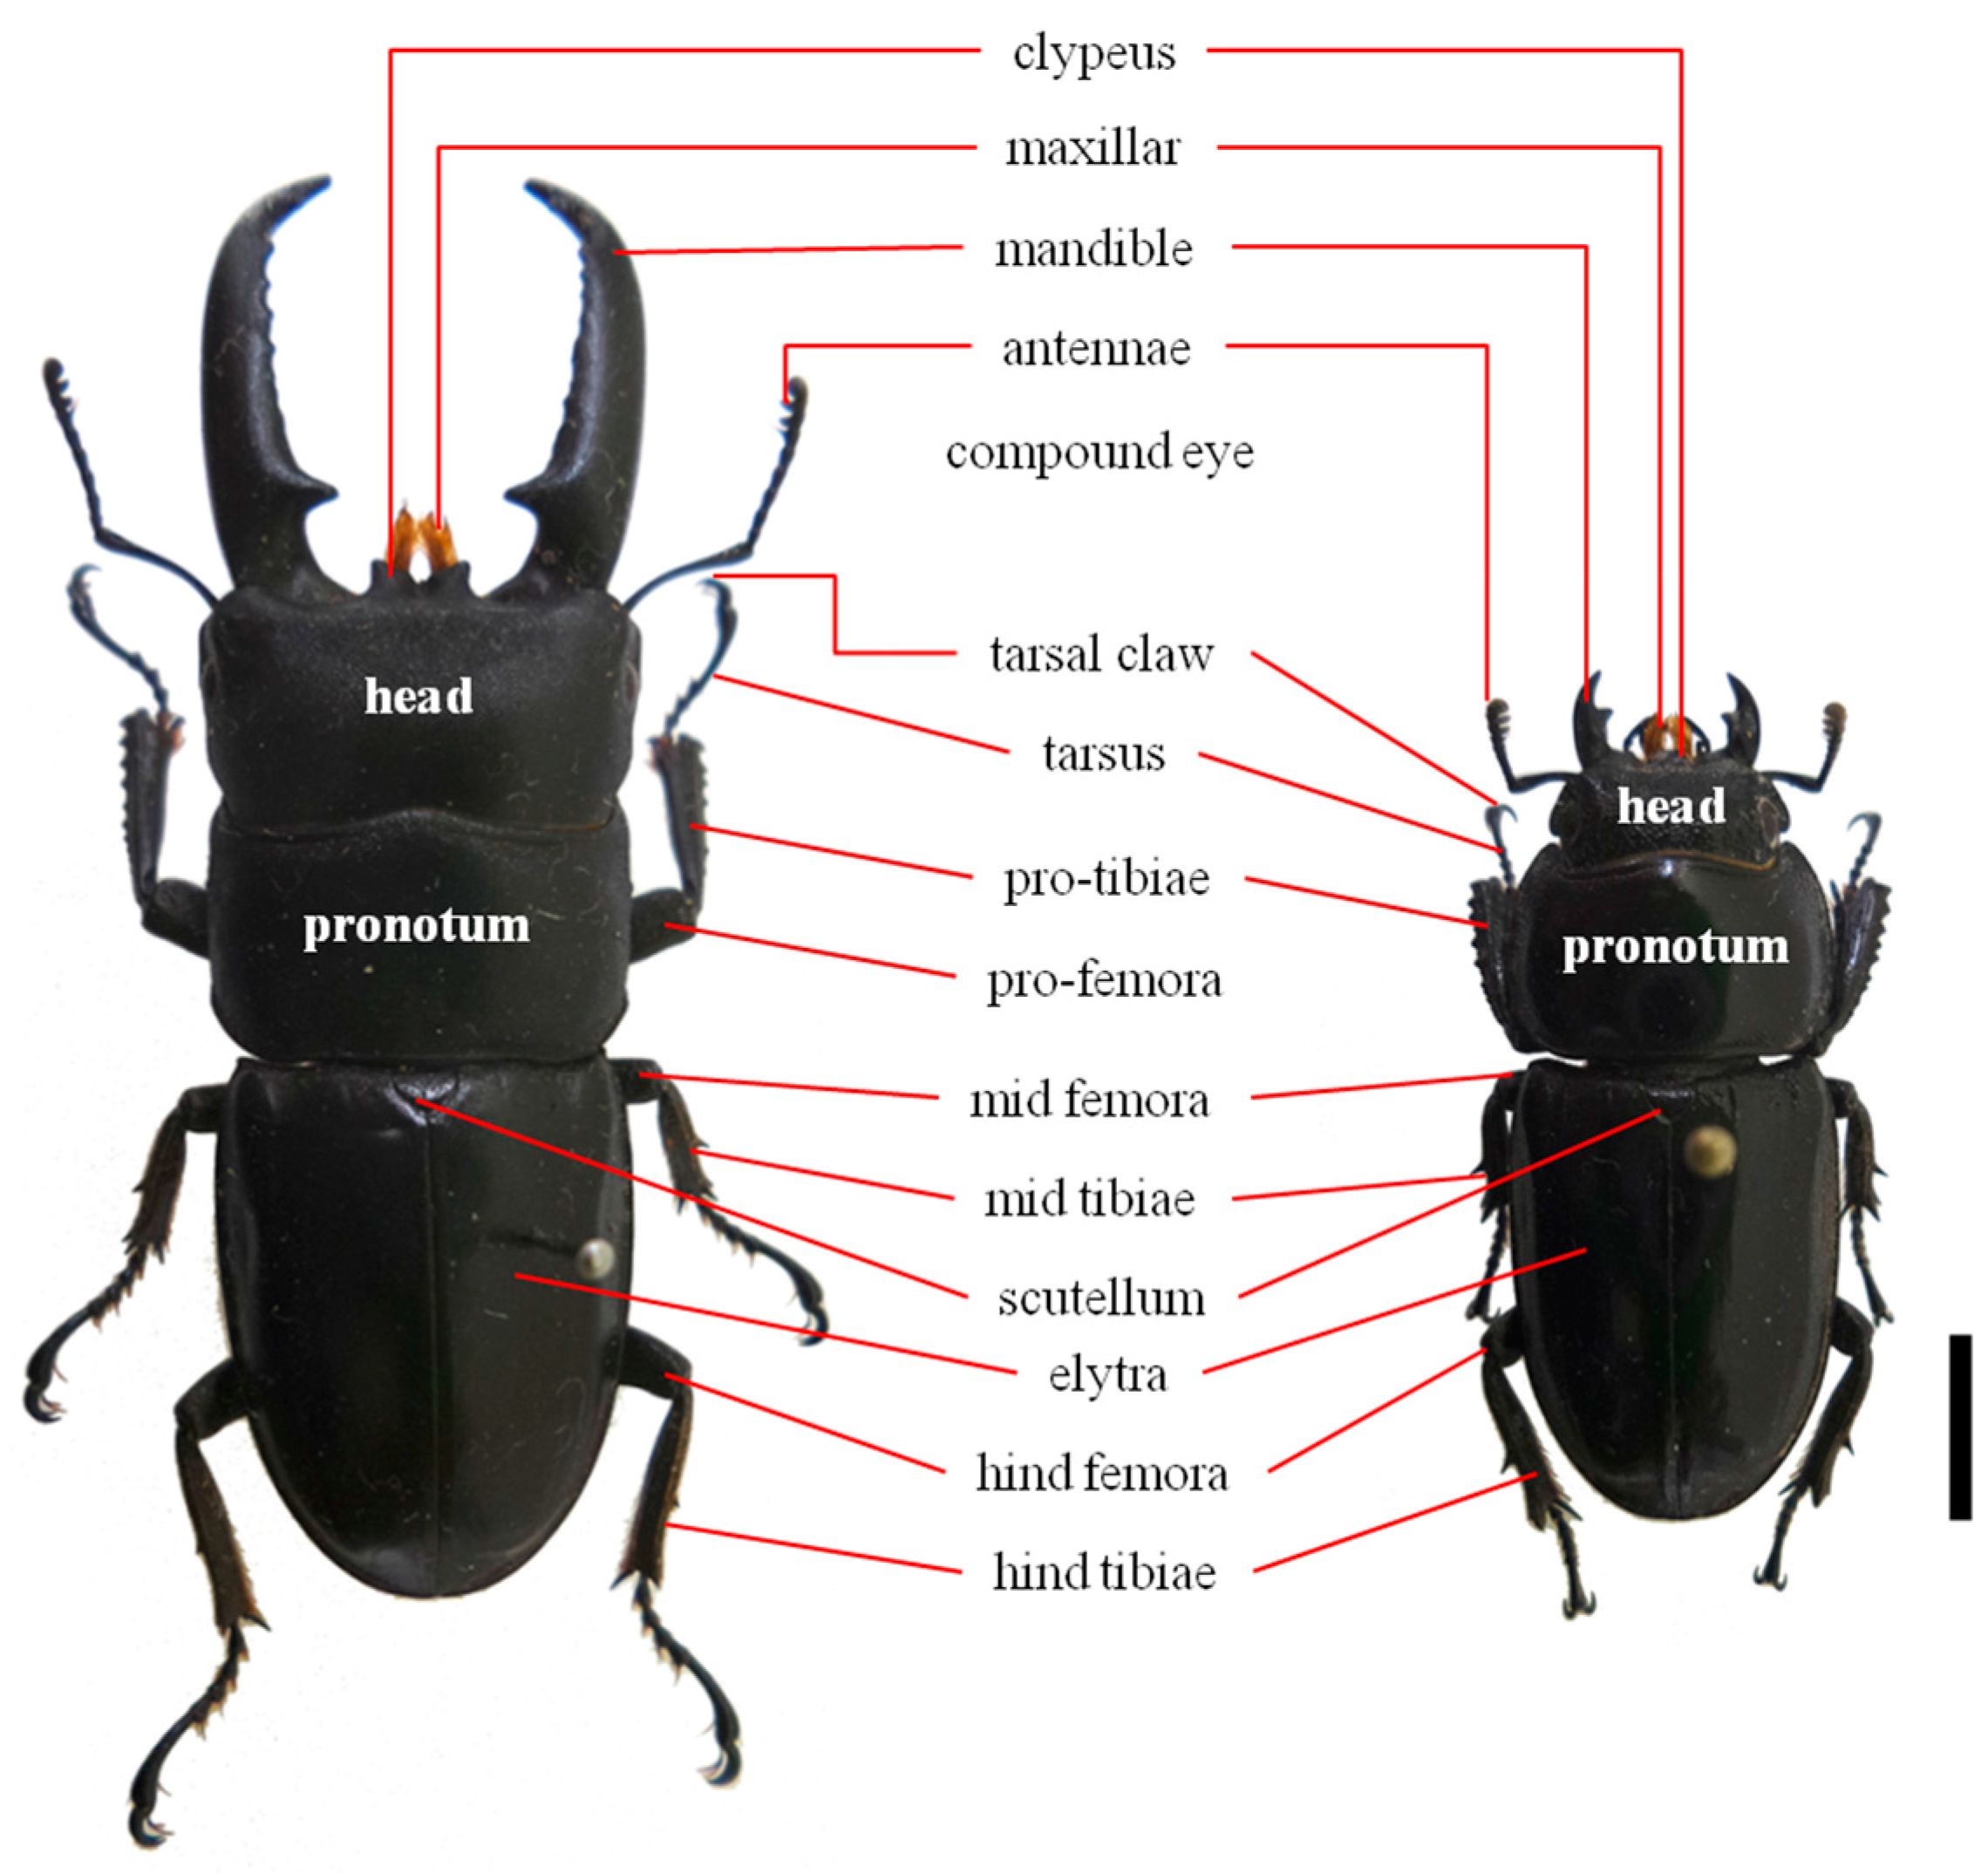
3.1. Sample Collection and Genomic DNA Extraction

We collected 23 Dorcus titanus castanicolor specimens from Mt. Jangtae, which is located in Jangan-dong, Seo-gu, Daejeon, Korea (Table S2). We extracted the thoracic muscles of the specimens for genomic DNA isolation and deposited the dried samples in the National Institute of Biological Resources (Incheon, Korea). Genomic DNA for microsatellite loci amplification and genotyping was isolated using a DNA purification kit (Prime Prep Genomic DNA Isolation Kit, GeNet Bio, Daejeon, Korea) according to the manufacturer’s instructions. Genomic DNA for next-generation sequencing was extracted from one individual using the NucleoSpin® Tissue Kit (Macherey-Nagel GmbH and Co. KG, Düren, Germany), and its quality was checked, using both spectrophotometry and electrophoresis on a 1% agarose gel.

3.2. Next-Generation Sequencing, Microsatellite Loci Identification, Marker Selection, and Genotyping

For next-generation sequencing, 10 μg of genomic DNA from a single specimen was used for 2 × 300 paired-end sequencing with a HiSeq Sequencer (Illumina, San Diego, CA, USA). Assembly was performed using the de Bruijn graph algorithm in CLC Genomics Workbench version 7 (CLC Bio, Aarhus, Denmark). Assembly mapping was performed after removing Illumina adapters and low-quality sequences using the CLC trimmer function (default limit = 0.05). The assembly procedure used the parameters Length Fraction (LF) and Sequence Similarity (SIM) between DNA reads, as described by the CLC Genomics Workbench software, with maximum stringency (0.50 LF and 0.80 SIM) and a minimum contig length of 70 bp.
Microsatellite loci were identified in the assembled partial draft genome using tandem repeat search software, Phobos version 3.3.12 [16,17]. The searching criteria were 10% mismatch di-, tri-, and tetra-nucleotide repeats with a sequence length between 24 and 96 bp, and AT repeats were excluded from the screening results because of difficulty in PCR. Primer sets for amplifying of the microsatellite loci were designed using PRIMER3 version 0.4.0 [12,13] with the following criteria: GC content >30%, primer length 18–22 bp, optimal temperature of 56–60 °C, and default settings for the remaining parameters. PCR for the qualification test on the designed primer sets was conducted in 20 μL reactions using AccuPower PCR PreMix (Bioneer, Daejeon, Korea), 30 ng template DNA, and 10 pmol each primer. Extra MgCl2 was not added. PCR amplification was carried out in a Veriti 96-Well Thermal Cycler (Applied Biosystems®, Foster City, CA, USA), using the following program: an initial denaturation step of 5 min at 94 °C; followed by 35 cycles of 10 s at 94 °C, 10 s at 56 or 60 °C, and 20 s at 72 °C; and a final extension step of 5 min at 72 °C. The specificity of the primer sets and polymorphism of the microsatellite loci were examined through electrophoresis of the PCR amplicon using QIAxcel (Qiagen, Leipzig, Germany). Each forward primer of the selected markers was labeled with 6-carboxyfluorescein at the 5′ end for genotyping [14]. To reduce polymerization error, high fidelity polymerase (SuPrime HF Premix (2×), GeNet Bio, Daejeon, Korea) was used in PCR for genotyping, which was carried out using the same conditions as those for the qualification test of the designed primer sets. The sequences of microsatellite loci for the developed markers were submitted to NCBI GenBank (Table 3).

3.3. Data Analysis

The presence of null alleles and PCR errors in the genotyping results was checked using Micro-Checker version 2.2.3 [18], and pairwise linkage disequilibrium was analyzed using Arlequin version 3.1 [19]. The genetic diversity of the Daejeon population was estimated using the major allele frequency (MAF), number of Genotypes (Gn), sample size (SS), number of alleles (An), expected heterozygosity (He), observed heterozygosity (Ho), polymorphism information content (PIC), and Hardy-Weinberg equilibrium (HWE), all of which were calculated using PowerMarker version 3.25 [15]. Deviation from HWE was determined after sequential Bonferroni correction for the significance level.

Supplementary Materials

Supplementary materials can be found at www.mdpi.com/1422-0067/17/10/1621/s1.

Acknowledgments

This work was supported by a grant from the National Institute of Biological Resources (NIBR), funded by the Ministry of Environment (MOE) of the Republic of Korea (NIBR201503202).

Author Contributions

Tae Hwa Kang participated in the study design and coordinated the experiment, analysis of genetic diversity, and draft of the manuscript; Sang Hoon Han participated in the study design and coordinated the experiment, analysis of genetic diversity, and draft of the manuscript; Sun Jae Park participated in the study design, collected samples, and coordinated the draft of the manuscript. All authors critically read and approved the final manuscript.

Conflicts of Interest

The authors declare no conflict of interest.

References

  1. Motschulsky, V. Insectes du Japon (continuation). Etudes Ent. 1861, 10, 3–24. [Google Scholar]
  2. Mizunuma, T.; Nagai, S. The Lucanid Beetles of the World; Mushi-sha: Tokyo, Japan, 1994; pp. 47–202. [Google Scholar]
  3. Kim, S.I.; Kim, J.I. Review of family Lucanidae (Insecta: Coleoptera) in Korea with the description of one new species. Entomol. Res. 2010, 40, 55–81. [Google Scholar] [CrossRef]
  4. Kim, S.I.; Kim, J.I. Insect Fauna of Korea. In Arthropoda: Insect: Coleoptera: Scarabaeoidea: Lucanidae and Passalidae; National Institute of Biological Resources: Incheon, Korea, 2014; pp. 1–58. [Google Scholar]
  5. Choi, Y.C.; Kim, N.J.; Park, I.K.; Lee, S.B.; Hwang, J.S. RDA interrobang IV; Rural Development Administration (in Korean): Suwon, Korea, 2011; pp. 1–20.
  6. Kang, T.H.; Han, S.H.; Weon, H.Y.; Lee, Y.B.; Kim, N.; Nam, S.H.; Park, H.C. Purification and identification of Paenibacillus sp., isolated from diseased larvae of Allomyrina dichotoma (Linnaeus, 1771) (Coleoptera: Scarabaeidae) in Insect Farms. Int. J. Ind. Entomol. 2012, 25, 195–203. [Google Scholar] [CrossRef]
  7. Bae, S.M.; Jun, Y.S.; Shin, T.Y.; Woo, S.D. An analysis of likability of insects in Korea. Int. J. Ind. Entomol. 2014, 29, 193–197. [Google Scholar] [CrossRef]
  8. Kim, J. Regional Variation of Dorcus titanus castanicolor (Motschulsky, 1861) (Coleoptera: Lucanidae) in Northern and Southern South Korea. Scarabs 2014, 75, 1–6. [Google Scholar]
  9. Goka, K.; Kojima, H.; Okabe, K. Biological invasion caused by commercialization of Stag Beetles in Japan. Glob. Environ. Res. 2004, 8, 67–74. [Google Scholar]
  10. Saunders, W.W. Characters of undescribed Lucanidae, collected in China, by R. Fortune, Esq. Trans. Entomol. Soc. Lond. 1854, 3, 45–55. [Google Scholar] [CrossRef]
  11. Kang, T.H.; Han, S.H.; Park, S.J. Development of seven microsatellite markers using next generation sequencing for the conservation on the Korean population of Dorcus hopei (E. Saunders, 1854) (Coleoptera, Lucanidae). Int. J. Mol. Sci. 2015, 16, 21330–21341. [Google Scholar] [CrossRef] [PubMed]
  12. Koressaar, T.; Remm, M. Enhancements and modifications of primer design program Primer3. Bioinformatics 2007, 23, 1289–1291. [Google Scholar] [CrossRef] [PubMed]
  13. Untergasser, A.; Cutcutache, I.; Koressaar, T.; Ye, J.; Faircloth, B.C.; Remm, M.; Rozen, S.G. Primer3—New capabilities and interfaces. Nucleic Acids Res. 2012. [Google Scholar] [CrossRef] [PubMed]
  14. Schuelke, M. An economic method for the fluorescent labeling of PCR fragments. Nat. Biotechnol. 2000, 18, 233–234. [Google Scholar] [CrossRef] [PubMed]
  15. Liu, K.; Muse, S.V. PowerMarker: Integrated analysis environment for genetic marker data. Bioinformatics 2005, 21, 2128–2129. [Google Scholar] [CrossRef] [PubMed]
  16. Leese, F.; Mayer, C.; Held, C. Isolation of microsatellites from unknown genomes using known genomes as enrichment templates. Limnol. Oceanogr. Method 2008, 7, 412–426. [Google Scholar] [CrossRef]
  17. Mayer, C.; Leese, F.; Tollrian, R. Genome-wide analysis of tandem repeats in Daphnia pulex—A comparative approach. BMC Genom. 2010, 11, 277–305. [Google Scholar] [CrossRef] [PubMed]
  18. Oosterhout, C.V.; Hutchinson, W.F.; Wills, D.P.M.; Shipley, P. MICRO-CHECKER: Software for identifying and correcting genotyping errors in microsatellite data. Mol. Ecol. Notes 2004, 4, 535–538. [Google Scholar] [CrossRef]
  19. Excoffier, L.; Laval, G.; Schneider, S. Arlequin version 3.1: An integrated software package for population-genetics data analysis. Evol. Bioinform. 2005, 1, 47–50. [Google Scholar]
Figure 1. Adult photos and terminology of Dorcus titanus castanicolorleft, male; right, female (Scale bar = 1.0 cm).
Ijms 17 01621 g001
Figure 2. Frequency of short tandem repeats identified in the Dorcus titanus castanicolor genomic DNA sequence.
Ijms 17 01621 g002
Table 1. Summary of next-generation sequencing results from Dorcus titanus castanicolor genomic DNA.
Number of Contigs (>1000 bp)Total BasesMaximum LengthN50 LengthAverage Contig LengthGC Content
124,291339,287,381103,2313258272933.98%
Table 2. Microsatellite markers selected for genotyping the 22 Dorcus titanus castanicolor specimens from Daejeon, Korea.
MSLForward SequenceReverse SequenceRMSSMNNAn
31,870CGACACTCACACGCAATAAATAGGCCATTCCATCGGTGAATTTTTA(CGTT)6214 bpDT01KX268665
13,508TGAAGTTTCAGAAGGAGTTTGGACAATCAACTCCGGATAGAGTGAA(ACAT)6264 bpDT02KX268666
78,687AGAACGCGTGAACTTGTTTATTTTTGTCACGTTCTAAAGCGTTTTT(AAG)8244 bpDT03KX268667
9989CCCCACGAACAATAAATCAGAACTACTTCCGCTTACAGCAGTAAAT(CGT)8202 bpDT05KX268668
9645TTATGACGAACTTGTTTTGGCAGTGTGGAATTTTGTTTCGGATGTT(AC)12298 bpDT06KX268669
8497GTCATCTTACTAGAGGTTGGTCGCAACACTTCTTCTAATGCACTCG(AAG)17205 bpDT08KX268670
15,216ATTACGTAGACATGGCTTAAGCATCCTCATGCCAAATATGATCCAA(AACT)10245 bpDT11KX268671
29,993TAATGACGCCATTCACACATTTCGGTCTTTAAACAGTCTGCCAAAA(GT)20239 bpDT12KX268672
12,743ACTTGACTGTCACATACACACATTTGTATGTCTGGCTTTGGTTACT(CT)19212 bpDT13KX268673
30,799AAGACGATCGGCAATTTCAAAATTAGACCAGAGTCCTTCATTACCA(AG)17209 bpDT15KX268675
24,714GAGCACCTAGATAATCAACCCAAGATTTGGTTTCTTGCATTGTCCT(AAG)11230 bpDT17KX268676
3144TCATTTGGACGTAGCAAATGTTCTGCATGTTGAAAGGTACCAAGTA(AAC)10260 bpDT24KX675371
3488TAATCCTTGCATGCAGCCTAATAAGTTTGTGTTTGTGATGAAGTGG(AGC)10298 bpDT25KX675372
74,360GTTATGGTGTGAGCTGGAATTTCATTTACATCAAGATTCGCCGTTG(GTT)10271 bpDT26KX675373
557AACAAATAACGTGTTGGAGTTCGAGTAGATGAGAACTGTGTTTGGG(ACAT)7284 bpDT27KX675374
4515TCCACGTTATCTTTCAAAACACGTTCAAGTTTGGGTGAAACAATCG(CT)14226 bpDT28KX675375
2260AACATGACCCACTAAGGTATCAACTAACAAGAAGTACCACCACCAT(GCT)9300 bpDT32KX675376
16,503ACGCTACTGGCAATCAAATAAACGCACCCACAAACAACATACATAA(ACT)9284 bpDT33KX675377
426GCACGTCACGACTATTTTGATTTTAACTCGTTAATGAACATGTGCG(AC)13210 bpDT35KX675378
MSL, microsatellite loci; RM, repeat motif; SS, size standard; MN, marker name; NAn, NCBI accession number.
Table 3. Statistical summary of the results from PCR errors and the null allele test in the Korean population of Dorcus titanus castanicolor.
MSLDT1DT2DT3DT5DT6DT8DT11DT12DT13DT15
NPnononononononononono
NFreq−0.1909−0.1408−0.3352−0.3970−0.1199−0.0986−0.1269−0.0874−0.2445−0.0930
MSLDT17DT24DT25DT26DT27DT28DT32DT33DT35
NPnonononononononono
NFreq−0.11090.0250−0.0022−0.6180−0.0642−0.08000.0171−0.0144−0.1185
MSL, microsatellite loci; NP, null allele present; NFreq, frequency of null allele.
Table 4. Characteristics of the 13 polymorphic microsatellite loci in the Dorcus titanus castanicolor specimens from Daejeon, Korea.
MSLMAFGnSSAnHeHoPICHWE
DT10.818232230.31400.36360.29181.0000
DT20.659152260.51030.63640.46190.1100
DT60.340992260.77890.95450.74660.0120
DT120.3409102260.73970.86360.69680.5770
DT130.386472260.71181.00000.66470.0190
DT150.363692270.77170.90910.74040.0510
DT170.409182290.76030.86360.73300.0010
DT240.681852240.49170.50000.45070.1530
DT250.4318112260.72930.72730.69390.4650
DT270.454562240.63530.68180.56320.0060
DT280.3182102260.75310.86360.71090.5390
DT320.704542230.42870.40910.35431.0000
DT330.477392260.69010.68180.64990.4200
Mean0.49137.3846225.53850.63960.72730.5968
MSL, microsatellite loci; MAF, major allele frequency; Gn, number of genotypes; SS, sample size; An, number of alleles; He, expected heterozygosity; Ho, observed heterozygosity; PIC, polymorphism information content; HWE, Hardy-Weinberg equilibrium; Bonferroni adjusted p-value = 0.003.

