Article

Transcription Factor Sp1 Promotes the Expression of Porcine ROCK1 Gene

1
Key Laboratory of Swine Genetics and Breeding of Agricultural Ministry & Key Laboratory of Agricultural Animal Genetics, Breeding and Reproduction of Ministry of Education, College of Animal Science and Technology, Huazhong Agricultural University, Wuhan 430070, China
2
College of Life Science and Technology, Wuhan Bioengineering Institute, Wuhan 430070, China
*
Authors to whom correspondence should be addressed.
Int. J. Mol. Sci. 2016, 17(1), 112; https://doi.org/10.3390/ijms17010112
Submission received: 13 October 2015 / Revised: 27 November 2015 / Accepted: 10 December 2015 / Published: 15 January 2016
(This article belongs to the Section Biochemistry)

Abstract

:
Rho-associated, coiled-coil containing protein kinase 1 (ROCK1) gene plays a crucial role in maintaining genomic stability, tumorigenesis and myogenesis. However, little is known about the regulatory elements governing the transcription of porcine ROCK1 gene. In the current study, the transcription start site (TSS) was identified by 5’-RACE, and was found to differ from the predicted one. The region in ROCK1 promoter which is critical for promoter activity was investigated via progressive deletions. Site-directed mutagenesis indicated that the region from −604 to −554 bp contains responsive elements for Sp1. Subsequent experiments showed that ROCK1 promoter activity is enhanced by Sp1 in a dose-dependent manner, whereas treatment with specific siRNA repressed ROCK1 promoter activity. Electrophoretic mobility shift assay (EMSA), DNA pull down and chromatin immunoprecipitation (ChIP) assays revealed Sp1 can bind to this region. qRT-PCR and Western blotting research followed by overexpression or inhibition of Sp1 indicate that Sp1 can affect endogenous ROCK1 expression at both mRNA and protein levels. Overexpression of Sp1 can promote the expression of myogenic differentiation 1(MyoD), myogenin (MyoG), myosin heavy chain (MyHC). Taken together, we conclude that Sp1 positively regulates ROCK1 transcription by directly binding to the ROCK1 promoter region (from −604 to −532 bp) and may affect the process of myogenesis.

1. Introduction

As a downstream effector of the small GTP-binding protein Rho, rho-associated, coiled-coil containing protein kinase (ROCK) acts as a molecular switch controlling a variety of cellar functions, such as the regulation of stress fiber formation, actin polymerization and so on [1,2]. ROCK1 and ROCK2, two isoforms of ROCK, have distinct roles and cannot be replaced by each other [3].
ROCK1 participates in multiple biological and physiological processes [4,5]. Besides the important role in the progress of tumorigenesis, obesity, and inflammation [5,6,7], ROCK1 also participates in the regulation of skeletal muscle [8,9]. Additionally, numerous elements such as RhoA, medicine, sex hormone, and nitric oxide can regulate the activity of ROCK1 [10,11,12].The activation of ROCK1 is necessary and sufficient to control glucose transport in myoblasts [13]. During myogenesis, ROCK1 is reported to act as a negative regulator of the process [9]. ROCK1 is required for myoblast proliferation, but prevents commitment to differentiation [8]. Despite the researchers increasing focus on the biological role of ROCK1 gene, little is known about the transcriptional regulation of porcine ROCK1 gene. Therefore, it is crucial to elucidate the molecular mechanisms involved in its expression and transcriptional regulation.
Sp1, a member of the SP/KLF transcription factor family, is an important regulator in many tissues that binds to GC-rich motifs, which plays a key role in cellular functions [14,15]. It always works through binding to the promoter region of its target genes [16,17], and can activate or repress the transcription in response to physiological and pathological stimuli [18]. The promoter activity of rat ROCK1 gene is reduced by Sp1, whereas it is enhanced by Sp6 in dental epithelial cells [19].
To investigate the transcriptional regulation of the ROCK1 gene, we isolated the promoter of the porcine ROCK1 gene, analyzed its upstream regulatory elements and revealed that transcription factor Sp1 directly binds to the core promoter region of ROCK1 and stimulates its expression.

2. Results

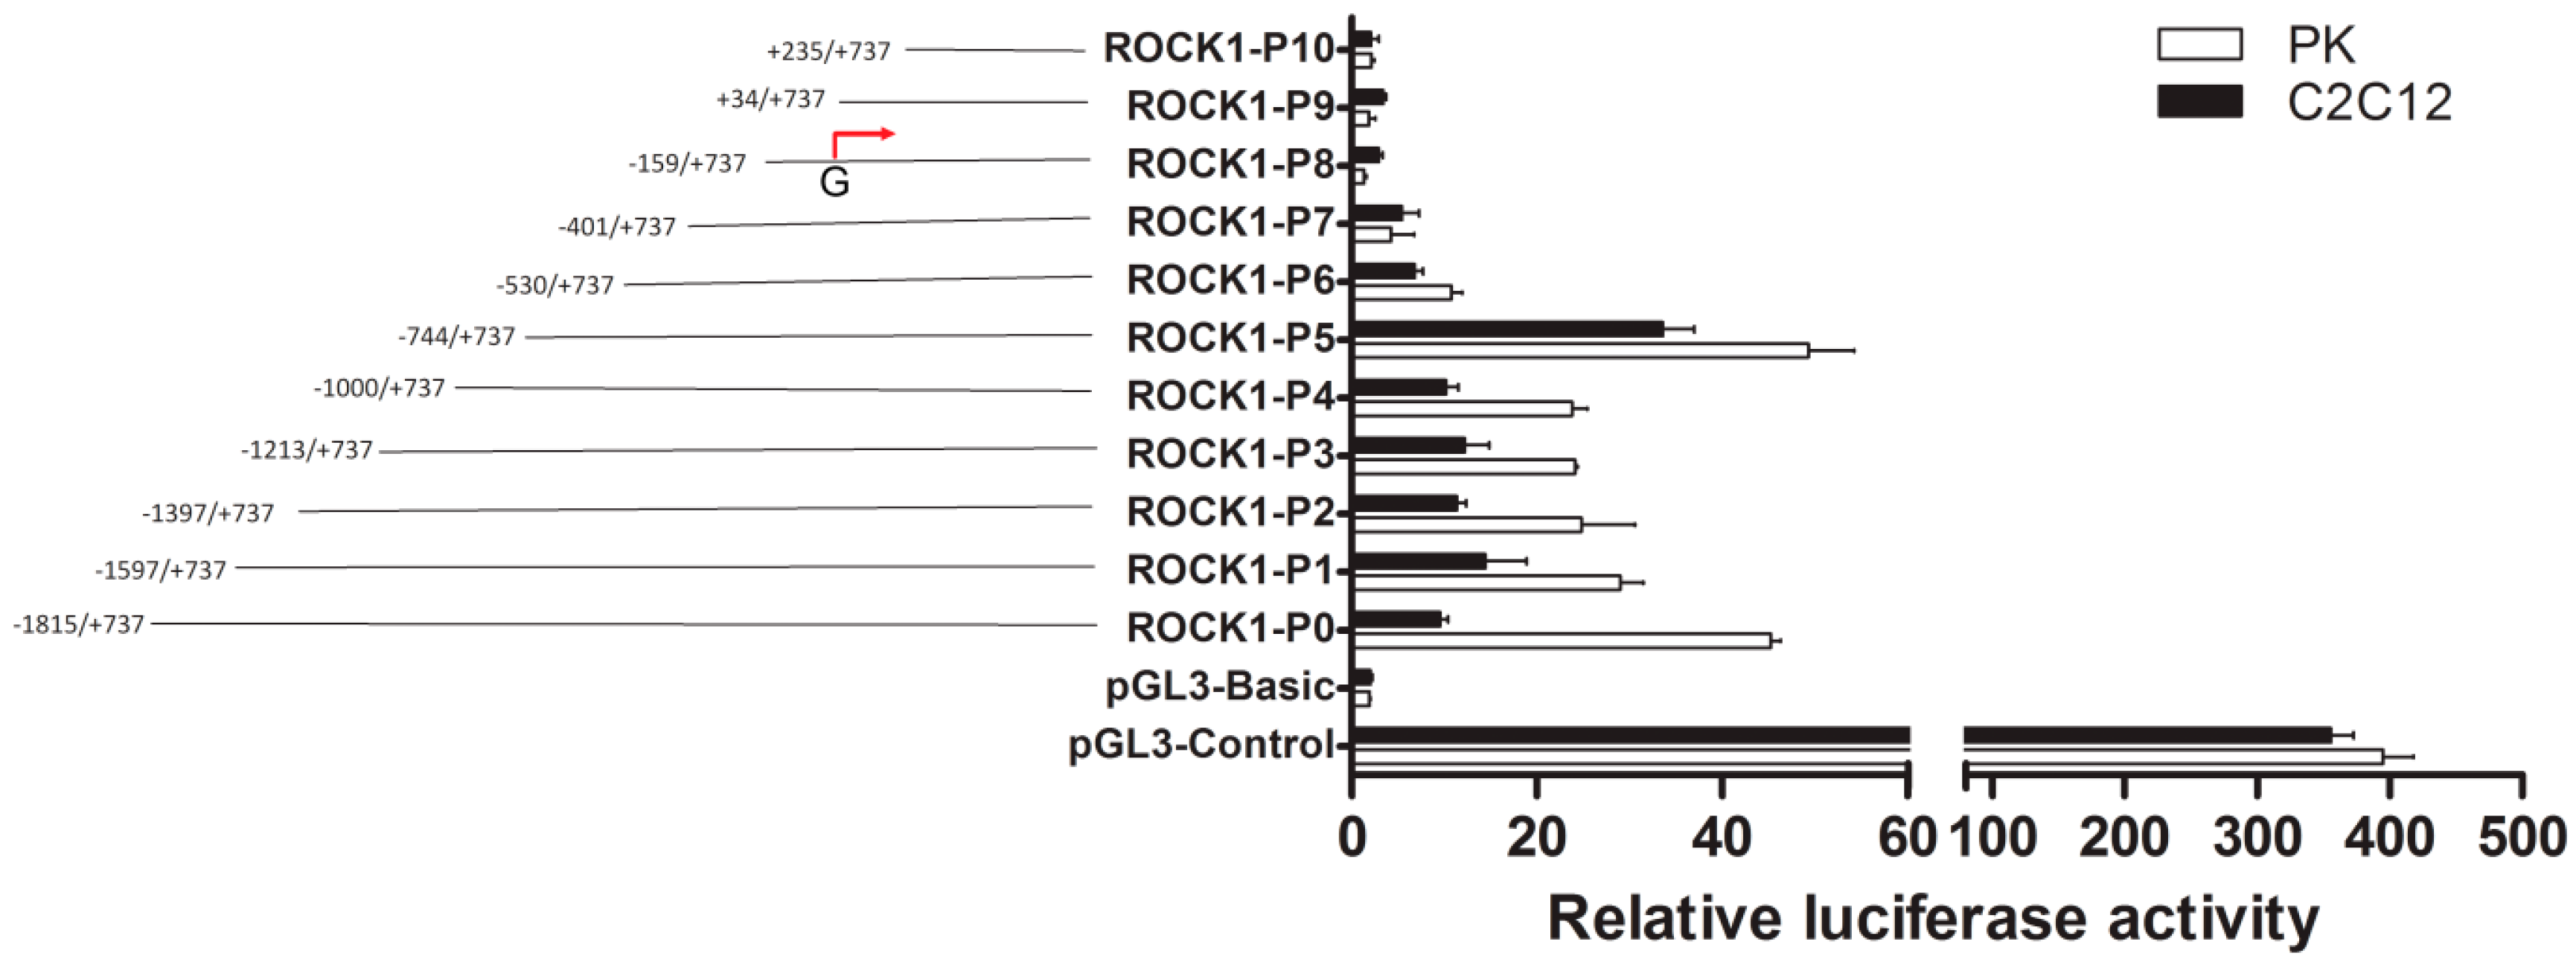
2.1. Identification of the Promoter Region and Regulatory Elements of Porcine ROCK1 Gene.

A 2552-bp 5’-flanking region of porcine ROCK1 gene was obtained and 11 progressive deletions were introduced upstream of the luciferase reporter gene. It was noticed that the ROCK1-P7 to P10 fragments had no activity according to negative control; an increase of activity was detected in P6 and P5, especially the P5 fragment (Figure 1), indicating that the region from P5 to P6 (−744 to −402 bp) was important for transcriptional activity (Figure 1).
Figure 1. 5’-Deletion analysis of the porcine ROCK1 promoter activity. Schematic representation of the progressive deletions of porcine ROCK1 5’-flanking region in pGL3-Basic vector and the relative activities of ROCK1 promoter corresponding to the progressive deletions. The predicted transcription start site (TSS, the red arrow in the figure) was set +1, differs from the TSS in NCBI database. The pGL3-control/basic vectors were used as positive/negative control, while pRL-TK was used as internal control. Data were expressed as means ± SD of three replicates.
Ijms 17 00112 g001
In addition, differing from the predicted transcription start site (TSS), the TSS obtained by 5 RACE was located at −430 bp (Figure S1), suggesting the importance of the region from −744 to −402 bp. According to the TFsearch and the JASPAR database, three potential Sp1 binding sites (−604/−595 bp, −561/−554 bp and −543/−532 bp) were located in the region (Figure S1).

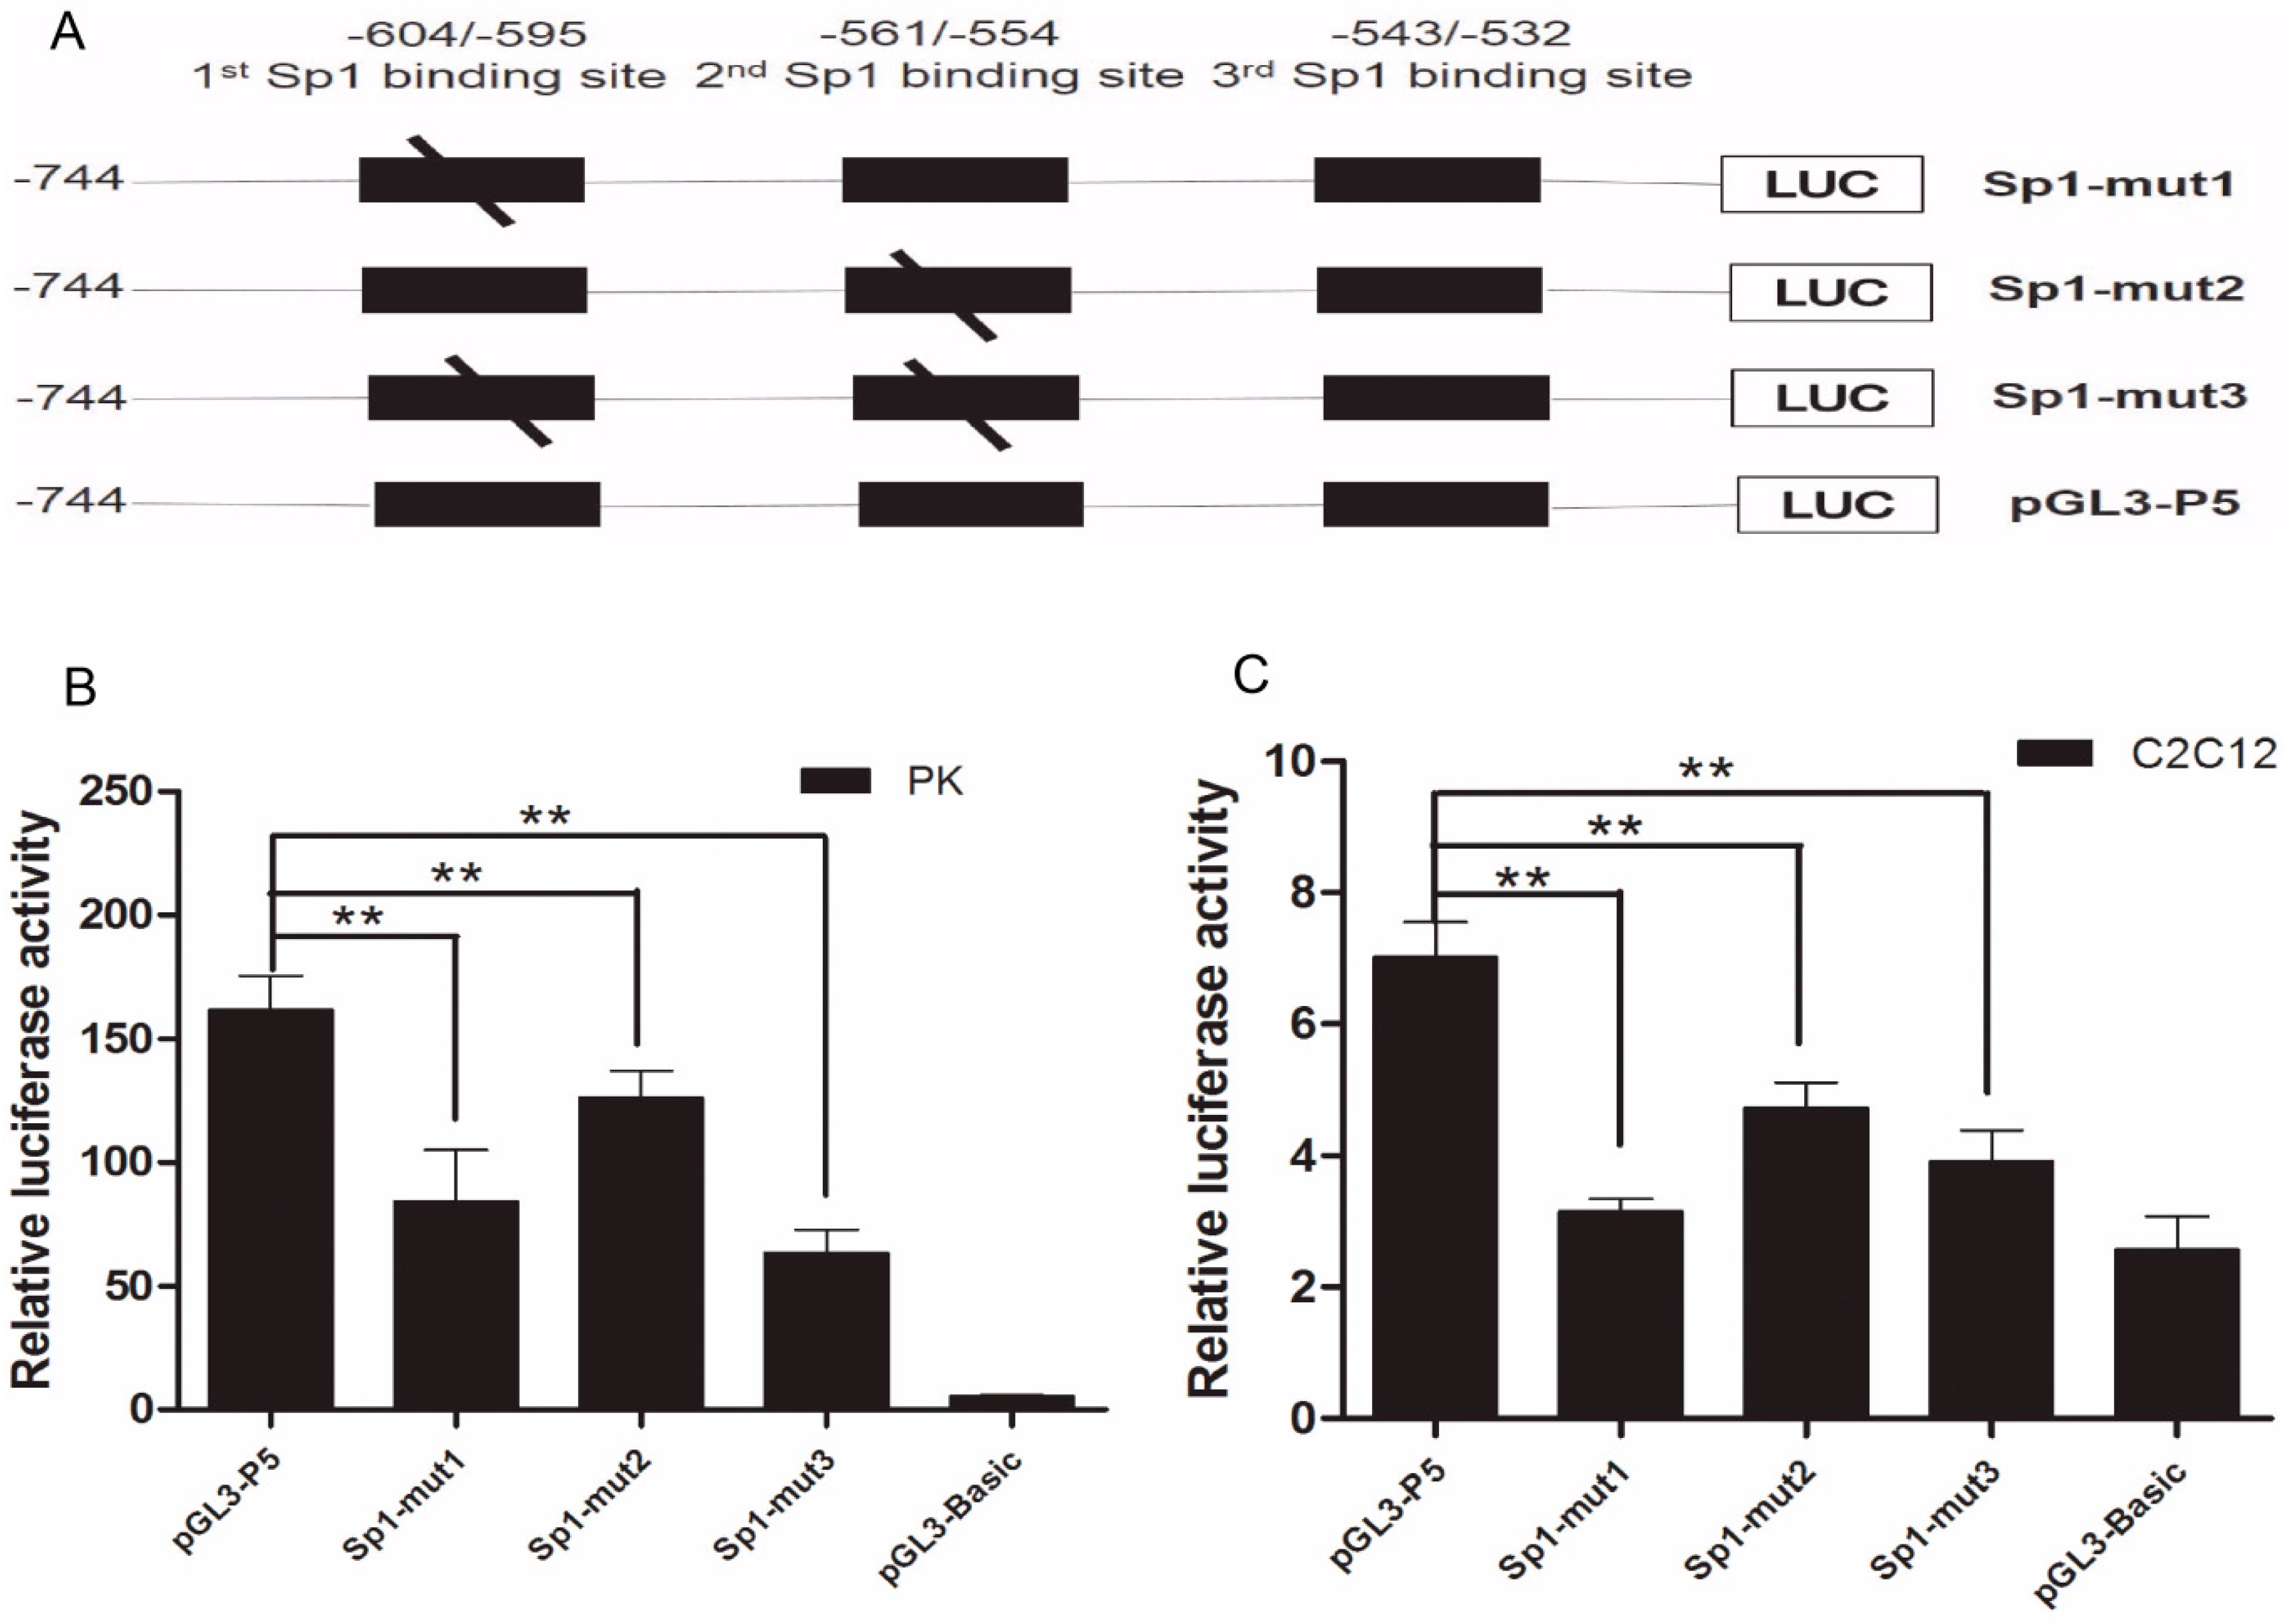
2.2. The Importance of Sp1 Binding Sites in Porcine ROCK1 Promoter

To functionally determine the importance of Sp1 binding sites, site-directed mutagenesis was performed (Figure 2A). The modification in −604/−595 bp and −561/−554 bp regions obviously blocked the Sp1-stimulated transcription activity (Figure 2B,C) in both PK and C2C12 cells. These results revealed that the two binding sites (located at −604/−595 bp and −561/−554 bp) are essential for ROCK1 promoter activity.
Figure 2. Site-directed mutation of Sp1 binding sites in ROCK1-P5 fragment. (A) Schematic structure of site-directed mutagenesis in the putative Sp1 binding sites (the black slash) of porcine ROCK1 gene. LUC represents the Luciferase gene in the vectors; (B,C) Luciferase activity of site-directed mutagenesis in PK and C2C12 cells. Statistical differences of relative activities were analyzed in the same cells; ** p < 0.01, data were expressed as means ± SD of three replicates.
Ijms 17 00112 g002

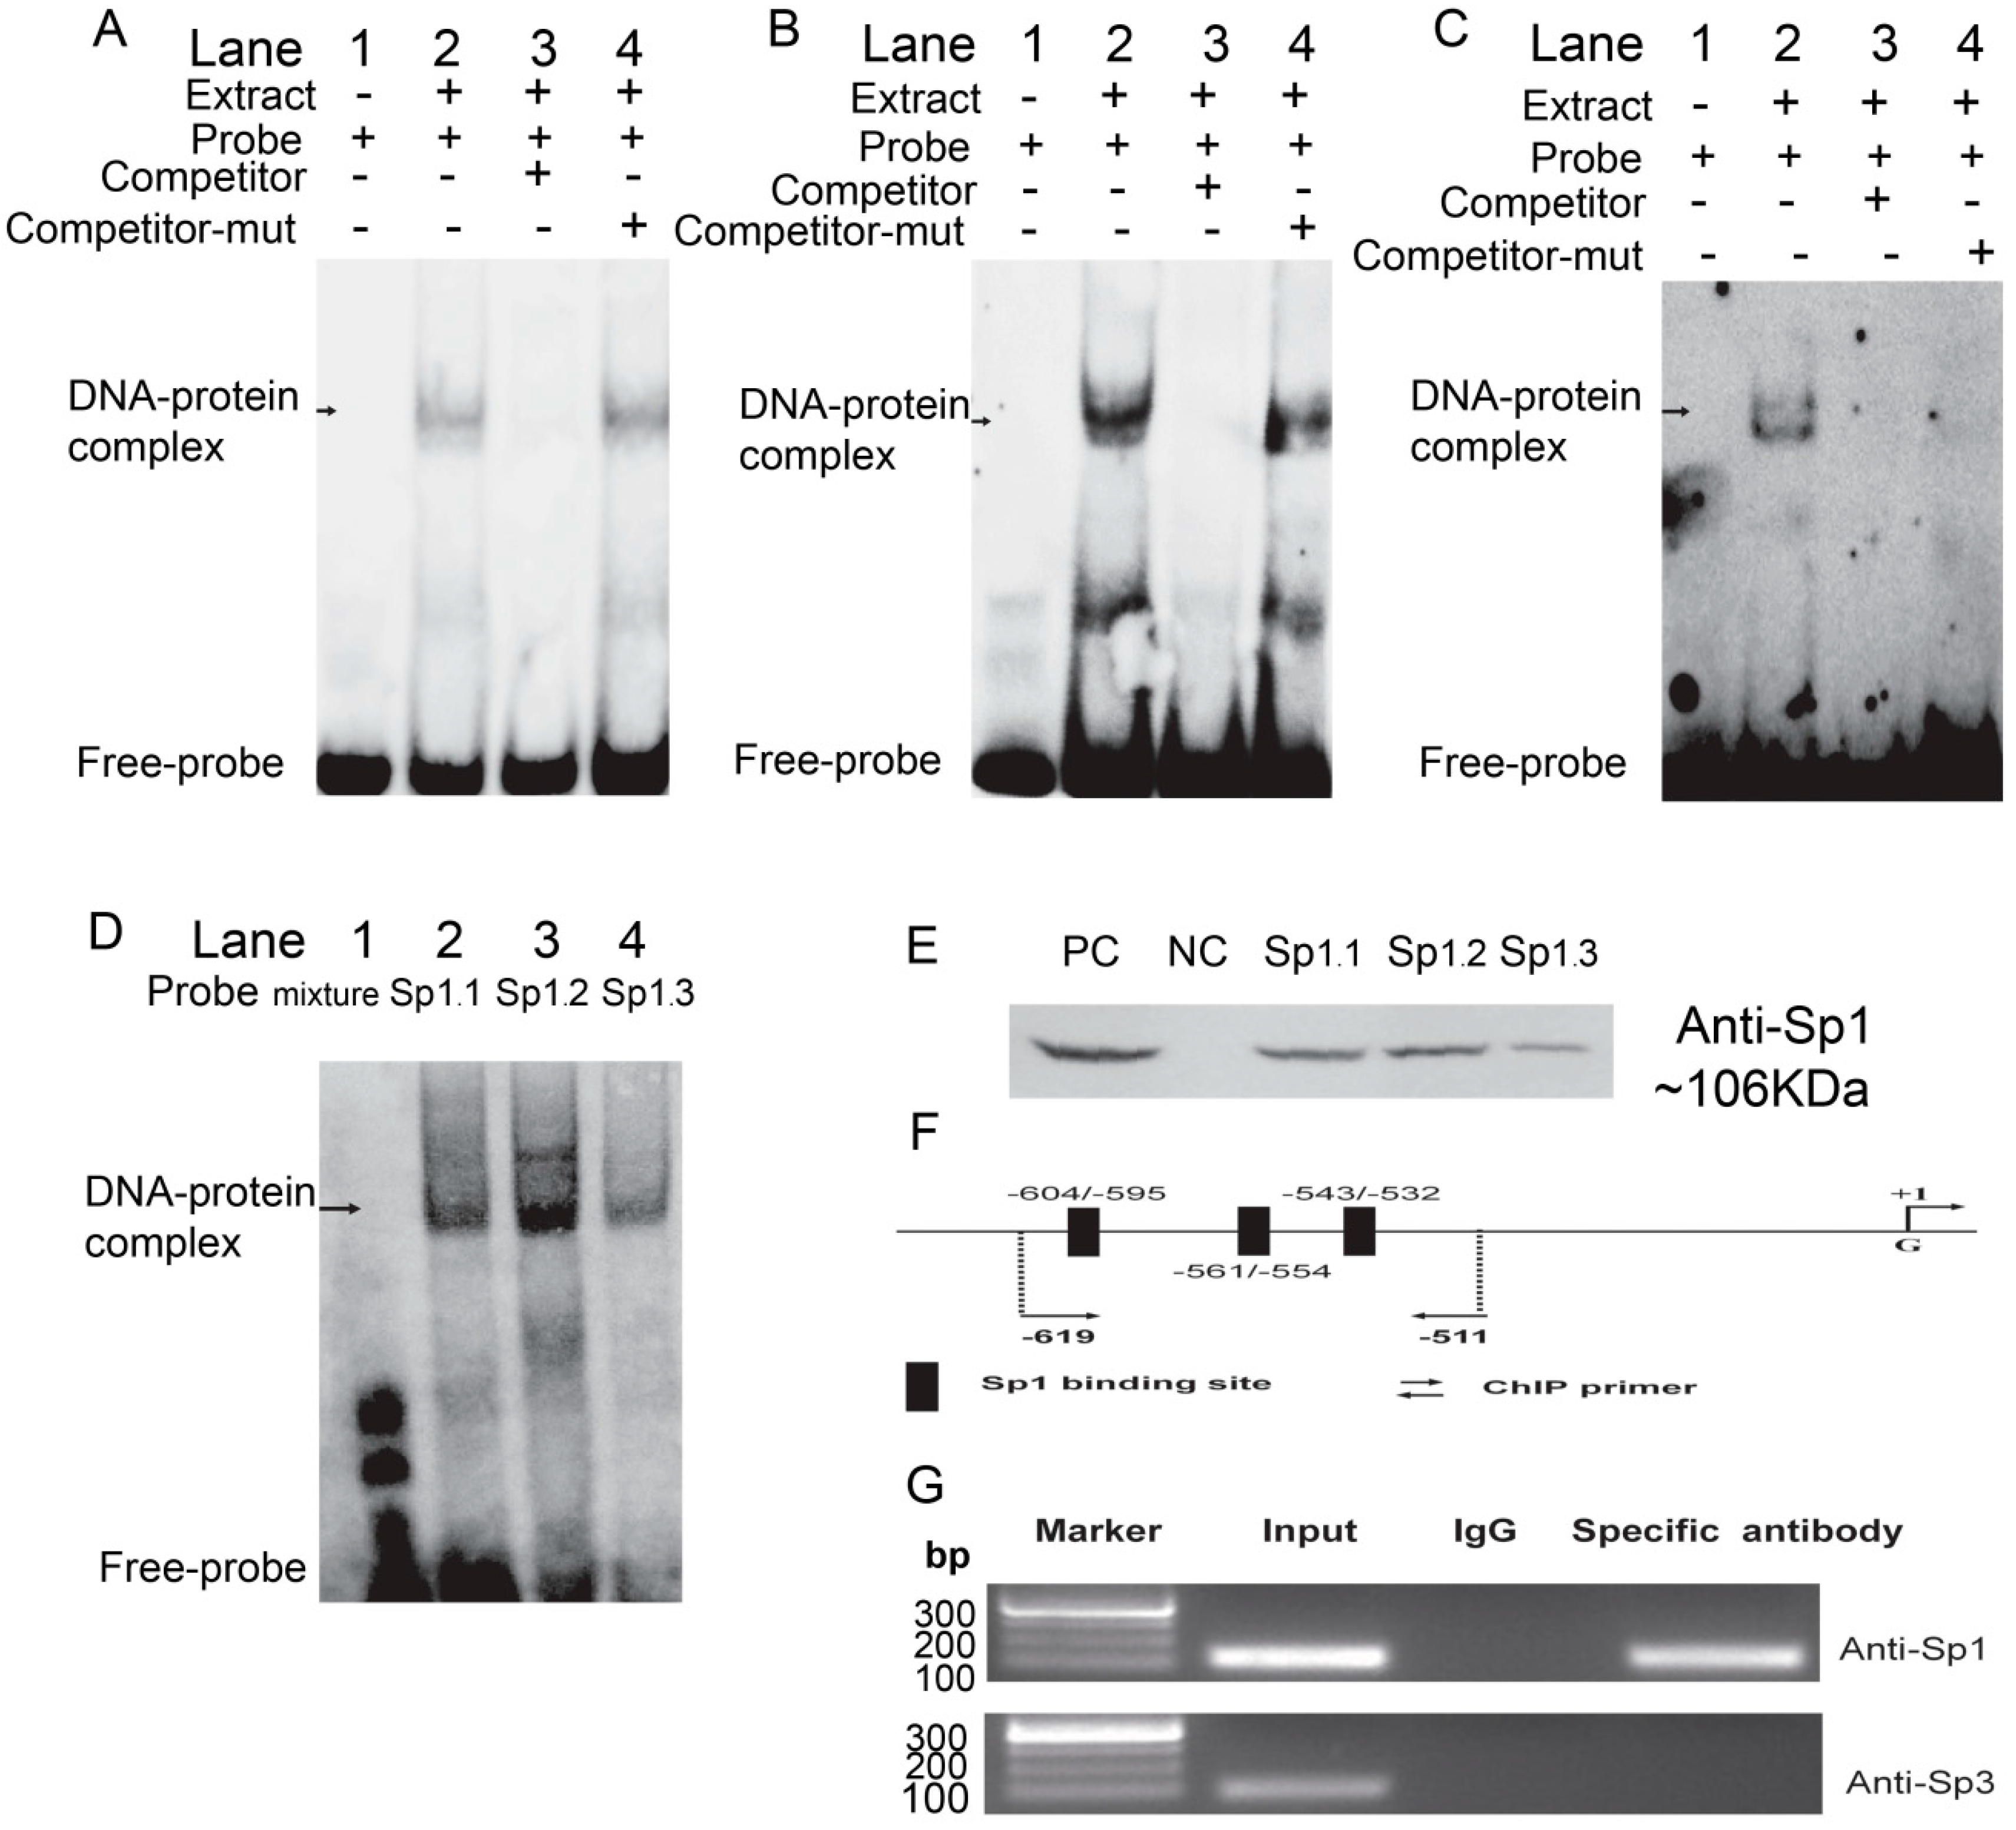
2.3. Sp1 Binds to the Porcine ROCK1 Promoter in Vitro and in Vivo

The EMSA and DNA pull down assays were used to determine whether transfection factor Sp1 could bind to promoter region of porcine ROCK1 gene in vitro. As shown Figure 3A, the incubation of Nuclear extract (NE) from PK cells with Sp1 probe 1 gave rise to the formation of a DNA–protein complex (Lane 2), which could be observed with competitor-mut probe (Lane 4), but not with competitor probe (Lane 3). Moreover, DNA-protein bands of the other two probes were also detected (Figure 3B,C), and when incubated with the same NE, each site showed a different binding ability, whereas the molecular size of the three DNA–protein complexes were similar (Figure 3D). Moreover, the proteins obtained from DNA pull down assay were detected using anti-Sp1 by Western blotting (Figure 3E), suggesting the protein bound to ROCK1 promoter region was exactly the transcription factor Sp1. Similar results of EMSA and DNA pull down were observed in NE of pig longissimus dorsi muscle (LM) (Figure S2A–E).
To determine the in vivo binding of Sp1 and ROCK1 promoter, ChIP analysis was performed in PK cells. The position information of the ChIP-PCR primers is shown in Figure 3F where the three sites are considered as a cluster. DNA fragment of the expected size was obtained when anti-Sp1 was added (Figure 3G). However, when antibody for Sp3 (another member the SP/KLF transcription factor family) was used, the expected DNA fragment did not appear (Figure 3G). The results showed that Sp1, rather than Sp3, directly interacted with the ROCK1 promoter.
Taken together, these findings suggested that the proximal Sp1 binding sites of the ROCK1 promoter region were capable of binding to Sp1 protein both in vitro and in vivo.
Figure 3. Binding of Sp1 with the ROCK1-P5 fragment was analyzed in vitro and in vivo. The first (A), the second (B) and the third (C) biotin-labeled probes were incubated with the NE of PK cells. Lane 1 was the negative control without NE; the reagents were incubated in the absence competitor probes in Lane 2 or in presence of 50× excess competitor (Lane 3)/competitor-mutant (Lane 4) probes, respectively; (D) The three probes were incubated with PK NE, respectively; (E) Proteins of PK extracted from DNA-pull down materials were detected by Western blot. The total non-denaturing proteins/Streptavidin MagneSphere® Paramagnetic Particles were taken as positive/negative control (PC/NC). The three potential Sp1 binding sites were named as Sp1.1, Sp1.2, and Sp1.3 in (D,E). The competitor/competitor-mutant probes were 50-fold excess and arrows indicated the specific DNA-protein complex bands; (F) Schematic diagram of the Sp1 binding sites in the porcine ROCK1-P5 fragment; (G) ChIP assay of Sp1 binding to porcine ROCK1-P5 fragment in PK cells. The in vivo interaction of Sp1 and Sp3 with porcine ROCK1 promoter was determined by ChIP assay, in which Normal mouse IgG was used as negative control. DNA isolated from immunoprecipitated materials was used for PCR amplification, whereas total chromatin was used as input (positive control). The antibodies used in ChIP assay were listed in the right of the figure and the corresponding amplification product obtained here was 107 bp.
Ijms 17 00112 g003

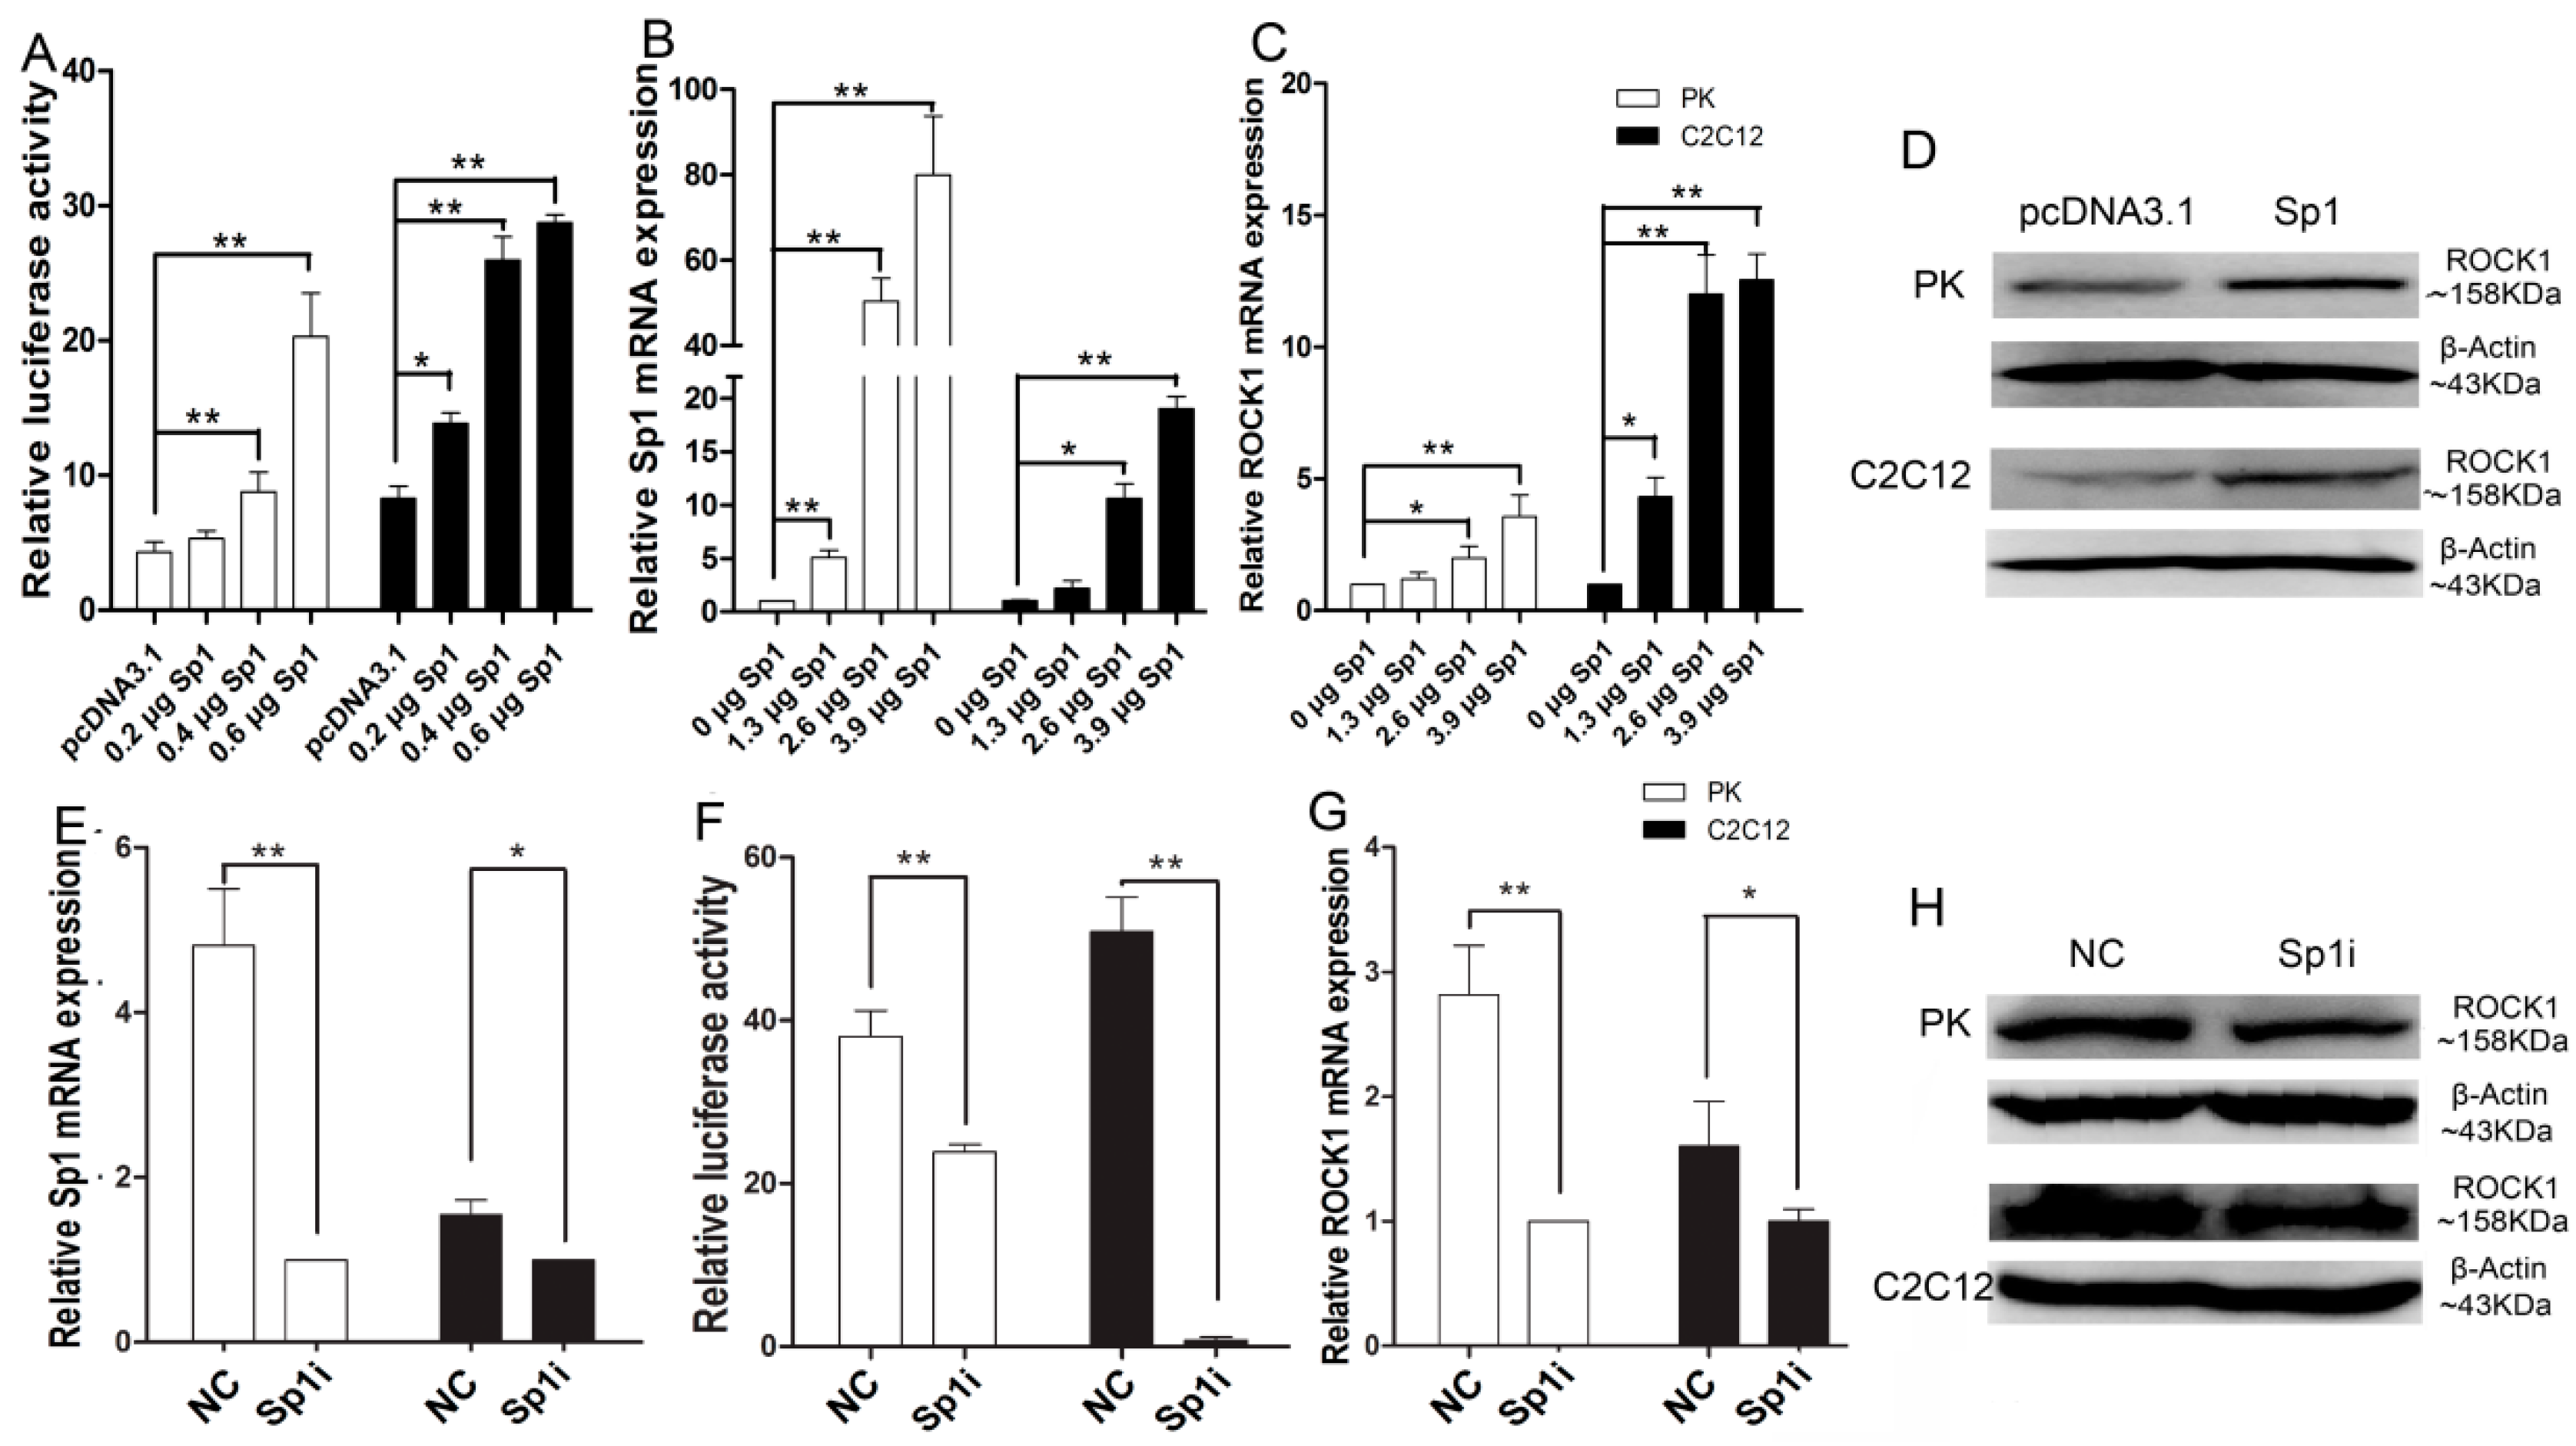
2.4. Sp1 Stimulates ROCK1 Gene Expression

According to the prediction of cis-acting elements, the overexpression and inhibition of Sp1 were performed. When overexpressing Sp1 both in PK and C2C12 cells, the ROCK1-P5 activity was significantly increased depending on the amount of Sp1 (Figure 4A,B). Furthermore, overexpression of Sp1 significantly promoted ROCK1 expression at mRNA level (p < 0.05), which was also dependent on the amount of Sp1 (Figure 4C). Meanwhile, a similar tendency was observed at protein level (Figure 4D). Additionally, when inhibiting Sp1 by specific siRNAs, a clear decrease of ROCK1 promoter activity and the expression of ROCK1 were observed both in PK and C2C12 cells (Figure 4F–H). Taken together, our data showed that Sp1 acted as a positive regulator of ROCK1 transcription.
Figure 4. Sp1 stimulates the expression of porcine ROCK1 gene. (A) Over-expression of Sp1 up-regulated ROCK1 luciferase activity; (B) Over-expression efficacy of Sp1; (C,D) Over-expression of Sp1 stimulated ROCK1 expression at mRNA and protein level; (E) The interferences efficacy of siRNA; (F) Suppressing Sp1 reduced the ROCK1 promoter activity; (G,H) Inhibition of Sp1 suppressed ROCK1 expression at mRNA and protein level. The amount of plasmid was kept constant by the addition of pcDNA3.1 (+) vector. The data were obtained both in PK and C2C12 cells and expressed as means ± SD of three replicates. * p < 0.05, ** p < 0.01.
Ijms 17 00112 g004

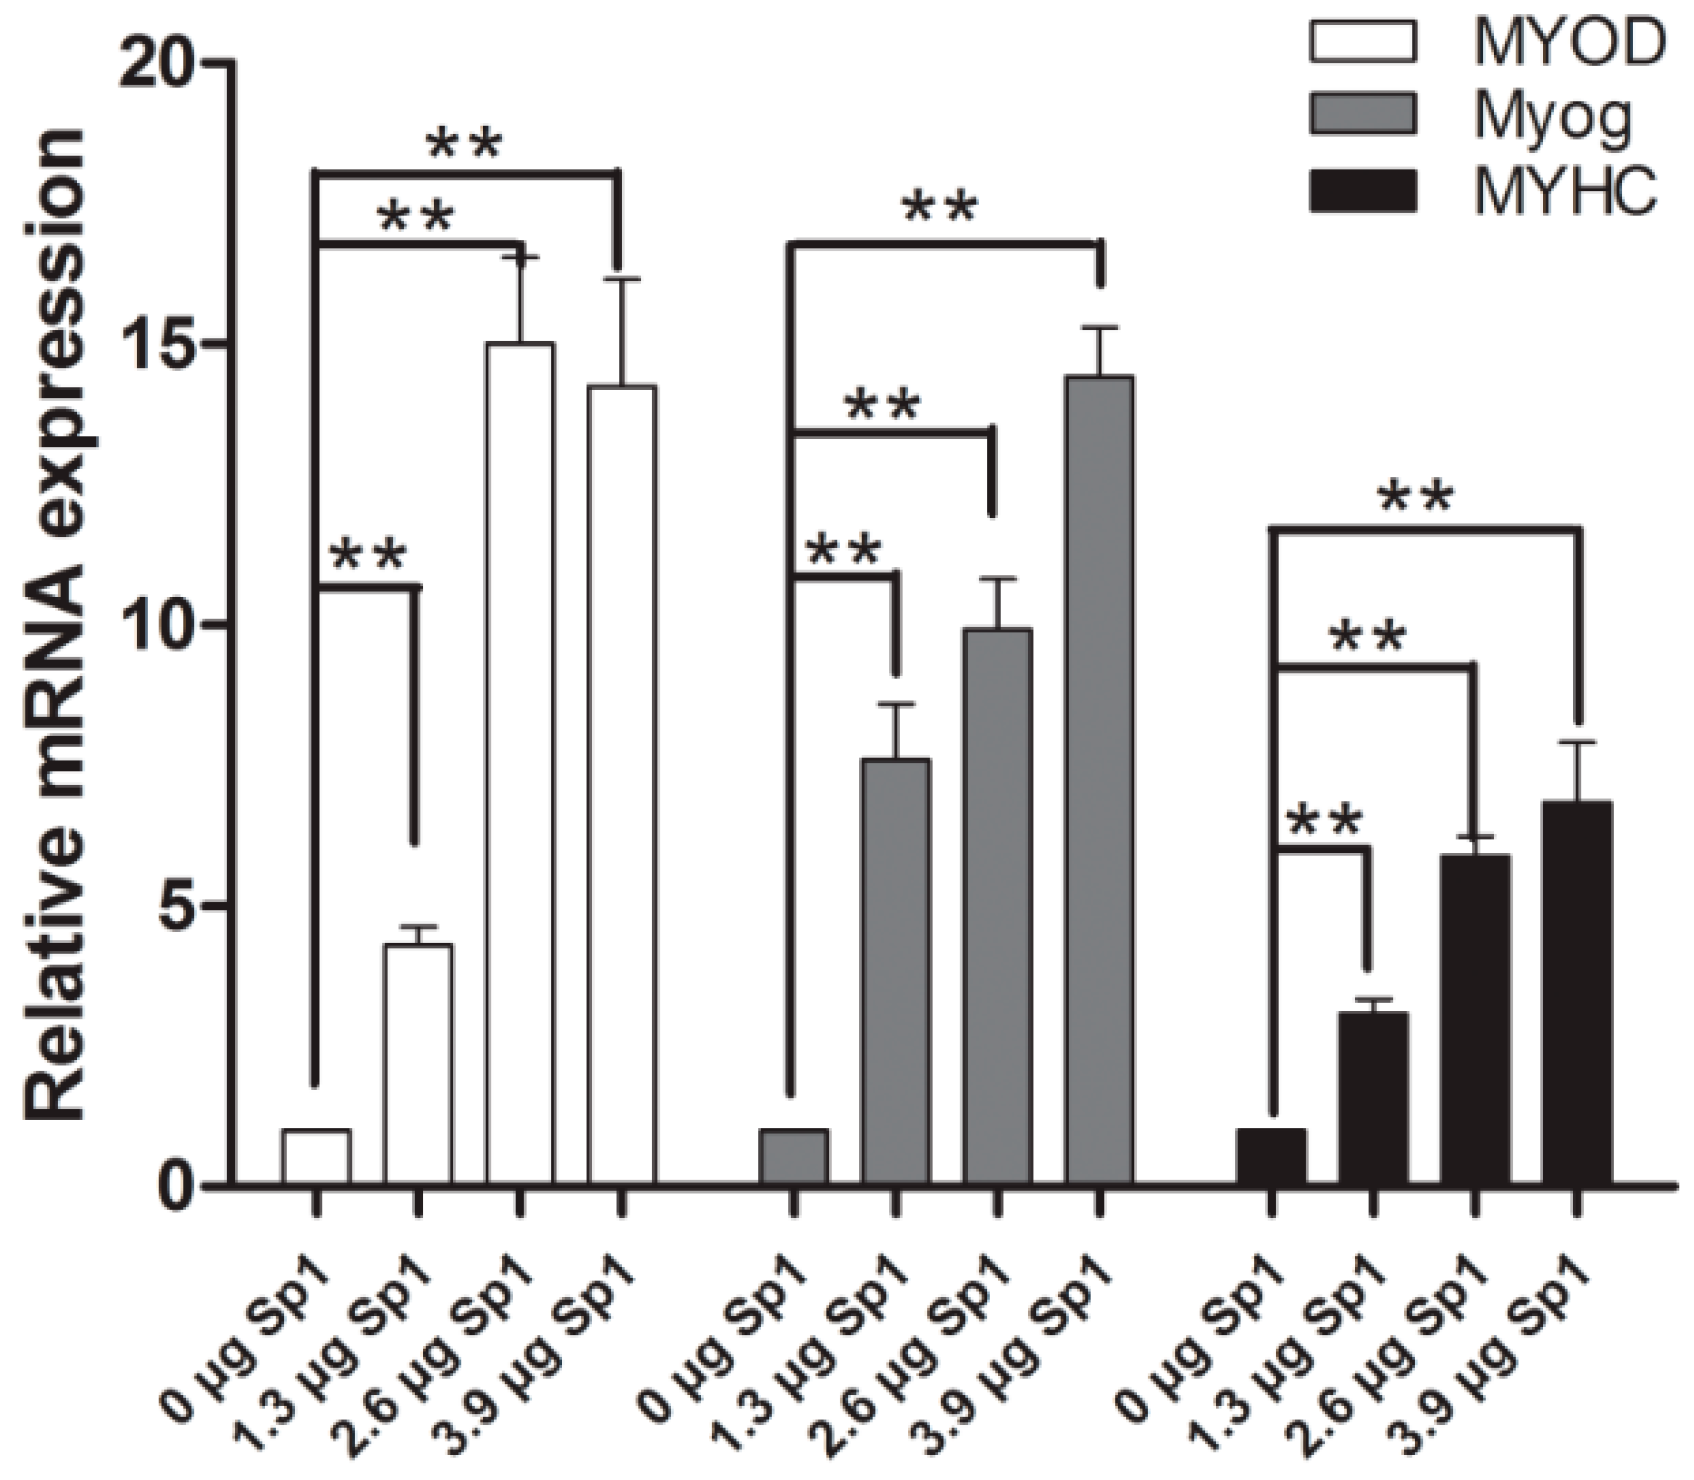
2.5. Sp1 Stimulates the Process of Myogenesis

To determine whether ROCK1 affects the process of myogenesis via Sp1, Sp1 was forced expressed in C2C12 cells. Overexpression of Sp1 results in the up-regulation of MyoD, MyoG, and MyHC at mRNA level (Figure 5), indicating that Sp1 can stimulate the process of myogenesis.
Figure 5. Sp1 promotes the process of myogenesis. Over-expression of Sp1 significantly stimulated MyoD, MyoG, MyHC mRNA expression in C2C12 cells, ** p < 0.01.
Ijms 17 00112 g005

3. Discussion

The promoter region is reported to regulate the transcription initiation and the expression of gene which is critical for the regulation of gene expression [20]. Our experimental analysis indicated that the 5’-flanking region from −744 to −402 bp of porcine ROCK1 gene significantly affected the promoter activity (Figure 1 and Figure 2), suggesting that the core promoter is located in this region and the regulatory elements of this region may enhance the promoter activity of ROCK1.
The in silico analysis of the promoter region of porcine ROCK1 reveals that this region exhibits an extremely high GC content (up to 54.82%), particularly the core promoter region (from −744 to −402 bp, accounting for 74.72%), and the region contains several GC boxes. Further analysis indicated the core promoter region of porcine ROCK1 contains several potential binding sites for Sp1, in line with the report that Sp1 binding sites often occur as multiple repeats [21]. Sp1, a regulator in many tissues, plays a vital role in numerous cellular functions such as apoptosis and invasion [22,23] and usually regulates the expression of its target gene via binding to their promoters [24]. It often works through binding to GC-rich decanucleotide recognition elements (GC boxes) with a consensus sequence 5’-(G/T)GGGCGG(G/A)(G/A)(G/T)-3’ [25,26]. The EMSA, DNA pull down and ChIP assays revealed that Sp1 does bind to the ROCK1 promoter directly and these interactions are important determinants of basal promoter activity. Furthermore, the specific DNA–protein complexes detected by EMSA indicate that Sp1 can bind independently to each potential GC boxes, in accordance with former research [27]. Previous studies indicate that Sp1 and Sp3 can cooperate or compete to regulate the expression of target genes [28,29]. The presence of expected amplification products when DNA precipitated with Sp1 antibody and the absence of expected amplification products when DNA precipitated with Sp3 antibody indicate that Sp1, not Sp3, directly binds to ROCK promoter to transcriptionally regulate the expression of ROCK1.
Sp1 can promote or suppress the expression of its target gene [18]. The significant changes of ROCK1 promoter activity and the endogenous ROCK1 expression when overexpressing or inhibiting Sp1 indicate that Sp1 can stimulate the expression of ROCK1 via the regulation of transcription activity, different from the previous report that Sp1 reduces the promoter activity of rat ROCK1 gene in dental epithelial cells [19].
ROCK1 gene has been implicated in the regulation of skeletal muscle growth [30,31]. Several studies via miRNA, overexpression or inhibition of ROCK1 have demonstrated that ROCK1 acts as a negative regulator in the myogenic process [8,9,32]. Mfy5 (myogenic factor 5), Mfy6 (MRF4), MyoD (myogenic differentiation) and myogenin (MyoG) are members of the myogenic regulatory factors (MRFs), and play crucial roles in the complex process of skeletal myogenesis, including commitment and proliferation, muscle fiber formation, and postnatal maturation and muscle function [33,34]. Myosin heavy chain (MyHC) is the essential component of myosin, the most abundant contractile molecule in mammalian skeletal muscles [35]. When forced expression of Sp1 occurs, the significant increase of MyoD, MyoG, and MyHC in C2C12 cells suggests the significant role of Sp1 in regulating myoblasts differentiation, implying that ROCK1 might participate in or partly inhibit the regulation of myoblasts’ differentiation via Sp1. Additionally, Sp1 can affect the phosphorylation of multiple genes, which can further affect their functions [36,37]. The function of ROCK will be changed when its activity was modified [38]. Therefore, further research needs to be performed to determine whether Sp1 can affect the phosphorylation of porcine ROCK1 gene.
Taken together, Sp1 acts as a critical regulatory factor for porcine ROCK1 transcription and may regulate the development of pig skeletal muscle via Sp1-ROCK1-MRFs pathway, thus providing a novel regulation mechanism of porcine ROCK1 and myogenesis.

4. Materials and Methods

4.1. Animals

Pigs (S. scrofa) used for this study were obtained from Jingpin pig station of Huazhong Agricultural University (Wuhan, China). All of the studies involving animals were conducted according to the regulation (No. 5 proclamation of the Standing Committee of Hubei People’s Congress) approved by the Standing Committee of Hubei People’s Congress, China. The sample collection was approved by the Ethics Committee of Huazhong Agricultural University with the permit number No. 30700571 for this study. The animals humanely sacrificed as necessary to ameliorate suffering. The methods were carried out in accordance with the approved guidelines. Four blood samples were preparation for genomic DNA and protein samples of the longissimus dorsi muscle (LM) were collected from every 60-day old Yorkshire pigs (3 pigs in total).

4.2. In Silico Sequence Analysis

The 2552 bp 5’up-stream sequence of porcine ROCK1 gene was obtained from NCBI (http://www.ncbi.nlm.nih.gov). The promoter region was predicted by Proscan (http://www-bimas.cit.nih.gov/) and Sp1 binding sites were predicted by IFSEARCH (http://www.cbrc.jp/research/db/TFSEARCH.html) and the JASPAR database (http://jaspar.genereg.net/).

4.3. Rapid Amplification of 5’cDNA Ends (5’-RACE)

The LM of 60-day Yorkshire was used for RNA isolation, with total RNA from mouse heart provided in the kit as positive control. 5’-RACE was performed using the SMARTer™ RACE cDNA synthesis kit (Clontech, Shiga, Japan) according to the manufacturer's instructions and the primers were listed in Table S1.

4.4. Quantitative Real-Time Polymerase Chain Reaction (qRT-PCR)

Total-RNA was extracted with Total RNA isolation Kit (Omega, Bienne, Switzerland) and the cDNA was synthesised as previously described [39]. Subsequently, the expression was measured by qRT-PCR in LightCycler480 (Roche, Basel, Switzerland), using the gene-specific primers (Table S1). The HPRT, eEFγ, and PPIA were selected as housekeeping genes for PK cells [39], while β-Actin was used for C2C12 cells.

4.5. Plasmids’ Construction, Cell Culture, Transfection and Analysis

Serial deletions of porcine ROCK1 5’-flanking genomic region were amplified and denoted as ROCK1-P0-P10-Luc. Subsequently, the recombinant fragments were digested and inserted into pGL3-Basic vector (Promega, Madison, WI, USA). The overexpression plasmids were created by inserting the coding sequence (CDS) of porcine Sp1 gene into the pcDNA3.1 (+) vector (Invitrogen, Cashman, CA, USA). All constructs were sequenced for verification. Primers used for amplification are listed in Table S2.
The PK (pig kidney cell line) and C2C12 (mouse myoblast cell line) cells were maintained at 37 °C in humidified 5% CO2 atmosphere in Dulbecco’s modified Eagle medium (Hyclone, Logan, UT, USA) supplemented with 10% fetal bovine serum (Gibico, New York, NY, USA). Cells were seeded in proper plates and cultured overnight. Then, the cells were transfected using Lipofectamine 2000 (Invitrogen). Site-directed mutagenesis of the ROCK1-P5 (−744/+737)-Luc construct was performed by using the MutanBEST Kit (Takara, Tokyo, Japan) and specific primers (Table S3). Twenty-four hours after transfection, the luciferase activity was measured with PerkinElmer 2030 Multilabel Reader (PerkinElmer, Boston, MA, USA).

4.6. Electrophoretic Mobility Shift Assay (EMSA)

Nuclear extract (NE) of PK cells and LM of pig were extracted with Nucleoprotein Extraction Kit (Beyotime, Shanghai, China). Sequence specific probes (Sangon, Shanghai, China) were synthesized and annealed into double strands. The DNA binding ability was detected by EMSA with Scientific Light-Shift EMSA KIT (Thermo, Grand Island, NY, USA).
Briefly, proper component was added to the reaction, in which 20 fmol of Biotin-labeled oligonucleotides were added, the control group was supplemented with 50-fold excess of competitor/competitor-mut oligonucleotides. After incubation, the mixtures were conducted on polyacrylamide gels and transferred onto nylon membrane and analyzed with GE ImageQuant LAS4000 mini (GE-Healthcare, Little Chalfont, UK). Details of the oligonucleotide probes are shown in Table S3.

4.7. Chromatin Immunoprecipitation (ChIP) Assay

To measure the binding activity of Sp1 in vivo, ChIP assay was conducted with the EZ-ChIP™ Kit (Millipore, Bedford, MA, USA) according to the manufacturer’s protocol in PK cells. Briefly, DNA-protein complex were cross-linked and neutralized. After sonication, fragmented chromatin was added into ChIP dilution buffer, and incubated overnight with anti-Sp1 (Abcam, ab13370, Rabbit polyclonal antibody)/anti-Sp3 (Santa Cruz, sc-644x, Rabbit polyclonal antibody). A Normal Mouse IgG was added as negative control antibody. Immunoprecipitated products were collected after incubation with Protein A + G coated magnetic beads. The bound chromatin was eluted and digested with proteinase K, then the DNA was purified for PCR analysis (the primers are listed in Table S1).

4.8. DNA Pull down Assay

Non-denaturing proteins of PK cells and LM of the pig were extracted by Non-denaturing Lysis Buffer (Sangon). Later, we typically bonded non-denaturing proteins and biotin-labeled DNA probes by rotation, which were then supplemented with Streptavidin MagneSphere® Paramagnetic Particles (Promega). Then, the reactions were further rotated and washed. Later, DNA-bound proteins were collected with 10% SDS (sodium dodecyl sulfate, sodium salt) and analyzed by Western blotting, taking non-denaturing proteins/Streptavidin MagneSphere® Paramagnetic Particles as positive/negative control.

4.9. RNA Interference

Small interference fragments (siRNA) for Sp1 were synthesized (GenePharma, Nanjing, China) and transfected according to the manufacturer’s instructions. Sus-Sp1-siRNA: GCGGCAAAGUAUAUGGCAATT and mus-Sp1-siRNA: UGAGAACAGCAACAACUCCTT were used in PK or C2C12 cells, respectively.

4.10. Western Blotting

Samples were heated in SDS buffer, separated by SDS-PAGE and transferred to PVDF (polyvinylidene fluoride) membranes. Then, the membranes were blocked and separately probed with anti-ROCK1 (Abcam, Cambridge, MA, USA, ab134181), and anti-Sp1 (Abcam, ab13370) overnight. β-Actin (Santa Cruz, Santa Cruz, TX, USA, sc-130656) was used as a loading control. After washing, the membranes were incubated with secondary antibodies (Santa Cruz) and visualized using the ECL (enhance chemiluminescence) Western Blotting Detection System (Tiangen, Beijing, China).

4.11. Statistical Analysis

All experiments were performed at least three times in triplicate. Data are presented as mean ± SD of three replications. Statistical significance was assessed with Bonferroni t-test in SAS 9.1. Differences were considered statistically significant at p < 0.05 (* p < 0.05; ** p < 0.01).

5. Conclusions

We conclude that Sp1 positively regulates ROCK1 transcription by directly binding to the ROCK1 core promoter region and may affect the process of myogenesis.

Supplementary Materials

Supplementary materials can be found at https://www.mdpi.com/1422-0067/17/1/112/s1.

Acknowledgments

This work was supported by the Grants from the National Project for Breeding of Transgenic Pig (2013ZX08006-002 to Yuanzhu Xiong).

Author Contributions

All authors have made substantial contributions to this article: Conceived and designed the experiments: Yuanzhu Xiong and Minggang Lei; Performed the experiments: Ruirui Zhang and Xiaoting Feng; Analyzed the data: Ruirui Zhang, Xiaoting Feng, Mengsi Zhan, Cong Huang, Kun Chen, Xiaoyin Tang, Tingting Kang; Contributed reagents/materials/analysis tools: Yuanzhu Xiong, Ruirui Zhang, Xiaoyin Tang. Wrote the manuscript: Ruirui Zhang.

Conflicts of Interest

The authors declare no conflict of interest.

References

  1. Sun, J.; Zhang, D.H.; Zheng, Y.; Zhao, Q.; Zheng, M.H.; Kovacevic, Z.; Richardson, D.R. Targeting the Metastasis Suppressor, NDRG1, using novel iron chelators: Regulation of stress fiber-mediated tumor cell migration via modulation of the ROCK1/pMLC2 signaling pathway. Mol. Pharmacol. 2013, 83, 454–469. [Google Scholar] [CrossRef] [PubMed]
  2. Riento, K.; Ridley, A.J. Rocks: Multifunctional kinases in cell behavior. Nat. Rev. Mol. Cell Biol. 2003, 4, 446–456. [Google Scholar] [CrossRef] [PubMed]
  3. Zhang, J.Y.; Dong, H.S.; Oqani, R.K.; Lin, T.; Kang, J.W.; Jin, D.I. Distinct roles of ROCK1 and ROCK2 during development of porcine preimplantation embryos. Reproduction 2014, 148, 99–107. [Google Scholar] [CrossRef] [PubMed]
  4. Zhao, J.; Ye, W.; Wu, J.; Liu, L.; Yang, L.; Gao, L.; Chen, B.; Zhang, F.; Yang, H.; Li, Y. Sp1-CD147 positive feedback loop promotes the invasion ability of ovarian cancer. Oncol. Rep. 2015, 34, 67–76. [Google Scholar] [CrossRef] [PubMed]
  5. Lee, S.H.; Huang, H.; Choi, K.; Lee, D.H.; Shi, J.; Liu, T.; Chun, K.H.; Seo, J.A.; Lima, I.S.; Zabolotny, J.M.; et al. ROCK1 isoform-specific deletion reveals a role for diet-induced insulin resistance. Am. J. Physiol. Endocrinol. Metab. 2014, 306, 332–343. [Google Scholar] [CrossRef] [PubMed]
  6. Liu, H.; Li, W.Z.; Chen, C.Y.; Pei, Y.G.; Long, X.Y. MiR-335 acts as a potential tumor suppressor miRNA via downregulating ROCK1 expression in hepatocellular carcinoma. Tumor Biol. 2015, 36, 6313–6319. [Google Scholar] [CrossRef] [PubMed]
  7. Kentrup, D.; Reuter, S.; Schnockel, U.; Grabner, A.; Edemir, B.; Pavenstadt, H.; Schober, O.; Schafers, M.; Schlatter, E.; Bussemaker, E. Hydroxyfasudil-Mediated Inhibition of ROCK1 and ROCK2 Improves Kidney Function in Rat Renal Acute Ischemia-Reperfusion Injury. PLoS ONE 2011, 6, e26419. [Google Scholar] [CrossRef] [PubMed] [Green Version]
  8. Castellani, L.; Salvati, E.; Alema, S.; Falcone, G. Fine regulation of RhoA and rock is required for skeletal muscle differentiation. J. Biol. Chem. 2006, 281, 15249–15257. [Google Scholar] [CrossRef] [PubMed]
  9. Zhang, J.; Ying, Z.Z.; Tang, Z.L.; Long, L.Q.; Li, K. MicroRNA-148a Promotes Myogenic Differentiation by Targeting the ROCK1 Gene. J. Biol. Chem. 2012, 287, 21093–21101. [Google Scholar] [CrossRef] [PubMed]
  10. Liu, D.; Chen, X.Y.; Xiong, R.P.; Ning, Y.L.; Li, P.; Peng, Y.; Liu, P.; Zhao, Y.; Yang, N.; Zhou, Y.G. Dexamethasone inhibits U937 cell adhesion via the down-regulation of ROCK1 activity. Acta Biochim. Pol. 2012, 59, 557–560. [Google Scholar] [PubMed]
  11. Vignozzi, L.; Morelli, A.; Filippi, S.; Ambrosini, S.; Mancina, R.; Luconi, M.; Mungai, S.; Vannelli, G.B.; Zhang, X.H.; Forti, G.; et al. Testosterone regulates RhoA/Rho-Kinase signaling in two distinct animal models of chemical diabetes. J. Sex. Med. 2007, 4, 620–630. [Google Scholar] [CrossRef] [PubMed]
  12. Shimizu, Y.; Dobashi, K.; Iizuka, K.; Horie, T.; Suzuki, K.; Tukagoshi, H.; Nakazawa, T.; Nakazato, Y.; Mori, M. Contribution of small GTPase Rho and its target protein rock in a murine model of lung fibrosis. Am. J. Respir. Crit. Care Med. 2001, 163, 210–217. [Google Scholar] [CrossRef] [PubMed]
  13. Chun, K.H.; Araki, K.; Jee, Y.; Lee, D.H.; Oh, B.C.; Huang, H.; Park, K.S.; Lee, S.W.; Zabolotny, J.M.; Kim, Y.B. Regulation of glucose transport by ROCK1 differs from that of ROCK2 and is controlled by actin polymerization. Endocrinology 2012, 153, 1649–1662. [Google Scholar] [CrossRef] [PubMed]
  14. Hirose, T.; Horvitz, H.R. An Sp1 transcription factor coordinates caspase-dependent and -independent apoptotic pathways. Nature 2013, 500, 354–358. [Google Scholar] [CrossRef] [PubMed]
  15. Gonzalez-Ramirez, R.; Martinez-Hernandez, E.; Sandoval, A.; Felix, R. Transcription Factor Sp1 Regulates T-Type Ca2+ Channel Ca(V)3.1 Gene Expression. J. Cell. Physiol. 2014, 229, 551–560. [Google Scholar] [CrossRef] [PubMed]
  16. Gonzalez-Rubio, S.; Lopez-Sanchez, L.; Munoz-Castaneda, J.; Linares, C.I.; Aguilar-Melero, P.; Rodriguez-Peralvarez, M.; Sanchez-Sanchez, R.; Fernandez-Alvarez, A.; Casado, M.; Montero-Alvarez, J.L.; et al. GCDCA down-regulates gene expression by increasing Sp1 binding to the NOS-3 promoter in an oxidative stress dependent manner. Biochem. Pharmacol. 2015, 96, 39–51. [Google Scholar] [CrossRef] [PubMed]
  17. Gazzoli, I.; Kolodner, R.D. Regulation of the human MSH6 gene by the Sp1 transcription factor and alteration of promoter activity and expression by polymorphisms. Mol. Cell. Biol. 2003, 23, 7992–8007. [Google Scholar] [CrossRef] [PubMed]
  18. Beishline, K.; Azizkhan-Clifford, J. Sp1 and the ‘hallmarks of cancer’. FEBS J. 2015, 282, 224–258. [Google Scholar] [CrossRef] [PubMed]
  19. Yanuaryska, R.D.; Miyoshi, K.; Adiningrat, A.; Horiguchi, T.; Tanimura, A.; Hagita, H.; Noma, T. Sp6 regulation of Rock1 promoter activity in dental epithelial cells. J. Med. Investig. 2014, 61, 306–317. [Google Scholar] [CrossRef]
  20. Aso, T.; Conaway, J.W.; Conaway, R.C. Role of core promoter structure in assembly of the RNA polymerase II preinitiation complex. A common pathway for formation of preinitiation intermediates at many TATA and TATA-less promoters. J. Biol. Chem. 1994, 269, 26575–26583. [Google Scholar] [PubMed]
  21. Gidoni, D.; Dynan, W.S.; Tjian, R. Multiple specific contacts between a mammalian transcription factor and its cognate promoters. Nature 1984, 312, 409–413. [Google Scholar] [CrossRef] [PubMed]
  22. Choi, J.A.; Jung, Y.S.; Kim, J.Y.; Kim, H.M.; Lim, I.K. Inhibition of breast cancer invasion by TIS21-Akt1-Sp1-Nox4 pathway targeting actin nucleators, mDia genes. Oncogene 2015. [Google Scholar] [CrossRef] [PubMed]
  23. Kim, K.H.; Yoon, G.; Cho, J.J.; Cho, J.H.; Cho, Y.S.; Chae, J.I.; Shim, J.H. Licochalcone A induces apoptosis in malignant pleural mesothelioma through downregulation of Sp1 and subsequent activation of mitochondria-related apoptotic pathway. Int. J. Oncol. 2015, 46, 1385–1392. [Google Scholar] [CrossRef] [PubMed]
  24. Li, S.; Wang, Q.; Qiang, Q.; Shan, H.; Shi, M.; Chen, B.; Zhao, S.; Yuan, L. Sp1-mediated transcriptional regulation of MALAT1 plays a critical role in tumor. J. Cancer Res. Clin. Oncol. 2015, 141, 1909–1920. [Google Scholar] [CrossRef] [PubMed]
  25. Narayan, V.A.; Kriwacki, R.W.; Caradonna, J.P. Structures of zinc finger domains from transcription factor Sp1. Insights into sequence-specific protein-DNA recognition. J. Biol. Chem. 1997, 272, 7801–7809. [Google Scholar] [CrossRef] [PubMed]
  26. Kadonaga, J.T.; Carner, K.R.; Masiarz, F.R.; Tjian, R. Isolation of cDNA encoding transcription factor Sp1 and functional analysis of the DNA binding domain. Cell 1987, 51, 1079–1090. [Google Scholar] [CrossRef]
  27. Gidoni, D.; Kadonaga, J.T.; Barrera-Saldana, H.; Takahashi, K.; Chambon, P.; Tjian, R. Bidirectional SV40 transcription mediated by tandem Sp1 binding interactions. Science 1985, 230, 511–517. [Google Scholar] [CrossRef] [PubMed]
  28. Gartel, A.L.; Goufman, E.; Najmabadi, F.; Tyner, A.L. Sp1 and Sp3 activate p21 (WAF1/CIP1) gene transcription in the Caco-2 colon adenocarcinoma cell line. Oncogene 2000, 19, 5182–5188. [Google Scholar] [CrossRef] [PubMed]
  29. Kwon, H.S.; Kim, M.S.; Edenberg, H.J.; Hur, M.W. Sp3 and Sp4 can repress transcription by competing with Sp1 for the core cis-elements on the human ADH5/FDH minimal promoter. J. Biol. Chem. 1999, 274, 20–28. [Google Scholar] [CrossRef] [PubMed]
  30. Sordella, R.; Jiang, W.; Chen, G.C.; Curto, M.; Settleman, J. Modulation of Rho GTPase signaling regulates a switch between adipogenesis and myogenesis. Cell 2003, 113, 147–158. [Google Scholar] [CrossRef]
  31. Goetsch, K.P.; Kallmeyer, K.; Niesler, C.U. Decorin modulates collagen I-stimulated, but not fibronectin-stimulated, migration of C2C12 myoblasts. Matrix Biol. 2011, 30, 109–117. [Google Scholar] [CrossRef] [PubMed]
  32. Nishiyama, T.; Kii, I.; Kudo, A. Inactivation of Rho/ROCK signaling is crucial for the nuclear accumulation of FKHR and myoblast fusion. J. Biol. Chem. 2004, 279, 47311–47319. [Google Scholar] [CrossRef] [PubMed]
  33. Blackwell, T.K.; Weintraub, H. Differences and similarities in DNA-binding preferences of MyoD and E2A protein complexes revealed by binding site selection. Science 1990, 250, 1104–1110. [Google Scholar] [CrossRef] [PubMed]
  34. Zhong, T.; Jin, P.F.; Dong, E.N.; Li, L.; Wang, L.J.; Zhang, H.P. Caprine sex affects skeletal muscle profile and MRFs expression during postnatal development. Anim. Sci. J. 2013, 84, 442–448. [Google Scholar] [CrossRef] [PubMed]
  35. Pas, M.F.W.I.; Everts, M.E.; Haagsman, H.P. Muscle Development of Livestock Animals: Physiology, Genetics, and Meat Quality; CABI Pub.: Wallingford, Oxfordshire, UK; Cambridge, MA, USA, 2004; Volume 411, p. 42. [Google Scholar]
  36. Tang, Q.; Zhao, S.; Wu, J.; Zheng, F.; Yang, L.; Hu, J.; Hann, S.S. Inhibition of integrin-linked kinase expression by emodin through crosstalk of AMPKalpha and ERK1/2 signaling and reciprocal interplay of Sp1 and c-Jun. Cell Signal. 2015, 27, 1469–1477. [Google Scholar] [CrossRef] [PubMed]
  37. Zhao, S.; Wu, J.; Zheng, F.; Tang, Q.; Yang, L.; Li, L.; Wu, W.; Hann, S.S. β-elemene inhibited expression of DNA methyltransferase 1 through activation of ERK1/2 and AMPKalpha signalling pathways in human lung cancer cells: the role of Sp1. J. Cell. Mol. Med. 2015, 19, 630–641. [Google Scholar] [CrossRef] [PubMed]
  38. Hata, T.; Goto, C.; Soga, J.; Hidaka, T.; Fujii, Y.; Idei, N.; Fujimura, N.; Maruhashi, T.; Mikami, S.; Kihara, Y.; et al. Measurement of Rho-associated kinase (ROCK) activity in humans: Validity of leukocyte p-MBS/t-MBS in comparison with vascular response to fasudil. Atherosclerosis 2011, 214, 117–121. [Google Scholar] [CrossRef] [PubMed]
  39. Feng, X.; Xiong, Y.; Qian, H.; Lei, M.; Xu, D.; Ren, Z. Selection of reference genes for gene expression studies in porcine skeletal muscle using SYBR green qPCR. J. Biotechnol. 2010, 150, 288–293. [Google Scholar] [CrossRef] [PubMed]

