Article

Structure Conservation and Differential Expression of Farnesyl Diphosphate Synthase Genes in Euphorbiaceous Plants

Key Laboratory of Tropical Crop Biotechnology, Ministry of Agriculture, Institute of Tropical Bioscience and Biotechnology, Chinese Academy of Tropical Agricultural Sciences, Haikou 571101, China
*
Author to whom correspondence should be addressed.
Int. J. Mol. Sci. 2015, 16(9), 22402-22414; https://doi.org/10.3390/ijms160922402
Submission received: 31 July 2015 / Revised: 1 September 2015 / Accepted: 6 September 2015 / Published: 15 September 2015
(This article belongs to the Special Issue Plant Molecular Biology)

Abstract

:
Farnesyl diphosphate synthase (FPS) is a key enzyme of isoprenoids biosynthesis. However, knowledge of the FPSs of euphorbiaceous species is limited. In this study, ten FPSs were identified in four euphorbiaceous plants. These FPSs exhibited similar exon/intron structure. The deduced FPS proteins showed close identities and exhibited the typical structure of plant FPS. The members of the FPS family exhibit tissue expression patterns that vary among several euphorbiaceous plant species under normal growth conditions. The expression profiles reveal spatial and temporal variations in the expression of FPSs of different tissues from Euphorbiaceous plants. Our results revealed wide conservation of FPSs and diverse expression in euphorbiaceous plants during growth and development.

1. Introduction

Euphorbiaceae is one of the largest plant families and consists of more than 7000 species. Euphorbiaceus species are evolutionally-diversified, carry distinct physiologies, and have complex traits adapting to dynamic environmental conditions [1]. There are many economically-important plants in Euphorbiaceae, such as the rubber tree (Hevea brasiliensis), the cassava (Manihot esculenta), and the castor bean (Ricinus communis). The rubber tree is the most widely cultivated species for commercial production of natural rubber (cis-polyisoprene) for tires and other products [2]. The cassava is a tropical crop that stores important quantities of starch in its roots. The high starch content makes cassava a desirable energy source both for human consumption and industrial biofuel applications [3]. The castor bean is cultivated in the tropical and subtropical areas of the world for oil production and as an ornamental plant [4].
Isoprenoids constitute a versatile class of compounds fulfilling major physiological functions [5]. The isoprenoid pathway constitutes the most diverse and widespread metabolic pathway of all prokaryotes and eukaryotes, resulting in the biosynthesis of a large number of primary as well as secondary metabolites [6]. In plants isoprenoids are formed by the mevalonate (MVA) pathway in the cytosol [7,8] and the 1-deoxy-d-xylulose 5-phosphate (DXP)/2-Cmethyl-d-erythritol 4-phosphate (MEP) pathway in plastids [9,10]. The MVA pathway is primarily responsible for the synthesis of sesquiterpenes, triterpenes including brassinosteroids, larger molecules such as dolichols, and even macromolecular polyisoprene (natural rubber) [6,11,12]. Farnesyl diphosphate synthase (FPS) is a key enzyme in isoprenoids biosynthesis, which catalyzes the consecutive condensations of dimethylallyl diphosphate (DMAPP) or geranyl diphosphate (GDP) with isopentenyl pyrophosphate (IPP) to produce farnesyl diphosphate (FDP) [8]. FDP serves as a precursor for sesquiterpenoids, sterols, brassinosteroids, triterpenoids, polyprenols, side chains of ubiquinone, and polyisoprenoids such as natural rubber [13,14]. However, little is known of the FPS genes in the Euphorbiaceus species. In this study, the gene structure, phylogenetic characteristics, and expression patterns of Euphorbiaceae plants FPSs were identified and described. Our results revealed wide conservation of FPSs and diverse expression profiles in Euphorbiaceous plants during growth and development.

2. Results

2.1. Cloning, Identification and Structure Analysis of the Euphorbiaceous Plants FPSs

To identify the potential members of the FPS family in euphorbiaceous plants, we used Arabidopsis FPSs (AtFPS1 and AtFPS2) as queries and obtained all possible FPSs by searching the genome database of the rubber tree (Hevea brasiliensis), cassava (Manihot esculenta), castor bean (Ricinus communis), and Jatropha (Jatropha curcas). Three members in the rubber tree (designated as HbFPS1, HbFPS2, and HbFPS3), three members in the cassava (designated as MeFPS1, MeFPS2, and MeFPS3), two members in the castor bean (designated as RcFPS1, RcFPS2), and two members in the Jatropha (designated as JcFPS1, JcFPS2) were identified on the basis of the BLASTP search. The full-length cDNAs of the ten FPSs were PCR amplified, cloned and sequenced. The deduced proteins of the FPSs ranged from 342 to 352 amino acids (predicted molecular mass = 39.37 to 40.80 kDa) with isoelectricpoints ranging from 4.85 to 6.06 (Table 1). The deduced FPS proteins contained the five conserved regions identified by Chen et al. [15] that are characteristic of prenyltransferases that synthesize isoprenoid diphosphates with E-double bonds (Figure 1). The highly conserved aspartate-rich motif DDXXD was present in domains II and V. Ten FPSs identified from euphorbiaceous plants showed more than 65.2% amino acid identity and the maximum percentage of amino acid sequence identities was found between HbFPS1 and MeFPS1 (95.61%, respectively) (Table 2).
Table 1. Basic information of ten FPSs identified from four euphorbiaceous plants
GeneGenBank Accession No.Gene Size (bp)ORF (bp)Predicted Protein
Size (aa)MW (kDa)pI
HbFPS1Z497864690102934239.415.94
HbFPS2KT3060004171102934239.555.07
HbFPS3KT3060013710105335040.276.06
MeFPS1KT3060024349102934239.485.68
MeFPS2KT3060035666102934239.575.86
MeFPS3KT3060044296105335040.135.18
RcFPS1KT3060055720102934239.375.30
RcFPS2XM_0025227563583105935240.734.85
JcFPS1XM_0122194263977102934239.435.30
JcFPS2XM_0122156893886105335040.805.72
Figure 1. Amino acid sequence alignment of FPSs from four euphorbiaceus species. Identical and conserved amino acid residues are denoted by black and gray backgrounds, respectively. The five conserved domains of prenyltransferases are underlined and numbered. The highly-conserved aspartate-rich motifs (DDXXD) is present in domains II and V.
Ijms 16 22402 g001
Table 2. The percentage of FPS amino acid identity in four euphorbiaceous plants.
HbFPS2HbFPS3MeFPS1MeFPS2MeFPS3RcFPS1RcFPS2JcFPS1JcFPS2EpFPS
HbFPS190.9468.7195.6194.4467.8491.8169.3093.2766.3789.47
HbFPS2 65.2090.6491.8165.2086.8466.0887.4363.4584.50
HbFPS3 68.1369.8887.1468.4284.2967.8484.8667.84
MeFPS1 94.7467.8490.6468.7192.9864.9189.77
MeFPS2 69.3090.9468.7191.8166.9689.47
MeFPS3 66.9681.7166.0884.0066.08
RcFPS1 67.5491.5265.7989.18
RcFPS2 67.2582.5766.67
JcFPS1 66.3790.64
JcFPS2 64.91

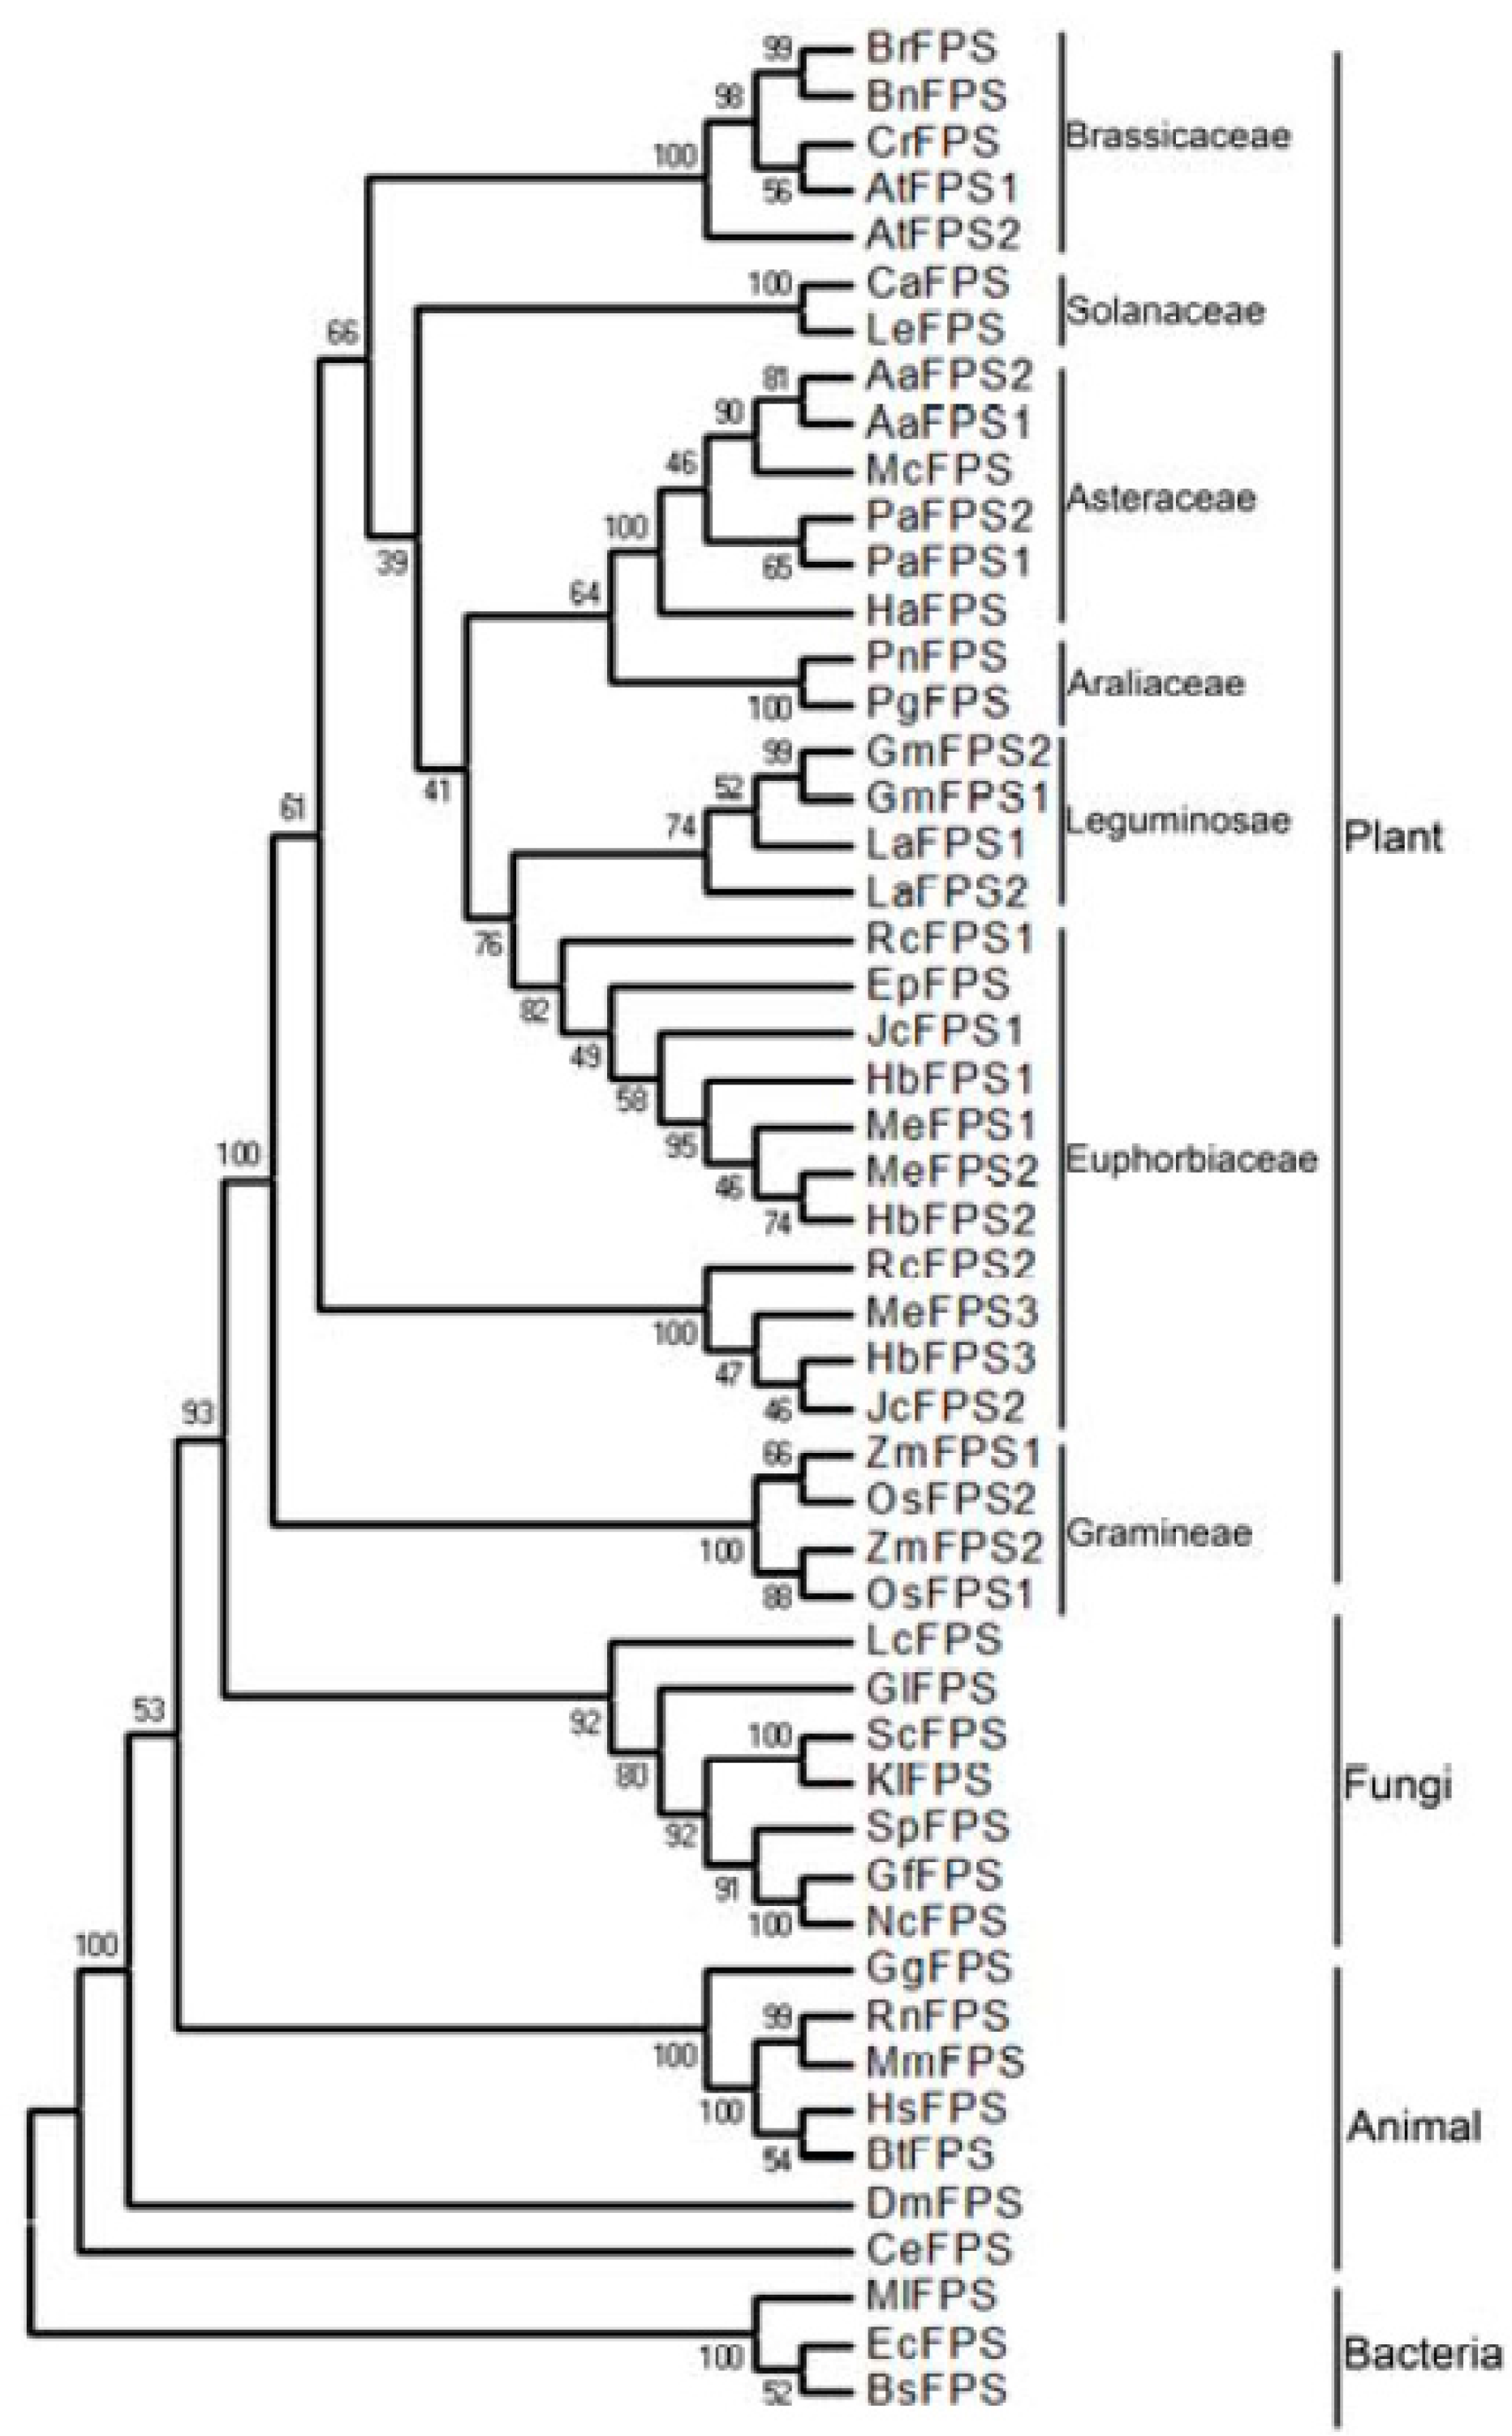
2.2. Phylogenetic Analysis

Phylogenetic and molecular evolutionary analyses were conducted using MEGA version 6 [16] by comparing ten FPS from euphorbiaceous plants with known FPS sequence from a wide range of different organisms including bacteria, fungi, plants, and animals (Figure 2). The results indicated that ten FPSs from euphorbiaceous species appeared at the base of the clade of the plant kingdom, and that FPSs evolved from a common ancestor. Moreover, FPSs from euphorbiaceous plants were clustered into two distinct subgroups. One subgroup contained HbFPS1, HbFPS2, MeFPS1, MeFPS2, RcFPS1, EpFPS, and JcFPS1, which was more closely related to the FPS of legume plants. The other subgroup contained HbFPS3, MeFPS3, RcFPS2, and JcFPS2.

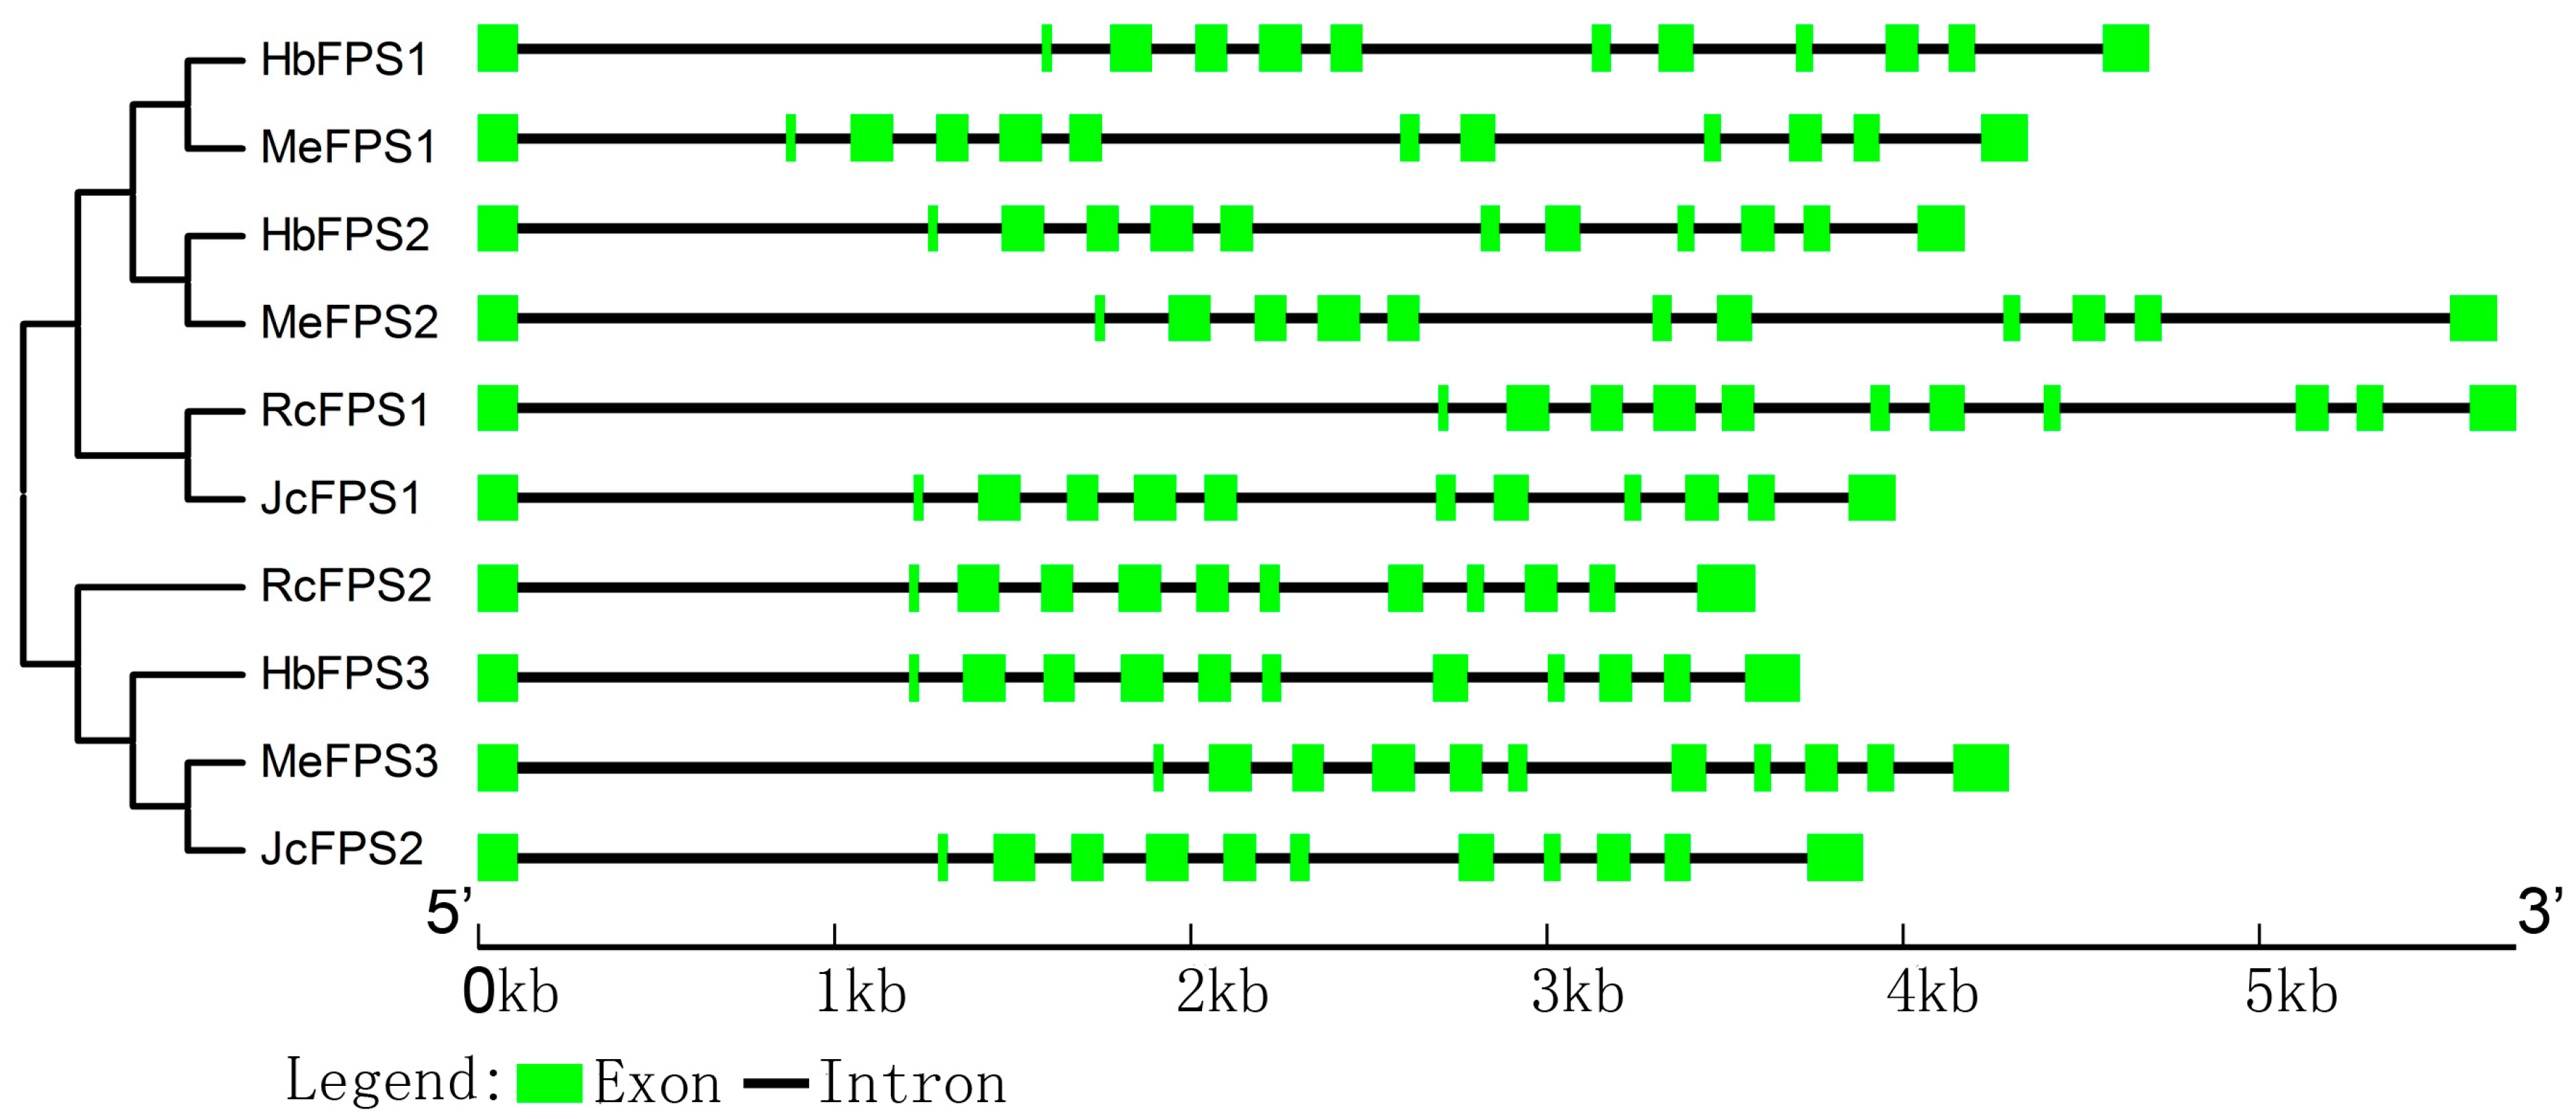
2.3. Intron and Exon Organization of FPSs

We analyzed the intron and exon structure of ten FPSs from the rubber tree, the cassava, the castor bean, and the Jatropha (Figure 3). All these FPSs contained twelve exons and eleven introns. Although introns differ in length, these introns were typically flanked by GT and AG boundaries.

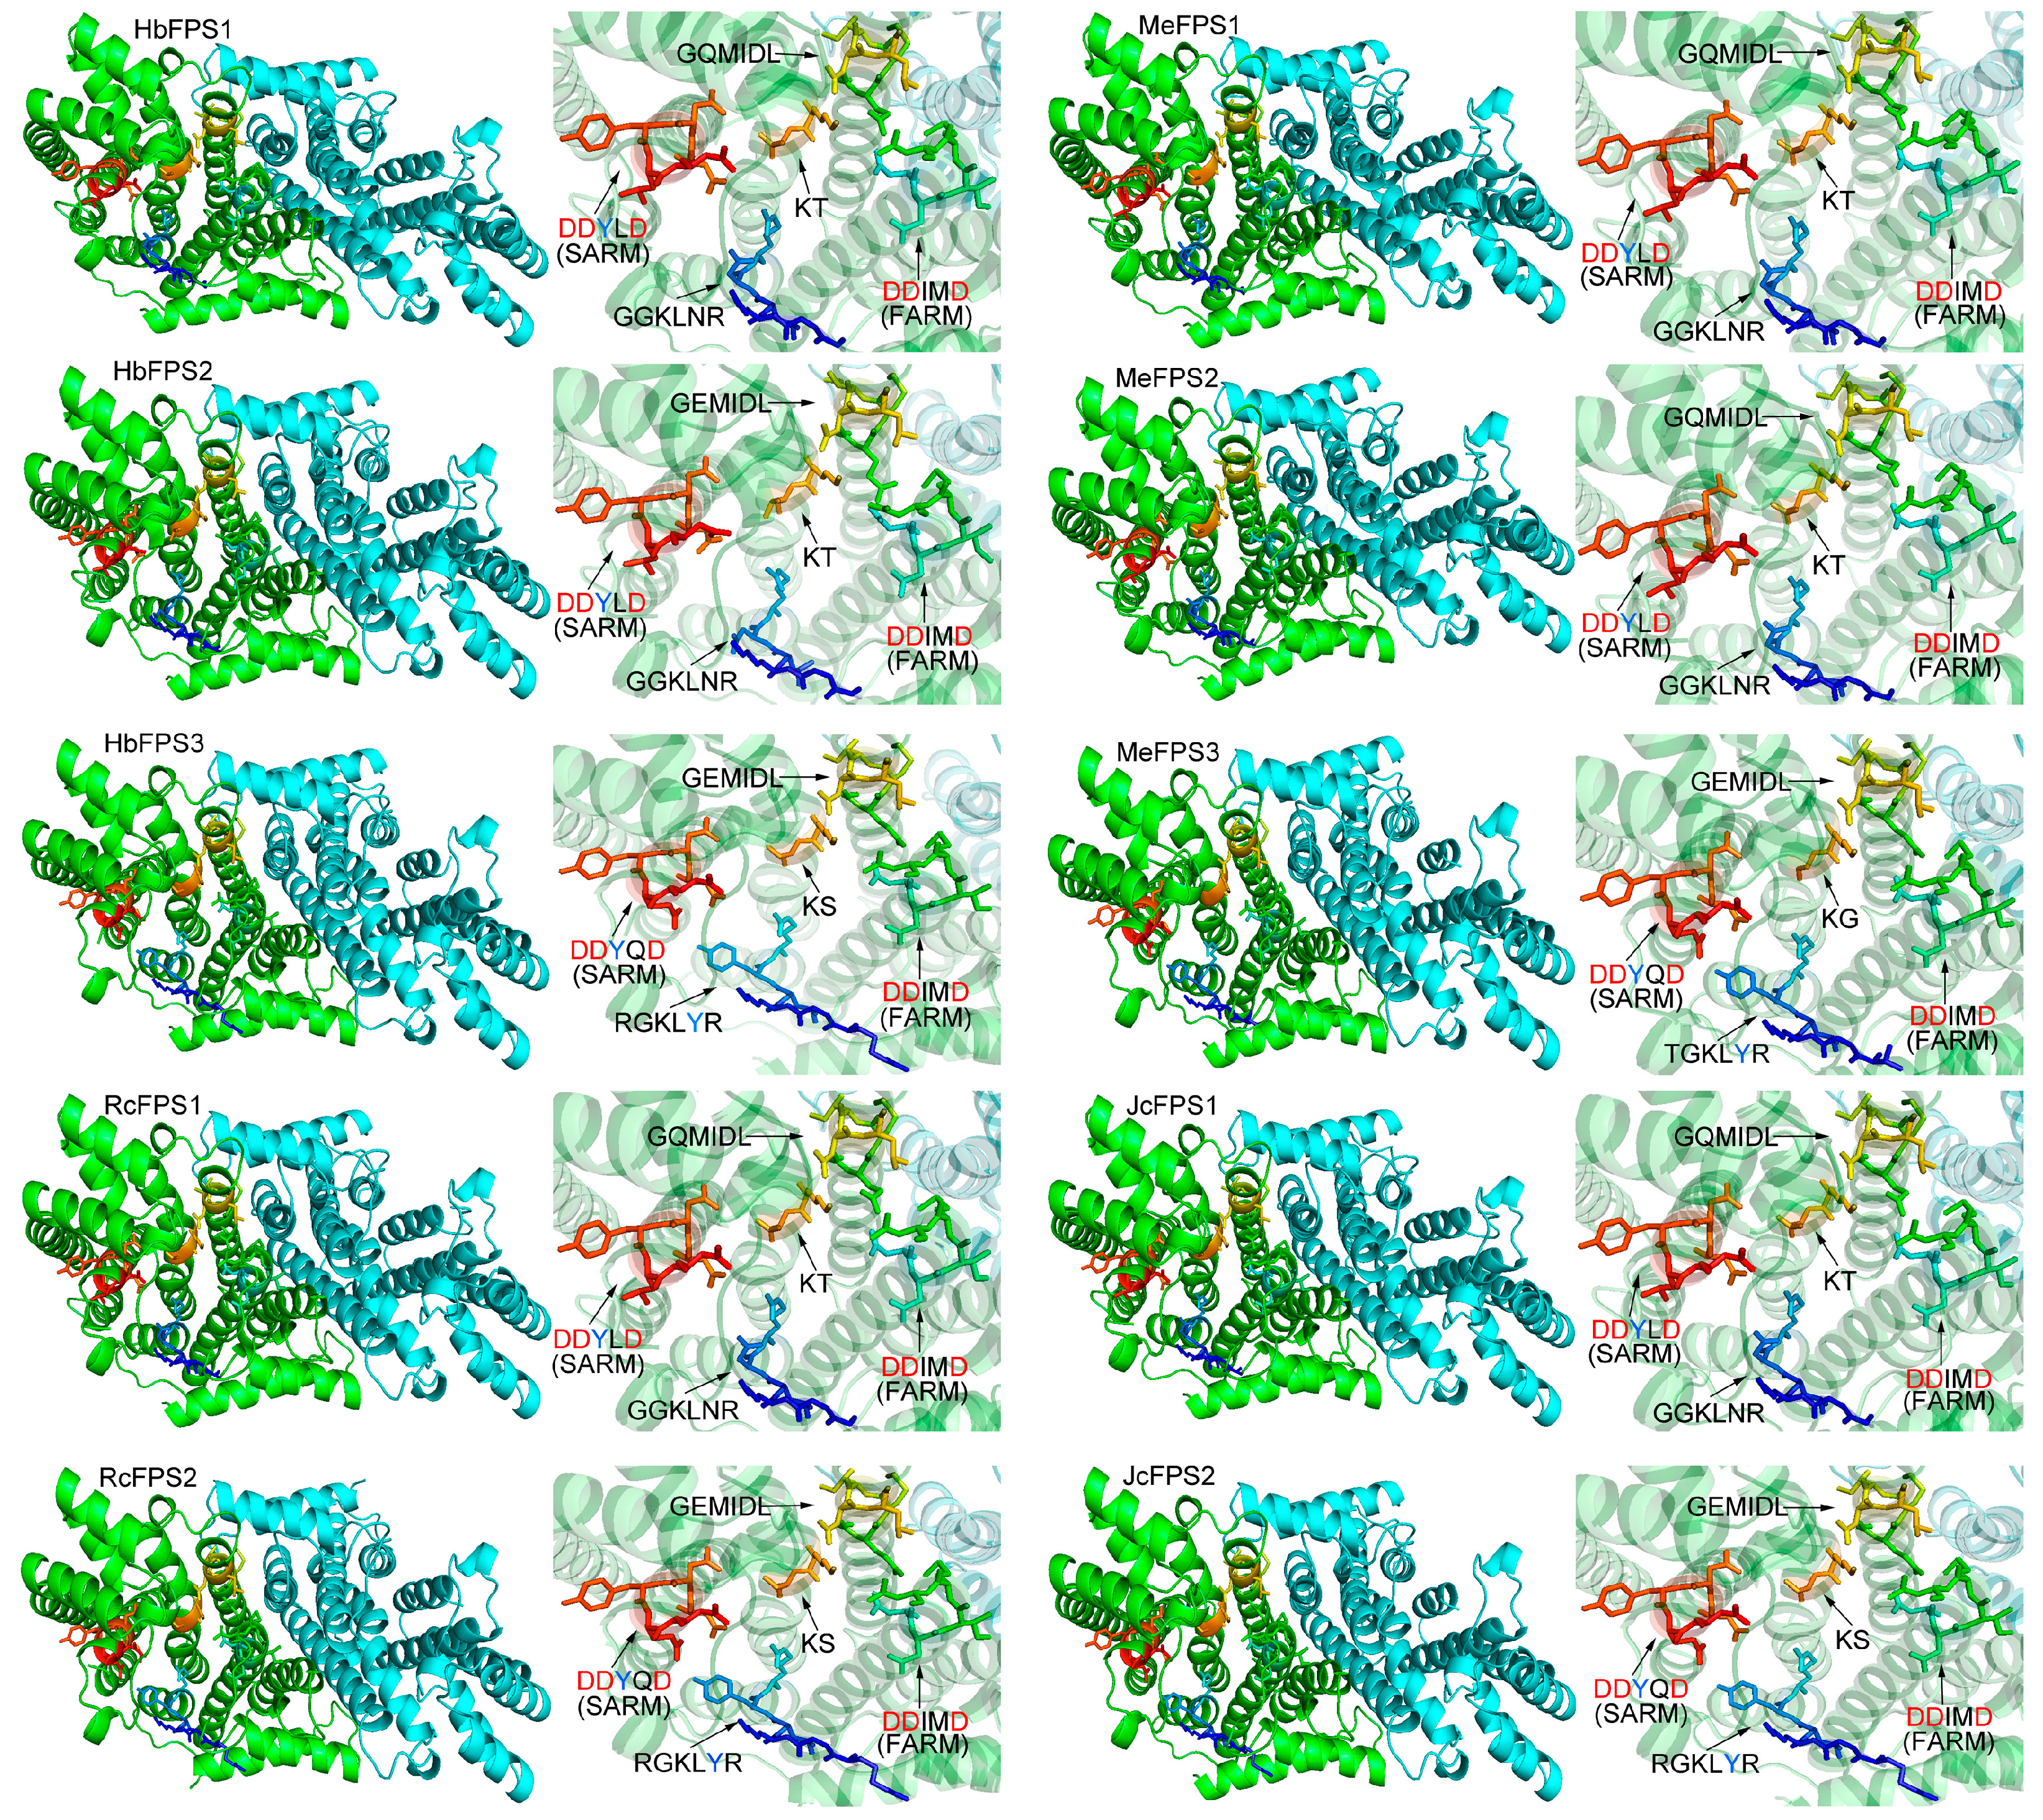
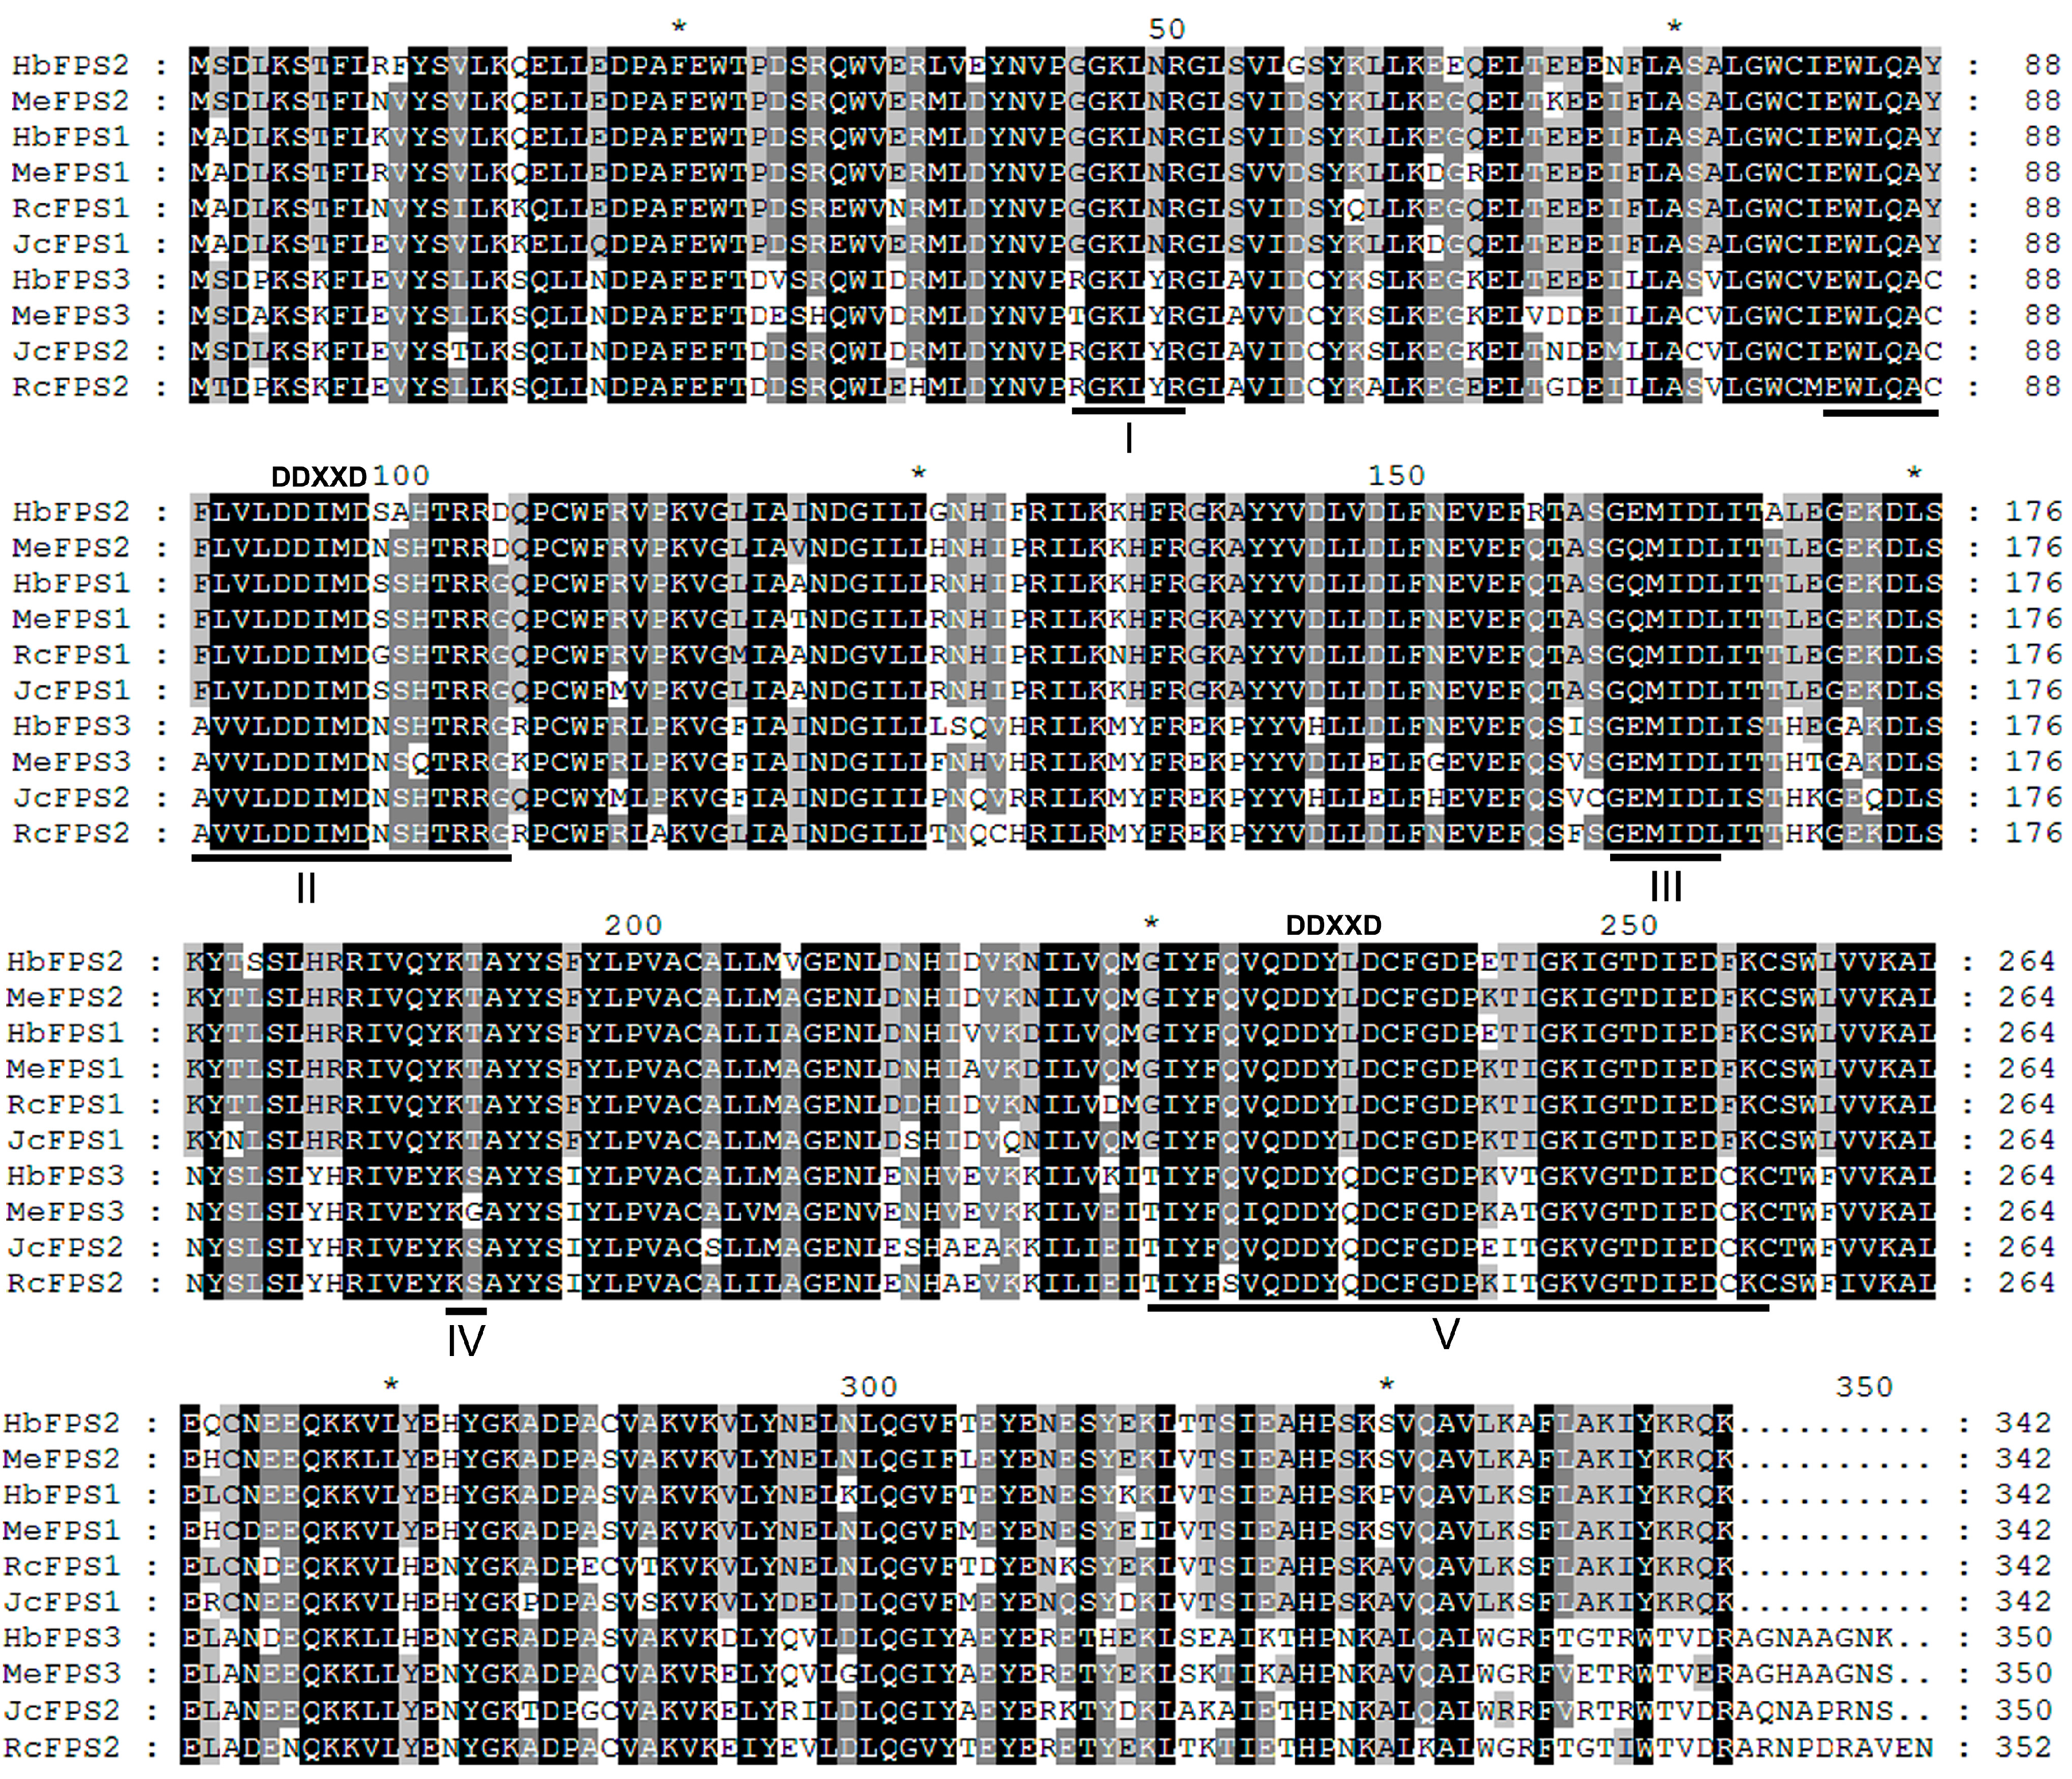
2.4. Structure Prediction and Homology Modeling of the FPSs

In order to obtain a reasonable theoretical structure of the euphorbiaceous plant FPSs, protein homology modeling was performed using a Swiss model server. To predict the 3D structure of the FPSs, a 3D structure at 2.20 Å of Artemisia Spiciformis FPS1 (PDB id: 4kk2.1) was used as a template, which shares 80.59%, 75.29%, 66.07%, 79.71%, 79.41%, 66.57%, 80.00%, 66.27%, 79.71% and 65.36% sequence identity with HbFPS1-3, MeFPS1-3, RcFPS1-2, and JCFPS1-2, respectively. The predicted 3D model of FPSs was validated with the QMEAN server [17] for model quality estimation. The total QMEAN-score (estimated model reliability between 0 and 1) of the predicted 3D models for the ten FPSs are 0.796 (Z-score: −1.34), 0.773 (Z-score: −2.02), 0.778 (Z-score: −1.86), 0.798 (Z-score: −1.28), 0.805 (Z-score: −1.07), 0.758 (Z-score: −2.43), 0.800 (Z-score: −1.22), 0.772 (Z-score: −2.04), 0.797 (Z-score: −1.30) and 0.771 (Z-score: −2.07), respectively. It indicates that all the sequences of FPSs match the homologous templates well on the server, so the models are reliable. The overall predicted structures of FPSs with substrate are similar to the template 4kk2.1. The five conserved motifs are shown in sticks. Motif-II (First Asp-rich motif, FARM), Motif-III, motif-IV and Motif-V (Second Asp-rich motif, SARM) within the FPSs have the similar orientation in the predicted 3D structure (Figure 4). The Asn residue in motif-I of HbFPS1-2, MeFPS1-2, RcFPS1, and JcFPS1 have the similar predicted 3D structure; also, the similar predicted 3D structure is found in the Tyr residue in motif-I of HbFPS3, MeFPS3, RcFPS2, and JcFPS2. However, the Tyr, instead of ASn, residue forms a different predicted 3D structure, where Asn residue forms an open structure, the Tyr residue forms a cyclic structure.
Figure 2. Phylogenetic tree of FPSs from different organisms constructed by the neighbor-joining method on MEGA. The accession numbers of FPS known proteins in GenBank are listed as follows: BrFPS, XP_009128999; BnFPS, CDY68039, CrFPS, XP_006281527; AtFPS1, AAB49290; AtFPS2, AAB07248; Ca, CAA59170; LeFPS, AAC73051; AaFPS1, AAC49452; AaFPS2, AAD17204; McFPS, ABS11699; PaFPS1, CAA57892; PaFPS2, CAA57893; HaFPS, AAC78557;PnFPS, AAY53905; PgFPS, AAY87903;GmFPS1, ACU21393; GmFPS2, XP_003534984;LaFPS1,AAA86687; LaFPS2, AAA87729; EpFPS, ACN63187; ZmFPS1, AAQ14871; ZmFPS2, ACG34051; OsFPS1, BAA19856; OsFPS2,AAU43998; LcFPS, BAD15361; GlFPS,ACB37020; ScFPS, P08524; KlFPS,CAA53614; OSpFPS,14230;GfFPS, Q92235;NcFPS, Q92250; GgFPS, P08836; RnFPS, P05369; MmFPS, AAl09445; HsFPS, NP_001995; BtFPS, AAL58886; DmFPS, CAA08919; CeFPS, CAB03221; MlFPS, BAA25265; EcFPS, BAA00599; BsFPS, Q08291.
Ijms 16 22402 g002
Figure 3. Neighbor-joining phylogenetic tree and intron-exon structures. The phylogenetic tree (part of the left side) was constructed from FPSs using the MEGA 6.0 program with the NJ method. Intron and exon structural organization of FPS genes are described on the right side. Introns and exons are represented by black lines and colored boxes, respectively.
Ijms 16 22402 g003

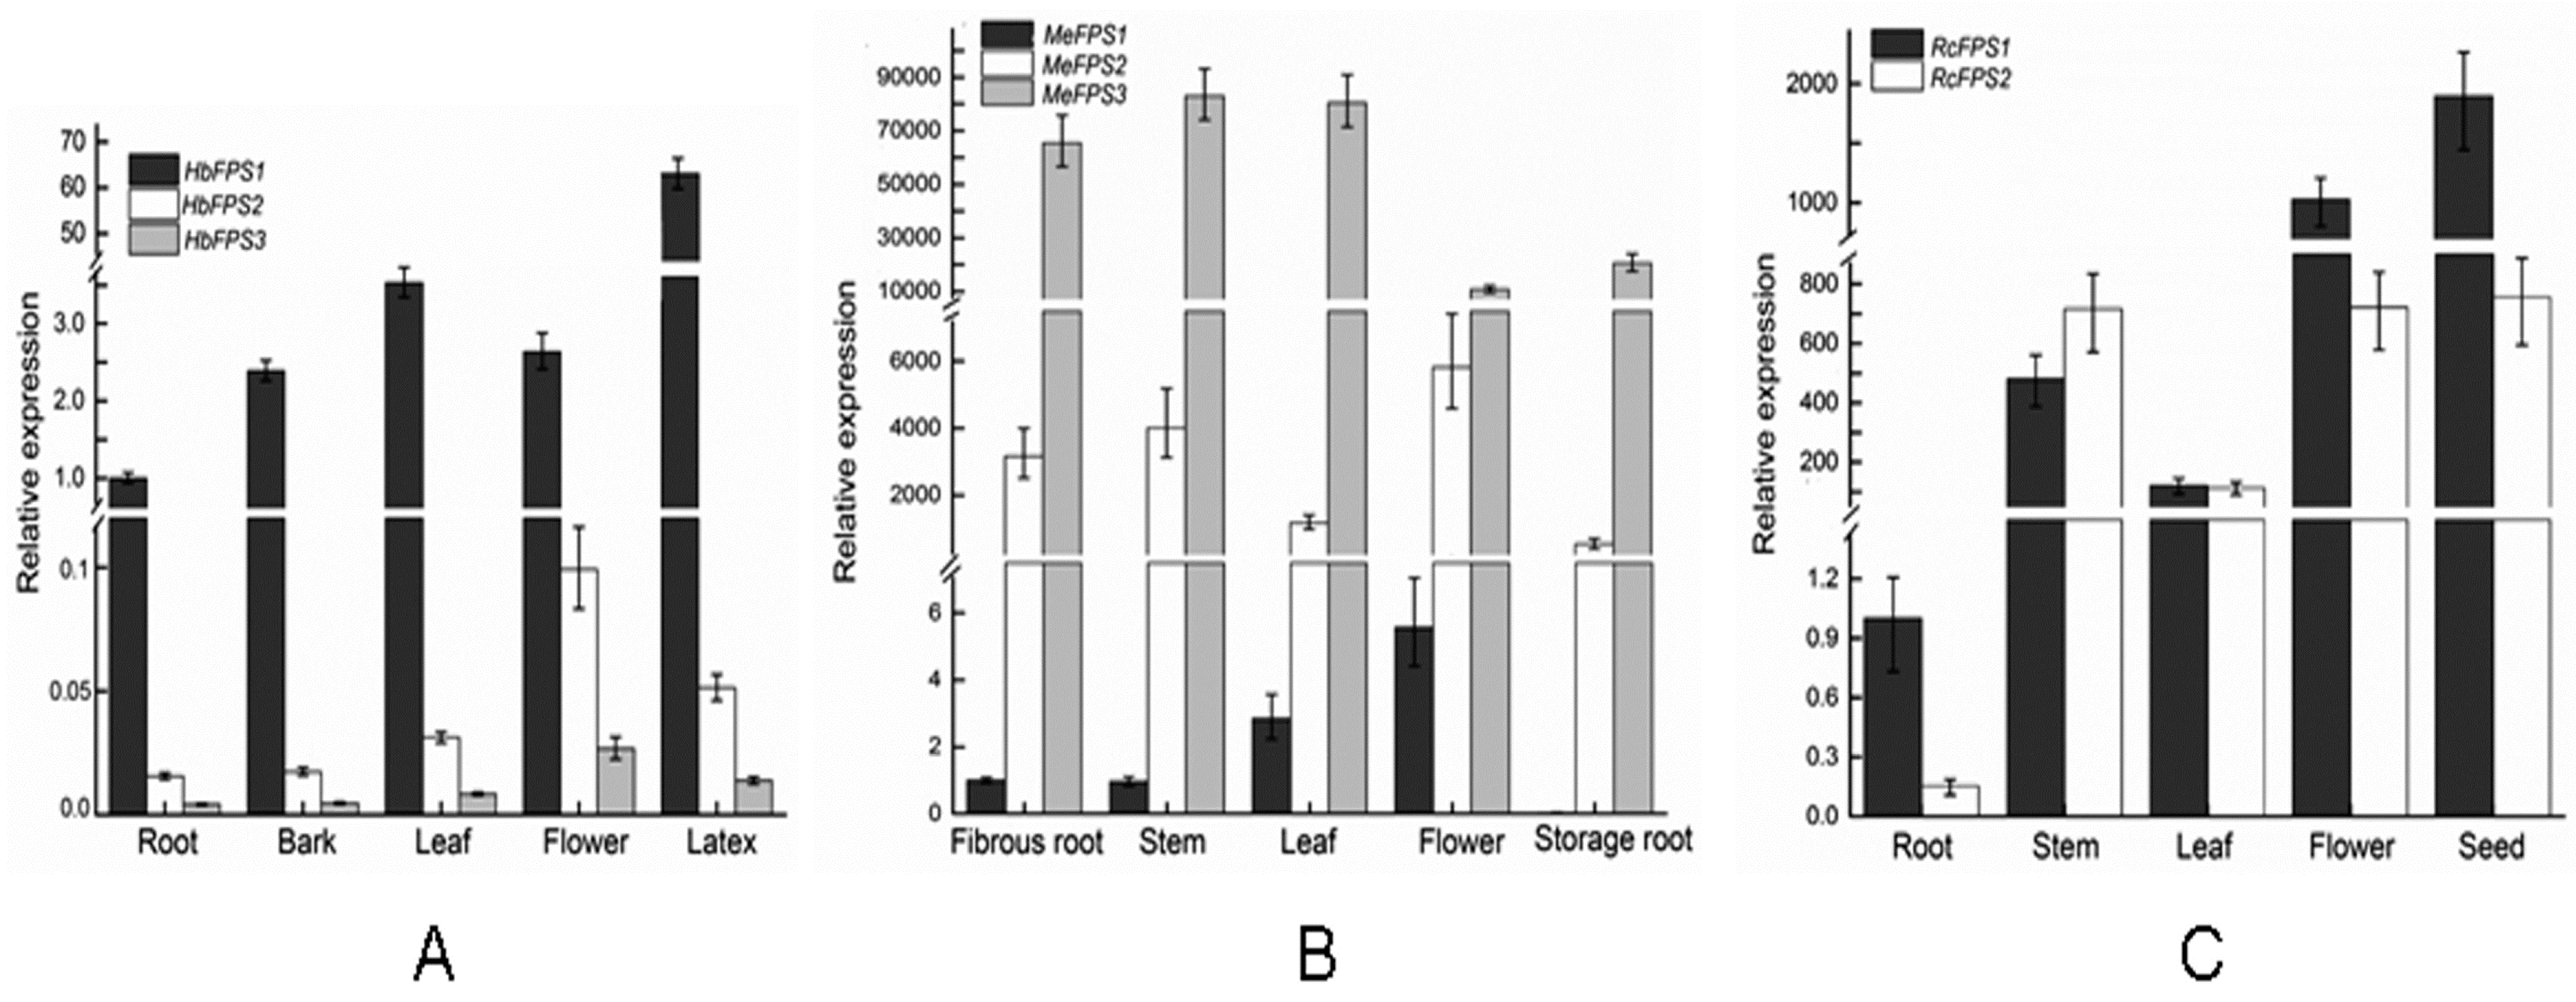
2.5. Expression Analysis of FPSs in Euphorbiaceous Plants Tissues

In order to characterize the expression profile of FPS in euphorbiaceous plants, we analyzed the tissue-specific expression pattern of FPSs in three euphorbiaceous species. In the rubber tree, HbFPS1 was predominant in the latex, revealed more than a 20-fold difference in the expression levels of different organs. HbFPS2 and HbFPS3 had similar expression profiles, HbFPS2 and HbFPS3 were expressed in all the tested tissues at different levels, with the highest transcription occurring in flowers, followed by latex, barks, leaves, and root. HbFPS1 showed more than 30-fold higher levels of transcript abundance than HbFPS2 and HbFPS3 in different organs (Figure 5A). We also compared the transcripts of FPSs in each tissue in the cassava and found that the expression levels of MeFPS1, MeFPS2, and MeFPS3 had similar expression profiles, but MeFPS3 revealed more than a 100-fold difference in the expression levels than MeFPS1 and MeFPS2 in different organs (Figure 5B). In the castor bean, RcFPS1 and RcFPS2 were expressed in all the tested tissues at different levels, with the highest transcription occurring in seeds, followed by flowers, stems, leaves, and root (Figure 5C)
Figure 4. Representation of the predicted 3D structure model and the active sites of the FPSs from euphorbiaceus species. The graphics at the right side are the close-up views of the active sites. Motif-II (First Asp-rich motif, FARM), Motif-III, motif-IV and Motif-V (Second Asp-rich motif, SARM) are shown in sticks.
Ijms 16 22402 g004
Figure 5. The expression of the FPSs from euphorbiaceus species. The amount of FPS mRNA was normalized by ACT mRNA in the rubber tree and in the cassava, 18S RNA gene in the castor bean. Each value is the mean ± SE of three biological replicates (n = 3). (A) Rubber tree; (B) Cassava; and (C) Castor bean.
Ijms 16 22402 g005

3. Discussion

Plants contain small farnesyl diphosphate synthase isozyme families. cDNAs encoding FPS have been cloned and characterized from various plant species [18,19,20,21,22,23,24,25,26]. Arabidopsis contains two genes, FPS1 and FPS2, encoding three FPS isozymes: FPS1L, FPS1S and FPS2. The FPS1 encodes FPS1S and FPS1L, which differ only by an N-terminal extension of 41 amino acid residues that targets FPS1L into mitochondria [19,20], whereas the FPS2 encodes FPS2 that shares 90.6% amino acid identity with FPS1 isozymes [21]. Three FPS isoforms have also been discovered in both maize and Artemisia tridentate [22,23]. In humans, only a single FPS encodes for FPS. Due to the alternative splicing in the first exon of human FPS, multiple splice variants are generated which encode two FPS isoforms: a shorter cytoplasmic/peroxisomal form, and a longer isoform which is a mitochondrial targeting peptide [24]. Although one FPS (HbFPS1) from the rubber tree and one FPS (EpFPS) from the Euphorbia had been characterized [25,26], knowledge of the FPS genes of euphorbiaceous plants is limited. In this study, ten FPSs were identified in Euphorbiaceous species, including three members in the rubber tree, three members in the cassava, two members in the castor bean, and two members in the Jatropha. Sequence and phylogenetic analysis results showed wide conservation of FPSs in euphorbiaceous plants.
The members of the FPS family exhibit tissue expression patterns that vary among several plant species. In Arabidopsis, FPSs are expressed in all organs throughout plant development, albeit at greatly different levels. FPS1 is widely expressed in all tissues throughout plant development, whereas expression of FPS2 is mainly concentrated in floral organs, seeds, and the early stages of seedling development [27,28]. In Ginkgo biloba, GbFPS had high transcription in roots and leaves, and low in stems [29], reflecting the fact that the biosynthesis of ginkgolides and bilobalide occurs in roots and leaves [30]. In Euphorbia pekinensis, the highest EpFPS expression level was detected in roots, in which terpenoids are synthesized [26]. In the rubber tree, HbFPS1 is expressed predominantly in the laticifers and is likely to encode the enzyme involved in natural rubber biosynthesis [25]. The expression of HbFPS2 and HbFPS3 is not cell-type specific. HbFPS2 and HbFPS3 are possibly involved in isoprenoid biosynthesis of a housekeeping nature. Our results revealed that all of the eight FPS genes were differentially expressed in all tissues tested either in their transcript abundance or expression patterns under normal growth conditions.
Our results showed that a substantial number of FPSs which were previously identified and characterized in well studied model plants are conserved in important Euphorbiaceous plants. Despite broad conservation across the euphorbiaceous species, these FPSs also exhibited diverse expression patterns.

4. Experimental Section

4.1. Plant Materials and Treatments

Rubber tree (Hevea brasiliensis cultivar RRIM 600), castor bean (Ricinus communis cultivar A202), and cassava (Manihot esculenta cultivar SC8) obtained from Institute of Tropical Bioscience and Biotechnology, were planted in the experimental farm of the Chinese Academy of Tropical Agricultural Sciences in Hainan Island in China (20°N, 110°E). Fresh leaves, flowers, roots, fruits, and barks were immediately ground to form powder in liquid nitrogen and stored at −70 °C or immediately used to extract nucleic acid. The latex of rubber tree was allowed to drop directly into liquid nitrogen in an ice kettle. The frozen latex powder was then stored at −70 °C or used immediately to extract RNA.

4.2. Cloning and Identification of FPS Genes

Total RNA was extracted from the rubber tree latex [31] and from other tissues [32]. cDNA was synthesized by reversely transcribing 1 μg total RNA using a PrimeScript™ RT-PCR kit (Takara, Dalian, China) according to the manufacturer’s instructions. To identify the FPS homologs in H. brasiliensis, we used Arabidopsis FPS genes (AtFPS1 and AtFPF2) as queries and BLAST analysis of genome database of rubber tree (DDBJ/EMBL/GenBank under the accession: GenBank: AJJZ01000000), cassava (http://www.phytozome.net/cassava) [33], castor bean (http://castorbean.jcvi.org) [4], and jatropha (http://www.kazusa.or.jp/jatropha/) [34]. The contigs of putative FPS genes were then assembled. The cDNA of putative FPSs were amplified by primers based on the assembled sequences (Table 3). The primers were designed using the Primer Generator (http://www.med.jhu.edu/medcenter/primer/primer.cgi). The PCR products were cloned in the pMD19-T cloning vector (TaKaRa, Dalian, China) and sequenced. The sequence was performed using the ABI BigDye® Terminator Sequencing Kits in ABI3700 DNA sequencer. Afterward, their sequences were analyzed in GenBank by using the BLAST program. The isoelectric point (pI) of FPS was predicted using the compute pI/MW software (http://www.expasy.ch/tools/pi_tool.html). The percentage of FPS amino acid identity in four euphorbiaceous plants were done with Clustal W2 (http://www.ebi.ac.uk /Tools/msa/clustalw2/). The gene structure schematic of FPSs identified from four euphorbiaceous plants was drawn using the web server GSDS (http://gsds.cbi.pku.edu.cn/). Multiple amino acid sequence alignment and phylogenetic tree analysis were performed using the MEGA 6.0 software.
Table 3. Gene specific primers of FPSs used for RT-PCR amplification.
GeneForward (5'→3')Reverse (5'→3')
HbFPS1TCCATGGCGGATCTGAAGTCAACTCATCCAGTCTTTGTCCATGTATCTG
HbFPS2AATCCATGTCTGATCTGAAGTCGAATCCAATCTTTGTCCATGTTCTTG
HbFPS3ATGAGCGATCCAAAATCCAAGTTCTTGGATGTTAATCCTCAGCTCATTTTAGAGT
MeFPS1CTCTGTTTTCAGTTTTTCTCCCCAATCTCAATCTTTATCCATGTATCTGGATA
MeFPS2CACTCTTCATTCACTCG AATCTCCGCATATTAAGTGTTTACTTAAATAATAA
MeFPS3GATATGAGCCAGTAAAGTTCCACAGTTTTCTGAACCATTAGAAGAACAAGAAC
RcFPS1AGCTTCATTCATTCTTTTCTCTCCGATGATAAAAACCATTCATTCAATT
RcFPS2GATTCAGAATTGTTCTTCAAAAGCGCGAATCACAAAGTTGACAAGGAACCC
JcFPS1TCAATCTCTCCTCACTACTGCCCTCCCGCATTATTCGGCATCATCCAATCAT
JcFPS2GCCCTTTCATATCGAACGGTAATAACATAAGTTTCATTTCCCATTCTAATGTTC

4.3. Homology Modeling and Structure Prediction

Protein sequences of ten FPS were submitted to the Swiss-Model server (http://swissmodel.expasy.org) [35] to perform sequence analysis, and Artemisia Spiciformis farnesyl diphosphate synthase 1 (PDB id: 4kk2.1) was applied as a template. The catalytically- and enzymatically-important residues of FPSs were displayed using the Pymol software (Delino Scientific, San Carlos, CA, USA).

4.4. Expression Analysis

Quantitative real-time RT-PCR (qPCR) was conducted using the primers presented in Table 4. The primers were designed using the Beacon Designer (http://www.premierbiosoft.com). qPCR was performed using the fluorescent dye SYBR-Green (Takara, Dalian, China) and the BIO-RAD CFX96 qPCR system (Bio-Rad, Hercules, CA, USA). The reactions were carried out as follows: 30 s at 95 °C for denaturation, 5 s at 94 °C, 20 s at 60 °C, and 20 s at 72 °C for amplification. Three biological replicates were carried out and triplicate quantitative assays for each replicate were performed. A rubber tree actin gene [36], a cassava actin gene [37], and a castor bean 18S RNA gene [38] were amplified as an internal control. The relative abundance of transcripts was calculated according to the Bio-Rad CFX Manager (Version1.5.534) of BIO-RAD CFX96.
Table 4. Primers for FPSs used for qRT-PCR amplification.
GeneForward (5'→3')Reverse (5'→3')
HbFPS1TGAAAGCTATAAGAAACTAGTAACCTCTTCATCCAGTCTTTGTCCATGTATC
HbBFPS2GAACGAAAGCTATGAGAAACTAACCTCATCCAATCTTTGTCCATGTTCT
HbFPS3GGAACCAGATGGACAGTTGATAGACTAGGCAAATGCTGGTAATAGG
HbACTCACCACCAGAGAGAAAGTACAGGATGGACCAGACTCATCGTATTC
MeFPS1GAAAGCTATGAGATATTAGTGACTATCATCATCATTCAATCTTTATCCA
MeFPS2AAAGCTATGAGAAACTAGTAACCTCCCTGTTTTTATTTATTTCTGTCT
MeFPS3AACCAGATGGACAGTTGAGAGAGAAGAACAAGAACCAAAGCAGATG
MeACTCAGTGGTCGACAACTGGTATATCCTCCAATCCAGACACTGT
RcFPS1AGTGTTGAAGTCTTTCCTGGCCTAGCATTATTCGCACGATCC
RcFPS2GCTTTGTGGGGAAGATTTACAGACAAAGTTGACAAGGAACCCAA
Rc18S RNATTGGTGGAGCGATTTGTCCCCAGAACATCTAAGGGCAT

5. Conclusions

In conclusion, ten FPSs were cloned from four euphorbiaceus species. All ten FPSs exhibited similar exon/intron structure. All FPSs contains contained the five conserved regions. All of the FPS genes were differentially expressed in all tissues tested either in their transcript abundance or expression patterns under normal growth conditions. The expression profiles reveal spatial and temporal variations in the expression of FPS genes of different tissues from three Euphorbiaceous plants.

Acknowledgments

This research was supported by National Natural Science Foundation of China (No.31471169), the National Nonprofit Institute Research Grant of ITBB (ITBB ITBB2015ZD04) and Major Technology Project of Hainan (ZDZX2013023-1).

Author Contributions

Shi-Qing Peng and Dong Guo designed the experiments and drafted the manuscript; Dong Guo and Hui-Liang Li carried out gene isolation, sequence analysis, and gene expression analysis. All authors read and approved the manuscript.

Conflicts of Interest

The authors declare no conflict of interest.

References

  1. Zeng, C.; Wang, W.; Zheng, Y.; Chen, X.; Bo, W.; Song, S.; Zhang, W.; Peng, M. Conservation and divergence of microRNAs and their functions in Euphorbiaceous plants. Nucleic Acids Res. 2009, 38, 3981–3995. [Google Scholar] [CrossRef] [PubMed]
  2. Archer, B.L.; Audley, B.G. New aspects of rubber biosynthesis. Bot. J. Linn. Soc. 1987, 94, 181–196. [Google Scholar] [CrossRef]
  3. Schmitz, P.M.; Kavallari, A. Crop plants versus energy plants—On the international food crisis. Bioorg. Med. Chem. 2009, 17, 4020–4021. [Google Scholar] [CrossRef] [PubMed]
  4. Chan, A.P.; Crabtree, J.; Zhao, Q.; Lorenzi, H.; Orvis, J.; Puiu, D.; Melake-Berhan, A.; Jones, K.M.; Redman, J.; Chen, G.; et al. Draft genome sequence of the ricin-producing oilseed castor bean. Nat. Biotechnol. 2010, 28, 951–956. [Google Scholar] [CrossRef] [PubMed]
  5. Banerjee, A.; Wu, Y.; Banerjee, R.; Li, Y.; Yan, H.; Sharkey, T.D. Feedback inhibition of deoxy-d-xylulose-5-phosphate synthase regulates the methylerythritol 4-phosphate pathway. J. Biol. Chem. 2013, 288, 16926–16936. [Google Scholar] [CrossRef] [PubMed]
  6. Rasulov, B.; Talts, E.; Kännaste, A.; Niinemets, Ü. Bisphosphonate inhibitors reveal a large elasticity of plastidic isoprenoid synthesis pathway inisoprene-emitting hybrid aspen. Plant. Physiol. 2015, 168, 532–548. [Google Scholar] [CrossRef] [PubMed]
  7. Rodríguez-Concepción, M. Early steps in isoprenoid biosynthesis: Multilevel regulation of the supply of common precursors in plant cells. Phytochem. Rev. 2006, 5, 1–15. [Google Scholar] [CrossRef]
  8. Lombard, J.; Moreira, D. Origins and early evolution of the mevalonate pathway of isoprenoid biosynthesis in the three domains of life. Mol. Biol. Evol. 2011, 28, 87–99. [Google Scholar] [CrossRef] [PubMed]
  9. Hunter, W.N. The non-mevalonate pathway of isoprenoid precursor biosynthesis. J. Biol. Chem. 2007, 282, 21573–21577. [Google Scholar] [CrossRef] [PubMed]
  10. Eisenreich, W.; Bacher, A.; Arigoni, D.; Rohdich, F. Biosynthesis of isoprenoids via the non-mevalonate pathway. Cell. Mol. Life Sci. 2004, 61, 1401–1426. [Google Scholar] [CrossRef] [PubMed]
  11. Bick, J.A.; Lange, B.M. Metabolic cross talk between cytosolic and plastidial pathways of isoprenoid biosynthesis: Unidirectional transport of intermediates across the chloroplast envelope membrane. Arch. Biochem. Biophys. 2003, 415, 146–154. [Google Scholar] [CrossRef]
  12. Chow, K.S.; Wan, K.L.; Mat, I.M.N.; Bahari, A.; Tan, S.H.; Harikrishna, K.; Yeang, H.Y. Insights into rubber biosynthesis from transcriptome analysis of Hevea brasiliensis latex. J. Exp. Bot. 2007, 58, 2429–2440. [Google Scholar] [CrossRef] [PubMed]
  13. Dhar, M.K.; Koul, A.; Kaul, S. Farnesyl pyrophosphate synthase: A key enzyme in isoprenoid biosynthetic pathway and potential molecular target for drug development. New Biotechnol. 2013, 30, 114–123. [Google Scholar] [CrossRef] [PubMed]
  14. Sando, T.; Takaoka, C.; Mukai, Y.; Yamashita, A.; Hattori, M.; Ogasawara, N.; Fukusaki, E.; Kobayashi, A. Cloning and characterization of mevalonate pathway genes in a natural rubber producing plant, Hevea Brasiliensis. Biosci. Biotechnol. Biochem. 2008, 72, 2049–2060. [Google Scholar] [CrossRef] [PubMed]
  15. Chen, A.; Kroon, P.A.; Poulter, C.D. Isoprenyl diphosphate synthases: Protein sequence comparisons, a phylogenetic tree, and predictions of secondary structure. Protein Sci. 1994, 3, 600–607. [Google Scholar] [CrossRef] [PubMed]
  16. Tamura, K.; Stecher, G.; Peterson, D.; Filipski, A.; Kumar, S. MEGA6: Molecular evolutionary genetics analysis version 6.0. Mol. Biol. Evol. 2013, 30, 272–279. [Google Scholar] [CrossRef] [PubMed]
  17. Benkert, P.; Künzli, M.; Schwede, T. QMEAN server for protein model quality estimation. Nucleic Acids Res. 2009, 37, 510–514. [Google Scholar] [CrossRef] [PubMed]
  18. Zhao, Y.J.; Chen, X.; Zhang, M.; Su, P.; Liu, Y.J.; Tong, Y.R.; Wang, X.J.; Huang, L.Q.; Gao, W. Molecular cloning and characterisation of farnesyl pyrophosphate synthase from Tripterygium wilfordii. PLoS ONE 2015, 10, 125415. [Google Scholar] [CrossRef] [PubMed]
  19. Keim, V.; Manzano, D.; Fernández, F.J.; Closa, M.; Andrade, P.; Caudepón, D.; Bortolotti, C.; Vega, M.C.; Arró, M.; Ferrer, A. Characterization of Arabidopsis FPS isozymes and FPS gene expression analysis provide insight into the biosynthesis of isoprenoid precursors in seeds. PLoS ONE 2012, 7, 49109. [Google Scholar] [CrossRef] [PubMed] [Green Version]
  20. Cunillera, N.; Arró, M.; Delourme, D.; Karst, F.; Boronat, A.; Ferrer, A. Arabidopsis thaliana contains two differentially expressed farnesyl-diphosphate synthase genes. J. Biol. Chem. 1996, 271, 7774–7780. [Google Scholar] [PubMed]
  21. Cunillera, N.; Boronat, A.; Ferrer, A. The Arabidopsis thaliana FPS1 gene generates a novel mRNA that encodes a mitochondrial farnesyl-diphosphatesynthase isoform. J. Biol. Chem. 1997, 272, 15381–15388. [Google Scholar] [CrossRef] [PubMed]
  22. Cervantes-Cervantes, M.; Gallagher, C.E.; Zhu, C.; Wurtzel, E.T. Maize cDNAs expressed in endosperm encode functional farnesyl diphosphate synthase with geranylgeranyl diphosphate synthase activity. Plant. Physiol. 2006, 141, 220–231. [Google Scholar] [CrossRef] [PubMed]
  23. Hemmerlin, A.; Rivera, S.B.; Erickson, H.K.; Poulter, C.D. Enzymes encoded by the farnesyl diphosphate synthase gene family in the Big Sagebrush Artemisia tridentata ssp. spiciformis. J. Biol. Chem. 2003, 278, 32132–32140. [Google Scholar] [CrossRef] [PubMed]
  24. Romanelli, M.G.; Lorenzi, P.; Sangalli, A.; Diani, E.; Mottes, M. Characterization and functional analysis of cis-acting elements of the human farnesyl diphosphate synthetase (FDPS) gene 5' flanking region. Genomics 2009, 93, 227–234. [Google Scholar] [CrossRef] [PubMed]
  25. Adiwilaga, K.; Kush, A. Cloning and characterization of cDNA encoding farnesyl diphosphate synthase from rubber tree (Hevea brasiliensis). Plant Mol. Biol. 1996, 30, 935–946. [Google Scholar] [CrossRef] [PubMed]
  26. Cao, X.; Yin, T.; Miao, Q.; Li, C.; Ju, X.; Sun, Y.; Jiang, J. Molecular characterization and expression analysis of a gene encoding for farnesyl diphosphate synthase from Euphorbia pekinensis Rupr. Mol. Biol. Rep. 2012, 39, 1487–1492. [Google Scholar] [CrossRef] [PubMed]
  27. Cunillera, N.; Boronat, A.; Ferrer, A. Spatial and temporal patterns of GUS expression directed by 59 regions of the Arabidopsis thaliana farnesyl diphosphate synthase genes FPS1 and FPS2. Plant Mol. Biol. 2000, 44, 745–758. [Google Scholar] [CrossRef]
  28. Closa, M.; Vranová, E.; Bortolotti, C.; Bigler, L.; Arró, M.; Ferrer, A.; Gruissem, W. The Arabidopsis thaliana FPP synthase isozymes have overlapping and specific functions in isoprenoid biosynthesis, and complete loss of FPP synthase activity causes early developmental arrest. Plant J. 2010, 63, 512–525. [Google Scholar] [CrossRef] [PubMed]
  29. Wang, P.; Liao, Z.; Guo, L.; Li, W.; Chen, M.; Pi, Y.; Gong, Y.; Sun, X.; Tang, K. Cloning and functional analysis of a cDNA encoding Ginkgo biloba farnesyl diphosphate yynthase. Mol. Cells 2004, 18, 150–156. [Google Scholar] [PubMed]
  30. Carrier, D.J.; van Beek, T.A.; van der Heijden, R.; Verpoort, R. Distribution of ginkgolides and terpenoid biosynthetic activity in G. biloba. Phytochemistry 1998, 48, 89–92. [Google Scholar] [CrossRef]
  31. Tang, C.; Qi, J.; Li, H.; Zhang, C.; Wang, Y. A convenient and efficient protocol for isolating high quality RNA from latex of Hevea brasiliensis (para rubber tree). J. Biochem. Biophys. Methods 2007, 70, 749–754. [Google Scholar] [CrossRef] [PubMed]
  32. Deng, L.H.; Luo, M.W.; Zhang, C.F.; Zeng, H.C. Extraction of high-quality RNA from rubber tree leaves. Biosci. Biotechnol. Biochem. 2012, 76, 1394–1396. [Google Scholar] [CrossRef] [PubMed]
  33. Phytozome. Available online: http://www.phytozome.net/cassava (accessed on 15 April 2011).
  34. Jatropha Genome Database. Available online: http://www.kazusa.or.jp/jatropha (accessed on 1 February 2011).
  35. SWISS-MODEL. Available online: http://swissmodel.expasy.org (accessed on 20 January 2014).
  36. Li, H.L.; Guo, D.; Yang, Z.P.; Tang, X.; Peng, S.Q. Genome-wide identification and characterization of WRKY gene family in Hevea brasiliensis. Genomics 2014, 104, 14–23. [Google Scholar] [CrossRef] [PubMed]
  37. Guo, D.; Li, H.L.; Tang, X.; Peng, S.Q. Cassava (Manihot esculenta Krantz) genome harbors KNOX genes differentially expressed during storage root development. Genet. Mol. Res. 2014, 13, 10714–10726. [Google Scholar] [CrossRef] [PubMed]
  38. Li, H.L.; Zhang, L.B.; Guo, D.; Li, C.Z.; Peng, S.Q. Identification and expression profiles of the WRKY transcription factor family in Ricinus communis. Gene 2012, 503, 248–253. [Google Scholar] [CrossRef] [PubMed]

