2.1. Sample Fabrication and Characterization
The Ni@Au NPs used in this study were fabricated employing the gas-condensation method, using a chamber equipped with two decoupled evaporation sources for separate evaporation of Ni or Au. High-purity Au@Ni spheres (~0.3 g each, 99.99% pure and ~2 mm in diameter) were heated separately using a current source of 60/105 A, and were evaporated at a rate of 0.05 Å/s in an Ar atmosphere using a pressure of 2.3 torr. The evaporated particles were collected on a non-magnetic SS316 stainless steel plate placed 20 cm above the evaporation source and maintained at 77 K. After restoration to room temperature, the NPs, which were only loosely attached to the collector, were stripped off. The samples thus obtained were in powdered form and consisted of a macroscopic amount of individual NPs. There were no substrate or capping molecules on the NPs. The resultant powders were no longer gold yellow but dark black, indicating a blue shift in the absorption bands of the powders into the invisible region, as is the case for most metallic NPs. The blue shifting of the absorption bands is known to be a direct result of quantum confinement [
18], where spatial restriction to the conduction electrons will give rise to enlargements of band separations [
19].
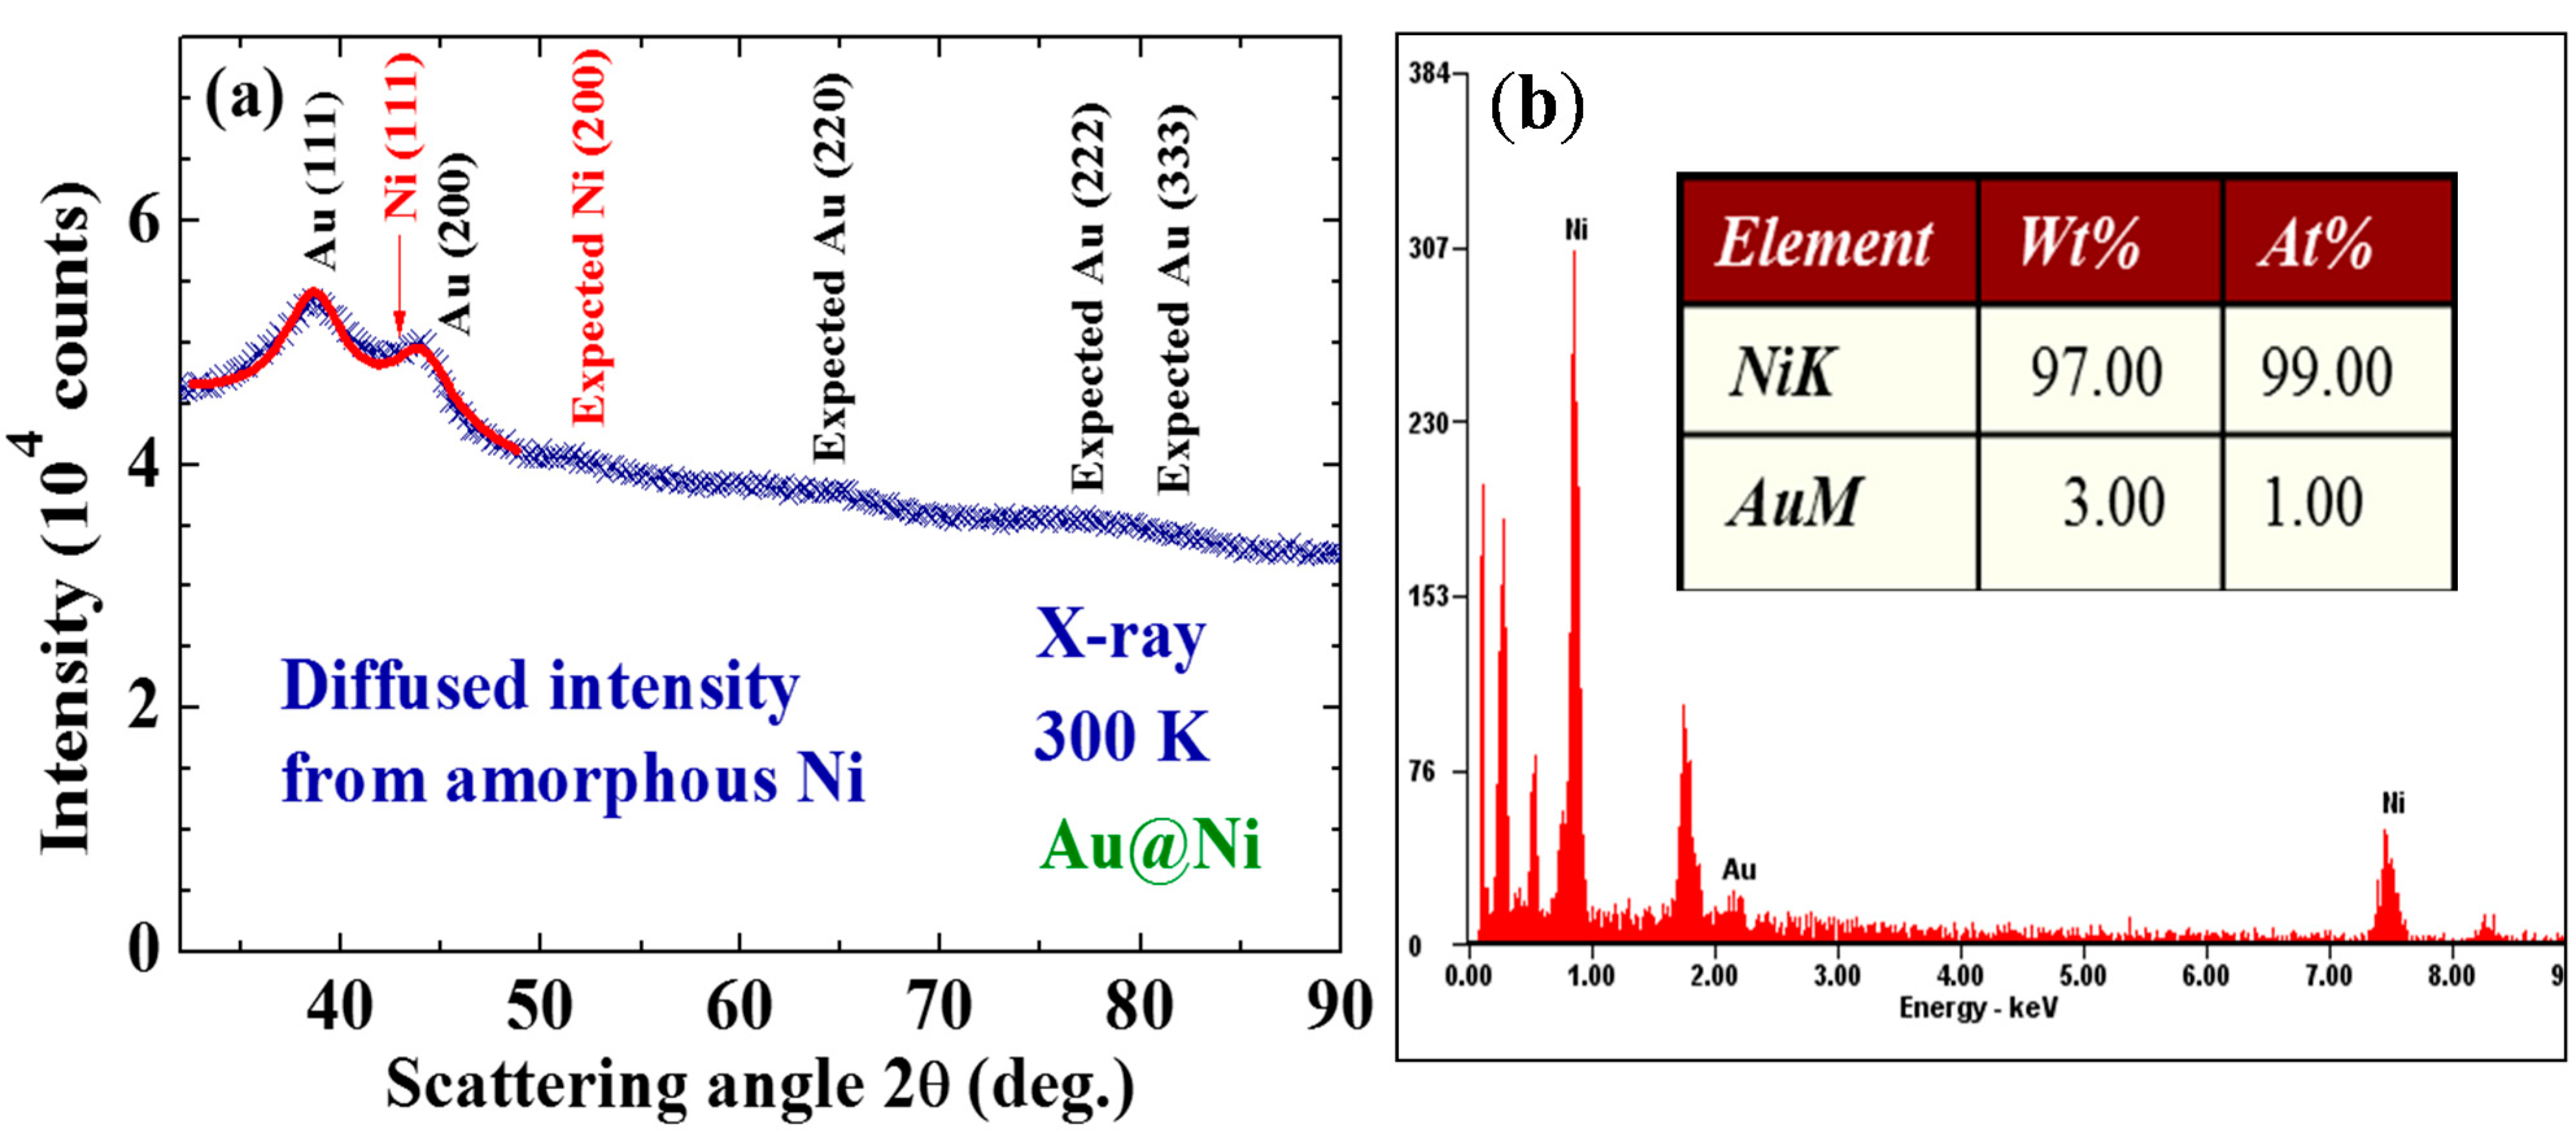
Figure 1.
(a) X-ray diffraction pattern of the Au@Ni nanoparticles taken at 300 K, revealing a series of diffraction peaks associated with fcc Au together with a strong diffused incoherent intensity distributed over the entire pattern. The arrows indicate the expected peak positions for the fcc Ni. The solid curves indicate the calculated line profiles of the 2.4 nm fcc Au; (b) A representative EDXS spectrum, where signals from Au are barely seen but reveal an atomic ratio of Ni:Au = 99:1 for this spatial region of the assembly.
X-ray diffraction patterns, AFM/SEM/TEM images, and EDXS spectra were all used to characterize the samples. No obvious differences were found in the X-ray diffraction patterns taken from different portions of the sample. The X-ray diffraction pattern for each portion of the sample revealed a series of broad but well-defined diffraction peaks from the crystallized face-centered cubic (fcc) Au together with strong incoherent diffused intensity distributed over the entire pattern, and noticeable but very weak diffraction peaks associated with crystallized fcc Ni (
Figure 1a). Elemental analysis using EDXS spectra taken from 12 different portions of the assembly gave an atomic ratio of Ni:Au = 95(2):5(1). A representative EDXS spectrum is shown in
Figure 1b. It appears that the strong diffused intensity in the diffraction pattern is mainly from the noncrystalline Ni, and the main component of the NPs is indeed the noncrystalline Ni atoms. No diffraction signals from NiO may be identified in the X-ray diffraction pattern. The TEM images (
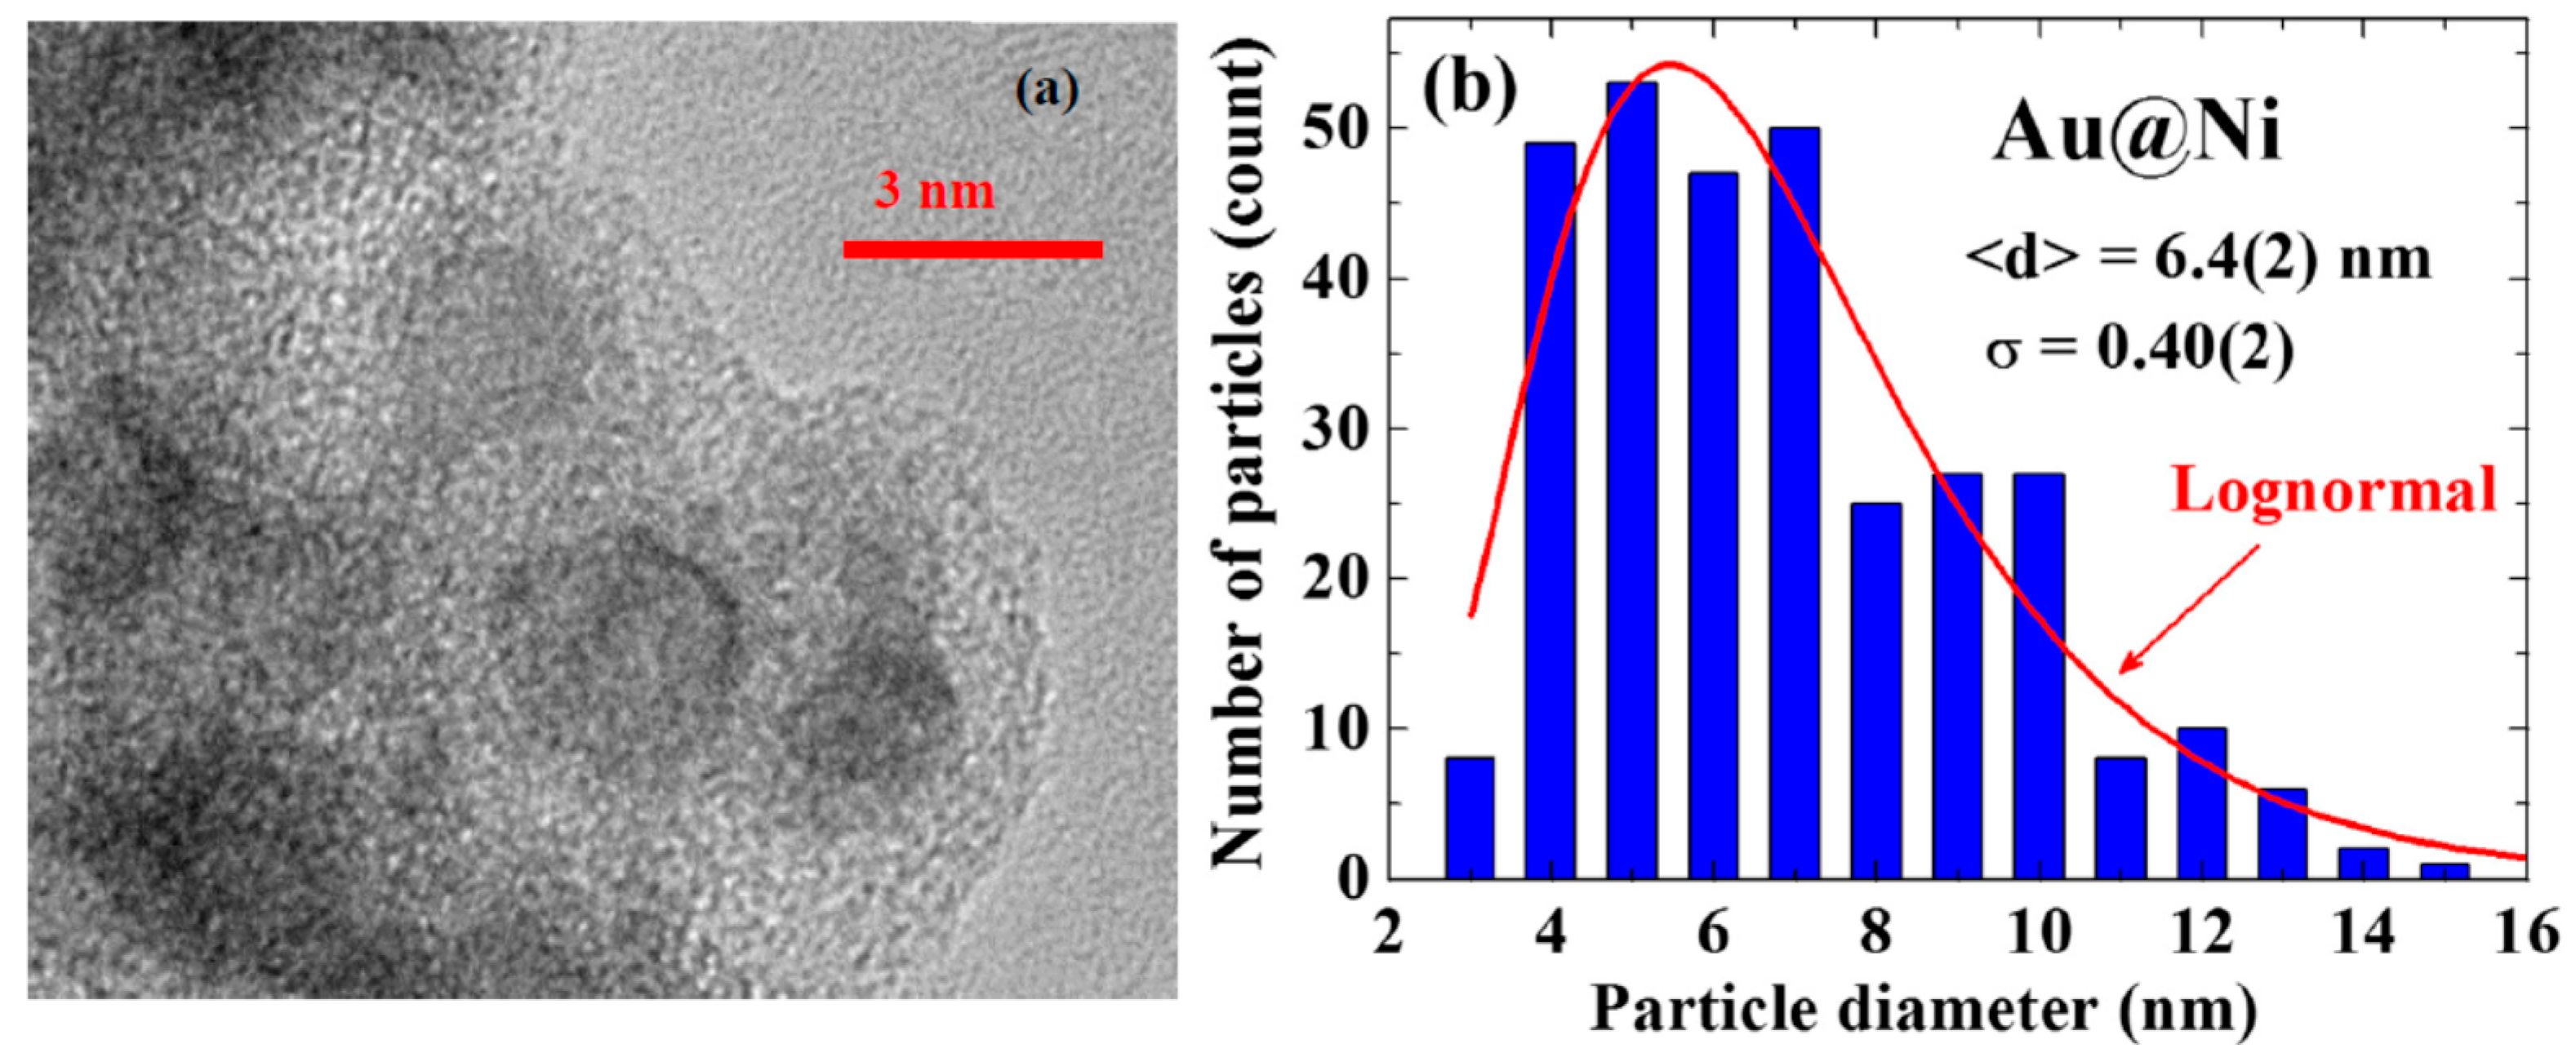
Figure 2a) show the NPs to have a spherical core/shell structure, with the images of the cores being considerably darker than those of the shells. It is known that the electron density of Au is 1.82 times that of Ni. The NPs thus have a core/shell structure with crystalline Au in the core covered with an amorphous Ni shell. Size analyses based on the AFM images revealed that particle sizes of the NP assemblies can be described using a lognormal distribution, with a mean particle diameter of 6.4(2) nm and a standard deviation of 0.40(2) (
Figure 2b). Mean particle diameter of the crystalline Au was determined by fitting the diffraction peaks to the diffraction profiles of finite sized particles, assuming a lognormal size distribution for the NP assembly [
20]. The mean particle diameter thus determined for the Au cores is 2.4 nm. Knowing the size of the Au core and the atomic ratio between Ni and Au, we estimate that the Au@Ni NP consists of 2.4 nm fcc Au in the core covered by a 2.2 nm thick amorphous Ni shell, resulting in a mean particle diameter of 6.8 nm for the Au@Ni, which agrees well with that obtained from the AFM images. The physical processes that produced the present core/shell structure are not yet completely realized. However, the chamber pressure employed during the evaporation plays an essential role. An Ar atmosphere of 2.3 torr is known to be suitable for the formation of crystalized Au NPs [
20], but a much low chamber pressure is usually needed in the generation of crystalized Ni NPs.
Figure 2.
(a) Representative TEM images of the Au@Ni NPs, revealing a spherical core/shell structure for the NP; and (b) Size distribution obtained from the AFM images. The solid line indicates the results of fits to a lognormal function, giving a mean particle diameter of 6.4 nm with a standard deviation of 0.4.
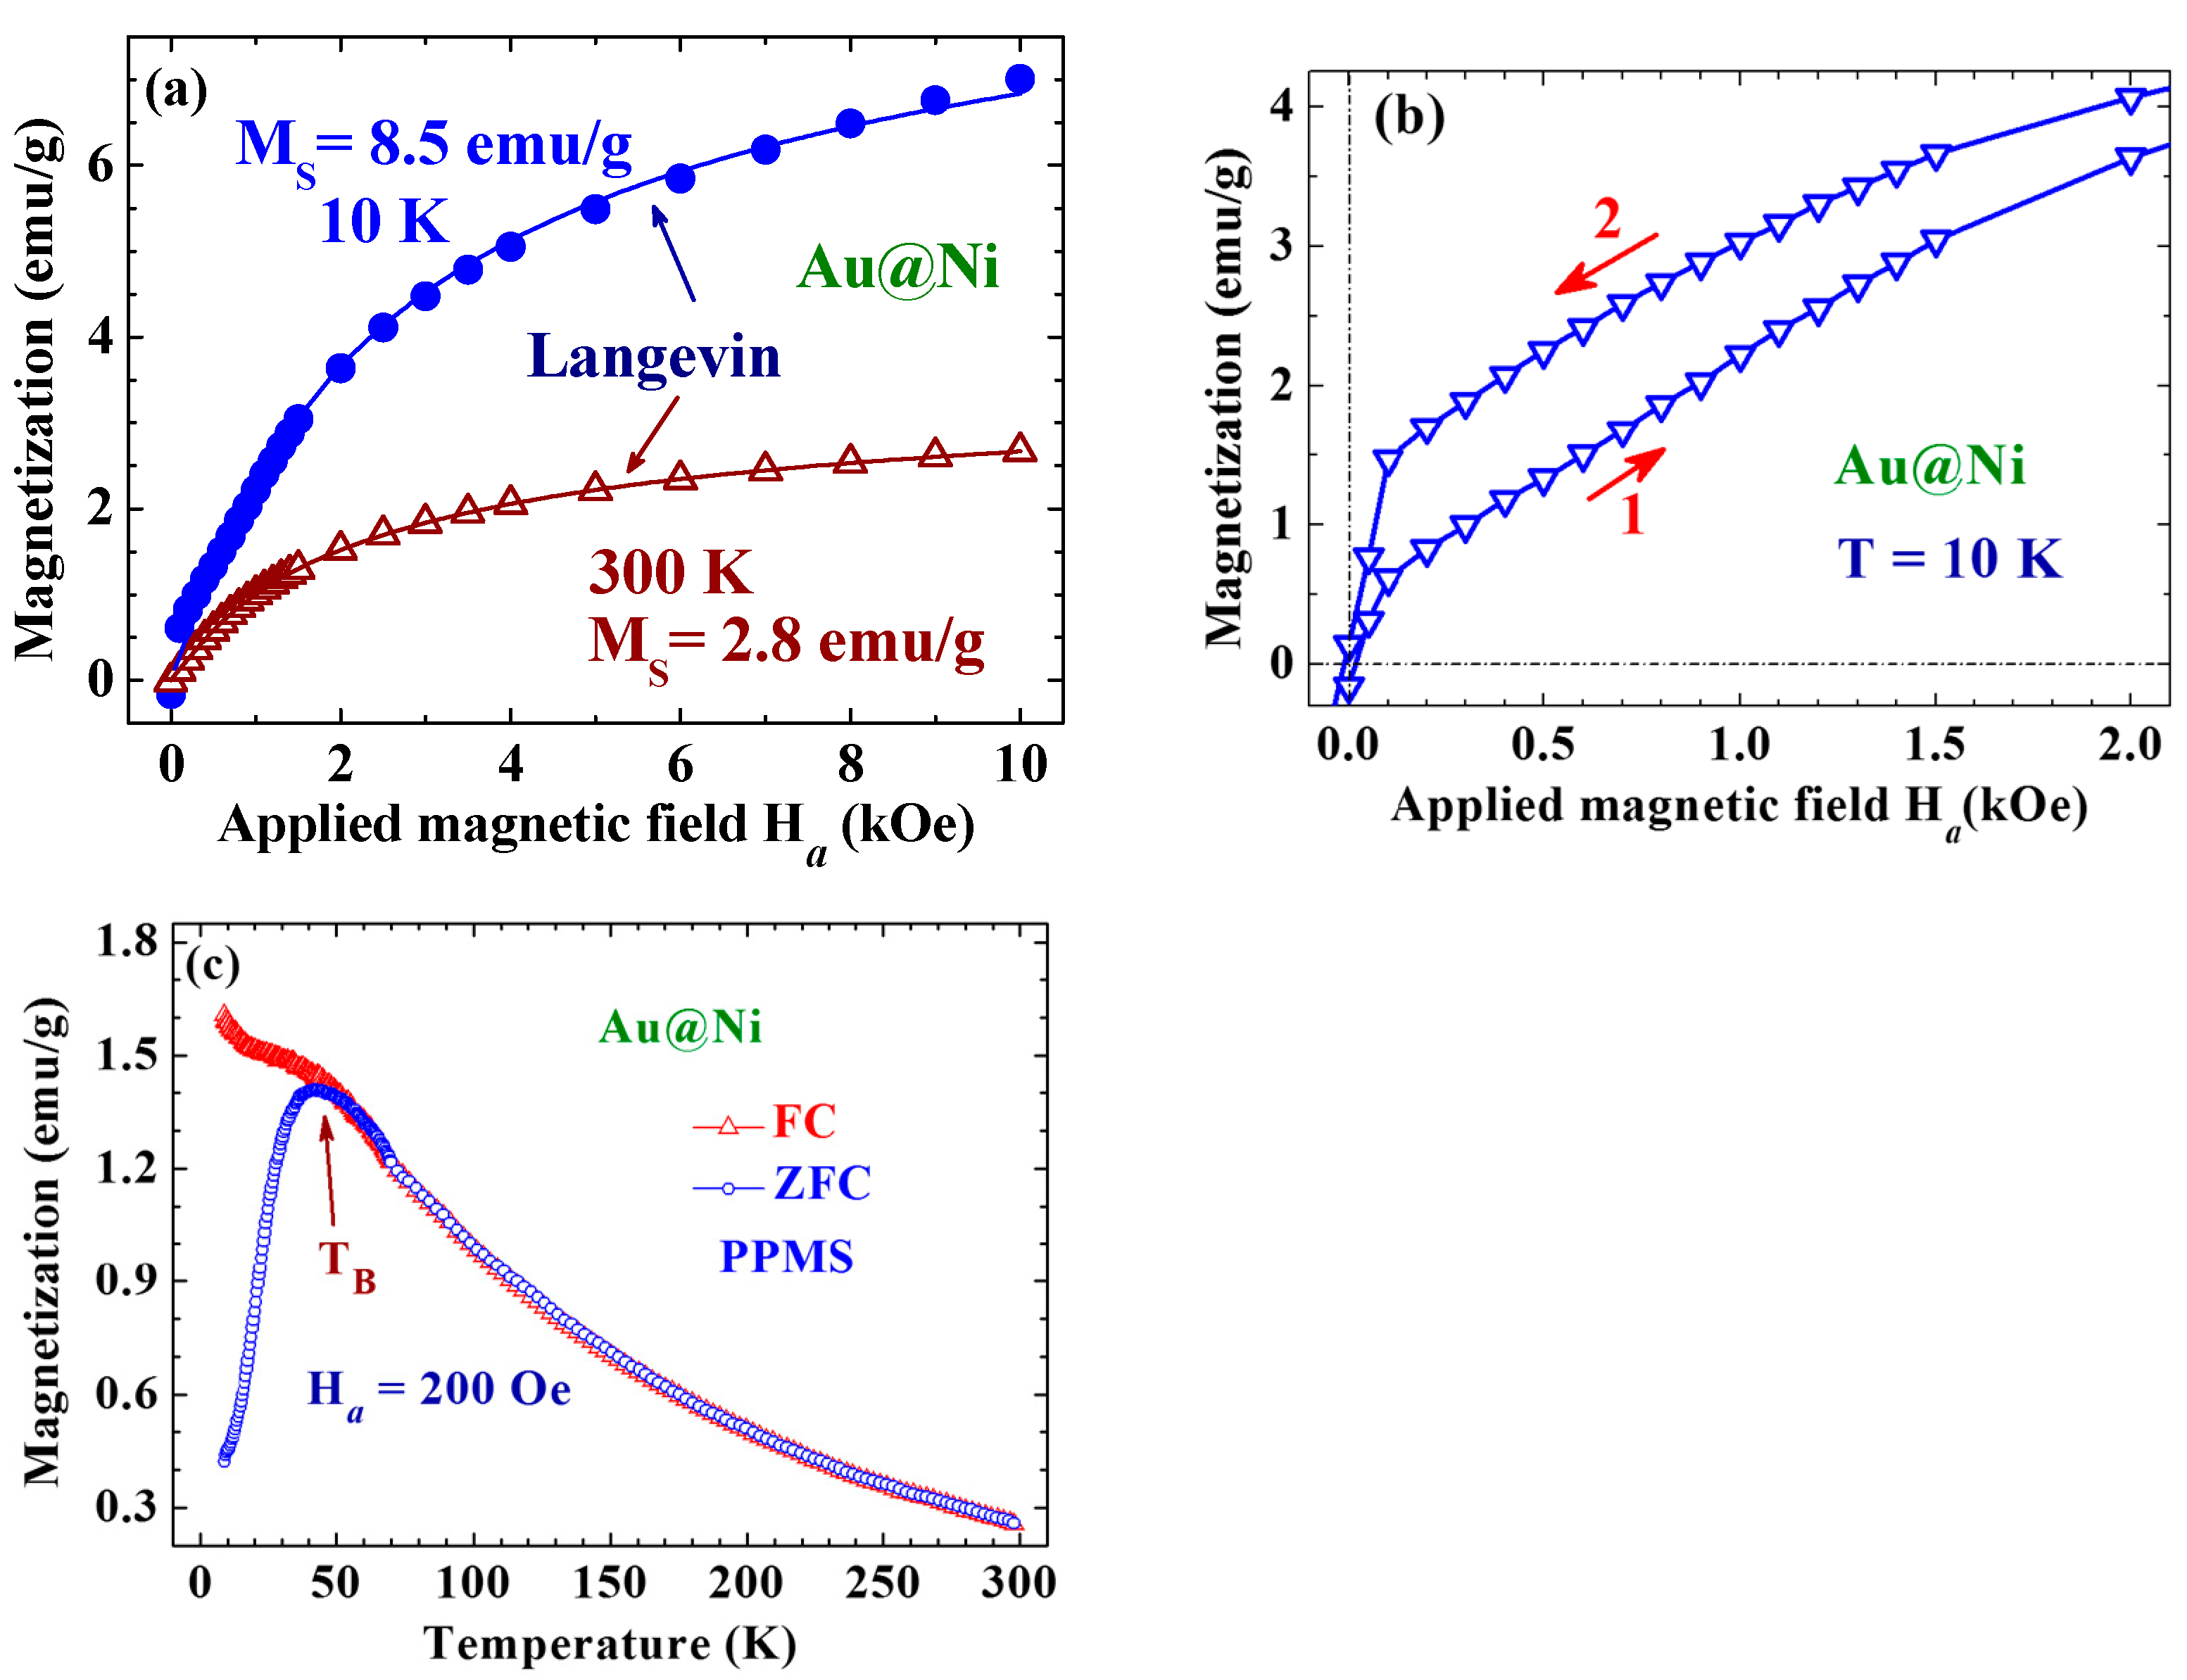
2.2. Magnetic Superspins
The isothermal magnetization
M(
Ha) curves can be described by a Langevin profile, with the saturation magnetization
MS reaching 8.5(2) and 2.8(2) emu/g at 10 and 300 K, respectively (
Figure 3a). The size polydispersity of the assembly was considered [20] when describing the observed
M(
Ha) curves. The solid curves in
Figure 3a indicate the results of the fits for
with
, obtained by knowing the size distribution of the assembly (
Figure 2b) and assuming a lognormal type of particle moment dependency on the particle size
, with the maximum particle moment μ
pm, the mean particle diameter
dc and width
w of the moment distribution being the fitting parameters. Eleven
ni’s generated from the size distribution curve (solid curve in
Figure 2b) covering
di from 1.4 to 11.4 nm were used in the fit. No significant differences in the results from the fit were found when more terms of
ni were employed. The saturation magnetization thus takes the form of
. The
MS for the 10 nm Au@Ni NP is about ~15% that of bulk Ni. Magnetic hysteresis can be clearly seen in the
M(
Ha) curves taken below 50 K, with a coercivity of
HC = 40 Oe and a low remanent magnetic moment per unit mass of
Mr = 0.14 emu/g at 10 K (
Figure 3b). The low
MS,
HC and
Mr observed for the present assembly reflect the amorphous nature of the Ni in the Au@Ni NPs. It is interesting to note that an asymmetric
M(
Ha) loop with respect to the inversion in the field direction was obtained, where the loop opening shifted by 55 Oe along the positive field direction. This behavior suggests the existence of strong exchange bias in the NPs, which can be driven by the correlations between the superspins in the NPs. This is different from the symmetric
M(
Ha) loop observed in crystalline Ni on Au [
13]. The temperature dependencies of the FC and ZFC magnetization taken at
Ha = 200 Oe in warming depart from each other below 50 K, showing a blocking temperature of
TB = 50 K for the Au@Ni NPs (
Figure 3c).
Figure 3.
(a) M(Ha) curves taken at two representative temperatures of 10 and 300 K, where the solid lines indicate the fits of the data to the Langevin profile; (b) M(Ha) loops taken at 10 K, where the red arrows indicate the directions of the field-changing processes. Magnetic hysteresis with a low coercivity of 40 Oe and a low remanent magnetic moment per unit mass of 0.14 emu/g is revealed; and (c) Magnetization as a function of temperature measured in warming with Ha = 200 Oe, after field-cooling (open triangles) or zero-field-cooling (open circles) from 300 to 2 K. The FC and ZFC curves depart from each other below 50 K, which marks the blocking temperature of the system.
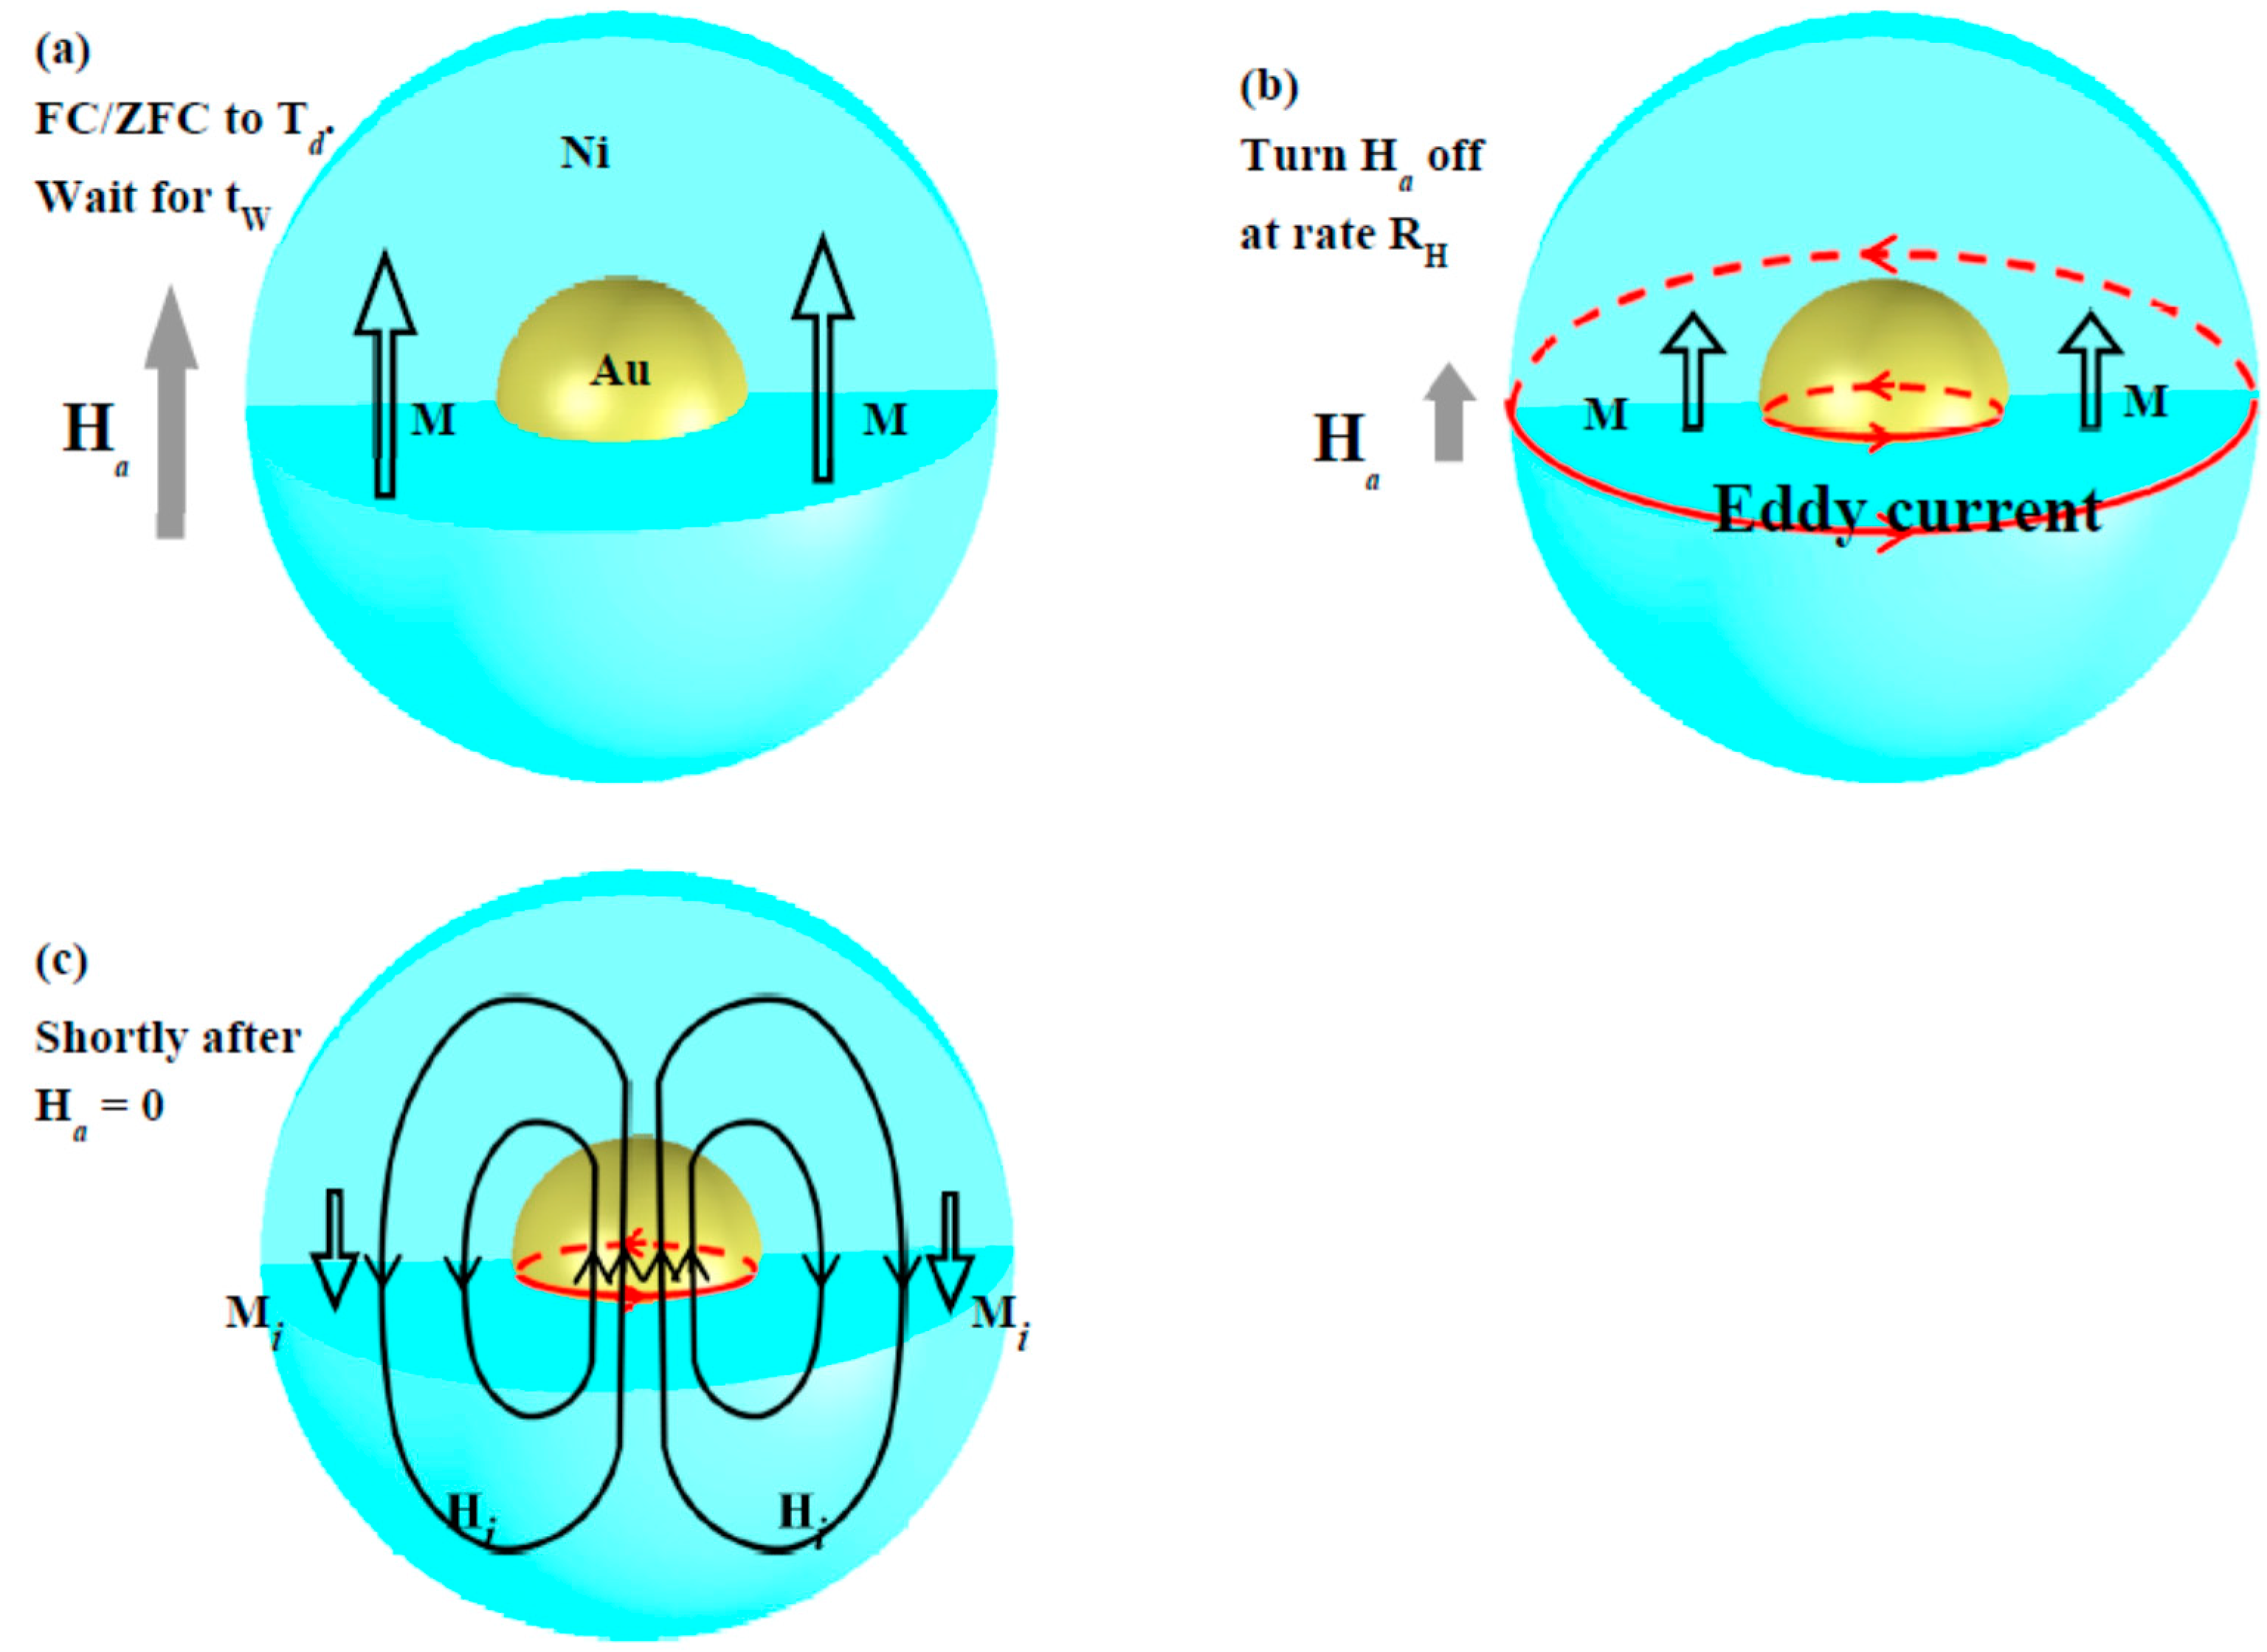
2.3. Inverse Faraday Magnetization
Inverse magnetization was generated through the following steps: (1) Field-cooling (FC) at
Ha or zero-field-cooling (ZFC) of the Au@Ni NPs to the designated temperature
Td. If a ZFC process is used, apply
Ha upon reaching
Td, which will allow the development of a net magnetization M in the NP assembly. (2) Remain at
Td with
Ha for a period of time, which marks the wait time
tw. In the case of NPs with a slow spin dynamical response, the wait time can have a big effect on the net magnetization that develops in the assembly as well as on the resultant relaxation profile (
Figure 4a). (3) Turn the
Ha off at a selected field reduction rate
RH ≡ d
Ha/d
t. An
RH of −500 or −200 or −100 Oe/s was used in the present study. The induced Faraday electric potential will trigger eddy currents in both the Au core and Ni shell. The changes in flux are considerably larger in the amorphous Ni than in the crystalline Au. Taking the
Ha as pointing in the upward direction, the eddy currents will circulate counterclockwise in the horizontal plane (
Figure 4b). (4) The induced current will continue to run for a short period of time after
Ha reaches zero. It appears (see below) that a huge inverse magnetization
Mi opposite to that of the original M could develop in the assembly. The appearance of
Mi can be linked to the eddy current in the Au core, which can be expected to last for a longer time than that in the amorphous Ni, because of the eddy current in the amorphous Ni (with a considerably higher resistivity) will dissipate much faster than that in the crystalline Au [
21]. The counterclockwise circulating eddy current in the Au core generates an
Hi opposite to the
Ha on the two sides of the Au NPs, which aligns the neighboring Ni moments downward to produce an inverse magnetization (
Figure 4c). The
Mi relaxes gradually with time, with a time constant typically in the range of a few tens of minutes.
Figure 4.
Schematic representations of the applied magnetic field Ha, induced eddy current, induced magnetic field Hi and magnetization M that developed in the Au@Ni nanoparticle in three representative stages: (a) after field-cooling or zero-field-cooling to the designated temperature and after waiting for a designated period of time, where the Ni moments are aligned by the Ha and giving rise to an M; (b) at an intermediate time as Ha is being cut off, where counterclockwise circulating eddy currents (red circles) have been induced in the Au core and in the Ni shell; and (c) shortly after Ha reaches zero, where the eddy currents in the Ni shell have dissipated while those in the Au core (with a lower resistivity) are still circulating to produce an inverse magnetic field Hi.
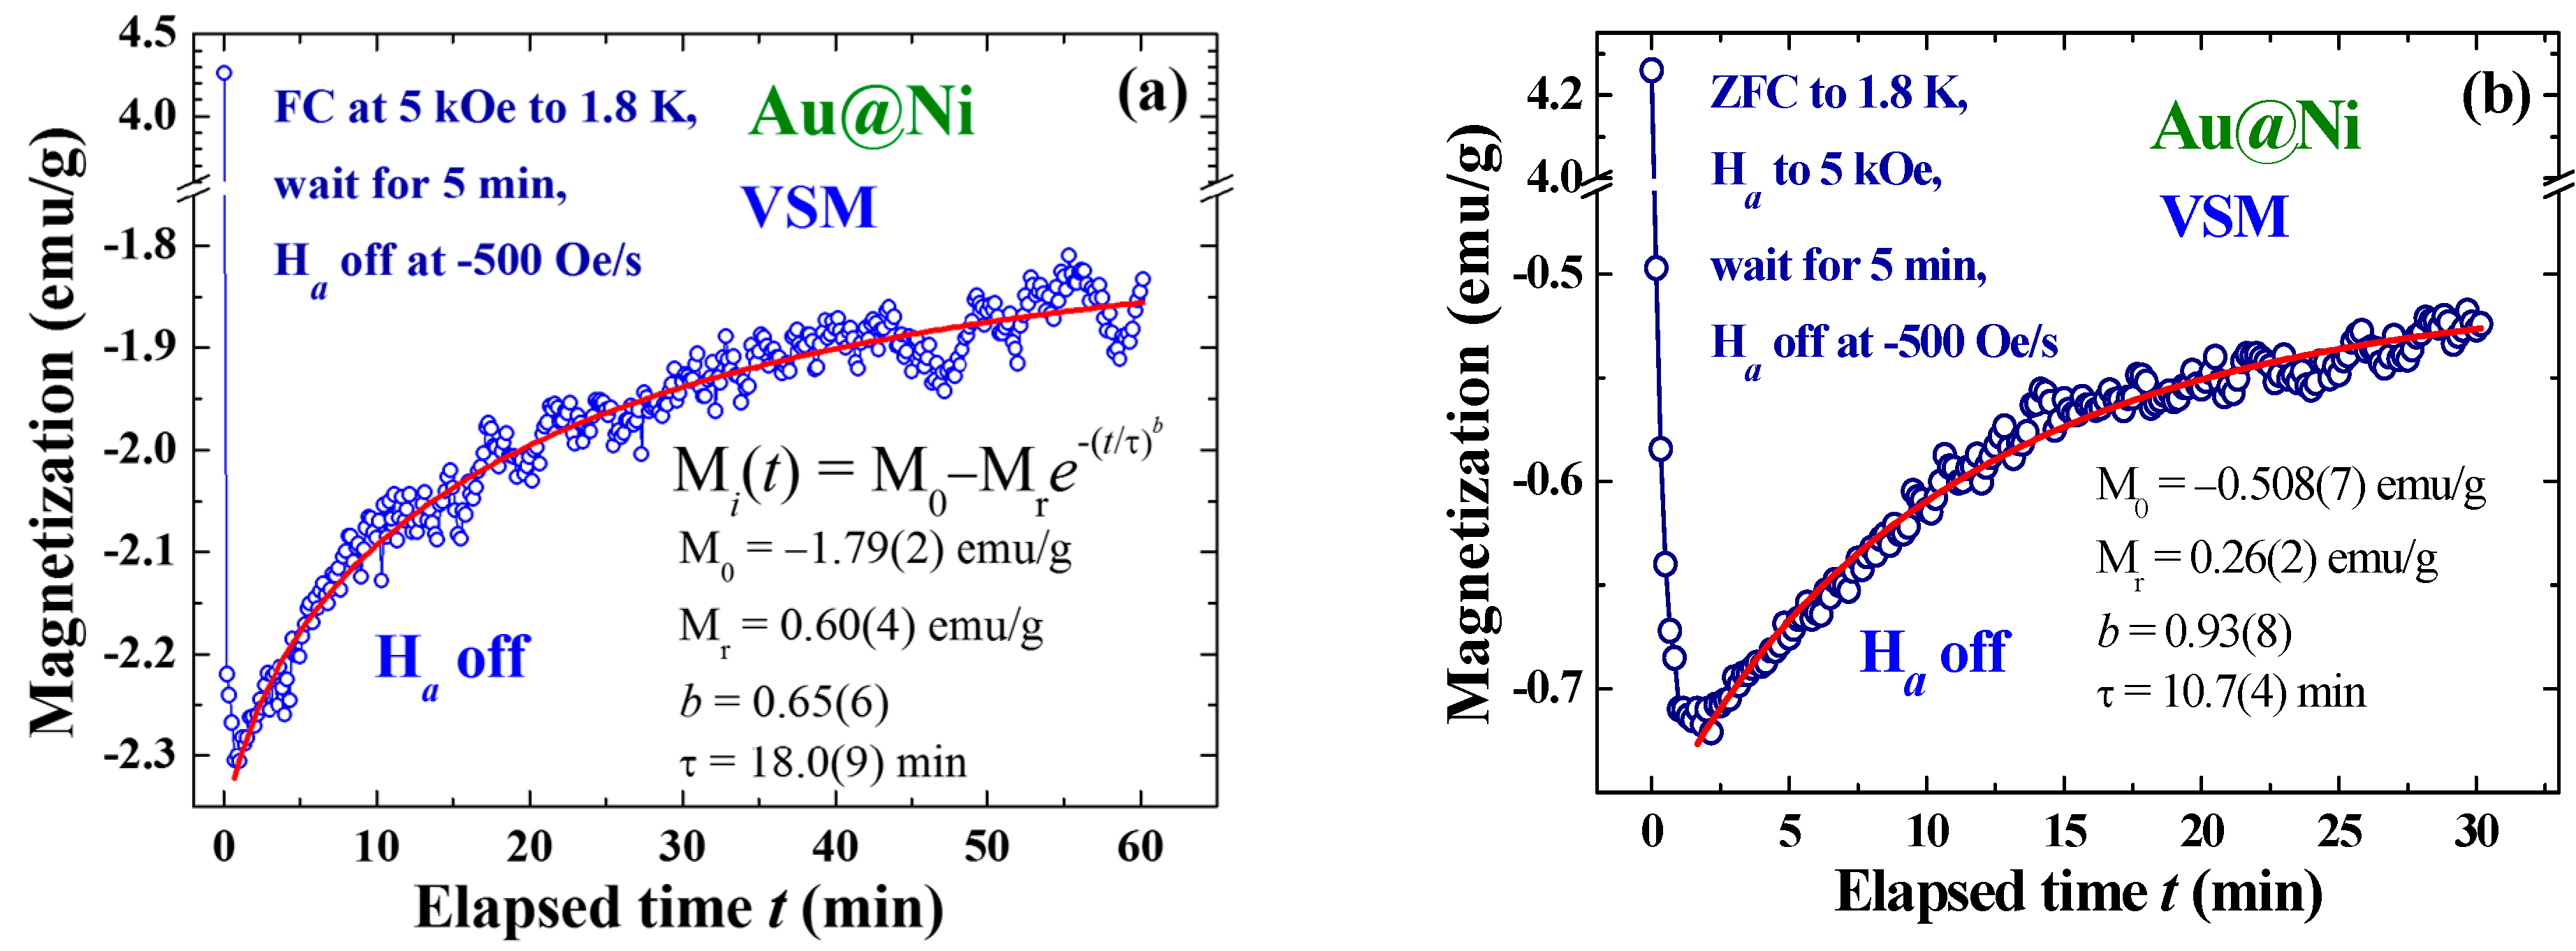
Inverse magnetization, induced by turning the
Ha off, reaching as high as 54% of the original M (before turning
Ha off) was observed in the FC processes at
Ha = 5 kOe to 1.8 K, with
tw = 5 min and
RH = −500 Oe/s (
Figure 5a). The induced
Mi persisted for a significantly long period of time, weakening by only 22% one hour after induction. The relaxation of
Mi with time may be described by an stretched exponential decay profile with a dynamic exponent
b for the temporal parameter:
Mi(
t) =
M0 −
Mrexp{(−
t/τ)
b} (solid curve in
Figure 5a) to give
b = 0.65(6) and τ = 18.0(9) min.
Mi(
t) departs significantly from the exponential decay profile at a high
t when assuming an exponent of
b = 1 for the expression. The extremely long relaxation of
Mi reflects the existence of strong coupling among the Au@Ni NPs, even though the NPs were only loosely packed. The appearance of a spin-glass type memory effect in the Au@Ni NPs could be due to the spin frustration of the amorphous Ni on the shell [
22,
23,
24]. Although the effects generated in the ZFC processes were smaller they were still clearly visible (
Figure 5b), with the induced
Mi reaching 17% with
b = 0.93(8) and τ = 10.7(4) min for the temporal evolution of the order parameter.
Figure 5.
(a) Temporal evolution of the induced magnetization recorded after field-cooling at Ha = 5 kOe from 300 to 1.8 K, followed by a wait time of 5 min before turning the Ha off at a rate of −500 Oe/s; and (b) temporal evolution of the induced magnetization recorded after zero-field-cooling from 300 to 1.8 K, followed by turning the Ha on to 5 kOe and waiting for 5 min before turning Ha off at a rate of RH = −500 Oe/s.
Interestingly, the induced
Mi was very sensitive to the field reduction rate
RH. Inverse magnetizations reaching 20% and 12% of the original M were found in the FC process to 10 K at
RH = −200 and −100 Oe/s, respectively, with
Ha = 5 kOe and
tw = 120 min (
Figure 6a). Compared to the 54% obtained with
RH = −500 Oe/s (but cooled to 1.8 K), the effect at
RH = −200 Oe/s is ~2.7 times smaller. Although it can be expected that a higher
RH will generate a larger eddy current and stronger
Hi, the
Mi, however, will not monotonically increase with increasing
RH but will eventually become saturated when all spin domains are aligned accordingly. Note that it cannot be anticipated that
Mi will reach 100% of the original M, since only a portion of the spin domains experiences downward
Hi (
Figure 4c). In addition, the induction was also found to be sensitive to temperature. Although it was much reduced at higher temperatures, the induction was still visible even at 300 K. The induced
Mi was reduced to 9, 2.5 and 0.3% of the original M at 20, 100 and 300 K, respectively (
Figure 6b). It is possible that the change of resistivity of the Au core plays an important role in the reduction of
Mi at high temperatures. The resistivity ρ of Au increases by a factor of ~100 upon warming from 10 to 298 K [
21]. This change will certainly affect the eddy current, hence the magnitude of the Faraday induction. However, the changes in ρ and in
Mi do not linearly correspond. We believed that other mechanisms such as superspin correlation and superspin frustration also play essential roles in current observations. Surprisingly,
Mi relaxed to a sizable value, rather than to zero. The
Mi generated in a FC process at
Ha = 5 kOe to 10 K with
tw = 120 min, stabilized at
M0 = −0.230(5) and −0.005(3) emu/g when field reduction rates of
RH = −200 and −100 Oe/s were used, respectively (
Figure 6a).
Figure 6.
(a) Temporal evolution of the magnetization recorded after field-cooling at Ha = 5 kOe from 300 to 10 K, followed by waiting for 120 min before turning the Ha off at rates of −200 Oe/s (open circles) and −100 Oe/s (open triangles); and (b) temporal evolution of the magnetization recorded after field-cooling at Ha = 5 kOe from 300 K to four representative temperatures, followed by waiting for 120 min before turning the Ha off at a rate of −200 Oe/s. The solid lines indicate the fits of the data to the exponential profile listed in (a).
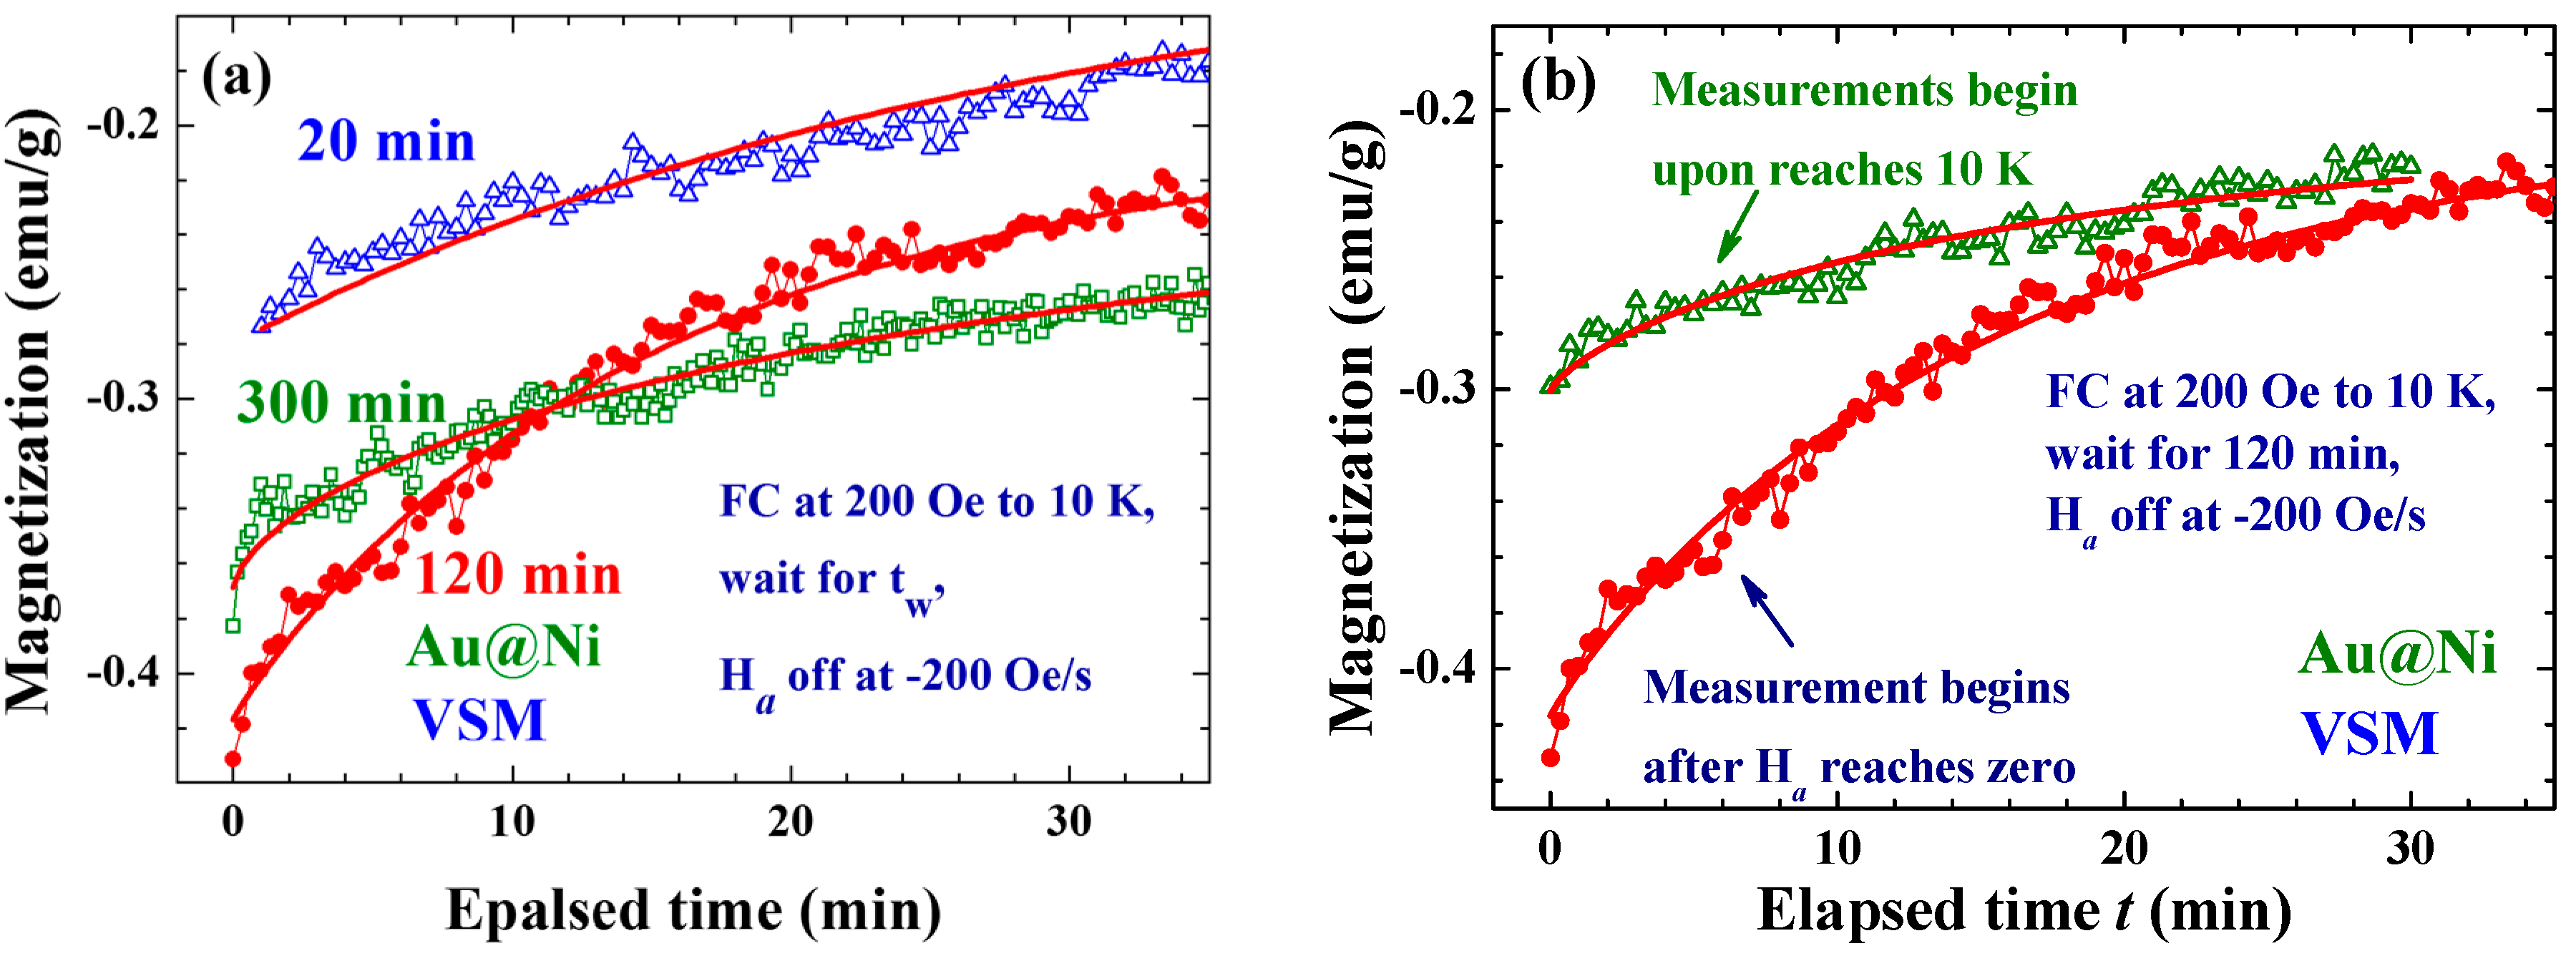
Inverse magnetization can also be induced by a weak
Ha, reaching 27% of the original M in the FC process to 10 K at
Ha = 200 Oe, with
tw = 120 min and
RH = −200 Oe/s (filled circles in
Figure 7a). A longer wait time will generate a larger effect, but it appears that there is an upper limitation to the wait time for maximum effect (
Figure 7a), longer than which
tw plays a significantly less essential role. The wait time for maximum induction is likely to be ~120 min for the present Au@Ni NPs assembly. It is surprising to find that the conduction of the magnetization measurement can also affect the strength of the induced
Mi, as demonstrated in
Figure 7b. The induced
Mi dropped from −0.43 emu/g (
i.e., a 27% induction) to −0.30 emu/g, if measurements were made during the waiting period. This interesting behavior reflects again that the Faraday induction of the amorphous Ni in Au@Ni NPs is very sensitive to changes in the external disturbances. In addition, there is essentially no difference found between the
Mi that is induced when using a Vibrating Sample Magnetometer (VSM) or a Physical Property Measurement System (PPMS). We, however, noticed that the
Mi(
t) obtained when using VSM relaxes at a slightly but noticeably slower rate, reflecting that the vibrating-sample used in VSM measurement can also affect
Mi. The relaxation parameters obtained from the fits of the
Mi(
t) curves to
M0 −
Mrexp{(−
t/τ)
b} are listed in
Table 1. The dynamic exponent
b reflects the changes of relaxation rate of
Mi with the evolution of time. A value for
b of smaller than 1 indicates the relaxation is slowing down, whereas a value for
b of larger than 1 indicates that the relaxation is speeding up. It is interesting to see that the dynamic exponent
b of the temporal evolution of the order parameter
Mi are all smaller than 1, showing that
Mi relaxes at a significantly slower rate with the evolution of time. It is very unlikely that the slowing down of the
Mi relaxation is linked to the growth of the magnetic correlation length, as is frequently expected, but reflects the longer and longer time it can take for domain superspins to randomly flip. This can be understood by assuming that there are wide dimensions of ferromagnetic spin domains in the amorphous Ni shell of each NP. The mean time between two random flips of the domain superspin, known as the Neel relaxation time, is longer for a larger spin domain. The magnetic relaxation is dominated by larger spin domains at later times, giving rise to the slowing down of the relaxation.
Figure 7.
(a) Comparison of the temporal evolution of the induced inverse magnetizations after wait times of 20 min (open triangles), 120 min (filled circles) and 300 min (open squares), through field-cooling at Ha = 200 Oe from 300 to 10 K and a field reduction of RH = −200 Oe/s; and (b) temporal evolution of the inverse magnetization recorded upon reaching 10 K (open triangles) and when the Ha is completely off (filled circles), in the process of field-cooling at Ha = 200 Oe from 300 to 10 K, followed by a wait time of tw = 120 min before turning the Ha off at a rate of RH = −200 Oe/s. The solid lines indicate the fits of the data to the exponential profile listed in (a).
Table 1.
Parameters obtained from the fits of the Mi(t) curves to the expression Mi(t) = M0 − Mr exp{(−t/τ)b}. The * indicates that the measurements were made during the waiting period.
Table 1.
Parameters obtained from the fits of the Mi(t) curves to the expression Mi(t) = M0 − Mr exp{(−t/τ)b}. The * indicates that the measurements were made during the waiting period.
| Process | Ha (kOe) | Td (K) | RH (Oe/s) | tw (min) | M0 (emu/g) | Mr (emu/g) | τ (min) | b |
|---|
| FC | 5 | 1.8 | −500 | 5 | −1.79(2) | 0.60(4) | 18.0(9) | 0.65(6) |
| ZFC | 5 | 1.8 | −500 | 5 | −0.508(7) | 0.26(2) | 10.7(4) | 0.93(8) |
| FC | 5 | 10 | −100 | 120 | −0.005(3) | 1.00(3) | 8.1(4) | 0.53(2) |
| FC | 5 | 10 | −200 | 120 | −0.230(5) | 1.24(3) | 10.5(5) | 0.45(1) |
| FC | 5 | 20 | −200 | 120 | −0.070(2) | 0.424(5) | 12.2(2) | 0.49(1) |
| FC | 5 | 100 | −200 | 120 | −0.053(1) | 0.038(2) | 21(2) | 0.52(2) |
| FC | 0.2 | 10 | −200 | 20 | −0.126(1) | 0.154(2) | 29.0(4) | 0.99(2) |
| FC | 0.2 | 10 | −200 | 120 | −0.201(7) | 0.216(2) | 15.7(1) | 0.94(1) |
| FC | 0.2 | 10 | −200 | 300 | −0.201(1) | 0.168(2) | 33.6(3) | 0.65(1) |
| FC * | 0.2 | 10 | −200 | 120 | −0.202(1) | 0.098(3) | 18.2(4) | 0.77(3) |
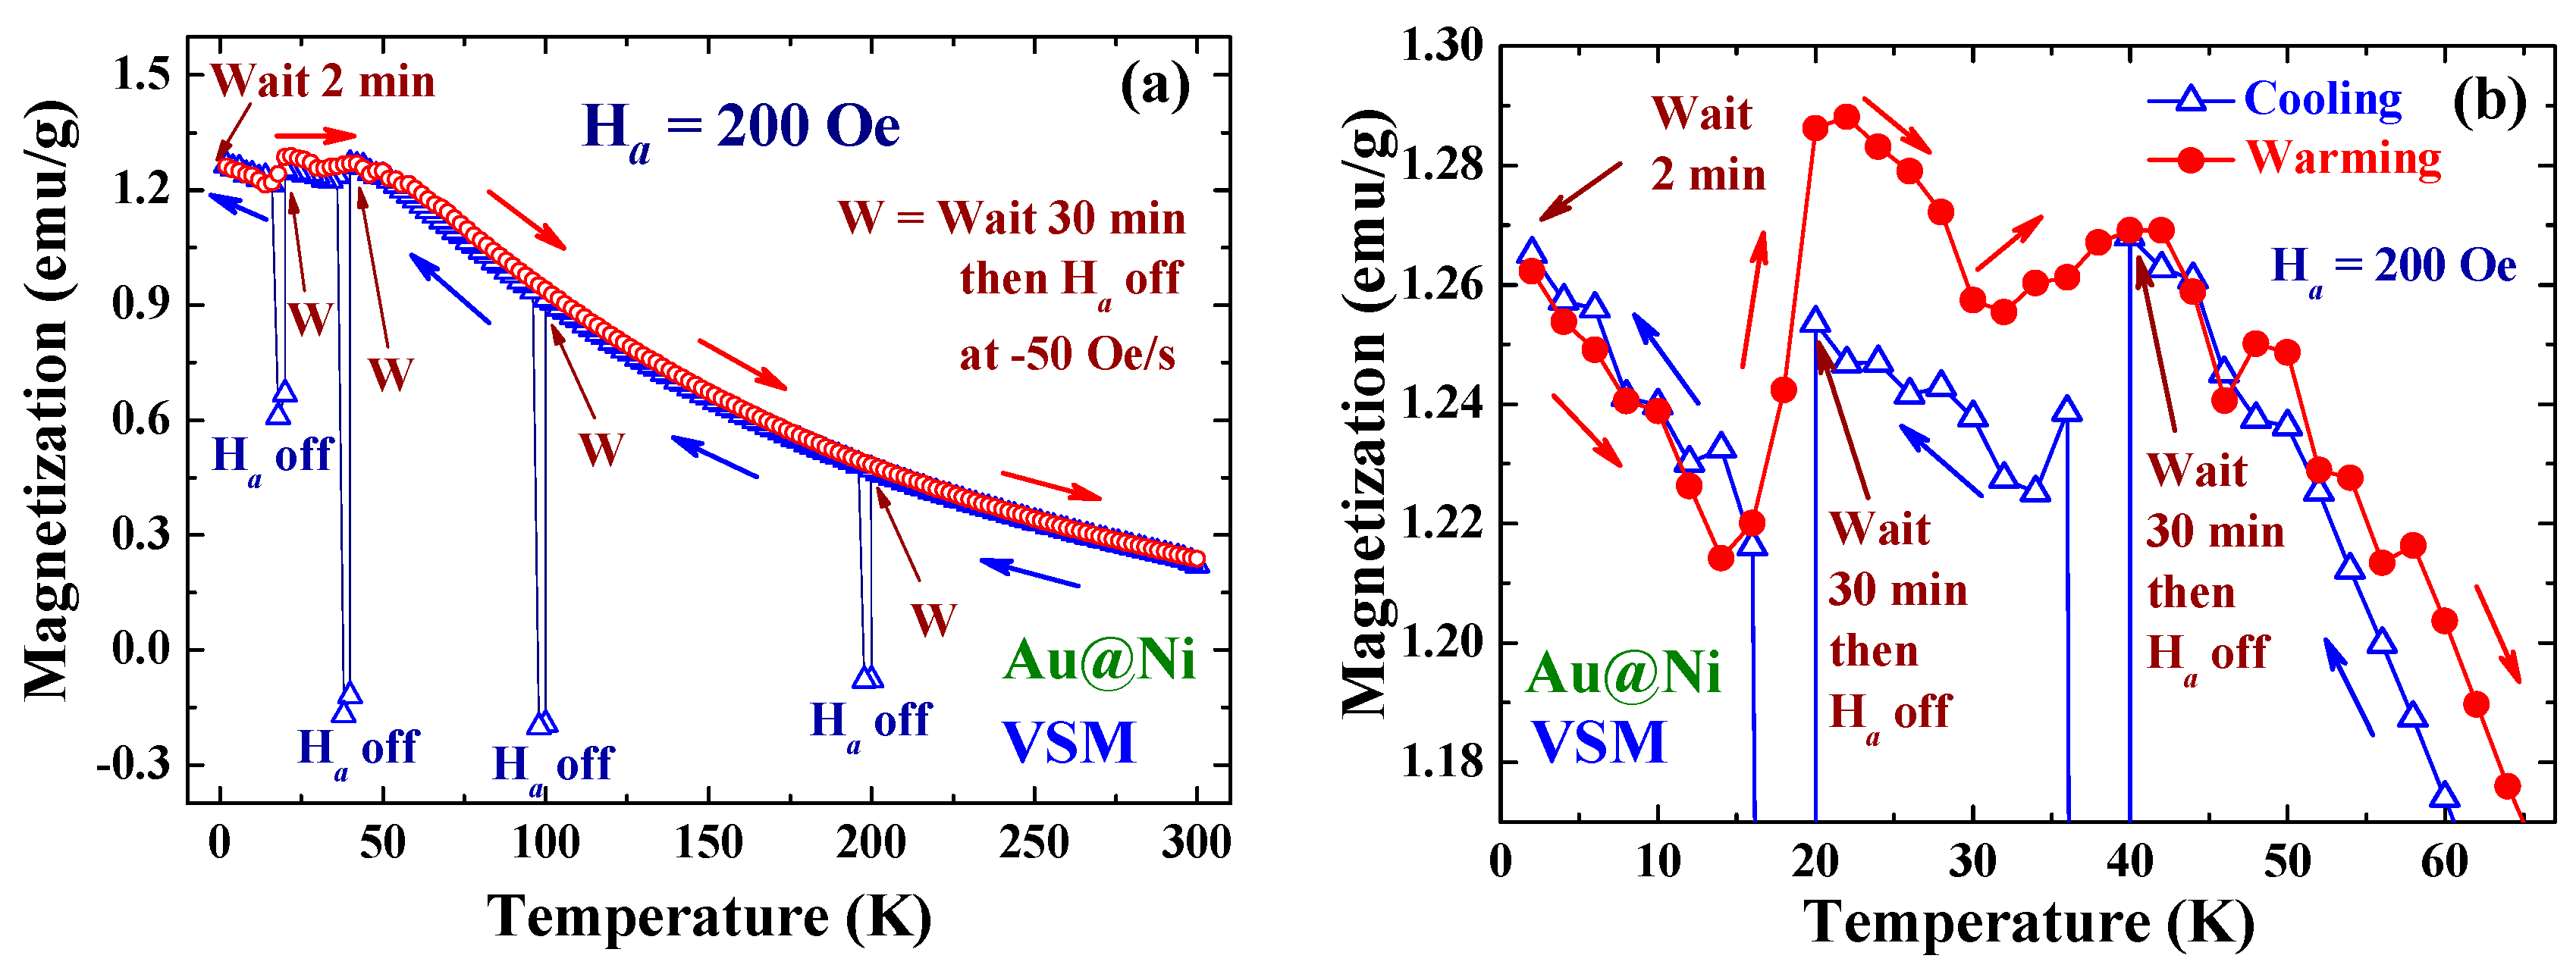
2.4. Memory Effect
A memory effect in the magnetization was revealed below the blocking temperature but not above, as demonstrated in the relaxation measurements shown in
Figure 8a,b. These M(T) loops were collected in the processes beginning with the slow cooling from 300 K in
Ha = 200 Oe. Magnetization was recorded in steps of 2 K after the temperature was stabilized. Cooling was temporarily stopped for 30 min upon reaching 200 K, followed by turning the
Ha off at a rate of –50 Oe/s to allow the magnetization to relax downward for 3 min. Cooling was resumed after reapplying
Ha to reach 200 Oe. The same process of temporarily stopping the cooling and turning the
Ha off-and-on was conducted at 100, 40 and 20 K. There was a 2 min wait upon reaching the base temperature of 2 K before warming the sample to 300 K using the same temperature steps. Interestingly, the M(T) curve taken in the warming process displays step-like increases at 15 K (by 6%) and 35 K (by 1%), where
Ha was temporarily terminated in the cooling process (
Figure 8b). No abrupt changes of M were observed at 100 and 200 K. Note that the time interval between the cooling and warming processes at 20, 40, 100 and 200 K are 82, 172, 355 and 617 min, respectively. It appears that the memory effect could last for 172 min, as it does appear around 40 K. The disappearance of the memory behavior at 100 and 200 K could be because the time interval has exceeded the time that the memory can last or that the temperatures are well above
TB. The memory effect in nanoparticle systems has been attributed to the existence of significant dipole interactions among particle superspins and/or the broad distribution of relaxation times in the NP assembly [
25]. In the present case, the NPs are very loosely packed and the interparticle interaction is insignificant. Size polydispersity of the assembly then plays a major role in the appearance of the memory effect. The anisotropy energy barriers for random flips of domain superspins can generate not only stretched exponential relaxation of the induced magnetization but also give rise to the memory effect.
Figure 8.
(a) Temperature dependencies of the magnetization collected at temperatures measured in steps of 2 K in the processes starting with cooling (open triangles) from 300 K with Ha = 200 Oe. The W’s at 200, 100, 40 and 20 K mark the process of turning the Ha off at a rate of RH = −50 Oe/s for 3 min, after waiting for 30 min upon reaching that temperature. The arrows indicate the directions of the temperature-changing processes. The open circles indicate the magnetization measured in warming, after waiting for 2 min upon reaching 2 K. (b) Low temperature portions of the M(T) curves displayed in (a), showing step-like increases of M around 15 and 35 K, where Ha has been turned off during cooling. No such behaviors are observed around 100 and 200 K.


