Article

Genome-Wide Identification and Expression Analyses of Aquaporin Gene Family during Development and Abiotic Stress in Banana

1
Key Laboratory of Biology and Genetic Resources of Tropical Crops, Institute of Tropical Bioscience and Biotechnology, Chinese Academy of Tropical Agricultural Sciences, Haikou 571101, Hainan, China
2
College of Life Science and Technology, Huazhong University of Science & Technology (HUST), Wuhan 430074, Hubei, China
3
Key Laboratory of Genetic Improvement of Bananas, Hainan Province, Haikou Experimental Station, Chinese Academy of Tropical Agricultural Sciences, Haikou 570102, Hainan, China
*
Authors to whom correspondence should be addressed.
These authors contributed equally to this work.
Int. J. Mol. Sci. 2015, 16(8), 19728-19751; https://doi.org/10.3390/ijms160819728
Submission received: 25 June 2015 / Revised: 8 August 2015 / Accepted: 12 August 2015 / Published: 20 August 2015
(This article belongs to the Special Issue Plant Molecular Biology)

Abstract

:
Aquaporins (AQPs) function to selectively control the flow of water and other small molecules through biological membranes, playing crucial roles in various biological processes. However, little information is available on the AQP gene family in bananas. In this study, we identified 47 banana AQP genes based on the banana genome sequence. Evolutionary analysis of AQPs from banana, Arabidopsis, poplar, and rice indicated that banana AQPs (MaAQPs) were clustered into four subfamilies. Conserved motif analysis showed that all banana AQPs contained the typical AQP-like or major intrinsic protein (MIP) domain. Gene structure analysis suggested the majority of MaAQPs had two to four introns with a highly specific number and length for each subfamily. Expression analysis of MaAQP genes during fruit development and postharvest ripening showed that some MaAQP genes exhibited high expression levels during these stages, indicating the involvement of MaAQP genes in banana fruit development and ripening. Additionally, some MaAQP genes showed strong induction after stress treatment and therefore, may represent potential candidates for improving banana resistance to abiotic stress. Taken together, this study identified some excellent tissue-specific, fruit development- and ripening-dependent, and abiotic stress-responsive candidate MaAQP genes, which could lay a solid foundation for genetic improvement of banana cultivars.

Graphical Abstract

1. Introduction

Aquaporins (AQPs), belonging to the major intrinsic protein (MIP) superfamily, function to selectively control the flow of water and other small molecules, such as CO2, glycerol, and boron, through biological membranes [1,2,3,4,5]. AQPs exist in bacteria, fungi, animals, and plants [6]. AQPs of most plant species are typically subdivided into four major groups based on amino acid sequence homology and protein subcellular localization [7], including plasma membrane intrinsic proteins (PIPs) [8], tonoplast intrinsic proteins (TIPs) [9], nodulin 26-like intrinsic proteins (NIPs) [10], and small basic intrinsic proteins (SIPs) [11]. Three additional subfamilies, including GlpF-like intrinsic proteins (GIPs), the hybrid intrinsic proteins (HIPs), and uncategorized members designated X intrinsic proteins (XIPs), have been recently reported in the nonvascular moss Physcomitrella patens [12,13]. XIPs are found in protozoa, fungi, and certain land plant species, such as Populus trichocarpa, Nicotiana tabacum, Solanum lycopersicon, and Solanum tuberosum [14].
There are highly conserved structures in plant AQPs, in which six membrane-spanning α-helices are linked by five short loops with their N- and C-termini always towards the cytosol [15]. Two of these loops (Loop B and E) contain highly conserved Asp-Pro-Ala (NPA) motifs which play a major role in the formation of water-selective channels [11]. Other important residues in aquaporin sequences are the ones forming the aromatic/arginine selectivity filter (ar/R). This region is formed by four residues towards the extracellular side approximately 8 Å from the NPA region. The four residues are contributed by helix2 (H2), helix 5 (H5), and loop E (LE1 and LE2) [16,17]. The ar/R region has been considered to serve as a selectivity filter for the transport of substrates, determine the transport rate of the protein by acting as a size-exclusion barrier, and provide key hydrogen bonds and van der Waals contacts for the transported solutes and/or water molecules [18].
AQPs effectively mediate fast transmembrane transport of water during plant growth and development processes, such as seed germination, cell elongation, stomatal movement, phloem loading and unloading, and reproductive growth [19,20,21]. Physiological and biochemical evidence has shown that phosphorylation of a putative plasma membrane AQP (PM-AQP) leads to activation of water channels and regulates temperature-dependent opening of tulip petals [20]. Another study demonstrated that expression of RcPIP2-1 correlated with the elongation activity of etiolated hypocotyls, and the elongating regions of the hypocotyls showed high hydraulic conductivity [19]. Moreover, genetic analysis also revealed the crucial roles of AQPs in plant growth and development processes. GhPIP2 proteins were reported to form hetero-oligomers to modulate their activities in rapid fiber elongation of cotton [21]. Collectively, these studies support that transport of water driven by AQPs is involved in plant growth and development processes.
A large number of studies have also suggested that abiotic stress, including drought, salt, and cold, could induce transcriptional accumulation of AQPs, and further genetic analysis has confirmed the function of AQPs in plants tolerant to abiotic stress [22,23]. TaAQP7 and TaAQP8 expression was shown to be induced after drought and salt treatments, respectively, and overexpression of TaAQP7 and TaAQP8 in tobacco was found to result in improved resistance to drought and salt stresses, respectively [22,23]. MusaPIP1;2-overexpressing banana plants have shown increased resistance to drought, salt, and cold stresses [15]. Heterologous expression of banana MaPIP1;1 in Arabidopsis was shown to confer tolerance to salt and drought stress by reducing membrane injury, improving ion distribution, and maintaining osmotic balance [24]. Recently, constitutive and stress-inducible overexpression of MusaPIP2;6 in banana was shown to lead to an increased resistance to salt stress [25]. Taken together, these results demonstrate that AQPs mainly play a positive role in plant responses to abiotic stress.
Genome-wide analyses have identified 35 AQP genes in Arabidopsis [7], 34 in rice [26,27], 36 in maize [11], and 53 in Chinese cabbage [5]. However, less information is available for this gene family in banana. Banana is a large annual monocotyledonous herbaceous plant and one of the most important fruit crops. Whole-genome sequencing of banana enables us to perform genome-wide analysis of banana genes. Since AQPs play a crucial role in plant growth, development, and responses to various stresses, this gene family was selected for genome-wide analyses in banana. In the present study, we identified 47 banana AQP (MaAQP) genes and analyzed their phylogenetic relationship, gene structure, protein motifs, and expression patterns during development, ripening, and abiotic stress. The identification and comprehensive investigation of the AQP gene family in banana will provide useful information for future research on genetic improvement of banana quality and resistance to abiotic stress.

2. Results

2.1. Identification of AQP Genes in Banana

To identify AQP family members from banana, a genome-wide search was carried out using both Hidden Markov Model and BLAST searches with 35 AQP genes from Arabidopsis and 34 AQP genes from rice as queries. A total of 47 non-redundant MaAQP genes were identified from the banana genome. All identified sequences of amino acids and full length cDNAs for banana AQPs were listed in Tables S1 and S2, respectively. Conserved domain and multiple sequence alignment analyses suggested that all identified banana AQPs contained the typical AQP family MIP domain. Prediction of transmembrane domains (TMDs) showed that most MaAQPs (26 of 47%, 55%) contained six TMDs, whereas the other 21 MaAQPs had 4, 5 or 7 predicted TMDs (Table S3). Further, we identified the NPA motifs and ar/R selectivity filter sequences of banana AQPs by multiple sequence alignment analysis with tomato AQPs as references (Table S4, Figures S1–S5) [28]. Both in the MaPIP and MaTIP subfamilies, the two NPA motifs are conserved with typical Asp-Pro-Ala residues. In the MaNIP subfamily, all the MaNIPs also show typical Asp-Pro-Ala residues, except for MaNIP3-2, where the alanine is replaced by a serine residue in the first NPA and by a valine in the second NPA. In the MaSIP subfamily, the first NPA have extensive variation, among which the alanine is replaced by threonine for MaSIP1-1 or by leucine for MaSIP2-1 and MaSIP2-2, whereas the second NPA are completely conserved. The ar/R filter showed an increased subfamily-specific sequence in comparison to the two NPA motifs. In the MaPIP subfamily, all MaPIPs showed an ar/R filter configuration typical for conserved residues in other species (F, H, T, R). In the MaTIP subfamily, the ar/R is formed by H/Q in H2, I/S/V/T in H5, A/G in LE1 and V/R in LE2. The MaNIP subfamily showed W/G/A in H2, V/S/I in H5, A/G in LE1 and R in LE2. In the MaSIP subfamily, the ar/R is constituted by L/Y/F in H2, T/K in H5, P/G in LE1 and N/S in LE2. To determine their protein characteristics, the isoelectric point (pI) and relative molecular mass (RMW) of banana AQP amino acid sequences were calculated using ExPASY (Table S5). The 47 predicted AQP proteins from banana ranged from 188 to 359 amino acid residues in length, with RMWs varying from 20.0 to 38.7 KDa. The protein characteristics of AQPs from banana and rice were compared according to their pI and RMW (Figure 1). In the PIP subfamily, the pI of most MaPIPs ranged from 9 to 10, and the RMW was approximately 20 kDa, whereas the pI of most OsPIPs ranged from 7 to 10 with a RMW of approximately 30 kDa. In the TIP subfamily, the pI of most TIPs was between 5 and 7 and the RMW was approximately 25 kDa both in banana and rice. In the NIP subfamily, the MaNIPs showed a broad RMW, whereas the OsNIPs displayed a wide range of pI. In the SIP subfamily, most SIPs from banana and rice showed similar RMW and pI. Generally, the protein characteristics of PIP and NIP subfamilies in banana were different from that in rice, implying their functional diversity.
Figure 1. Putative isoelectric point and relative molecular weight of plasma membrane intrinsic proteins (PIPs), tonoplast intrinsic proteins (TIPs), nodulin 26-like intrinsic proteins (NIPs) and small basic intrinsic proteins (SIPs) from banana and rice with ExPASy proteomics server database. MaPIP, MaTIP, MaNIP and MaSIP indicate AQPs from banana. OsPIP, OsTIP, OsNIP and OsSIP indicate AQPs from rice.
Ijms 16 19728 g001

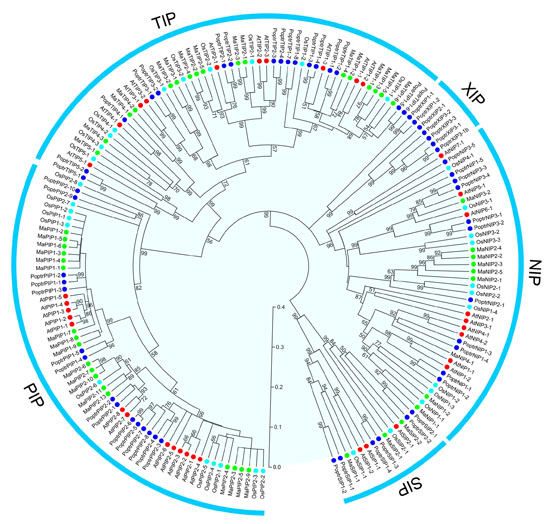
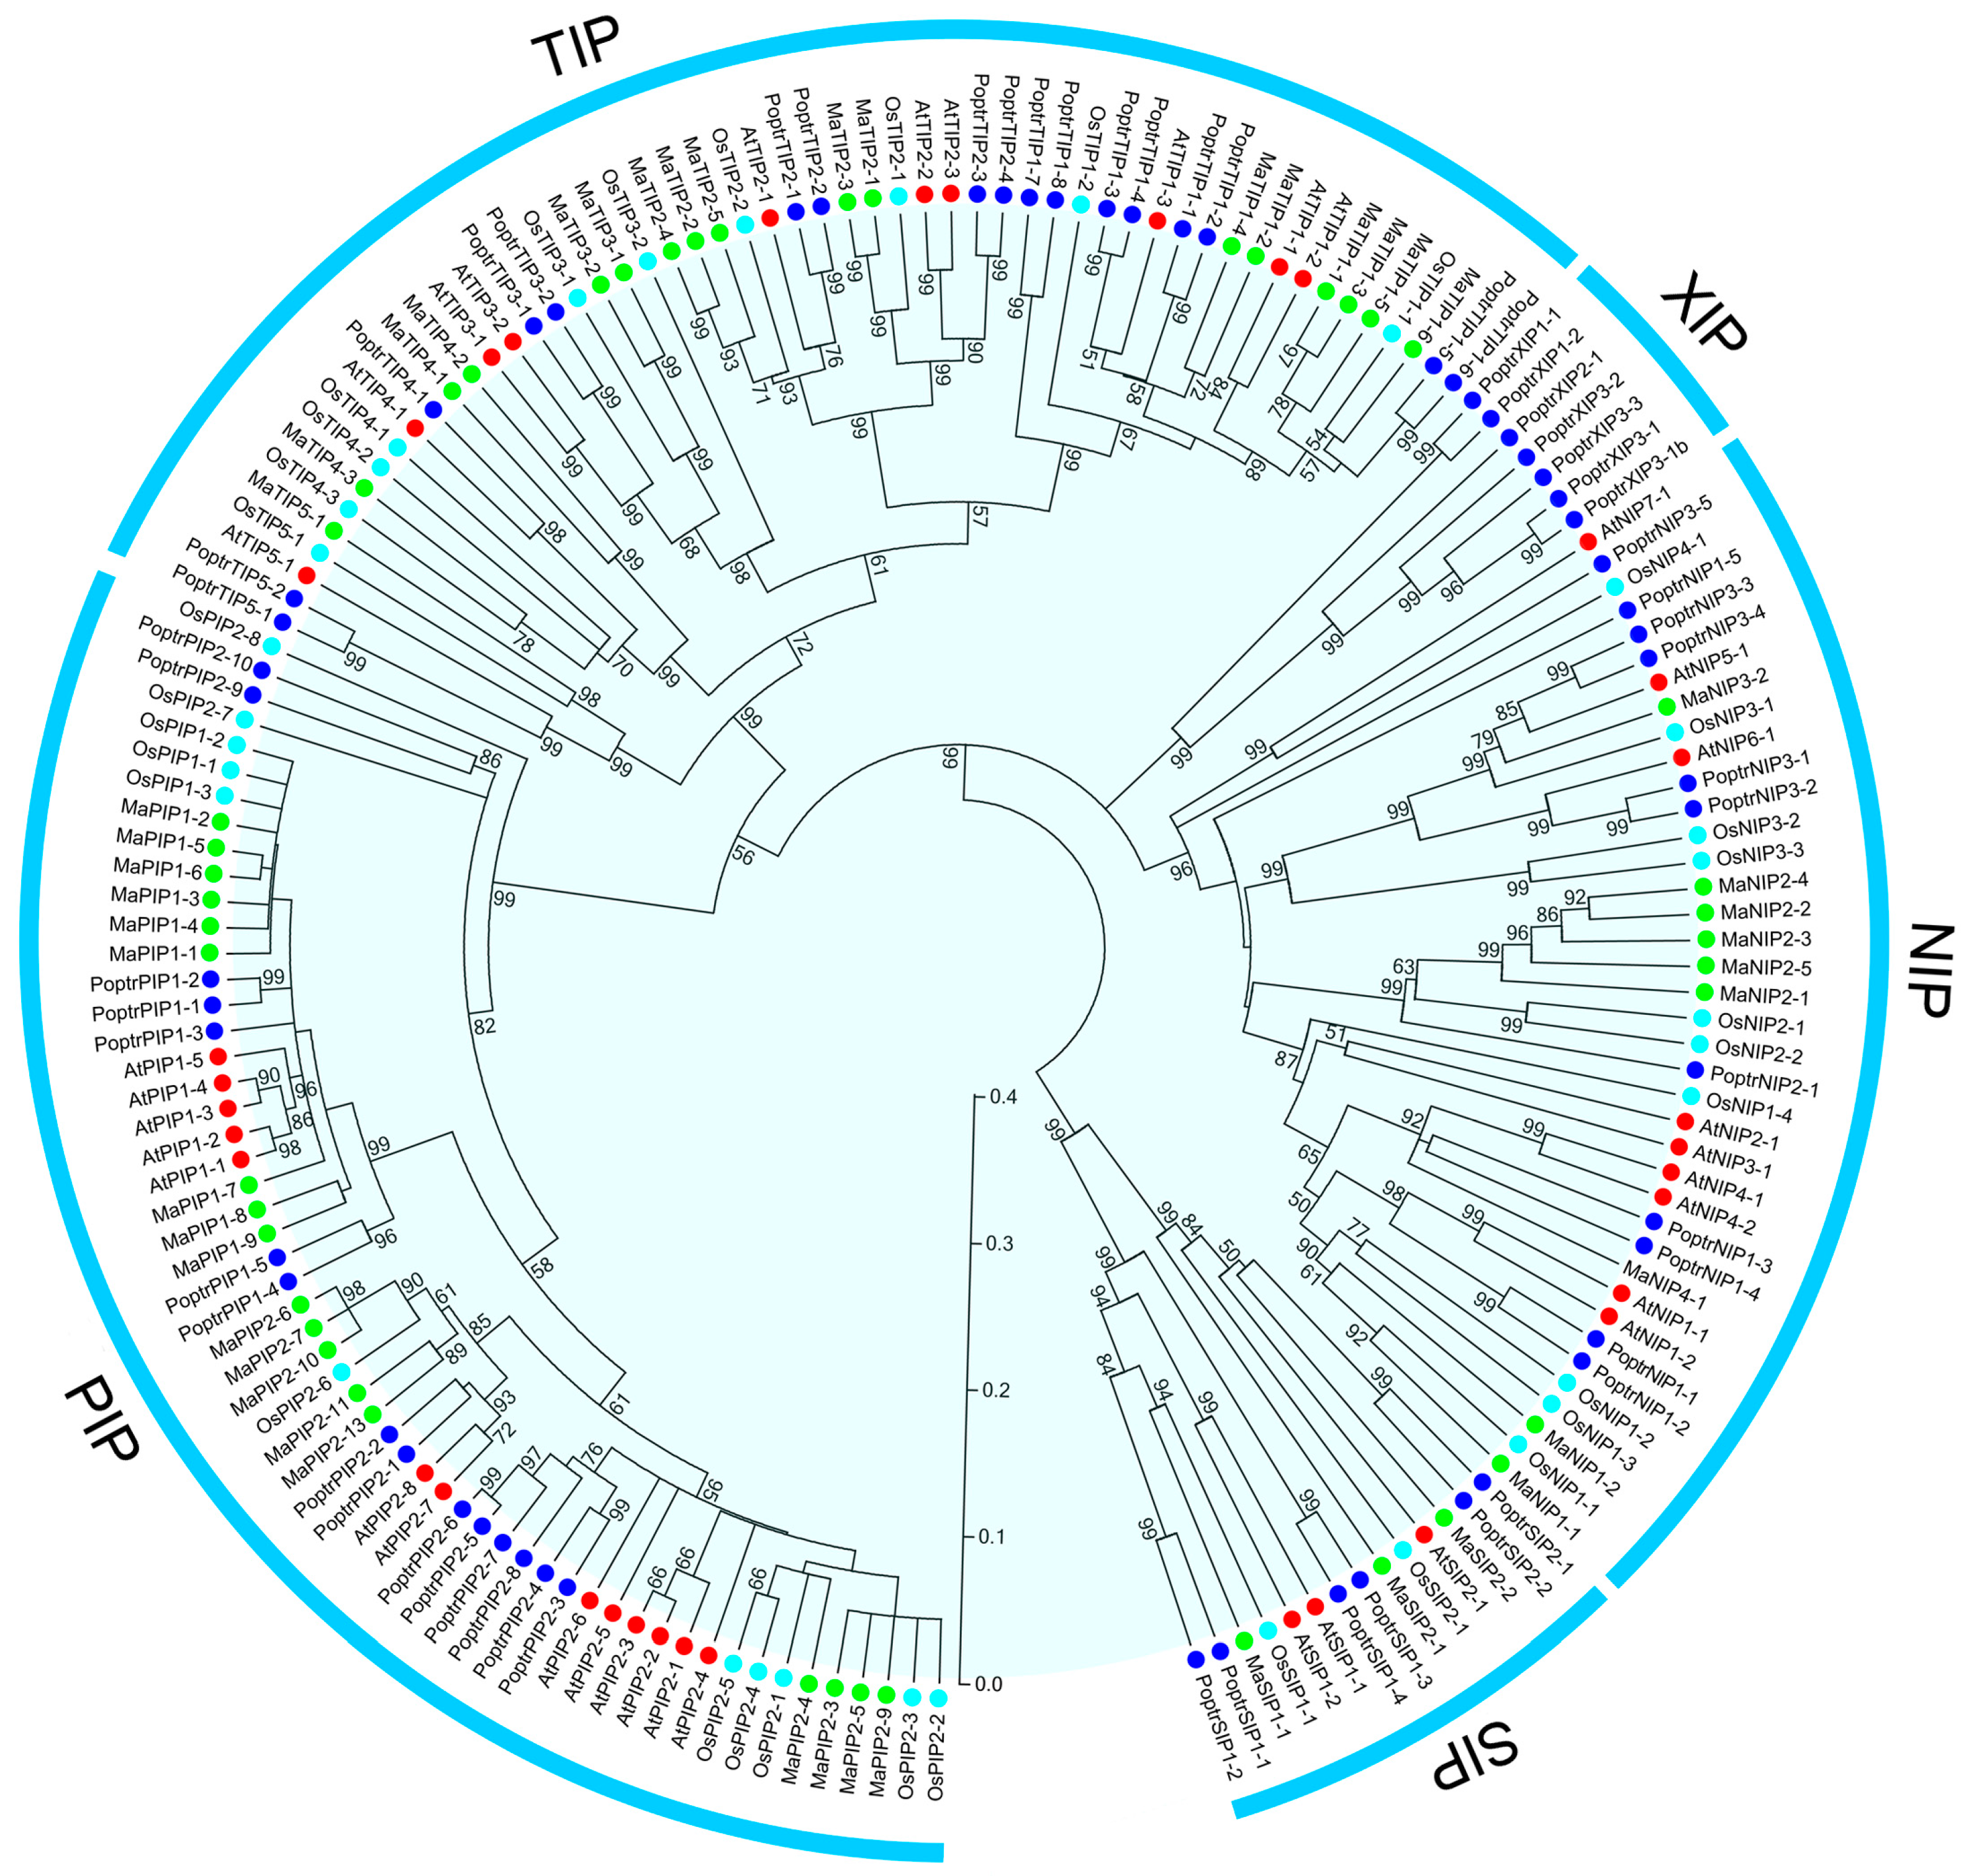
2.2. Phylogenetic Analysis of AQP Proteins

To study the evolutionary relationships between AQP proteins from banana, Arabidopsis, poplar and rice, a neighbor-joining phylogenetic tree was created based on the alignments of their amino acid sequences (Figure 2, Table S6). The results showed that all identified AQPs from banana were clearly divided into four different subfamilies (PIP, TIP, NIP, and SIP), together with AQPs from Arabidopsis, poplar and rice. No banana AQP members were assigned into the XIP subfamily branched by poplar AQPs. According to the phylogenetic relationship, 18 MaAQPs were classified as PIPs, 17 as TIPs, 9 as NIPs, and 3 as SIPs. Furthermore, the PIPs, TIPs, NIPs, and SIPs were subdivided into two, five, four, and two subgroups (PIP1 and PIP2; TIP1, TIP2, TIP3, TIP4, and TIP5; NIP1, NIPP2, NIP3, and NIP4; SIP1 and SIP2), respectively. Overall, AQPs from banana had a closer relationship with those from rice than those from Arabidopsis and poplar, which is in line with current opinions in plant evolution. Moreover, BLASTP analysis further supports the phylogenetic classification of MaAQPs with each subfamily showing high identity with AQPs from other species (Table S6).
Figure 2. Phylogenetic tree of Aquaporins (AQPs) from banana, Arabidopsis, poplar and rice. A neighbor-joining tree was constructed using ClustalX and MEGA5.0 software with 1000 bootstraps. Five subfamilies were indicated as PIP, SIP, NIP, TIP and X intrinsic proteins (XIPs). Green round, 47 AQP proteins from banana; red round, 35 AQP proteins from Arabidopsis; light blue, 33 AQP proteins from rice; dark blue, 56 AQP proteins from poplar.
Ijms 16 19728 g002

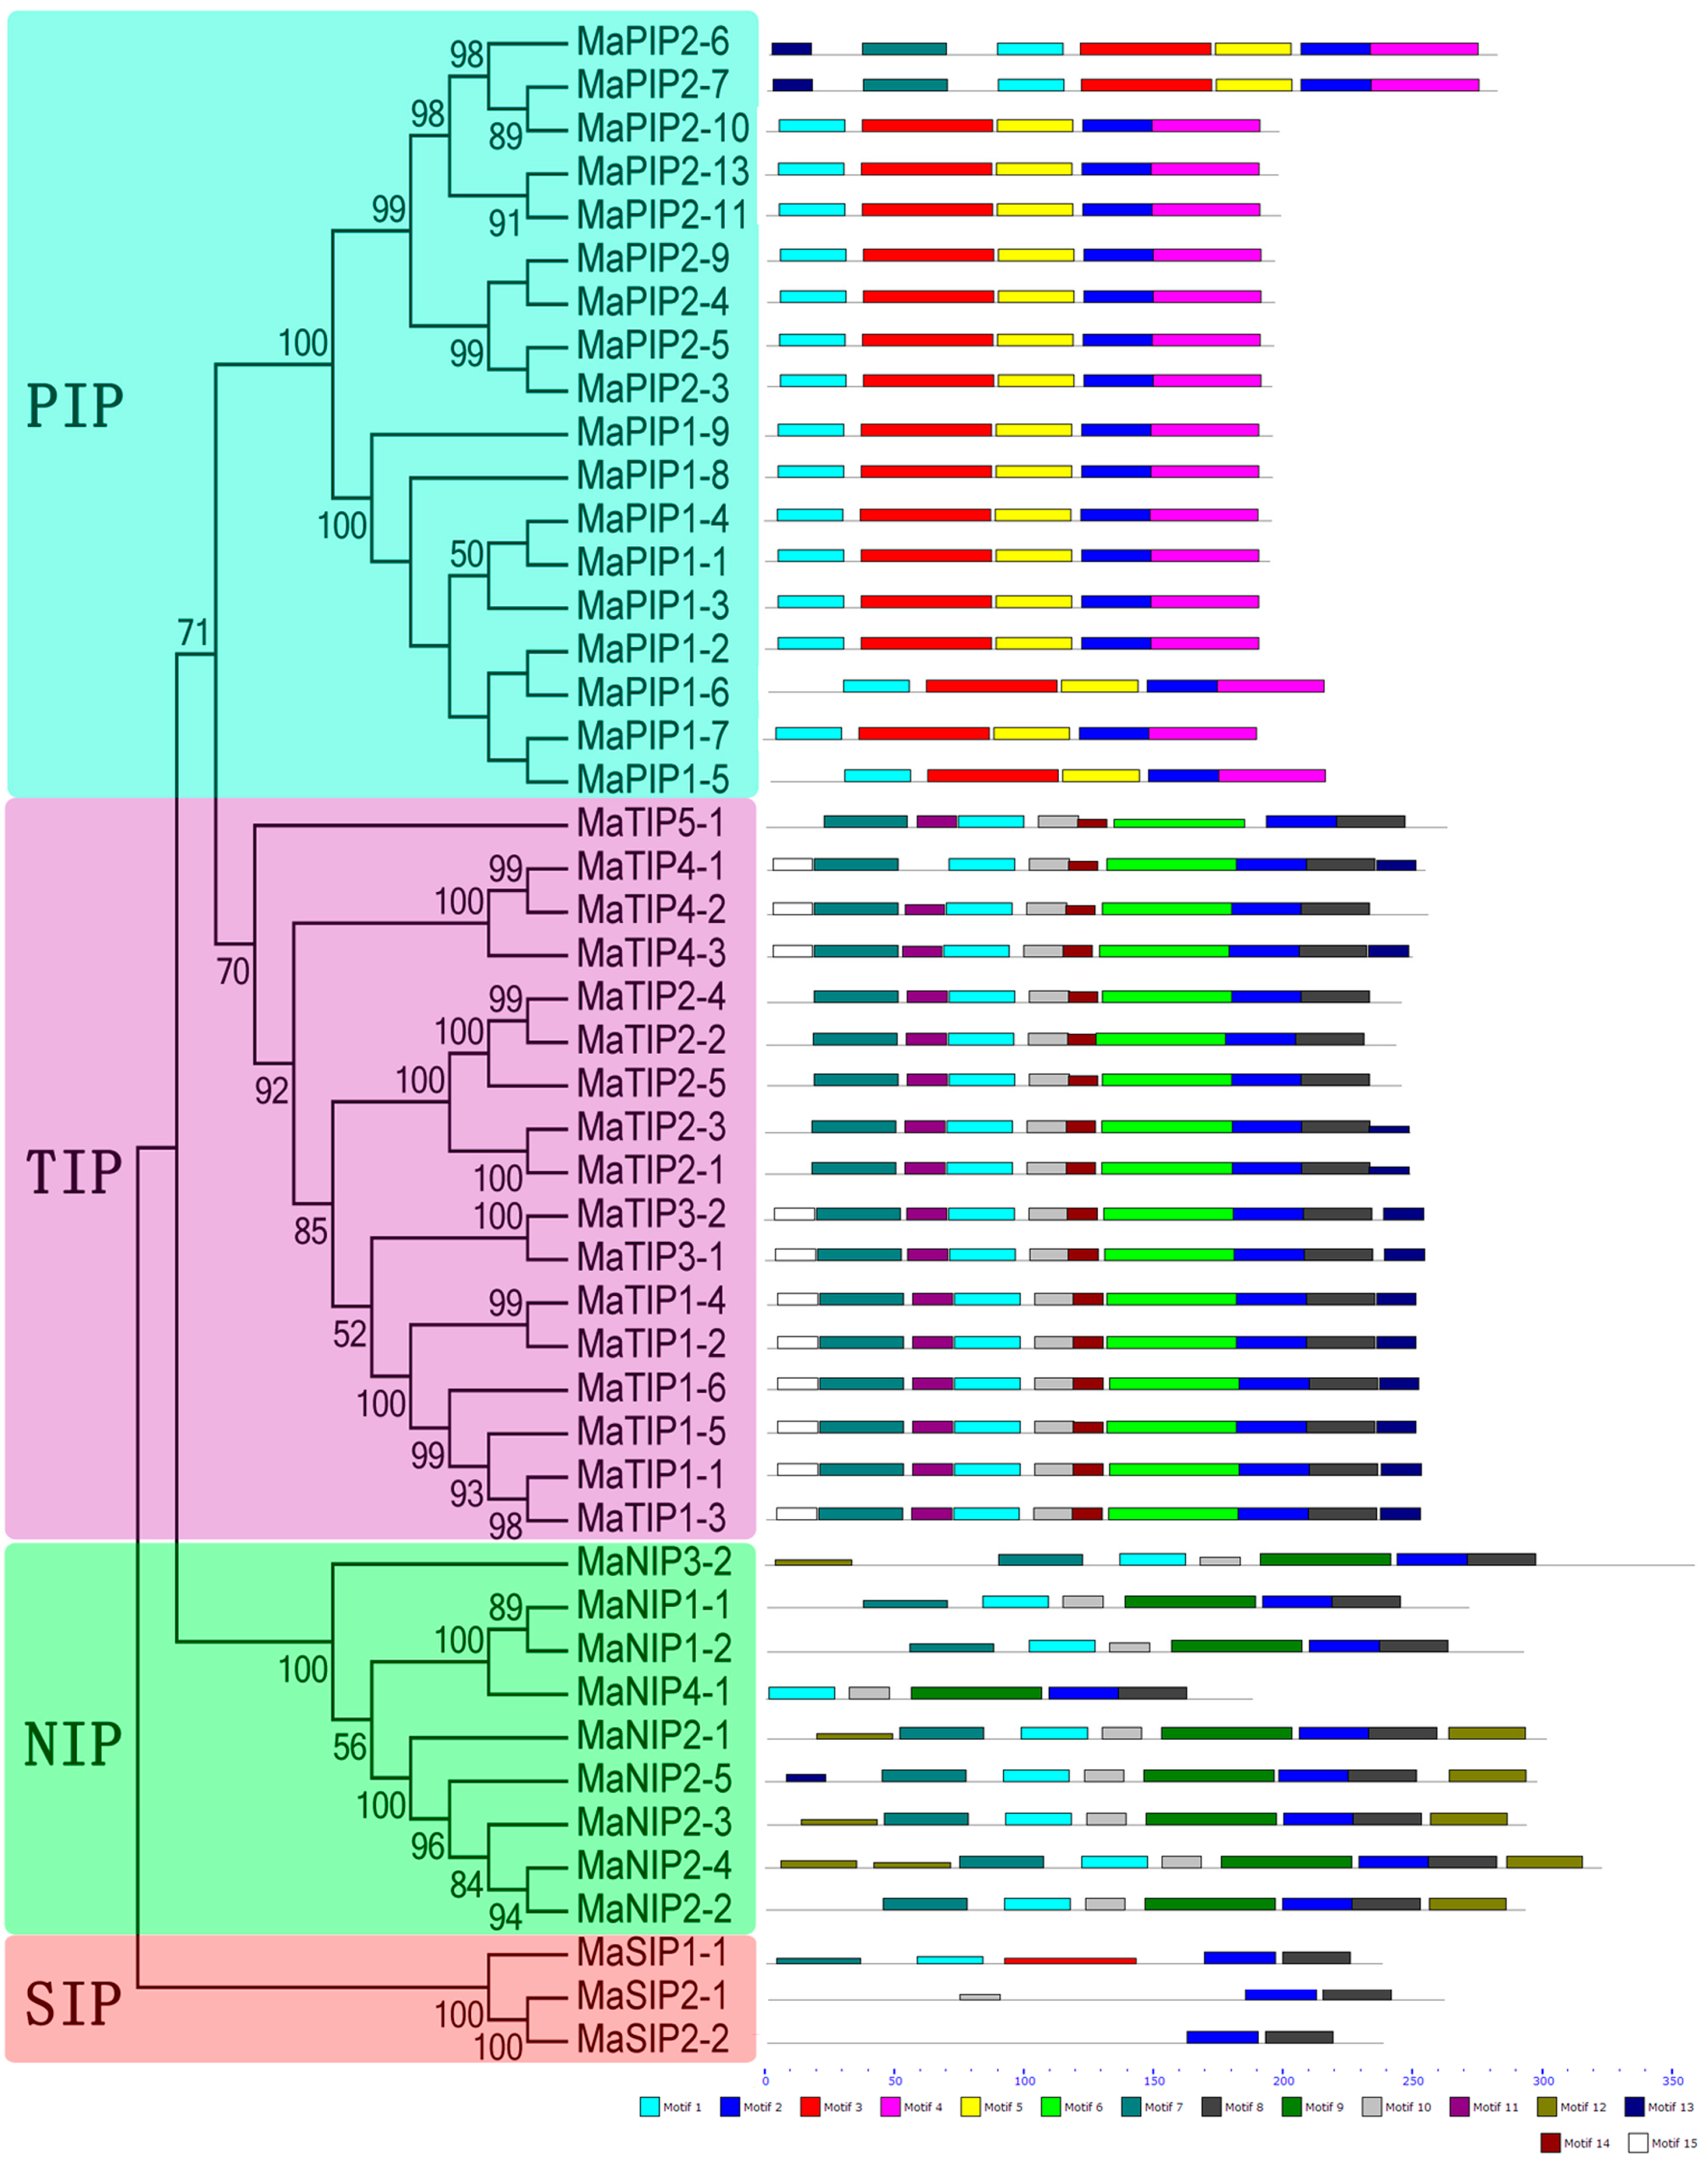
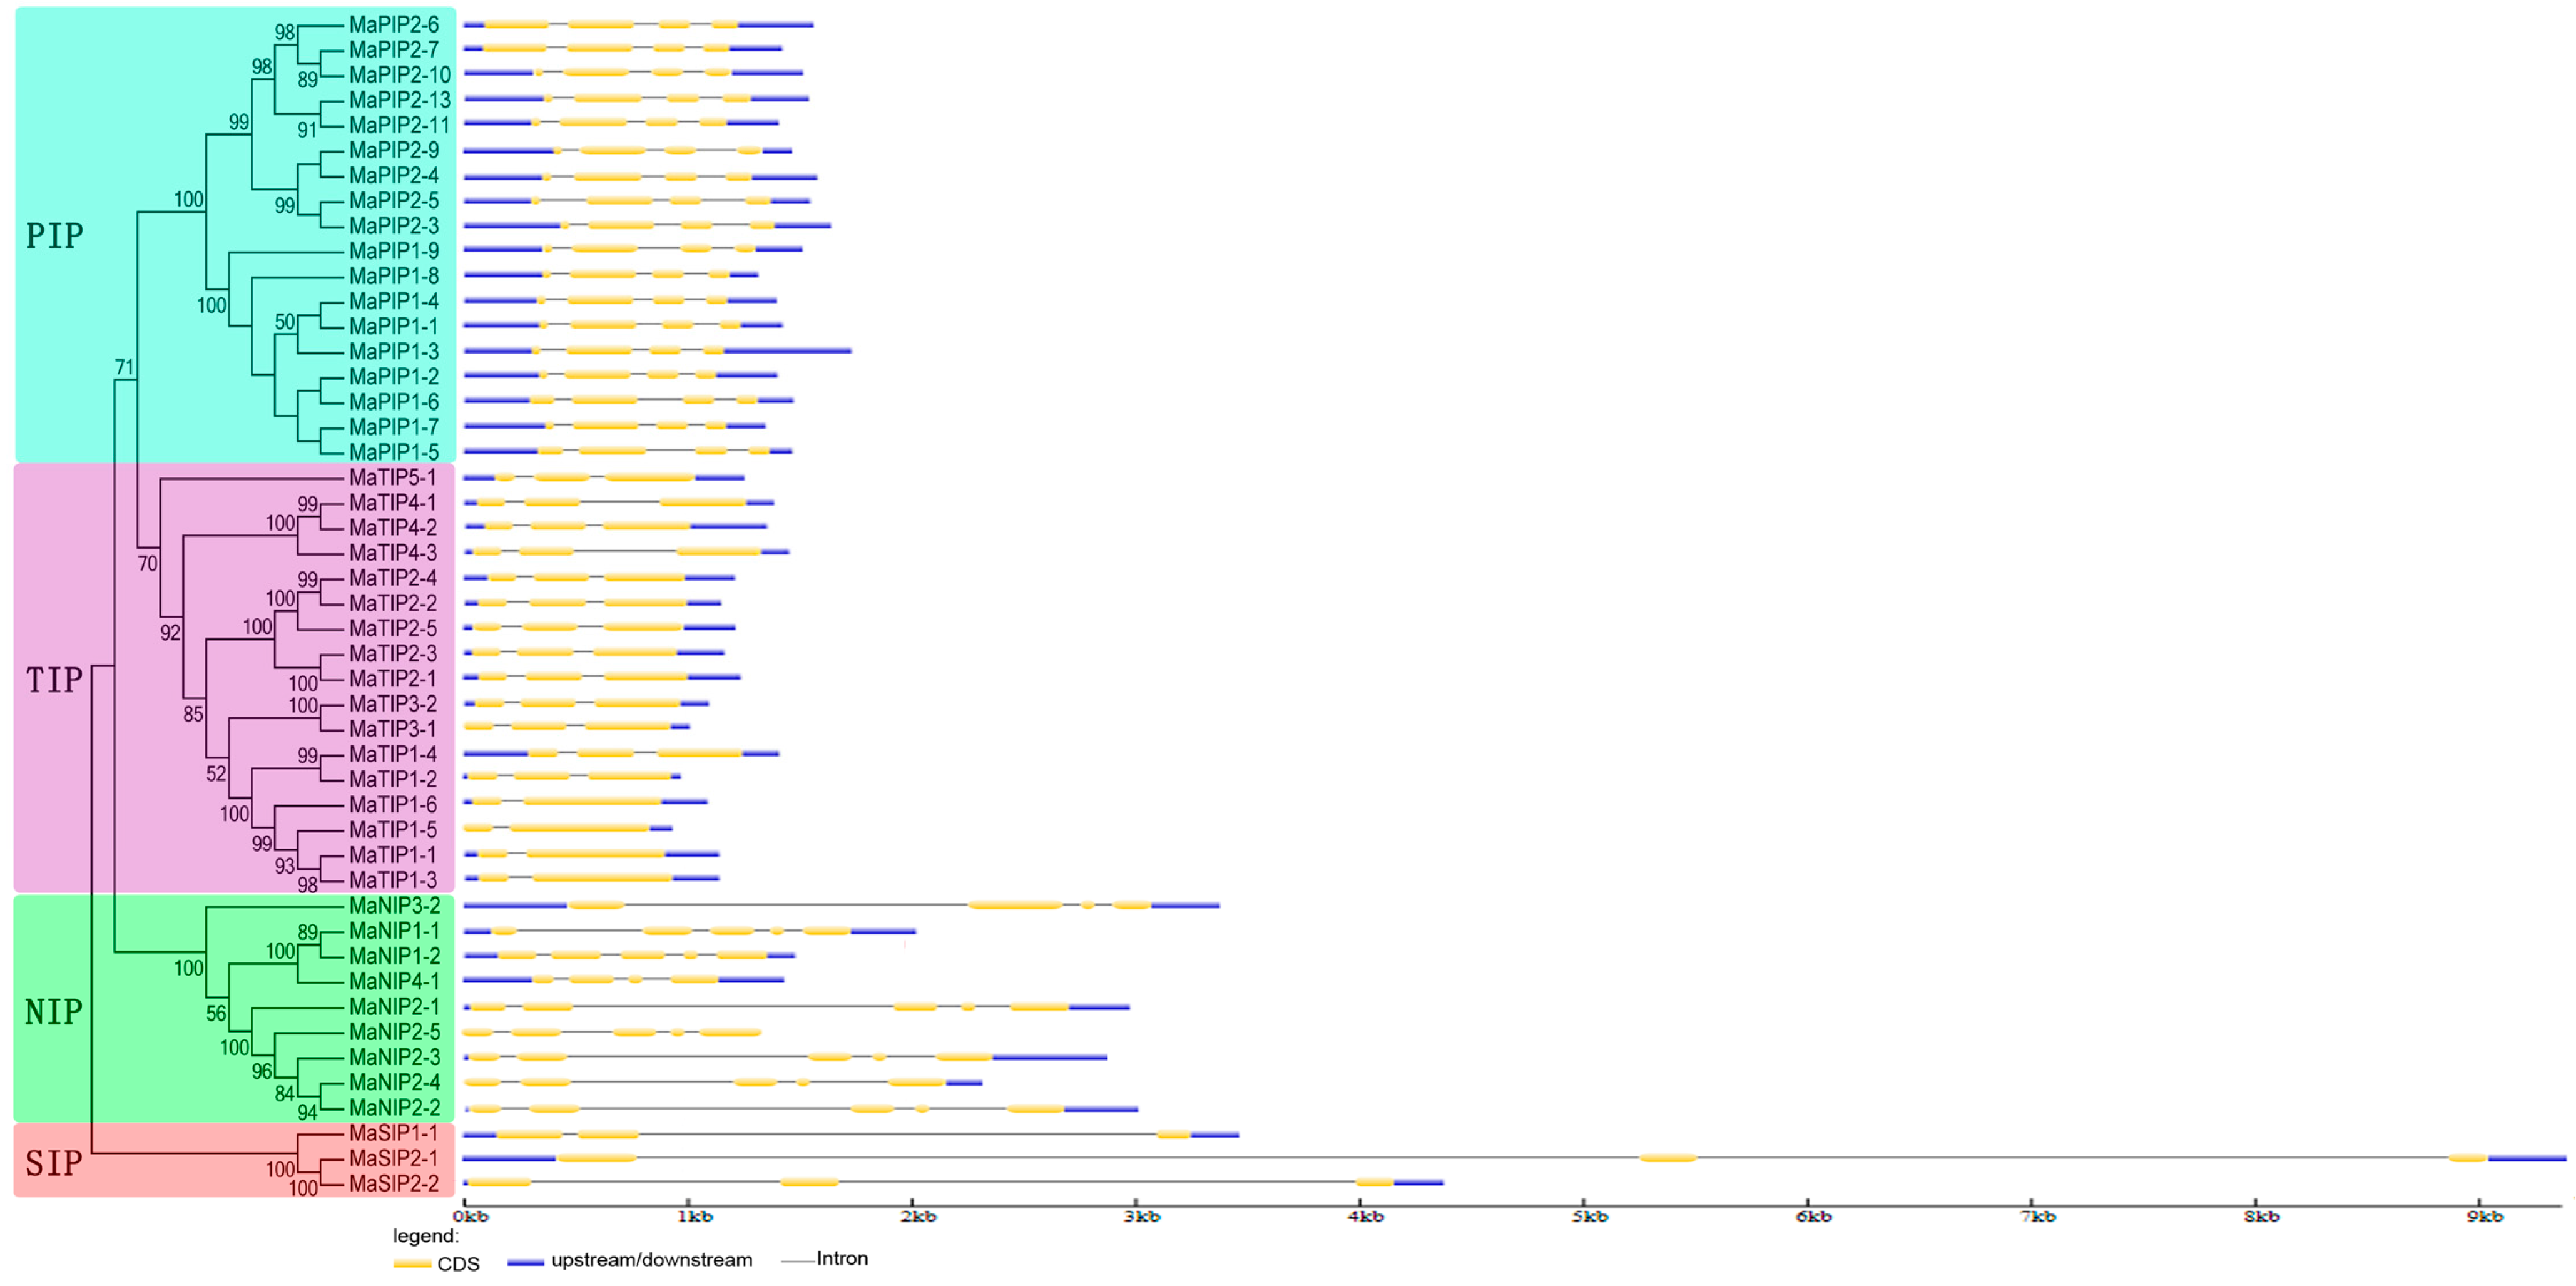
2.3. Gene Structure of AQP Genes in Banana

Exon-intron structural diversity often plays a key role in the evolution of gene families and can provide additional evidence to support phylogenetic groupings [29,30]. The exon-intron structure of MaAQP genes was detected according to their evolutionary classification. As shown in Figure 3, divergence of the AQP family is consistent with classification results presented in Figure 2. All MaPIP genes had three introns. Thirteen of the 17 MaTIP genes had two introns, while the remaining four MaTIPs contained only one intron. The number of introns in MaNIPs ranged from three to four. MaNIP1-1, MaNIP1-2, and MaNIP2-1, -2, -3, -4, and -5 had four introns; and MaNIP3-2 and MaNIP4-1 contained three. All MaSIP genes contained two long introns. Within this frame, paralogous gene pairs generally shared highly similar exon-intron structures, such as MaPIP2-6 and MaPIP2-7, MaPIP1-3 and MaPIP1-4, and MaTIP1-1 and MaTIP1-3. On the whole, the number and length of exons and introns was highly specific for each subfamily (Figure 3). The divergent gene structures among the different phylogenetic subgroups suggest that genes evolved into diverse exon-intron structures to accomplish different functions in the banana genome.
Figure 3. Exon-intron structure analyses of banana AQPs. Exon-intron structure analyses were conducted using the GSDS database. Lengths of exons and introns of each MaAQP gene are displayed proportionally.
Ijms 16 19728 g003

2.4. Conserved Motifs of AQP Proteins in Banana

To detect the structural diversity and predict the function of MaAQP proteins, a total of 15 conserved motifs in banana AQPs were found by MEME software and further annotated by InterPro Scan 5 (Figure 4, Table S7). The results showed that nine (1–9) out of 15 motifs were annotated as AQP-like or MIP domains, which are basic characteristics of the AQP family. All MaAQP proteins identified contained these conserved domains. All AQPs in the PIP subfamily contained motifs 1–5. Moreover, closely related MaPIP2-6 and MaPIP2-7 also had motifs 7 and 13, in addition to motifs 1–5. In the TIP subfamily, all members contained motifs 1, 2, 6–8, 10, and 14. In the SIP subfamily, all three members contained motifs 2 and 8. In the NIP subfamily, all members had motifs 1, 2, and 8–10. Thus, each subfamily of banana AQP shared the same conserved motifs, which supports the phylogenetic classification of the banana AQP family.
Figure 4. Motif analyses of banana AQPs. All motifs were identified by the MEME database with complete amino acid sequences of MaAQPs. Lengths of motifs for each MaAQP protein are displayed proportionally.
Ijms 16 19728 g004

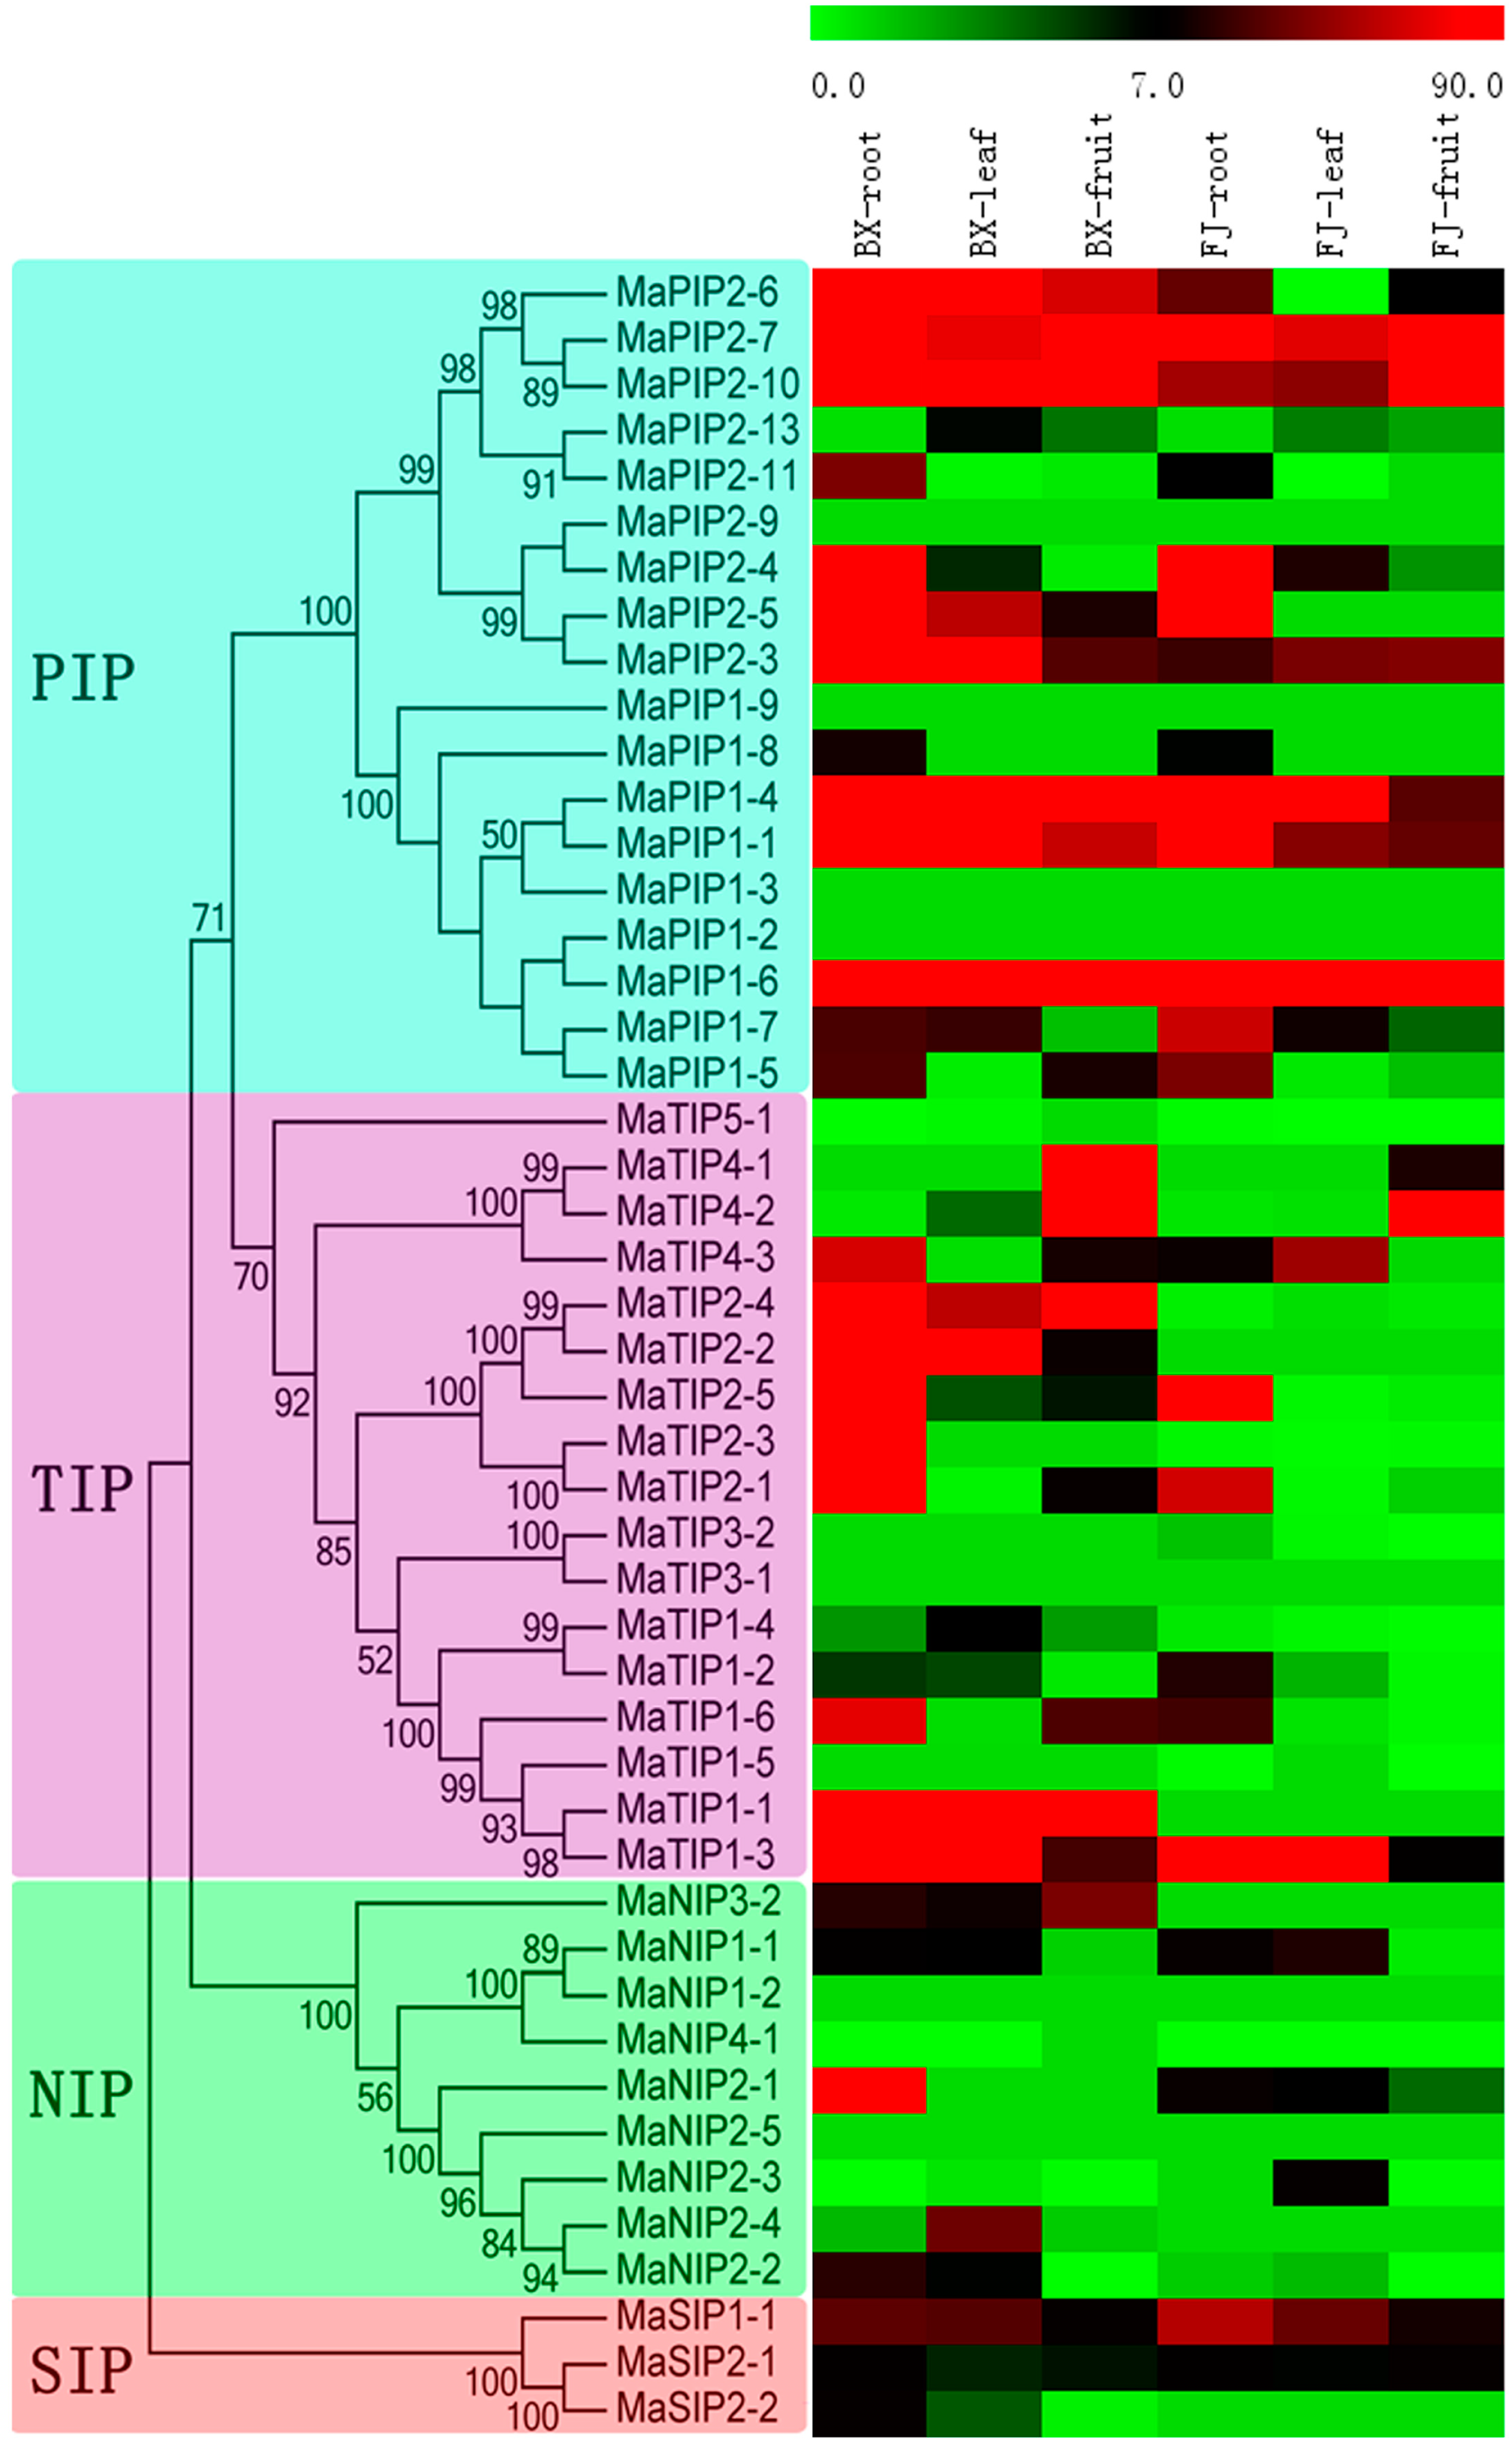
2.5. Expression Analysis of MaAQP Genes in Different Tissues of Two Banana Varieties

To provide some clues on the roles of MaAQP genes in banana growth and development, expression profiles of AQP genes in different organs, including roots, leaves, and fruits, were tested in two cultivated banana varieties, BaXi Jiao (Musa acuminate L. AAA group cv. Cavendish; hereafter referred to as BX) and Fen Jiao (Musa ABB Pisang Awak; hereafter referred to as FJ). The transcripts of 40 MaAQP genes (except for MaPIP2-9, MaPIP1-9, MaPIP1-3, MaPIP1-2, MaTIP3-1, MaNIP1-2 and MaNIP2-5) were captured based on transcriptomic data from each organ, and then a heat-map with phylogenetic analysis was produced to show the expression patterns of MaAQP genes in different organs (Figure 5, Table S8).
In BX, 92.5% (37/40), 85% (34/40), and 82.5% (33/40) of MaAQP genes were expressed in roots, leaves, and fruits, respectively, with 78.4% (29/37), 52.9% (18/34), and 66.7% (20/33) of MaAQP genes showing high expression levels (value > 7) in roots, leaves, and fruits, respectively. Additionally, 80% (32/40) of MaAQP genes were expressed in all organs examined, among which 43.75% (14/32) showed high expression levels (value > 7) in all three organs. In FJ, MaAQP genes with transcription accumulation accounted for 82.5% (33/40), 77.5% (31/40), and 80% (32/40) in roots, leaves, and fruits, respectively, with 66.67% (22/33), 38.71% (12/31), and 34.38% (11/32) showing high expression levels (value > 7) in roots, leaves, and fruits, respectively. Additionally, 72.5% (29/40) of MaAQP genes were expressed in all organs examined, with 24.14% (7/29) showing high expression levels (value > 7) in all three organs.
Comparison of MaAQP gene expression patterns in the different organs of the two banana varieties showed there were more MaAQP genes with high expression levels (value > 7) in all organs of BX than FJ, implying MaAQP genes have a greater contribution to organ development in BX plants. Notably, MaTIP1-1 and MaNIP3-2 showed high expression levels (value > 13) in all three organs of BX, whereas there was no transcription accumulation in FJ. Accordingly, MaTIP2-4 also had extremely high expression levels (value > 59) in all three organs of BX, but low transcription accumulation (value < 1) in FJ. This suggests the crucial roles of these genes in BX organ development. It is important to note that 55% (22/40) of MaAQP genes were expressed in all three organs of BX and FJ, and MaPIP2-10, MaPIP1-1, MaPIP2-3, MaPIP1-4, MaPIP2-7, and MaSIP1-1 showed high expression levels (value > 7) in all three organs of BX and FJ.
Additionally, some closely related MaAQP genes showed similar expression patterns in different tissues, among which MaPIP2-7:MaPIP2-10 and MaPIP1-1:PIP1-4 had high expression levels, while MaPIP2-13:MaPIP2-11, MaTIP1-4:MaTIP1-2 and MaSIP2-1:MaSIP2-2 exhibited low expression levels. Conversely, some closely related MaAQP genes showed differentially expressed patterns in different tissues, including MaPIP2-5:MaPIP2-3 and MaTIP1-1:MaTIP1-3.

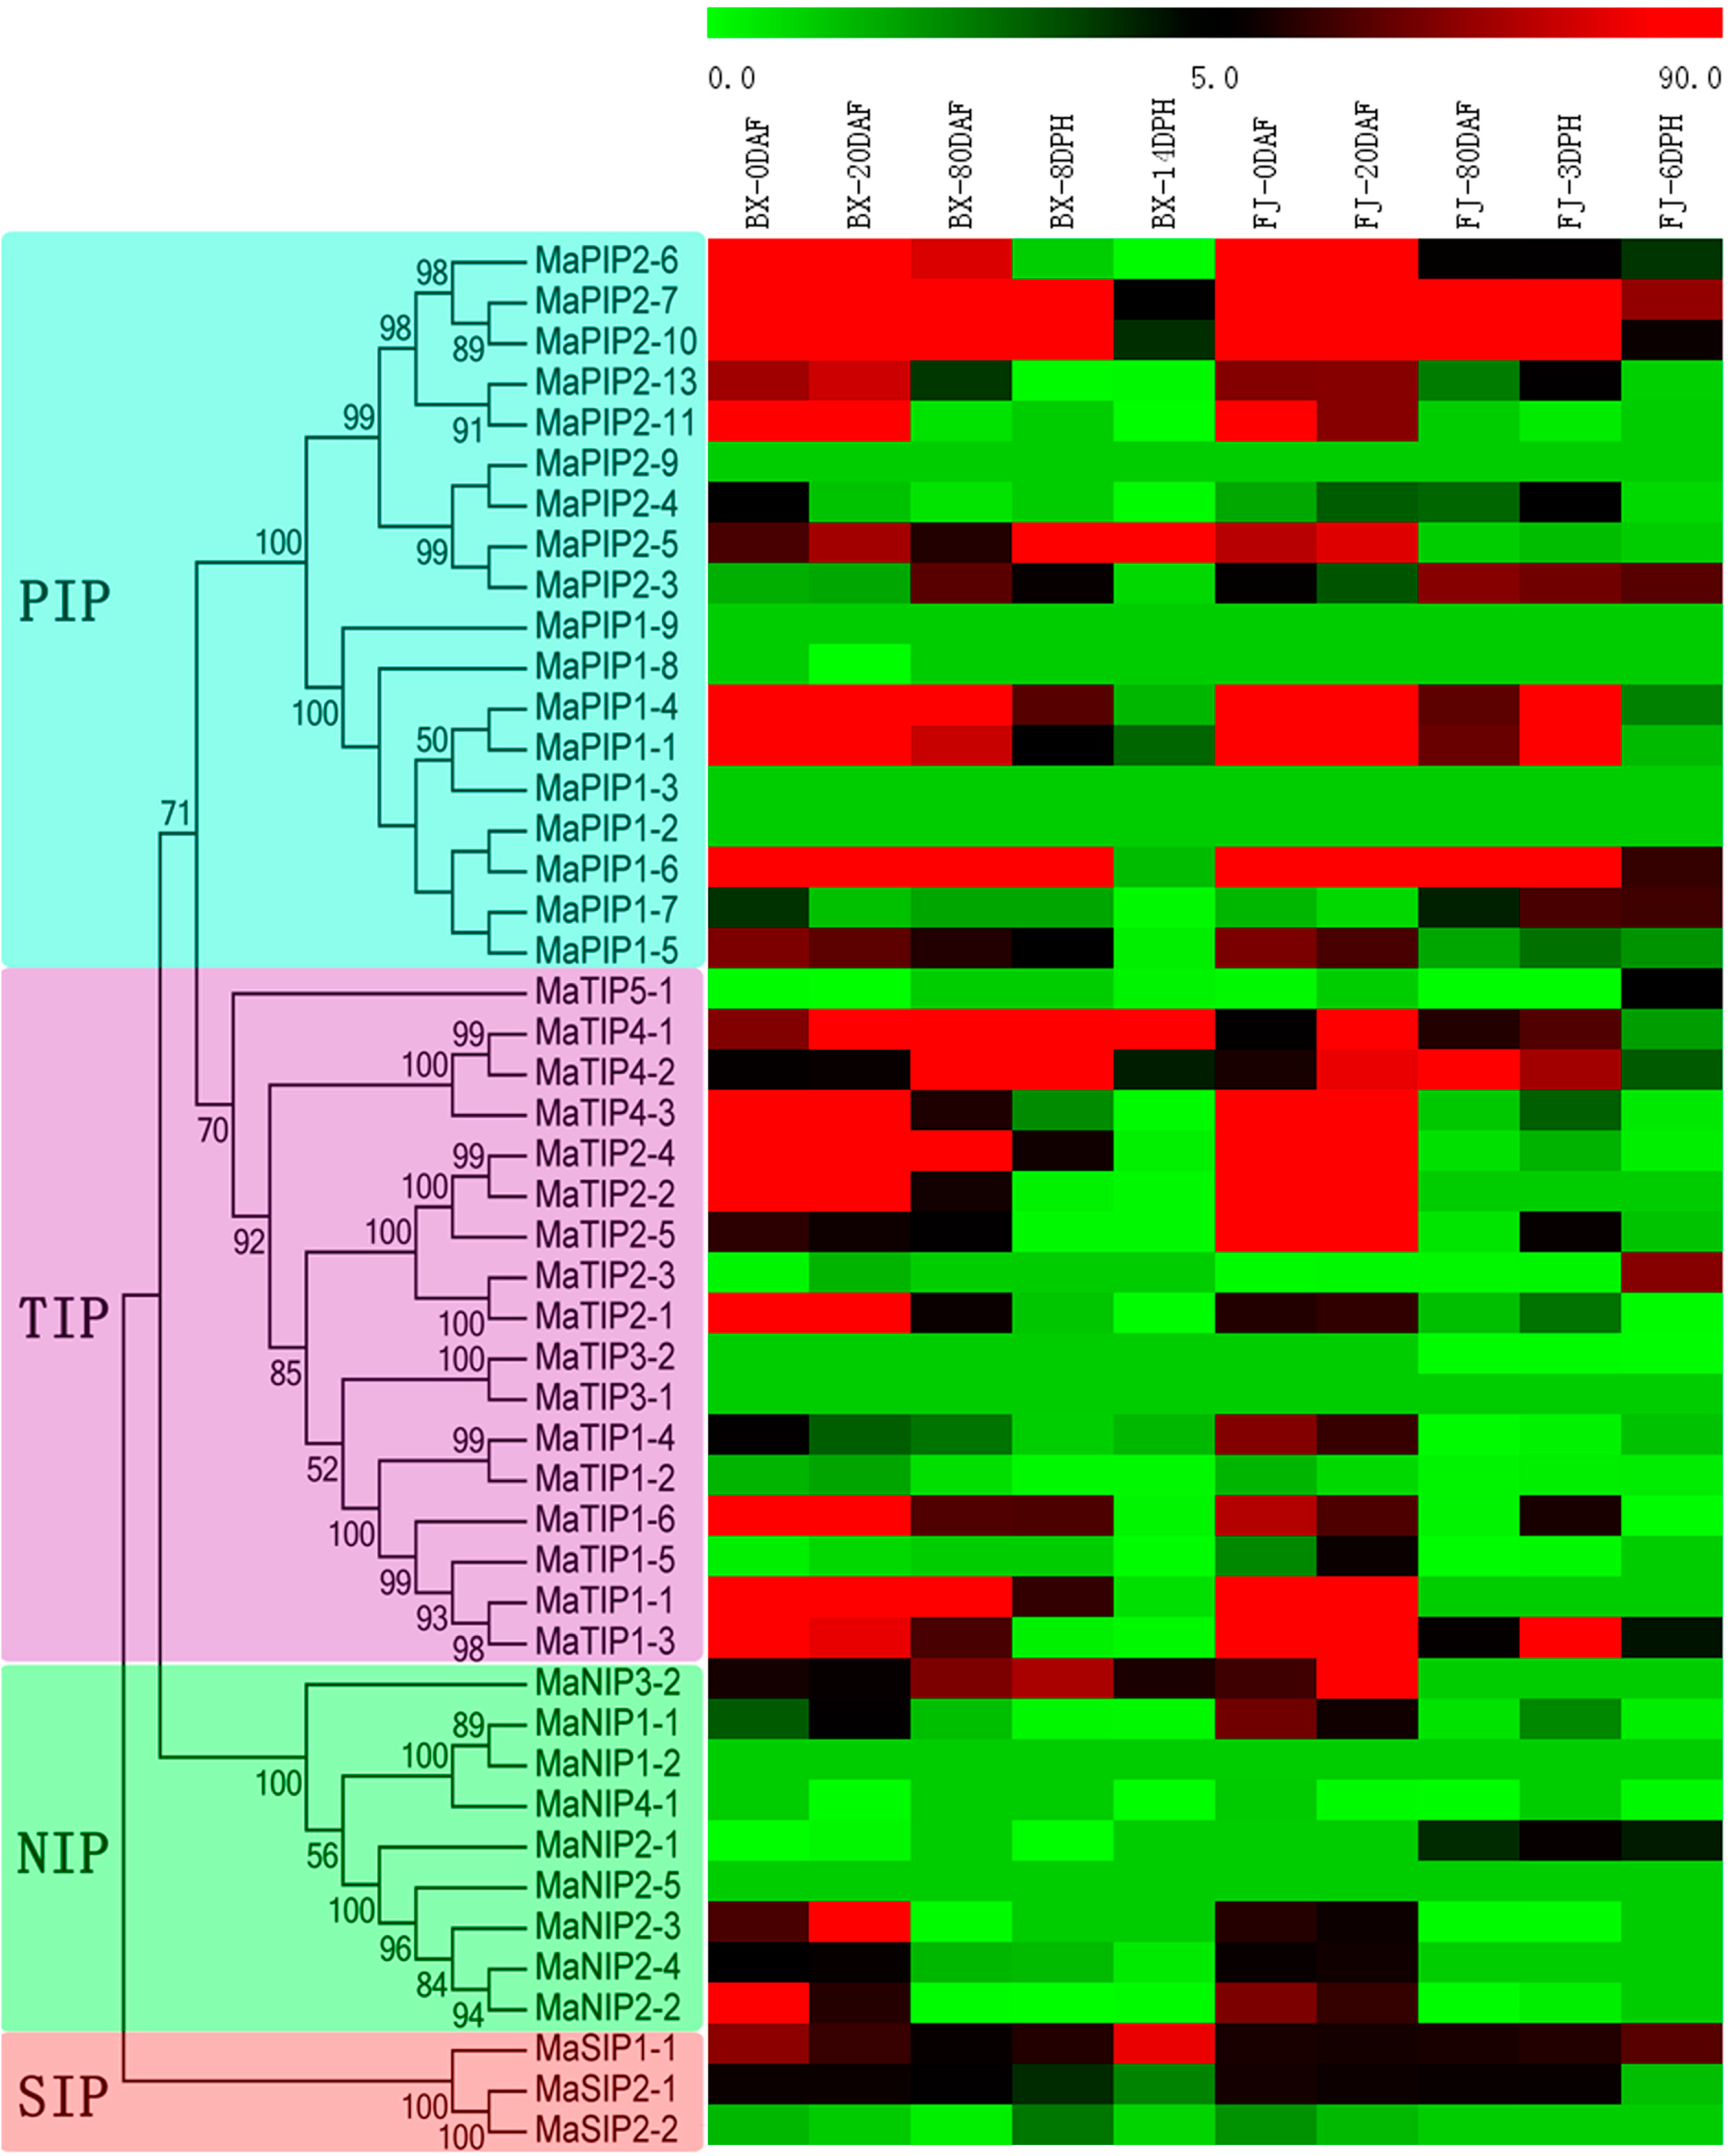
2.6. Expression Analysis of MaAQP Genes in Different Stages of Fruit Development and Ripening of Two Banana Varieties

To investigate the possible roles of MaAQP genes in fruit development and ripening, transcriptional changes of MaAQP genes were examined at different stages of fruit development and ripening in BX and FJ. Fruit at 0, 20, and 80 DAF in BX and FJ, 8 and 14 DPH in BX, and 3 and 6 DPH in FJ were collected to determine the expression profiles of MaAQP genes. Transcriptome analyses obtained expression data from 40 MaAQP genes (except for MaPIP2-9, MaPIP1-9, MaPIP1-3, MaPIP1-2, MaTIP3-1, MaNIP1-2 and MaNIP2-5) in different stages of fruit development and ripening (Figure 6, Table S9).
In BX, 92.5% (37/40), 97.5% (39/40), 82.5% (33/40), 77.5% (31/40), and 87.5% (35/40) of MaAQP genes showed expression at 0, 20, and 80 DAF, as well as 8 and 14 DPH, respectively. Moreover, 64.87% (24/37), 61.54% (24/39), 57.58% (19/33), 38.71% (12/31) and 11.43% (4/35) of MaAQP genes exhibited high expression levels (value > 10) at 0, 20, and 80 DAF, as well as 8 and 14 DPH, respectively. In addition, 75% (30/40) of MaAQP genes were expressed at all tested fruit stages, with MaPIP2-5 and MaTIP4-1 having high expression levels (value > 10) during all stages of fruit development and ripening.
Figure 5. Expression profiles of MaAQP genes in roots, leaves, and fruits of two cultivated banana varieties. The heat-map was established based on MeV software. The scale represents signal intensity of FPKM values.
Ijms 16 19728 g005
Figure 6. Expression profiles of MaAQP genes at different stages of fruit development and ripening of two cultivated banana varieties. The heat-map was established based on MeV software. The scale represents signal intensity of FPKM values.
Ijms 16 19728 g006
In FJ, transcriptional accumulation accounted for 92.5% (37/40), 90% (36/40), 75% (30/40), 82.5% (33/40), and 72.5% (29/40) of MaAQP genes 0, 20, and 80 DAF, as well as 3 and 6 DPH, respectively. Moreover, 72.97% (27/37), 80.56% (29/36), 33.33% (10/30), 36.36% (12/33), and 24.14% (7/29) of MaAQP genes had high transcriptional accumulation (value > 10) at 0, 20, and 80 DAF, as well as 3 and 6 DPH, respectively. Additionally, 62.5% (25/40) of MaAQP genes were expressed at all tested stages, with MaPIP2-10, MaPIP1-6, MaPIP2-7, and MaSIP1-1 having high expression levels (value > 10) during all stages of fruit development and ripening.
Generally, similar expression patterns were observed in the examined stages of fruit development and ripening in BX and FJ. The number of MaAQP genes with high expression levels (value > 10) was significantly greater at 0 and 20 DAF than that at the remaining stages in both BX and FJ. In BX and FJ, 55% (22/40) of MaAQP genes were expressed at all examined stages. In contrast, some MaAQP genes showed low or no expression at all stages of fruit development and ripening in BX and FJ, including MaPIP1-8, MaNIP4-1, MaTIP3-2, MaTIP5-1, MaTIP1-2, and MaSIP2-2.
Additionally, some closely related MaAQP genes displayed similar expression patterns during fruit development and ripening, including MaPIP2-7:MaPIP2-10, MaPIP2-13:MaPIP2-11, MaPIP2-9:MaPIP2-4, MaPIP1-4:MaPIP1-1 and MaTIP2-4:MaTIP2-2. In contrast, some closely related MaAQP genes showed different expression patterns, such as, MaPIP2-5:MaPIP2-3, MaPIP1-7:MaPIP1-5, MaTIP4-1:MaTIP4-2 and MaTIP2-3:MaTIP2-1.

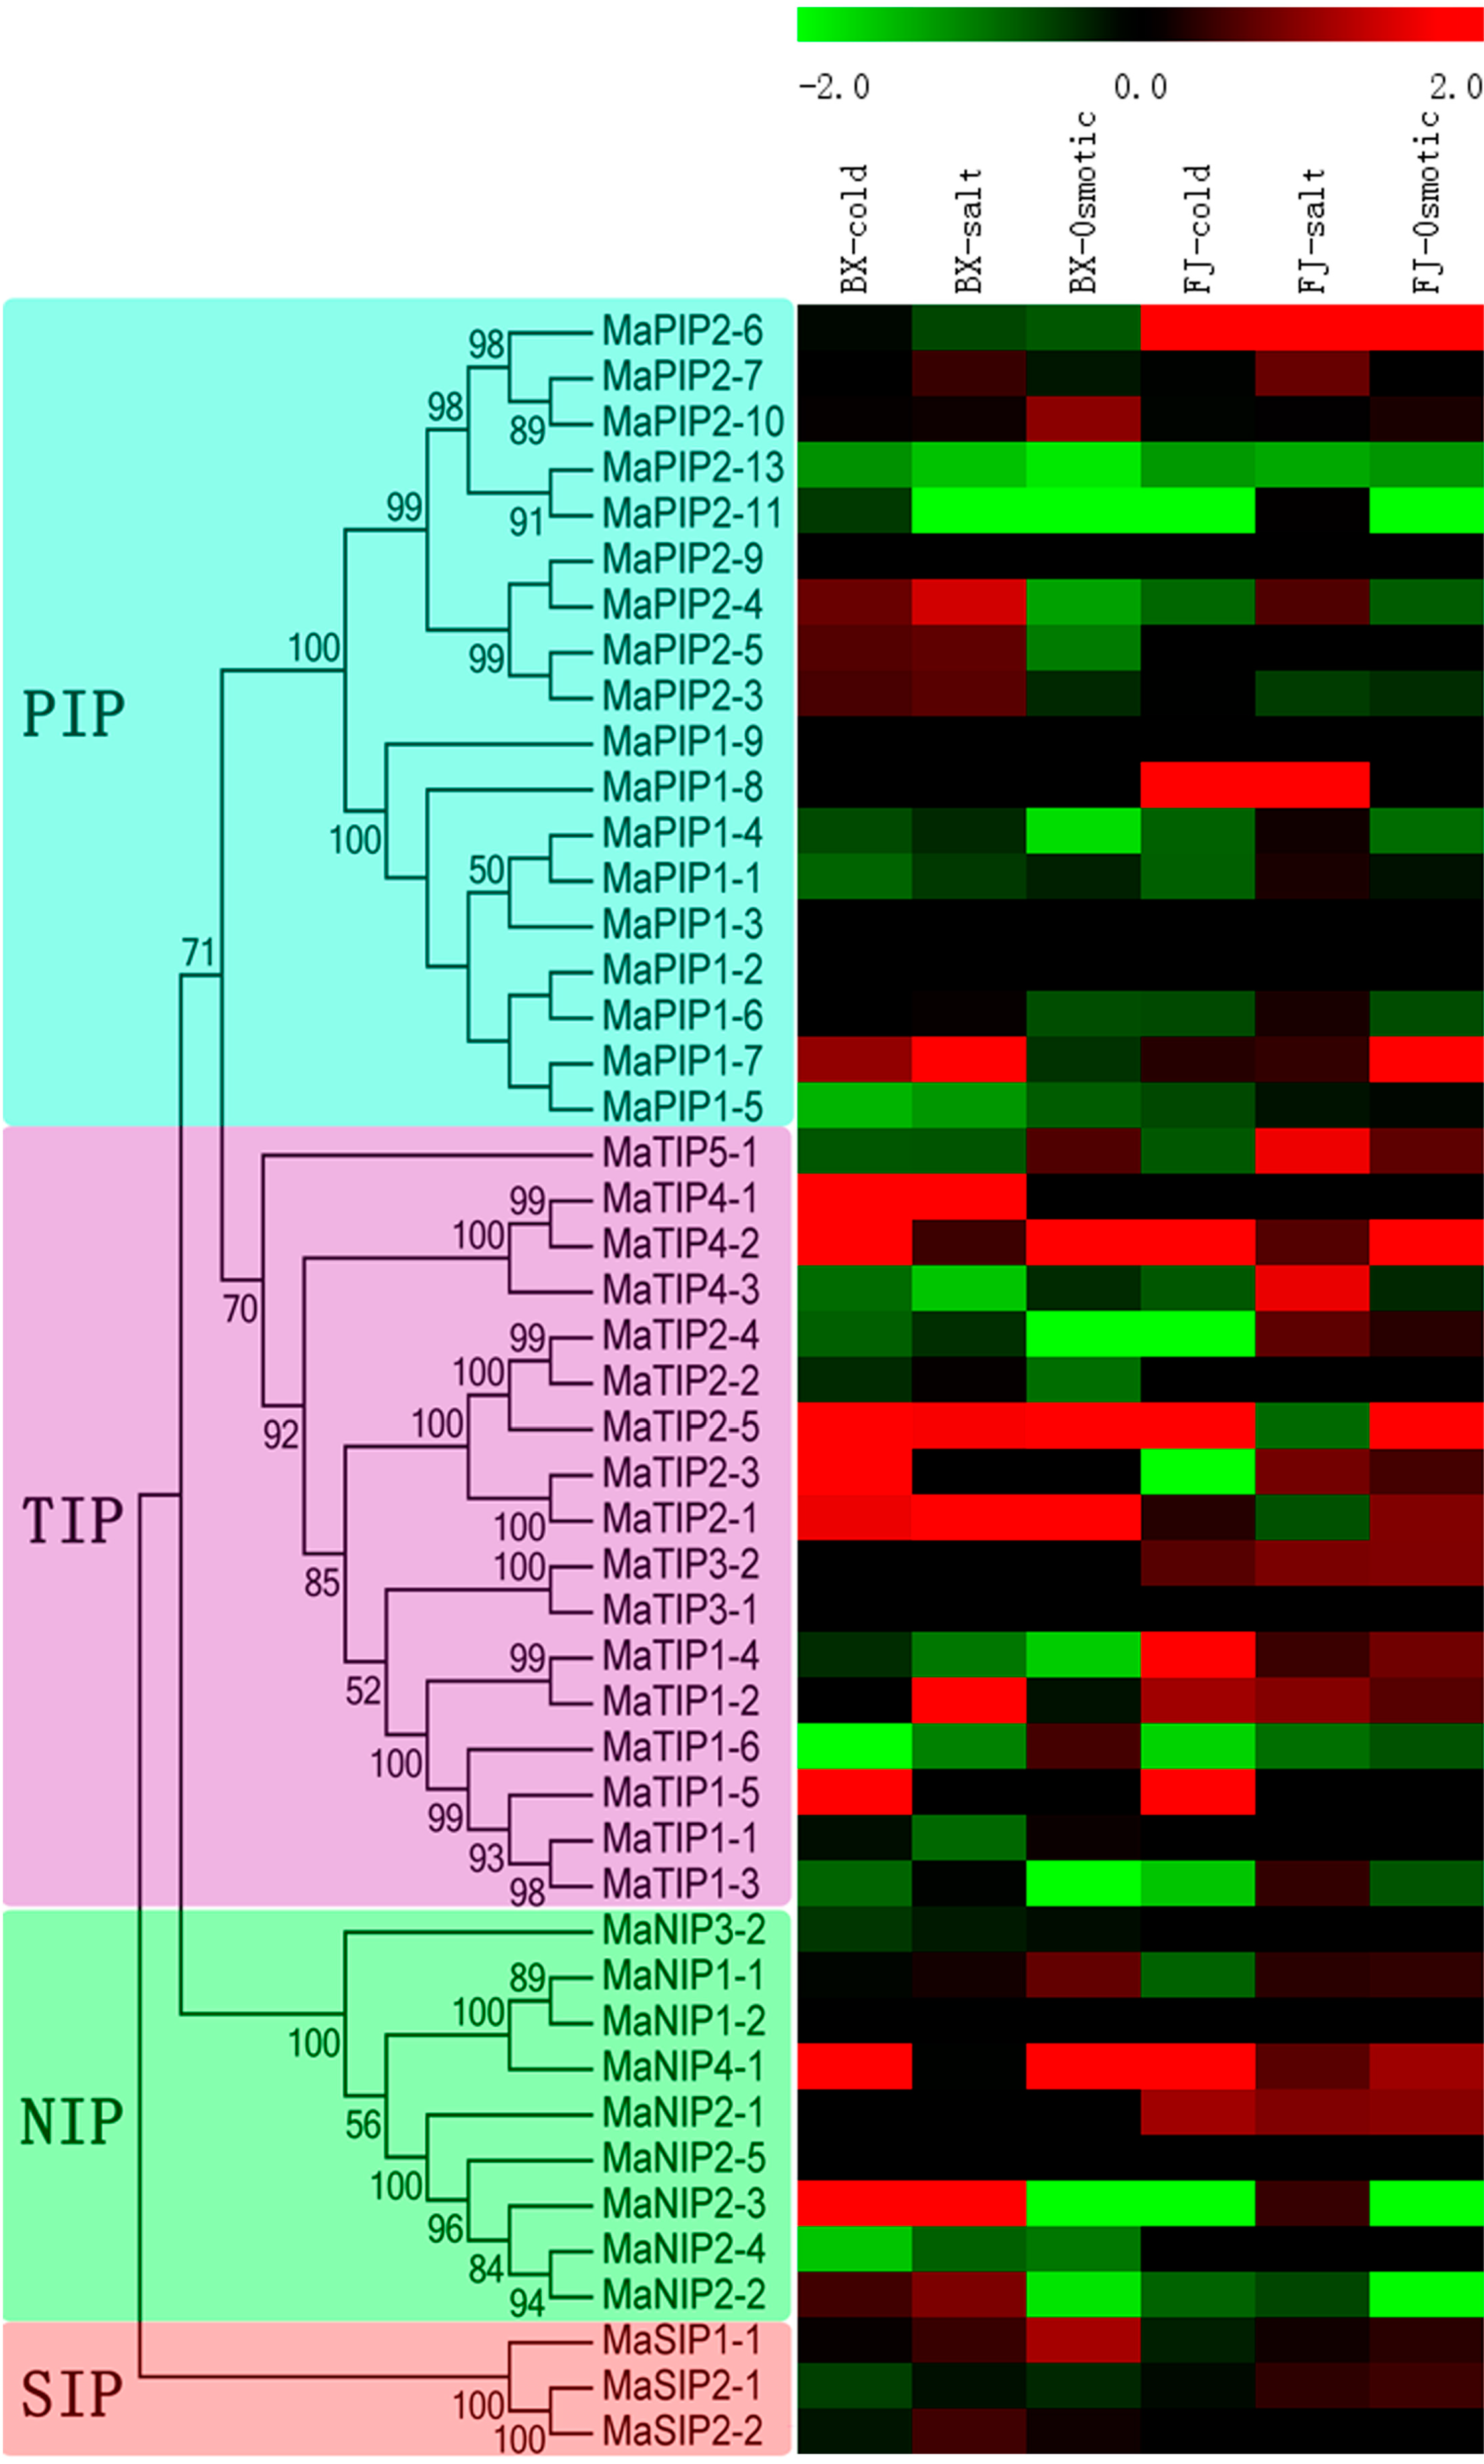
2.7. Expression Analysis of MaAQP Genes in Response to Cold, Salt, and Osmotic Stresses in Two Banana Varieties

Accumulated evidence has demonstrated that AQP genes play an important role in conferring plants resistance to abiotic stress, including drought, cold, and salt [3,22,23,24]. Thus, there is a need to investigate the transcriptional response of MaAQP genes to these abiotic stresses, which will benefit further functional characterization of AQP genes under stress conditions in banana. In the present study, a heat-map representing expression profiles of 40 MaAQP genes (except for MaPIP2-9, MaPIP1-9, MaPIP1-3, MaPIP1-2, MaTIP3-1, MaNIP1-2 and MaNIP2-5) was produced using transcriptomic data (Figure 7, Tables S10 and S11).
In BX, transcripts of 45% (18/40), 45% (18/40), and 27.5% (11/40) of MaAQP genes increased after cold, salt, and osmotic treatments, respectively, whereas 47.5% (19/40), 42.5% (17/40), and 57.5% (23/40) decreased after these stress treatments, respectively. Significant changes (p < 0.05) of 22.5% (9/40), 22.5% (9/40), and 15% (6/40) of MaAQP genes was found after cold, salt, and osmotic stress, respectively. Notably, 3 (MaTIP2-3, MaTIP1-5, and MaTIP4-2), 7 (MaPIP2-3, MaPIP2-7, MaTIP1-2, MaTIP2-1, MaNIP2-2, MaSIP1-1 and MaSIP2-2) and 1 (MaSIP1-1) genes were significantly induced (p < 0.05) after cold, salt, and osmotic treatments, respectively.
In FJ, 30% (12/40), 62.5% (25/40), and 40% (16/40) of MaAQP genes were induced after cold, salt, and osmotic treatments, respectively. In contrast, 52.5% (21/40), 17.5% (7/40), and 37.5% (15/40) were downregulated after cold, salt, and osmotic stress, respectively. Significant changes (p < 0.05) of 22.5% (9/40), 7.5% (3/40), and 12.5% (5/40) of MaAQP genes was found after cold, salt, and osmotic stress, respectively. Four (MaPIP2-6, MaTIP1-2, MaTIP1-4 and MaTIP4-2), 2 (MaTIP1-2 and MaTIP4-3) and 2 (MaPIP1-7 and MaNIP2-1) genes showed significant upregulation (p < 0.05) under cold, salt, and osmotic stress, respectively.
From above expression data, we can observe that the number of upregulated MaAQP genes by cold stress were more in BX than that in FJ, whereas less in BX than in FJ after salt and osmotic treatments. Notably, MaPIP2-6 and MaTIP1-4 were upregulated in FJ with the three treatments, but downregulated in BX. MaNIP2-1 and MaTIP3-2 expression was induced in FJ with the three treatments, whereas no transcriptional accumulation was detectable for these two genes in BX. Moreover, MaTIP4-2 was upregulated in response to cold, salt, and osmotic stress in both BX and FJ, whereas MaPIP2-13 and MaPIP1-5 were downregulated.
Additionally, some closely related MaAQP genes displayed similar expression profiles after various stress treatments, such as MaPIP2-13:MaPIP2-11 and MaPIP1-1:MaPIP1-4, Conversely, many closely related MaAQP genes showed different expression patterns, including MaPIP2-7:MaPIP2-10, MaPIP1-7:MaPIP1-5, MaTIP4-1:MaTIP4-2, MaTIP2-4:MaTIP2-2, MaTIP2-3:MaTIP2-1, MaTIP3-1:MaTIP3-2, MaTIP1-4:MaTIP1-2, MaNIP2-4:MaNIP2-2 and MaSIP2-1:MaSIP2-2.
Figure 7. Expression profiles of MaAQP genes in leaves of two cultivated banana varieties responding to cold, salt, and osmotic stresses. Log2-based FPKM values were used to create the heat-map with MeV software. The scale represents relative signal intensity of FPKM values.
Ijms 16 19728 g007

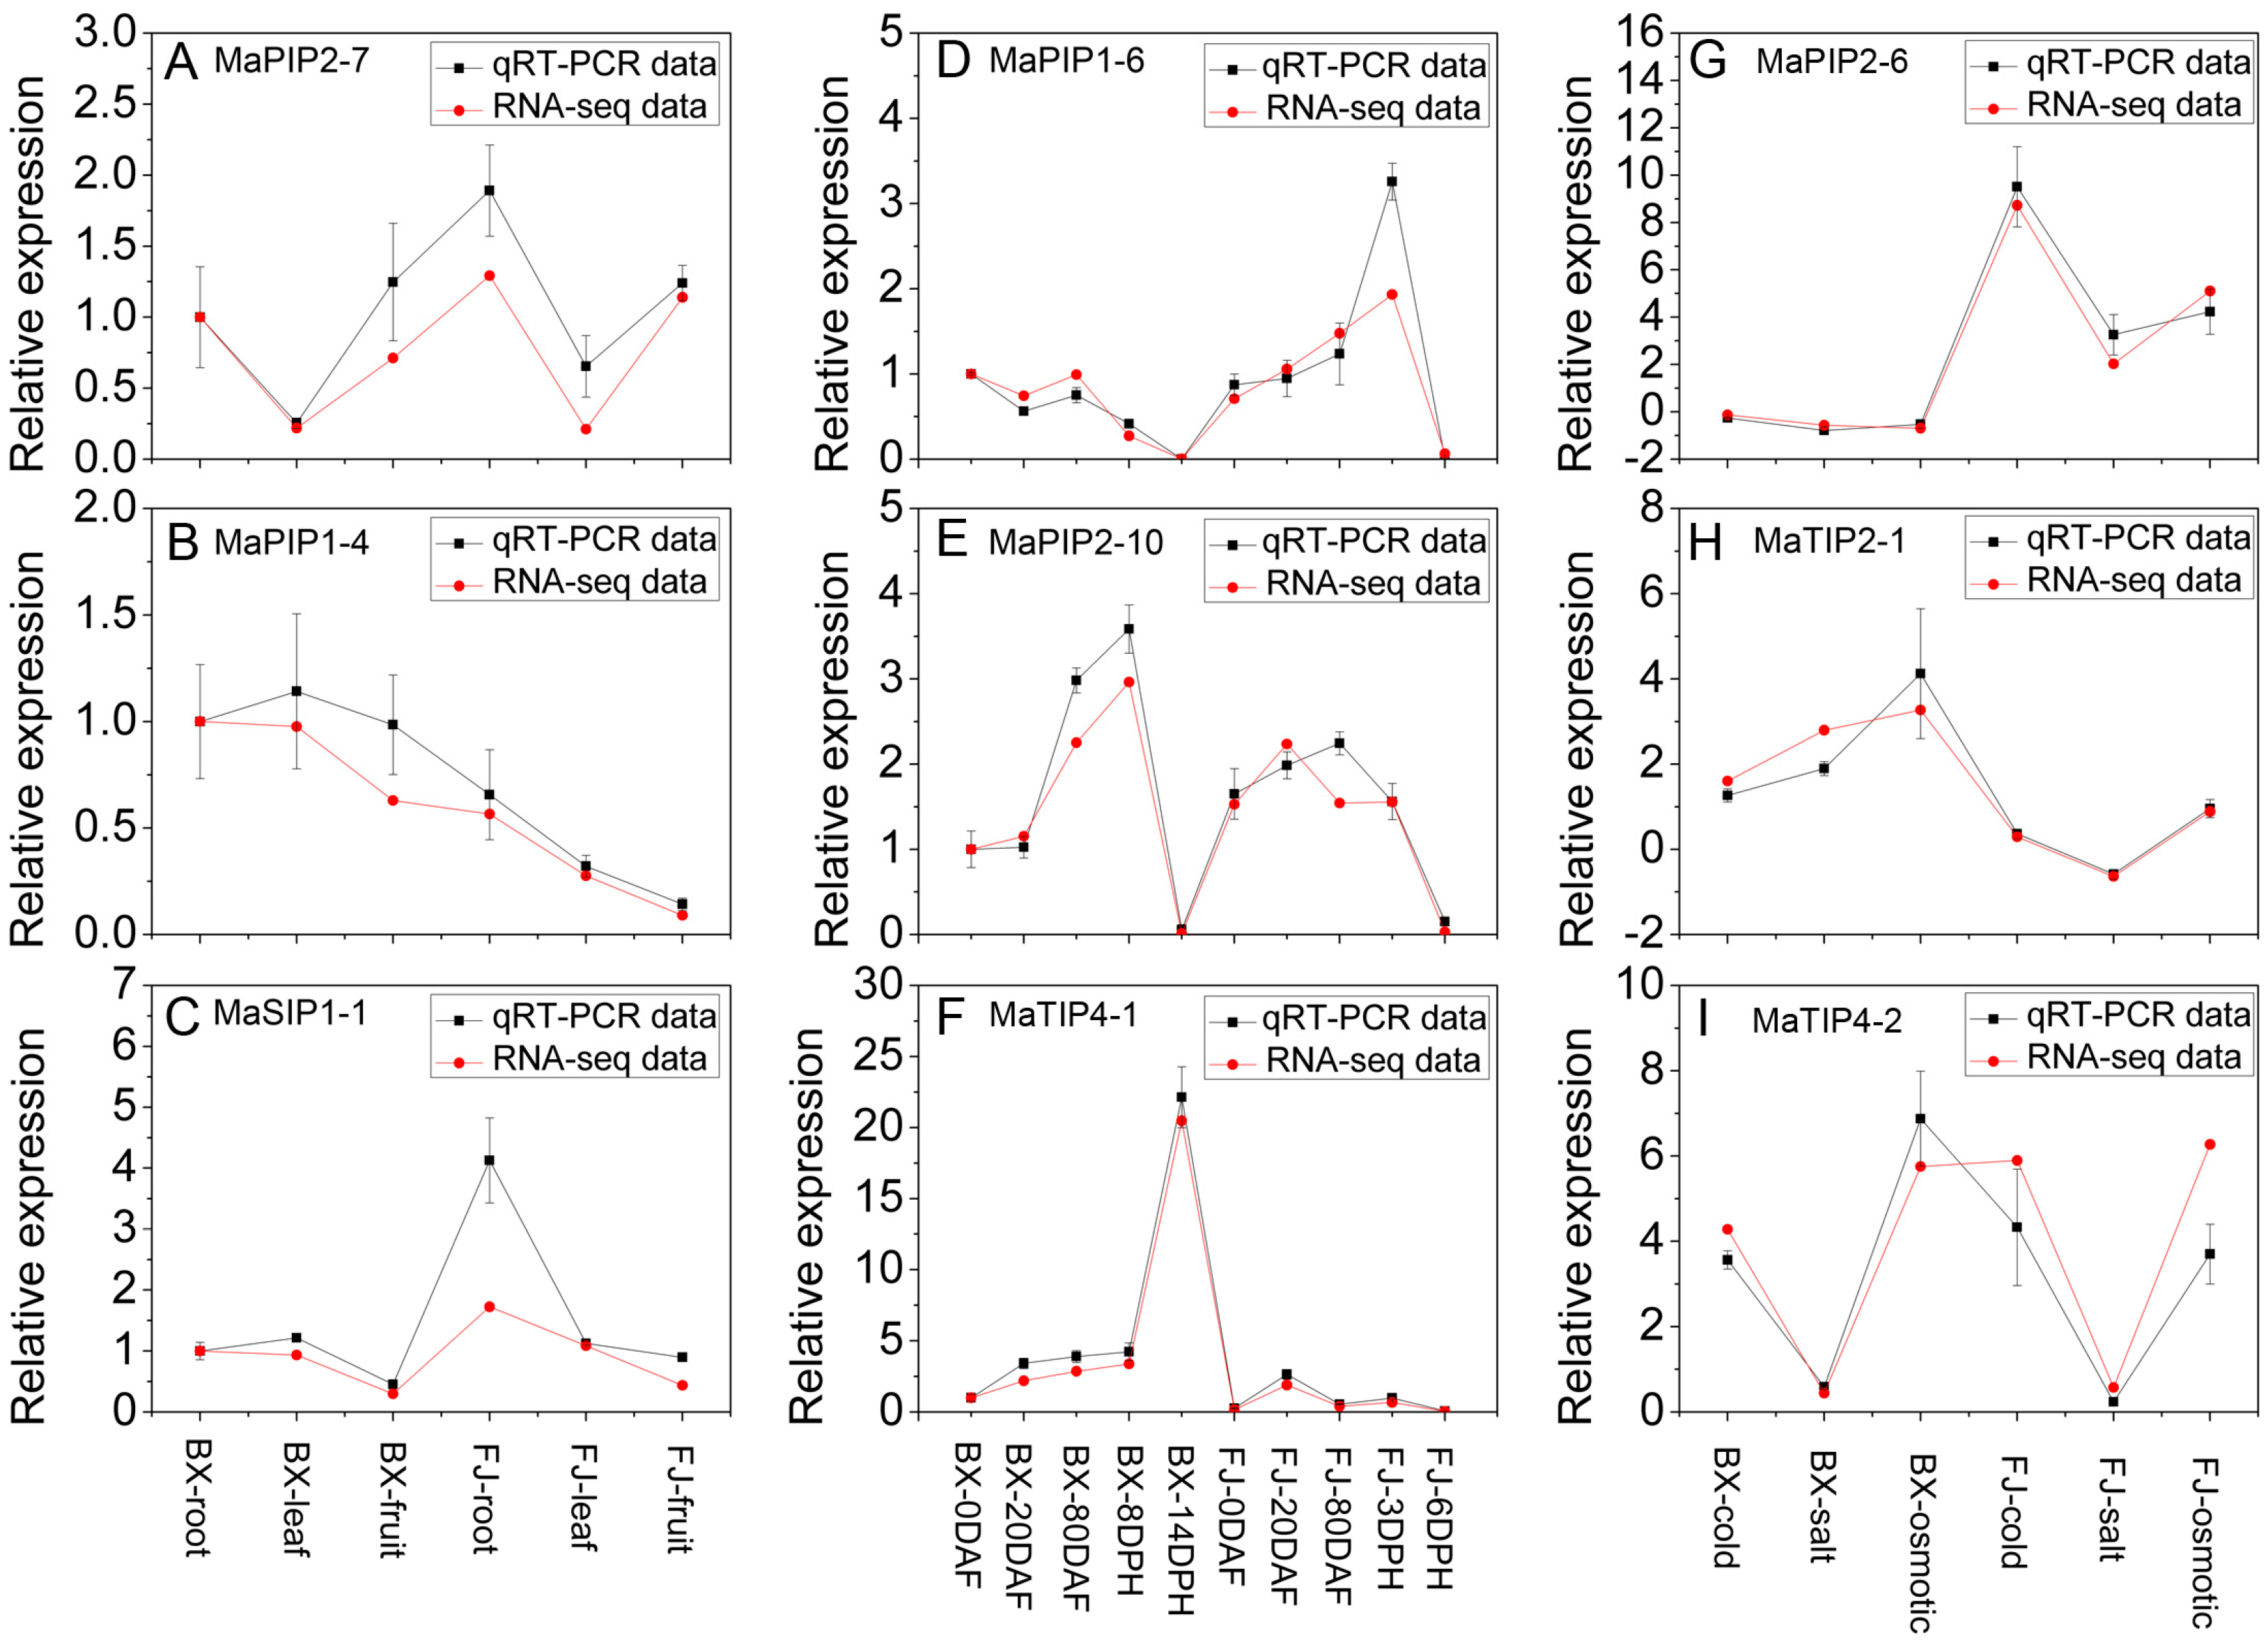
2.8. Validation of the Differentially Expressed AQP Genes by qRT-PCR Analysis

According to the RNA-seq data, MaPIP2-7, MaPIP1-4 and MaSIP1-1 showed high expression levels (value > 7) in all three organs (root, leaf, and fruit) of BX and FJ, MaPIP1-6, MaPIP2-10 and MaTIP4-1 had abundant transcripts (value > 10) during all stages of fruit development and ripening in BX and/or FJ, and MaPIP2-6, MaTIP2-1 and MaTIP4-2 were upregulated by cold, salt and osmotic stresses in BX and/or FJ. These nine differentially expressed MaAQP genes identified in this study were selected for qRT-PCR analysis to validate the RNA-seq data. After normalization, we found that the majority of selected MaAQP genes, except for MaPIP1-4 in leaf of BX and MaPIP2-10 in 80 DAF of FJ, showed the same trend and consistent results between RNA-seq data and qRT-PCR data (Figure 8). These results indicate that RNA-seq data are suitable for supplying the expression patterns of AQP genes in two banana varieties.
Figure 8. Relative mRNA levels of 9 MaAQP genes in BX and FJ were determined by qRT-PCR analysis. (AC) expression patterns of MaPIP2-7, MaPIP1-4 and MaSIP1-1 in different tissues of BX and FJ. The mRNA fold difference was relative to that of BX-root samples used as calibrator; (DF) expression patterns of MaPIP1-6, MaPIP2-10 and MaTIP4-1 in different stages of fruit development and ripening in BX and FJ. The mRNA fold difference was relative to that of BX-0DAF samples used as calibrator; (GI) expression patterns of MaPIP2-6, MaTIP2-1 and MaTIP4-2 in response to cold, salt and osmotic stresses in BX and FJ. The mRNA fold difference was relative to that of untreated samples used as calibrator. Log2-based values were used to display differential expression results. Data are means ± SD of n = 3 biological replicates.
Ijms 16 19728 g008

3. Discussion

Bananas, one of the most popular fresh fruits enjoyed worldwide, ranks as the second largest fruit crop and is one of the top five food commodities of the world [15]. However, studies on banana have proceeded at a slow pace in comparison to other important food crops [15]. Banana fruit quality is determined by a series of developmental and ripening processes. Moreover, banana plants are frequently destroyed by various biotic and abiotic stresses during growth and development. However, mechanisms involved in banana fruit development, ripening, and responses to environmental stresses are less known. Because AQPs play important roles in fast transmembrane transport of water during plant growth, development, and stress, they are considered crucial proteins in plants. In the present study, we focused on genome-wide identification and molecular characterization of AQPs during development, ripening, and abiotic stress in banana, which will provide new clues for further functional characterization of AQP genes and genetic improvement of bananas.

3.1. Identification and Evolutionary Analysis of MaAQPs

Both HMM and BLAST searches were employed to identify the banana AQP members according to the genome sequence of DH-Pahang (Musa acuminate, A-genome, 2n = 22). Forty-seven MaAQP genes were identified from the banana genome, indicating the expansion of AQP genes in banana compared to Arabidopsis (35) and rice (34) [7,26,27]. This high number of AQPs could be interpreted as a possible functional redundancy of this gene family in banana. Phylogenetic analysis indicated that banana AQPs could be clustered into four different subfamilies (Figure 2), which is consistent with previous reports of AQPs from rice, Arabidopsis, maize, and cabbage [5,7,11,27]. Generally, AQPs from banana had a closer relationship with those from rice than those from Arabidopsis and poplar, which is in line with current opinions in plant evolution. Gene structure analysis suggested that the number and length of exons and introns was highly specific for each subfamily (Figure 3). The number of MaAQP exon-introns in each subfamily is consistent with that in the common bean and potato [31,32]. Conserved motif analysis showed that each subfamily of banana AQP shared the same conserved motifs (Figure 4). Therefore, conserved motif and gene structure analyses further support the identification and phylogenetic classification of MaAQPs.
All MaPIPs contain two typical NPA motifs and highly conserved sequences of ar/R selectivity filter (F, H, T, R) (Table S4, Figures S1 and S2). The same ar/R selectivity filter sequences are also observed in the PIP sub-family of other species, such as, Arabidopsis, maize, tomato and poplar [7,11,23,28]. Accumulated evidences have confirmed that plant PIPs play an important role in water absorption of roots and maintaining leaf hydraulics [22,23,24,33]. In addition to water transport, some studies also reported that PIPs could facilitate the diffusion of CO2 in mesophyll and could directly affect photosynthesis [34,35]. The conservation of these amino acid residues related to transport of substrates (NPA motifs and ar/R residues) in banana PIPs suggests that these proteins may function on water absorption, plant hydraulics and/or CO2 diffusion. Although all MaTIPs and MaNIPs had two identical NPA motifs, some of them showed differences in the ar/R selectivity filter (Table S4, Figures S1, S3 and S4). TIPs are mainly located in vacuolar membranes is involved in the regulation of osmotic potential and water flow across this sub-cellular compartment [33]. Several studies have revealed that TIPs could transport various small solutes, including H2O2, NH4+, and urea, besides water [36,37,38,39]. Additionally, NIPs were also reported to have the ability of transport a wide variety of small solutes, such as water, urea, glycerol, silicon, boric acid, and lactic acid [40,41,42,43,44]. The variation of MaTIPs and MaNIPs in the ar/R selectivity filter sequences may contribute to their multiple transport function.

3.2. AQP Genes Are Involved in Fruit Development and Postharvest Ripening of Banana

Because fruit development and ripening processes determine the quality and shelf life of bananas, scientific interest has focused on the study of mechanisms involved in banana development and ripening [45]. Although accumulated evidence has suggested that AQP genes take part in various plant growth and development processes, including seed germination, cell elongation, fruit development, and ripening [19,20,21,28,46], it is unclear whether AQP genes are involved in banana development and ripening. In the present study, we examined expression profiles of MaAQP genes during fruit development and ripening in two cultivated banana varieties (Figure 6, Table S9). The results showed that the majority of MaAQP genes showed transcriptional accumulation, and a large number of MaAQP genes exhibited high expression levels (value > 10) during these stages, indicating the involvement of MaAQP genes in banana fruit development and ripening. In tomato, expression of 32 AQPs was examined in different vegetative tissues and developing fruits, among which 23 AQP genes showed transcriptional changes at various developmental stages [28]. In grapes, coincident with the lower xylem hydraulic resistance of the berry, some PIP genes peaked at transcriptional levels during 60 to 80 days after anthesis, and increases in xylem hydraulic resistance beginning 80 days after anthesis corresponded to decreases in expression of VvPIP1-3 and VvPIP2-1 [46]. In strawberries, the transcriptional accumulation of FaPIP1 and FaPIP2 was higher in the firmer rather than the softer cultivar during fruit ripening, indicating the possible roles of AQPs in fruit firmness [47]. Taken together, these investigations indicate that AQP genes extensively participate in the fruit development and ripening process.
In tomato, some PIP and TIP genes, such as SlPIP1;2, ;3, ;5, and ;7, SlPIP2;1, ;4, ;6, ;8, and ;9, and SlTIP1;1 and SlTIP2;1 in fruit maintained high expression levels from 3 to 14 days after pollination but decreased in the remaining developmental stages [28]. During banana fruit development, we observed that the number of MaAQP genes showing strong transcriptional accumulation (value > 10) at 0 and 20 DAF was significantly greater than that at 80 DAF. Moreover, expression of some MaAQP genes (19/40 in BX; 22/40 in FJ) in all four subfamilies was strong at 0 to 20 DAF but decreased 80 DAF (Figure 6, Table S9). Thus, AQP members in PIPs, TIPs, NIPs, and SIPs may play a crucial role in early fruit development. In plants, apoplastic and symplastic pathways are required for water movement, in which the latter is more efficient at controlling water transport across membranes. AQP family genes play crucial roles in symplastic pathway-mediated water transport [22,48]. Therefore, the transcriptional accumulation of some AQP genes during early fruit development indicates that water movement at inter- and intracellular levels between the cytosol and vacuole are required for fruit development.
Banana is a typical climacteric fruit, undergoing a series of postharvest ripening processes that give rise to numerous physiological and biochemical changes that lead to the quality formation of fruit [49]. Although previous reports have shown that AQP genes are involved in fruit ripening, less information is available for AQP genes in postharvest fruit ripening [28,50]. In this study, we examined changes in the expression of MaAQP genes during postharvest banana ripening and found that most AQP genes showed transcriptional accumulation. Interestingly, the number of MaAQP genes with high expression levels (value > 10) was significantly less at 8 and 14 DPH than that at 80 DAF in BX, whereas this phenomenon was not observed in FJ. Moreover, the expression of some AQP genes (22/40) significantly decreased at 8 and 14 DPH compared to the 80 DAF stage in BX, and only MaTIP4-2 displayed this expression pattern in FJ. We also noticed that some AQP genes (22/40) showed higher expression levels at 3 DPH compared with 80 DAF in FJ (Figure 6, Table S9). Collectively, these results implied that water movement may be more active in FJ than in BX during postharvest banana ripening process. Notably, we also observed that FJ ripened faster than BX during postharvest ripening. It took 8 and 14 DPH to reach more green than yellow and full yellow degrees of ripening for BX, respectively, whereas it only took 3 and 6 DPH for FJ, respectively. Therefore, AQP-mediated water movement may be involved in acceleration of postharvest banana ripening.

3.3. AQP Genes Are Involved in Banana Responses to Abiotic Stress

Because banana plants have shallow roots, a permanent green canopy, and rapid growth rate, they are considered to be extremely sensitive to water stress induced by drought, salt, cold, and other environmental stresses, and hence need an abundant water supply during growth and development [51]. Environmental stresses do great harm to banana growth and development and constrain its production. For the genetic improvement of stress resistance in banana, it is necessary to understand the molecular mechanisms of its abiotic stress responses. Previously, biochemical and genetic evidence has demonstrated that some AQP genes, including TaAQP7, TaAQP8, TaNIP, MaPIP1;1, MusaPIP2;6, and NtAQP1, confer plants resistance to abiotic stress [3,22,23,24,25,52], indicating positive roles for AQP genes during abiotic stress. In this study, we found a large number of MaAQP genes showed transcriptional changes when responding to cold, salt, and osmotic stresses both in BX and FJ, suggesting an extensive response of MaAQP genes to abiotic stress. Moreover, some MaAQP genes, such as MaPIP2-6, MaTIP4-3, MaTIP2-1, MaTIP2-3, MaTIP1-4, MaTIP1-5 and MaTIP4-2, showed strong induction (p < 0.05; log2-based value > 2) after stress treatment and therefore, may represent potential candidates for improving banana resistance to abiotic stress (Figure 7, Tables S10 and S11).
Additionally, we noticed that the number of upregulated MaAQP genes was greater in FJ than in BX after salt and osmotic treatments, and some AQP genes displayed differential expression patterns in both varieties in response to both stresses. MaPIP2-6, MaNIP2-1, MaSIP2-1, MaTIP3-2, MaTIP2-3, MaTIP2-4, and MaTIP1-4 showed upregulation in FJ, but downregulation or no transcriptional changes in BX after salt and osmotic treatments (Figure 7, Tables S10 and S11). Cultivated bananas originated either from intraspecific hybridizations between wild diploid subspecies of M. acuminata (A-genome) or from interspecific crosses between M. acuminata and wild diploid M. balbisiana (B-genome). The B-genome (M. balbisiana) has been associated with improved vigor and tolerance to biotic and abiotic stresses and is thus a target for banana breeding programs [53]. Moreover, most banana varieties containing the B-genome display strong resistance to water stress [54,55]. Before transcriptomic analyses, we evaluated the resistance of the two banana varieties to salt and osmotic stresses and showed that FJ are more tolerant to these stresses compared with BX. Therefore, some genes localized on the B-genome of FJ might contribute to regulation of AQP gene expression, thus leading to their upregulation and improved resistance of FJ to salt and osmotic stresses. This suggests that AQP-mediated water movements at inter- and intracellular levels are essential for improving banana resistance to salt and osmotic stresses.

4. Experimental Section

4.1. Plant Materials and Treatments

Young banana seedlings of two cultivated varieties, BaXi Jiao (Musa acuminate L. AAA group cv. Cavendish; hereafter referred to as BX) and Fen Jiao (Musa ABB Pisang Awak; hereafter referred to as FJ), with consistent growth states at the five-leaf stage were obtained from the banana tissue culture center (Danzhou, Institute of Banana and Plantain, Chinese Academy of Tropical Agricultural Sciences). Banana seedlings grew in soil under a growth chamber (28 °C; 200 μmol·m−2·s−1 light intensity; 16-h light/8-h dark cycle; 70% relative humidity) or in a banana planting base (Wenchang, Institute of Tropical Bioscience and Biotechnology, Chinese Academy of Tropical Agricultural Sciences, Guangzhou, China).
For expression assay in different organs, leaves and roots of banana seedlings at the five-leaf stage and fruits at 80 days after flowering (DAF) were collected to examine the transcriptional accumulation of AQP genes in the two banana varieties. During the fruit development process, bananas at 0, 20, and 80 DAF represent coming out of the bud, cutting flower, and full-grown/harvest stages, respectively. For expression analysis of MaAQP genes during fruit development, fruits at 0, 20, and 80 DAF were collected from BX and FJ. As indicated by Pua et al. [56], the degrees of postharvest banana ripening were divided into seven stages, namely full green, trace yellow, more green than yellow, more yellow than green, green tip, full yellow, and yellow flecked with brown spots. It took 8 and 14 days postharvest (DPH) for BX to reach the more green than yellow and full yellow stages, respectively, but only 3 and 6 DPH for FJ, respectively. Thus, for expression analysis in postharvest banana ripening processes, fruits at 8 and 14 DPH in BX and 3 and 6 DPH in FJ were collected to test MaAQP gene transcripts. For expression analysis in response to cold, banana seedlings at the five-leaf stage were placed in a chamber with low temperature (4 °C) for 22 h. For expression analysis in response to salt and osmotic stresses, banana seedlings at the five-leaf stage were irrigated with 300 mM NaCl and 200 mM mannitol for 7 days, respectively. Then, the leaves of banana seedlings were sampled to detect expression patterns of MaAQP genes. Each sample contains two biological replicates.

4.2. Identification and Phylogenetic Analyses

The banana genome database was used to obtain DNA and protein sequences [57]. To predict AQP proteins of banana, a Hidden Markov Model built from known AQPs was employed to search the banana database [58]. Additionally, BLAST analyses with all AQPs from Arabidopsis and rice as queries were used to further identify possible AQPs in the banana database. RGAP and UniPort databases were adopted to obtain AQP amino acid sequences of rice and Arabidopsis, respectively [59,60]. All identified AQPs were further validated by conserved domain searching using CDD and PFAM databases [61,62]. A bootstrap neighbor-joining phylogenetic tree was created based on multiple alignments of the identified AQPs from banana with all the AQPs from Arabidopsis and rice using Clustal X 2.0 and MEGA 5.0 with 1000 bootstraps [63,64]. The sequences of banana AQP genes identified in this study could be available in banana genome database [57] (The accession numbers were listed in Table S2).

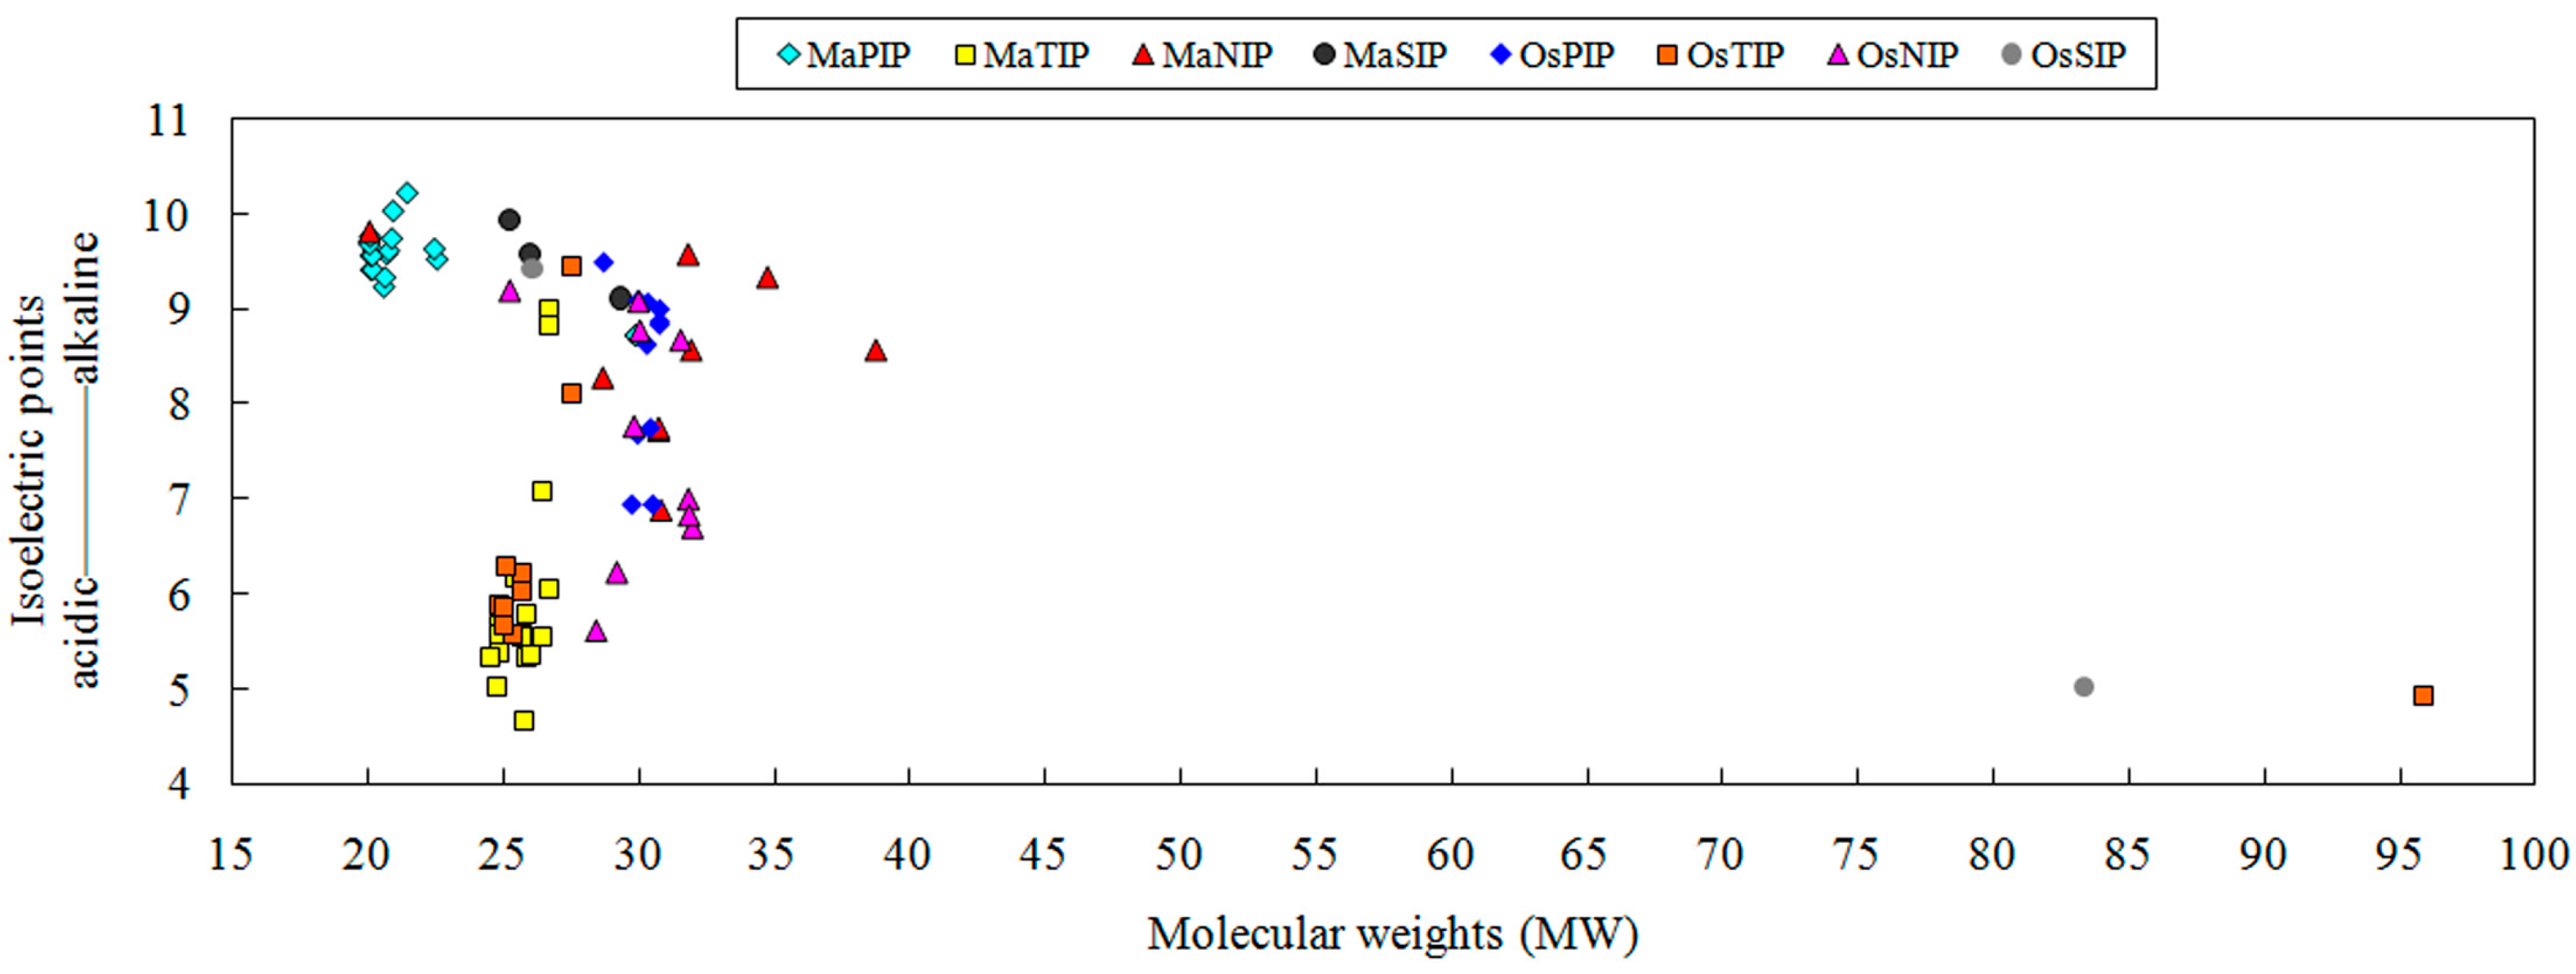
4.3. Protein Properties and Sequence Analyses

The ExPASy proteomics server database was used to predict relative molecular weights (RMW) and isoelectric points (pI) of the identified MaAQP proteins [65]. TMHMM Server ver.2.0 was used to predict the transmembrane domains of MaAQPs [66]. The NPA motif and sequences of ar/R selectivity filter were predicted based on multiple sequence alignment with DNAMAN. MaAQP protein motifs were analyzed with MEME software [67]. The optimum width of motifs ranged from 11 to 50, with the maximum number of motifs being 15; other parameter settings used were default values [5]. The predicted motifs of MaAQP proteins were further annotated with an InterProScan database search [68]. Gene structures of MaAQPs were determined with GSDS software based on the genome and coding sequences of MaAQPs [69].

4.4. Transcriptome Analysis

Expression patterns of MaAQP genes during development, ripening, and abiotic stress were examined with RNA sequencing technique. Different tissues from leaves, roots, and fruits at different developmental and ripening stages, as well as leaves of banana under normal or abiotic stress treatments in BX and FJ were sampled to extract total RNA using a plant RNA extraction kit (Tiangen, Beijing, China). Total RNA (3 μg) from each sample was converted into cDNA using a RevertAid First Strand cDNA Synthesis kit (Fermentas, Waltham, MA, USA). cDNA libraries were constructed based on Illumina protocols and subsequently subjected to sequencing by Illumina GAII sequencing platform following the Illumina RNA sequencing protocol. The average read size of the library was approximately 200 bp and both ends of the cDNAs were sequenced. The raw reads were cleaned by removing adapter sequences, empty reads, and low quality sequences (reads with unknown base pairs “N”). All the downstream analyses were based on the clean data with high quality. The genome sequence of DH-Pahang (Musa acuminate, A-genome, 2n = 22) was used as a reference to analyze transcriptomic data [57]. Reference genome and gene model annotation files were downloaded from the banana genome website [57] directly. Index of the reference genome was built using Bowtie v1.1.1 [70] and paired end clean reads were aligned to the reference genome using TopHat v2.0.13 [71]. HTSeq v0.6.1 was used to count the reads numbers mapped to each gene [72]. In addition, then FPKM of each gene was calculated based on the length of the gene and reads count mapped to this gene: FPKM = total exon fragments/[mapped reads (millions) × exon length (kb)]. Statistical analysis was performed based on Student’s t-test (n = 2). Each sample contained two biological replicates.

4.5. qRT-PCR Analysis

Changes in the expression of MaAQP genes in different tissues, different stages of fruit development and ripening, and response to abiotic stress were detected by quantitative real-time polymerase chain reaction (qRT-PCR) analysis using SYBR® Premix Ex Taq™ (TaKaRa, Shiga, Japan) chemistry on a Stratagene Mx3000P (Stratagene, CA, USA) instrument. Prior to quantification experiments, a series of primer and template dilutions were conducted to measure the optimal primer and template concentrations. Primers with high specificity and efficiency determined by melting curve analysis and agarose gel electrophoresis were selected to perform quantification assay (Table S12). Furthermore, the specificity for each primer pairs was confirmed after sequence analysis of the resulted products. Amplification efficiencies of primer pairs were between 0.9 and 1.1. MaRPS2 (HQ853246) and MaUBQ2 (HQ853254) verified to be constitutive expression and suitable as internal controls were employed as reference genes to normalize the relative expression of target genes [73]. The relative expression levels of the target genes were assessed based on 2–ΔΔCt method [74]. Each sample contains three replicates.

5. Conclusions

This systematic analysis identified 47 AQP genes in the banana genome, which was further supported by phylogenetic, gene structural, and conserved protein motif analyses. Expression analysis of MaAQP genes suggested the involvement of MaAQP genes in fruit development, postharvest ripening, and abiotic stress responses. Interestingly, we found some MaAQP genes may function on promoting early fruit development, accelerating postharvest banana ripening processes, and improving plant resistance to salt and osmotic stresses by comparing the expression profiles of MaAQP genes in two banana varieties. These data bring new insight to the control of MaAQP gene expression at the transcriptional level, which provides new clues for further functional characterization of AQP genes and genetic improvement of bananas.

Supplementary Materials

Supplementary materials can be found at https://www.mdpi.com/1422-0067/16/08/19728/s1.

Acknowledgments

This work was supported by the earmarked fund for Modern Agro-industry Technology Research System (CARS-32), the Major Technology Project of Hainan (ZDZX2013023-1) and the National Natural Science Foundation of China (31201663).

Author Contributions

Biyu Xu and Zhiqiang Jin conceived the study. Wei Hu, Xiaowan Hou, Chao Huang, Yan Yan, Weiwei Tie, Zehong Ding, Yunxie Wei, Juhua Liu, Hongxia Miao, Zhiwei Lu, Meiying Li performed the experiments and carried out the analysis. Wei Hu, Xiaowan Hou and Chao Huang designed the experiments and wrote the manuscript. All authors read and approved the final manuscript.

Conflicts of Interest

The authors declare no conflict of interest.

References

  1. Uehlein, N.; Lovisolo, C.; Siefritz, F.; Kaldenhoff, R. The tobacco aquaporin NtAQP1 is a membrane CO2 pore with physiological functions. Nature 2003, 425, 734–737. [Google Scholar] [CrossRef] [PubMed]
  2. Kaldenhoff, R.; Fischer, M. Aquaporins in plants. Acta Physiol. 2006, 187, 169–176. [Google Scholar] [CrossRef] [PubMed]
  3. Sade, N.; Gebretsadik, M.; Seligmann, R.; Schwartz, A.; Wallach, R.; Moshelion, M. The role of tobacco aquaporin1 in improving water use efficiency, hydraulic conductivity, and yield production under salt stress. Am. Soc. Plant Physiol. 2010, 152, 245–254. [Google Scholar] [CrossRef] [PubMed]
  4. Baiges, I.; Schäffner, A.R.; Affenzeller, M.J.; Mas, A. Plant aquaporins. Physiol Plant. 2002, 115, 175–182. [Google Scholar] [CrossRef] [PubMed]
  5. Tao, P.; Zhong, X.; Li, B.; Wang, W.; Yue, Z.; Lei, J.; Guo, W.; Huang, X. Genome-wide identification and characterization of aquaporin genes (AQPs) in Chinese cabbage (Brassica rapa ssp. pekinensis). Mol. Genet. Genom. 2014, 289, 1131–1145. [Google Scholar] [CrossRef] [PubMed]
  6. Guo, L.; Wang, Z.Y.; Lin, H.; Cui, W.E.; Chen, J.; Liu, M.; Chen, Z.L.; Qu, L.J.; Gu, H. Expression and functional analysis of the rice plasma-membrane intrinsic protein gene family. Cell Res. 2006, 16, 277–286. [Google Scholar] [CrossRef] [PubMed]
  7. Johanson, U.; Karlsson, M.; Johansson, I.; Gustavsson, S.; Jovall, S.; Fraysse, F.; Weig, A.R.; Kjellbom, P. The complete set of genes encoding major intrinsic proteins in Arabidopsis provides a framework for a new nomenclature for major intrinsic proteins in plants. Am. Soc. Plant Physiol. 2001, 126, 1358–1369. [Google Scholar] [CrossRef]
  8. Kammerloher, W.; Fischer, U.; Piechotta, G.P.; Schäffner, A.R. Water channels in the plant plasma membrane cloned by immunoselection from an expression system. Plant J. 1994, 6, 187–199. [Google Scholar] [CrossRef] [PubMed]
  9. Karlsson, M.; Johansson, I.; Bush, M.; McCann, M.C.; Maurel, C.; Larsson, C. An abundant TIP expressed in mature highly vacuolated cells. Plant J. 2000, 21, 83–90. [Google Scholar] [CrossRef] [PubMed]
  10. Weaver, C.D.; Crombie, B.; Stacey, G.; Roberts, D.M. Calcium-dependent phosphorylation of symbiosome membrane proteins from nitrogen-fixing soybean nodules: Evidence for phosphorylation of nodulin-26. Am. Soc. Plant Physiol. 1991, 95, 222–227. [Google Scholar] [CrossRef]
  11. Chaumont, F.; Barrieu, F.; Wojcik, E.; Chrispeels, M.J.; Jung, R. Aquaporins constitute a large and highly divergent protein family in maize. Am. Soc. Plant Physiol. 2001, 125, 1206–1215. [Google Scholar] [CrossRef]
  12. Gustavsson, S.; Lebrun, A.S.; Norden, K.; Chaumont, F.; Johanson, U. A novel plant major intrinsic protein in Physcomitrella patens most similar to bacterial glycerol channels. Am. Soc. Plant Physiol. 2005, 139, 287–295. [Google Scholar] [CrossRef] [PubMed]
  13. Danielson, J.A.H.; Johanson, U. Unexpected complexity of the aquaporin gene family in the moss Physcomitrella patens. BMC Plant Biol. 2008, 8, 45. [Google Scholar] [CrossRef] [PubMed]
  14. Lopez, D.; Bronner, G.; Brunel, N.; Auguin, D.; Bourgerie, S.; Brignolas, F.; Carpin, S.; Tournaire-Roux, C.; Maurel, C.; Fumanal, B.; et al. Insights into Populus XIP aquaporins: Evolutionary expansion, protein functionality, and environmental regulation. J. Exp. Bot. 2012, 63, 2217–2230. [Google Scholar] [CrossRef] [PubMed] [Green Version]
  15. Sreedharan, S.; Shekhawat, U.K.; Ganapathi, T.R. Transgenic banana plants overexpressing a native plasma membrane aquaporin MusaPIP1;2 display high tolerance levels to different abiotic stresses. Plant Biotechnol. J. 2013, 11, 942–952. [Google Scholar] [CrossRef] [PubMed]
  16. Wallace, I.S.; Roberts, D.M. Homology modeling of representative subfamilies of Arabidopsis major intrinsic proteins. Classification based on the aromatic/arginine selectivity filter. Am. Soc. Plant Physiol. 2004, 135, 1059–1068. [Google Scholar] [CrossRef] [PubMed]
  17. Gupta, A.B.; Sankararamakrishnan, R. Genome-wide analysis of major intrinsic proteins in the tree plant Populus trichocarpa: Characterization of XIP subfamily of aquaporins from evolutionary perspective. BMC Plant Biol. 2009, 9, 134. [Google Scholar] [CrossRef] [PubMed]
  18. Mitani-Ueno, N.; Yamaji, N.; Zhao, F.; Ma, J.F. The aromatic/arginine selectivity filter of NIP aquaporins plays a critical role in substrate selectivity for silicon, boron, and arsenic. J. Exp. Bot. 2011, 62, 4391–4398. [Google Scholar] [CrossRef] [PubMed]
  19. Eisenbarth, D.A.; Weig, A.R. Dynamics of aquaporins and water relations during hypocotyl elongation in Ricinus communis L. seedlings. J. Exp. Bot. 2005, 56, 1831–1842. [Google Scholar] [CrossRef] [PubMed]
  20. Azad, A.K.; Sawa, Y.; Ishikawa, T.; Shibata, H. Phosphorylation of plasma membrane aquaporin regulates temperature-dependent opening of tulip petals. Plant Cell Physiol. 2004, 45, 608–617. [Google Scholar] [CrossRef] [PubMed]
  21. Li, D.D.; Ruan, X.M.; Zhang, J.; Wu, Y.J.; Wang, X.L.; Li, X.B. Cotton plasma membrane intrinsic protein 2s (PIP2s) selectively interact to regulate their water channel activities and are required for fibre development. New Phytol. 2013, 199, 695–707. [Google Scholar] [CrossRef] [PubMed]
  22. Zhou, S.; Hu, W.; Deng, X.; Ma, Z.; Chen, L.; Huang, C.; Wang, C.; Wang, J.; He, Y.; Yang, G.; et al. Overexpression of the wheat aquaporin gene, TaAQP7, enhances drought tolerance in transgenic tobacco. PLoS ONE 2012, 7, e52439. [Google Scholar] [CrossRef] [PubMed]
  23. Hu, W.; Yuan, Q.; Wang, Y.; Cai, R.; Deng, X.; Wang, J.; Zhou, S.; Chen, M.; Chen, L.; Huang, C.; et al. Overexpression of a wheat aquaporin gene, TaAQP8, enhances salt stress tolerance in transgenic tobacco. Plant Cell Physiol. 2012, 53, 2127–2141. [Google Scholar] [CrossRef] [PubMed]
  24. Xu, Y.; Hu, W.; Liu, J.; Zhang, J.; Jia, C.; Miao, H.; Xu, B.; Jin, Z. A banana aquaporin gene, MaPIP1;1, is involved in tolerance to drought and salt stresses. BMC Plant Biol. 2014, 14, 59. [Google Scholar] [CrossRef] [PubMed]
  25. Sreedharan, S.; Shekhawat, U.K.; Ganapathi, T.R. Constitutive and stress-inducible overexpression of a native aquaporin gene (MusaPIP2;6) in transgenic banana plants signals its pivotal role in salt tolerance. Plant Mol. Biol. 2015, 88, 41–52. [Google Scholar] [CrossRef] [PubMed]
  26. Sakurai, J.; Ishikawa, F.; Yamaguchi, T.; Uemura, M.; Maeshima, M. Identifiation of 33 rice aquaporin genes and analysis of their expression and function. Plant Cell Physiol. 2005, 46, 1568–1577. [Google Scholar] [CrossRef] [PubMed]
  27. Nguyen, M.X.; Moon, S.; Jung, K.H. Genome–wide expression analysis of rice aquaporin genes and development of a functional gene network mediated by aquaporin expression in roots. Planta 2013, 238, 669–681. [Google Scholar] [CrossRef] [PubMed]
  28. Reuscher, S.; Akiyama, M.; Mori, C.; Aoki, K.; Shibata, D.; Shiratake, K. Genome-wide identification and expression analysis of aquaporins in tomato. PLoS ONE 2013, 8, e79052. [Google Scholar] [CrossRef] [PubMed]
  29. Wang, G.; Lovato, A.; Polverari, A.; Wang, M.; Liang, Y.H.; Ma, Y.C.; Cheng, Z.M. Genome-wide identification and analysis of mitogen activated protein kinase kinase kinase gene family in grapevine (Vitis vinifera). BMC Plant Biol. 2014, 14, 219. [Google Scholar] [CrossRef] [PubMed]
  30. Shiu, S.H.; Bleecker, A.B. Expansion of the receptor-like kinase/Pelle gene family and receptor-like proteins in Arabidopsis. Am. Soc. Plant Physiol. 2003, 132, 530–543. [Google Scholar]
  31. Ariani, A.; Gepts, P. Genome-wide identification and characterization of aquaporin gene family in common bean (Phaseolus vulgaris L.). Mol. Genet. Genom. 2015. [Google Scholar] [CrossRef]
  32. Venkatesh, J.; Yu, J.W.; Park, S.W. Genome-wide analysis and expression profiling of the Solanum tuberosum aquaporins. Plant Physiol. Biochem. 2013, 73, 392–404. [Google Scholar] [CrossRef] [PubMed]
  33. Li, G.; Santoni, V.; Maurel, C. Plant aquaporins: Role in plant physiology. Biochim. Biophys. Acta 2014, 1840, 1574–1582. [Google Scholar] [CrossRef] [PubMed]
  34. Heckwolf, M.; Pater, D.; Hanson, D.T.; Kaldenhoff, R. The Arabidopsis thaliana aquaporin AtPIP1;2 is a physiologically relevant CO2 transport facilitator. Plant J. 2011, 67, 734–737. [Google Scholar] [CrossRef] [PubMed]
  35. Mori, I.C.; Rhee, J.; Shibasaka, M.; Sasano, S.; Kaneko, T.; Horiem, T.; Katsuharam, M. CO2 transport by PIP2 aquaporins in barley. Plant Cell Physiol. 2014, 55, 251–257. [Google Scholar] [CrossRef] [PubMed]
  36. Liu, L.; Ludewig, U.; Gasset, B.; Frommer, W.B.; von Wiren, N. Urea transport by nitrogen-regulated tonoplastic intrinsic proteins in Arabidopsis. Am. Soc. Plant Physiol. 2003, 133, 1220–1228. [Google Scholar] [CrossRef] [PubMed]
  37. Holm, L.M.; Jahn, T.P.; Møller, A.L.; Schjoerring, J.K.; Ferri, D.; Klaerke, D.A.; Zeuthen, T. NH3 and NH4+ permeability in aquaporin expressin Xenopus oocytes. Pflg. Arch. 2005, 450, 415–428. [Google Scholar] [CrossRef] [PubMed]
  38. Loque, D.; Ludewig, U.; Yuan, L.; von Wiren, N. Tonoplastic intrinsic proteins AtTIP2;1 and AtTIP2;3 facilitate NH3 transport into the vacuole. Am. Soc. Plant Physiol. 2005, 137, 671–680. [Google Scholar] [CrossRef]
  39. Bienert, G.P.; Møller, A.L.; Kristiansen, K.A.; Schulz, A.; Møller, I.M.; Schjoerring, J.K.; Jahn, T.P. Specifi aquaporins facilitate the diffusion of hydrogen peroxide across membranes. J Biol. Chem. 2007, 282, 1183–1192. [Google Scholar] [CrossRef] [PubMed]
  40. Dean, R.M.; Rivers, R.L.; Zeidel, M.L.; Roberts, D.M. Purifiation and functional reconstitution of soybean nodulin 26. An aquaporin with water and glycerol transport properties. Biochemistry 1999, 38, 347–353. [Google Scholar] [CrossRef] [PubMed]
  41. Wallace, I.S.; Roberts, D.M. Distinct transport selectivity of two structural subclasses of the nodulin-like intrinsic protein family of plant aquaglyceroporin channels. Biochemistry 2005, 44, 16826–16834. [Google Scholar] [CrossRef] [PubMed]
  42. Ma, J.G.; Tamai, K.; Yamaji, N.; Mitani, N.; Konishi, S.; Katsuhara, M.; Ishiguro, M.; Murata, Y.; Yano, M. A silicon transporter in rice. Nature 2006, 440, 688–691. [Google Scholar] [CrossRef] [PubMed]
  43. Takano, J.; Wada, M.; Ludewig, U.; Schaaf, G.; von Wirén, N.; Fujiwara, T. The Arabidopsis major intrinsic protein NIP5;1 is essential for effiient boron uptake and plant development under boron limitation. Plant Cell. 2006, 18, 1498–1509. [Google Scholar] [CrossRef] [PubMed]
  44. Choi, W.G.; Roberts, D.M. Arabidopsis NIP2;1: A major intrinsic protein transporter of lactic acid induced by anoxic stress. J. Biol. Chem. 2007, 282, 24209–24218. [Google Scholar] [CrossRef] [PubMed]
  45. Bapat, V.A.; Trivedi, P.K.; Ghosh, A.; Sane, V.A.; Ganapathi, T.R.; Nath, P. Ripening of fleshy fruit: Molecular insight and the role of ethylene. Biotechnol. Adv. 2010, 28, 94–107. [Google Scholar] [CrossRef] [PubMed]
  46. Choat, B.; Gambetta, G.A.; Shackel, K.A.; Matthews, M.A. Vascular function in grape berries across development and its relevance to apparent hydraulic isolation. Am. Soc. Plant Physiol. 2009, 151, 1677–1687. [Google Scholar] [CrossRef] [PubMed]
  47. Alleva, K.; Marquez, M.; Villarreal, N.; Mut, P.; Bustamante, C.; Bellati, J.; Martínez, G.; Civello, M.; Amodeo, G. Cloning, functional characterization, and co-expression studies of a novel aquaporin (FaPIP2;1) of strawberry fruit. J. Exp. Bot. 2010, 61, 3935–3945. [Google Scholar] [CrossRef] [PubMed]
  48. Vera-Estrella, R.; Barkla, B.J.; Bohnert, H.J.; Pantoja, O. Novel regulation of aquaporins during osmotic stress. Am. Soc. Plant Physiol. 2004, 135, 2318–2329. [Google Scholar] [CrossRef] [PubMed]
  49. Hu, W.; Liu, J.H.; Yang, X.Y.; Zhang, J.B.; Jia, C.H.; Li, M.Y.; Xu, B.Y.; Jin, Z.Q. Identification of a gene encoding glutamate decarboxylase involved in postharvest fruit ripening process in banana. HortScience 2014, 49, 1056–1060. [Google Scholar]
  50. Sun, Q.; Zhang, N.; Wang, J.; Zhang, H.; Li, D.; Shi, J.; Li, R.; Weeda, S.; Zhao, B.; Ren, S.; et al. Melatonin promotes ripening and improves quality of tomato fruit during postharvest life. J. Exp. Bot. 2015, 66, 657–668. [Google Scholar] [CrossRef] [PubMed]
  51. Van Asten, P.J.A.; Fermont, A.M.; Taulya, G. Drought is a major yield loss factor for rainfed East African highland banana. Agric. Water Manag. 2011, 98, 541–552. [Google Scholar] [CrossRef]
  52. Gao, Z.X.; He, X.L.; Zhao, B.C.; Zhou, C.J.; Liang, Y.Z.; Ge, R.C.; Shen, Y.; Huang, Z. Overexpressing a putative aquaporin gene from wheat, TaNIP, enhances salt tolerance in transgenic Arabidopsis. Plant Cell Physiol. 2010, 51, 767–775. [Google Scholar] [CrossRef] [PubMed]
  53. Davey, M.W.; Gudimella, R.; Harikrishna, J.A.; Sin, L.W.; Khalid, N.; Keulemans, J. A draft Musa balbisiana genome sequence for molecular genetics in polyploid, inter- and intra-specific Musa hybrids. BMC Genom. 2013, 14, 683. [Google Scholar] [CrossRef] [PubMed]
  54. Huang, J.C.; Xiao, Y.; Zhao, C.X. Some physiological responses of banana to water stress. J. Zhongkai Agrotech. Coll. 1999, 12, 40–42. [Google Scholar]
  55. Bananuka, J.A.; Rubaihayo, P.R.; Tenywa, M.M. Reactions of Musa genotypes to drought stress. Afr. Crop Sci. J. 1999, 7, 333–339. [Google Scholar]
  56. Pua, E.C.; Chandramouli, S.; Han, P.; Liu, P. Malate synthase gene expression during fruit ripening of Cavendish banana (Musa acuminata cv. Williams). J. Exp. Bot. 2003, 54, 309–316. [Google Scholar] [CrossRef] [PubMed]
  57. D’Hont, A.; Denoeud, F.; Aury, J.M.; Baurens, F.C.; Carreel, F.; Garsmeur, O.; Noel, B.; Bocs, S.; Droc, G.; Rouard, M.; et al. The banana (Musa acuminata) genome and the evolution of monocotyledonous plants. Nature 2012, 488, 213–217. [Google Scholar] [CrossRef] [PubMed] [Green Version]
  58. Finn, R.D.; Clements, J.; Eddy, S.R. HMMER web server: Interactive sequence similarity searching. Nucleic Acids Res. 2011, 39, 29–37. [Google Scholar] [CrossRef] [PubMed]
  59. The UniProt Consortium. UniProt: A hub for protein information. Nucleic Acids Res. 2015, 43, D204–D212. [Google Scholar]
  60. Kawahara, Y.; de la Bastide, M.; Hamilton, J.P.; Kanamori, H.; McCombie, W.R.; Ouyang, S.; Schwartz, D.C.; Tanaka, T.; Wu, J.; Zhou, S.; et al. Improvement of the Oryza sativa Nipponbare reference genome using next generation sequence and optical map data. Rice 2013, 6, 4. [Google Scholar] [CrossRef] [PubMed]
  61. Marchler-Bauer, A.; Derbyshire, M.K.; Gonzales, N.R.; Lu, S.; Chitsaz, F.; Geer, L.Y.; Geer, R.C.; He, J.; Gwadz, M.; Hurwitz, D.I.; et al. CDD: NCBI’s conserved domain database. Nucleic Acids Res. 2015, 43, D222–D226. [Google Scholar] [CrossRef] [PubMed]
  62. Finn, R.D.; Bateman, A.; Clements, J.; Coggill, P.; Eberhardt, R.Y.; Eddy, S.R.; Heger, A.; Hetherington, K.; Holm, L.; Mistry, J.; et al. The Pfam protein families database. Nucleic Acids Res. 2014, 42, D222–D230. [Google Scholar] [CrossRef] [PubMed]
  63. Larkin, M.A.; Blackshields, G.; Brown, N.P.; Chenna, R.; McGettigan, P.A.; McWilliam, H.; Valentin, F.; Wallace, I.M.; Wilm, A.; Lopez, R.; et al. Clustal W and Clustal X version 2.0. Bioinformatics 2007, 23, 2947–2948. [Google Scholar] [CrossRef] [PubMed]
  64. Tamura, K.; Peterson, D.; Peterson, N.; Stecher, G.; Nei, M.; Kumar, S. MEGA5: Molecular evolutionary genetics analysis using maximum likelihood, evolutionary distance, and maximum parsimony methods. Mol. Biol. Evol. 2011, 28, 2731–2739. [Google Scholar] [CrossRef] [PubMed]
  65. Gasteiger, E.; Gattiker, A.; Hoogland, C.; Ivanyi, I.; Appel, R.D.; Bairoch, A. ExPASy: The proteomics server for in-depth protein knowledge and analysis. Nucleic Acids Res. 2003, 31, 3784–3788. [Google Scholar] [CrossRef] [PubMed]
  66. Krogh, A.; Larsson, B.; von Heijne, G.; Sonnhammer, E.L. Predicting transmembrane protein topology with a hidden Markov model: Application to complete genomes. J. Mol. Biol. 2001, 305, 567–580. [Google Scholar] [CrossRef] [PubMed]
  67. Brown, P.; Baxter, L.; Hickman, R.; Beynon, J.; Moore, J.D.; Ott, S. MEME-LaB: Motif analysis in clusters. Bioinformatics 2013, 29, 1696–1697. [Google Scholar] [CrossRef] [PubMed]
  68. Mulder, N.; Apweiler, R. InterPro and InterProScan: Tools for protein sequence classification and comparison. Methods Mol. Biol. 2007, 396, 59–70. [Google Scholar] [PubMed]
  69. Hu, B.; Jin, J.; Guo, A.Y.; Zhang, H.; Luo, J.; Gao, G. GSDS 2.0: An upgraded gene feature visualization server. Bioinformatics 2015, 31, 1296–1297. [Google Scholar] [CrossRef] [PubMed]
  70. Langmead, B.; Salzberg, S.L. Fast gapped-read alignment with Bowtie 2. Nat. Methods 2012, 9, 357–359. [Google Scholar] [CrossRef] [PubMed]
  71. Pollier, J.; Rombauts, S.; Goossens, A. Analysis of RNA-Seq data with TopHat and Cufflinks for genome-wide expression analysis of jasmonate-treated plants and plant cultures. Methods Mol. Biol. 2013, 1011, 305–315. [Google Scholar] [PubMed]
  72. Anders, S.; Pyl, P.T.; Huber, W. HTSeq—A Python framework to work with high-throughput sequencing data. Bioinformatics 2015, 31, 166–169. [Google Scholar] [CrossRef] [PubMed]
  73. Chen, L.; Zhong, H.Y.; Kuang, J.F.; Li, J.G.; Lu, W.J.; Chen, J.Y. Validation of reference genes for RT-qPCR studies of gene expression in banana fruit under different experimental conditions. Planta 2011, 234, 377–390. [Google Scholar] [CrossRef] [PubMed]
  74. Livak, K.J.; Schmittgen, T.D. Analysis of relative gene expression data using real-time Quantitative PCR and the 2–ΔΔCt method. Methods 2001, 25, 402–408. [Google Scholar] [CrossRef] [PubMed]

