
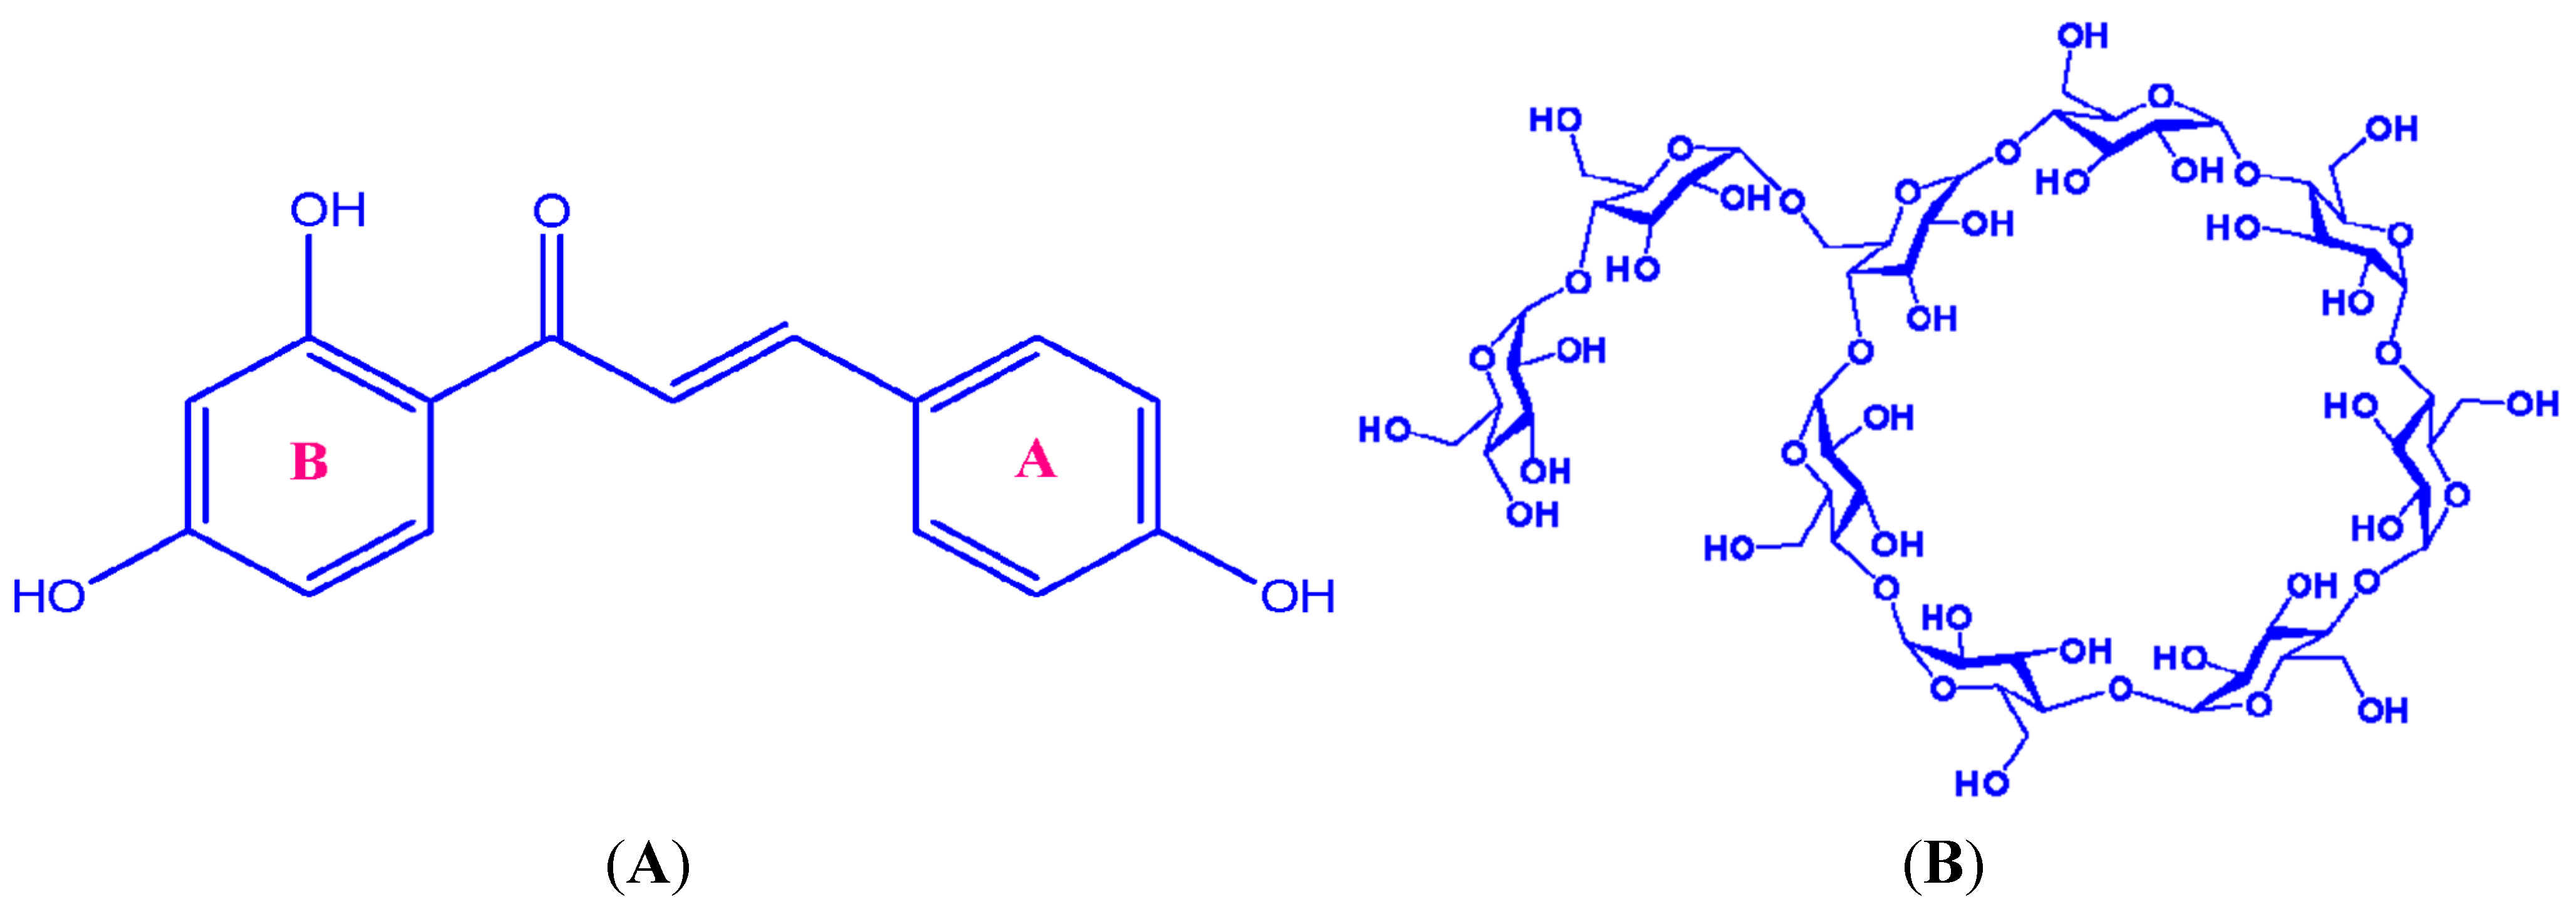
Experimental and Theoretical Investigations on the Supermolecular Structure of Isoliquiritigenin and 6-O-α-D-Maltosyl-β-cyclodextrin Inclusion Complex

Abstract
:
1. Introduction
2. Results and Discussion
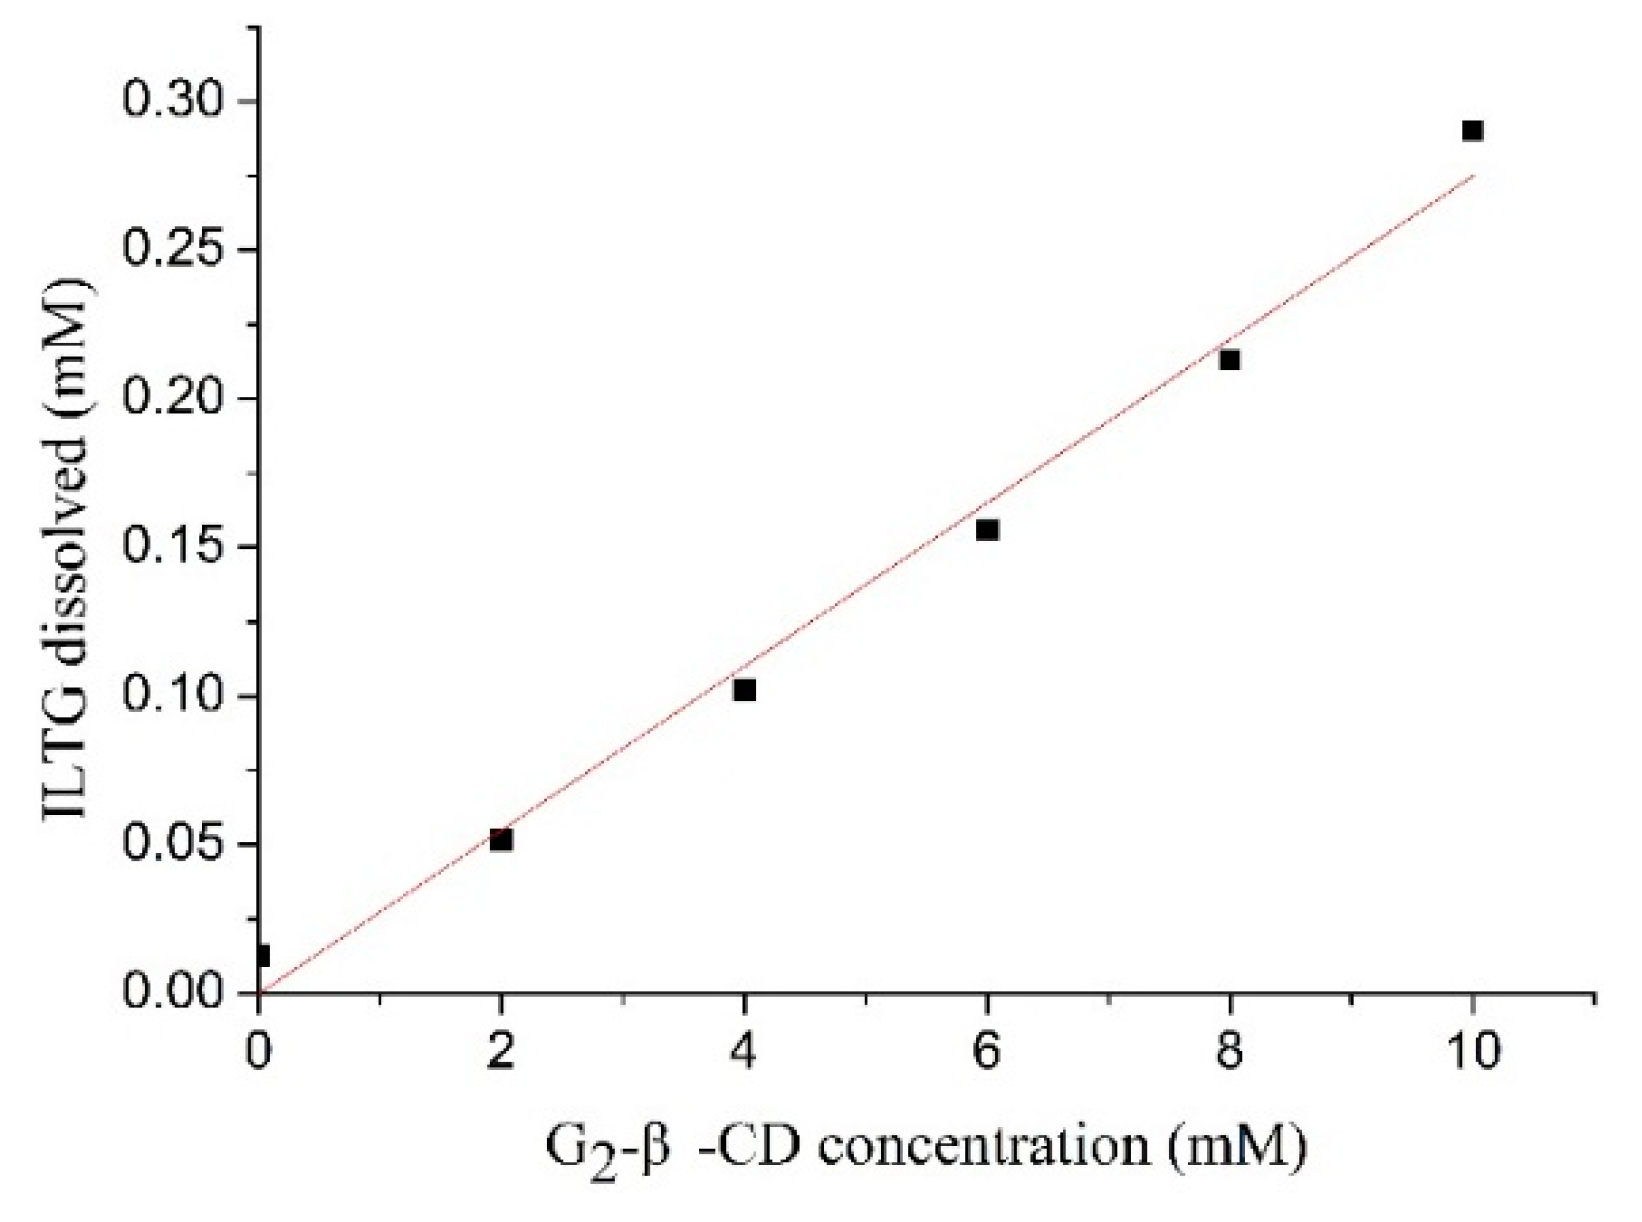
2.1. Enhanced Solubility of Isoliquiritigenin (ILTG) by the Inclusion with G2-β-CD
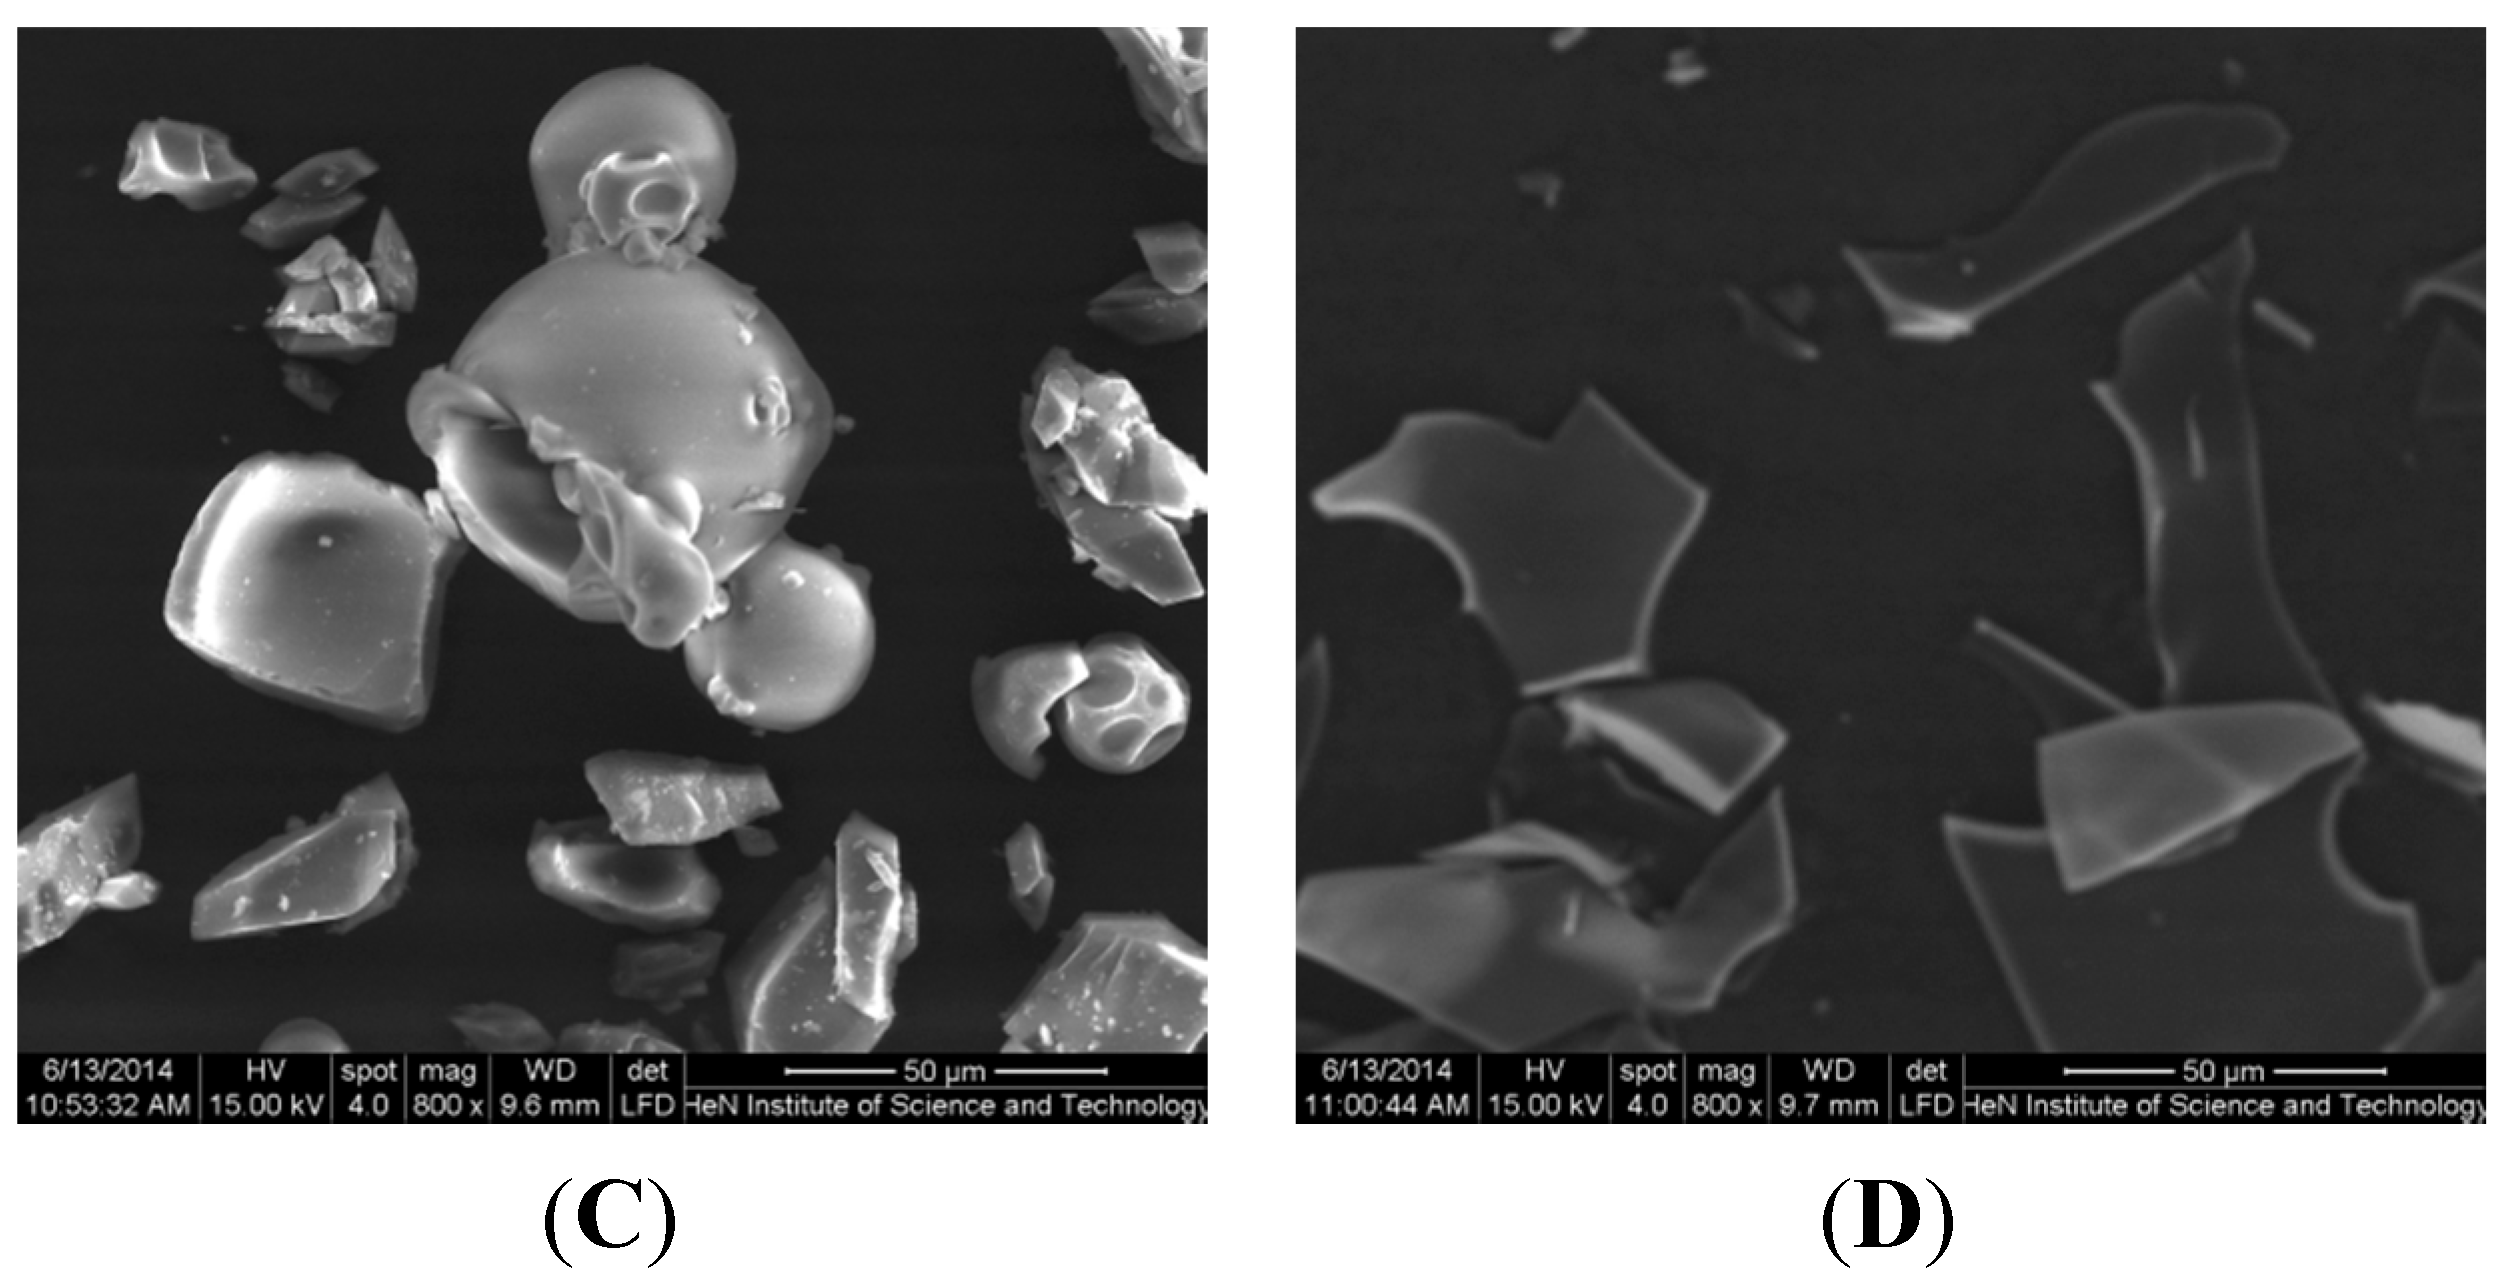
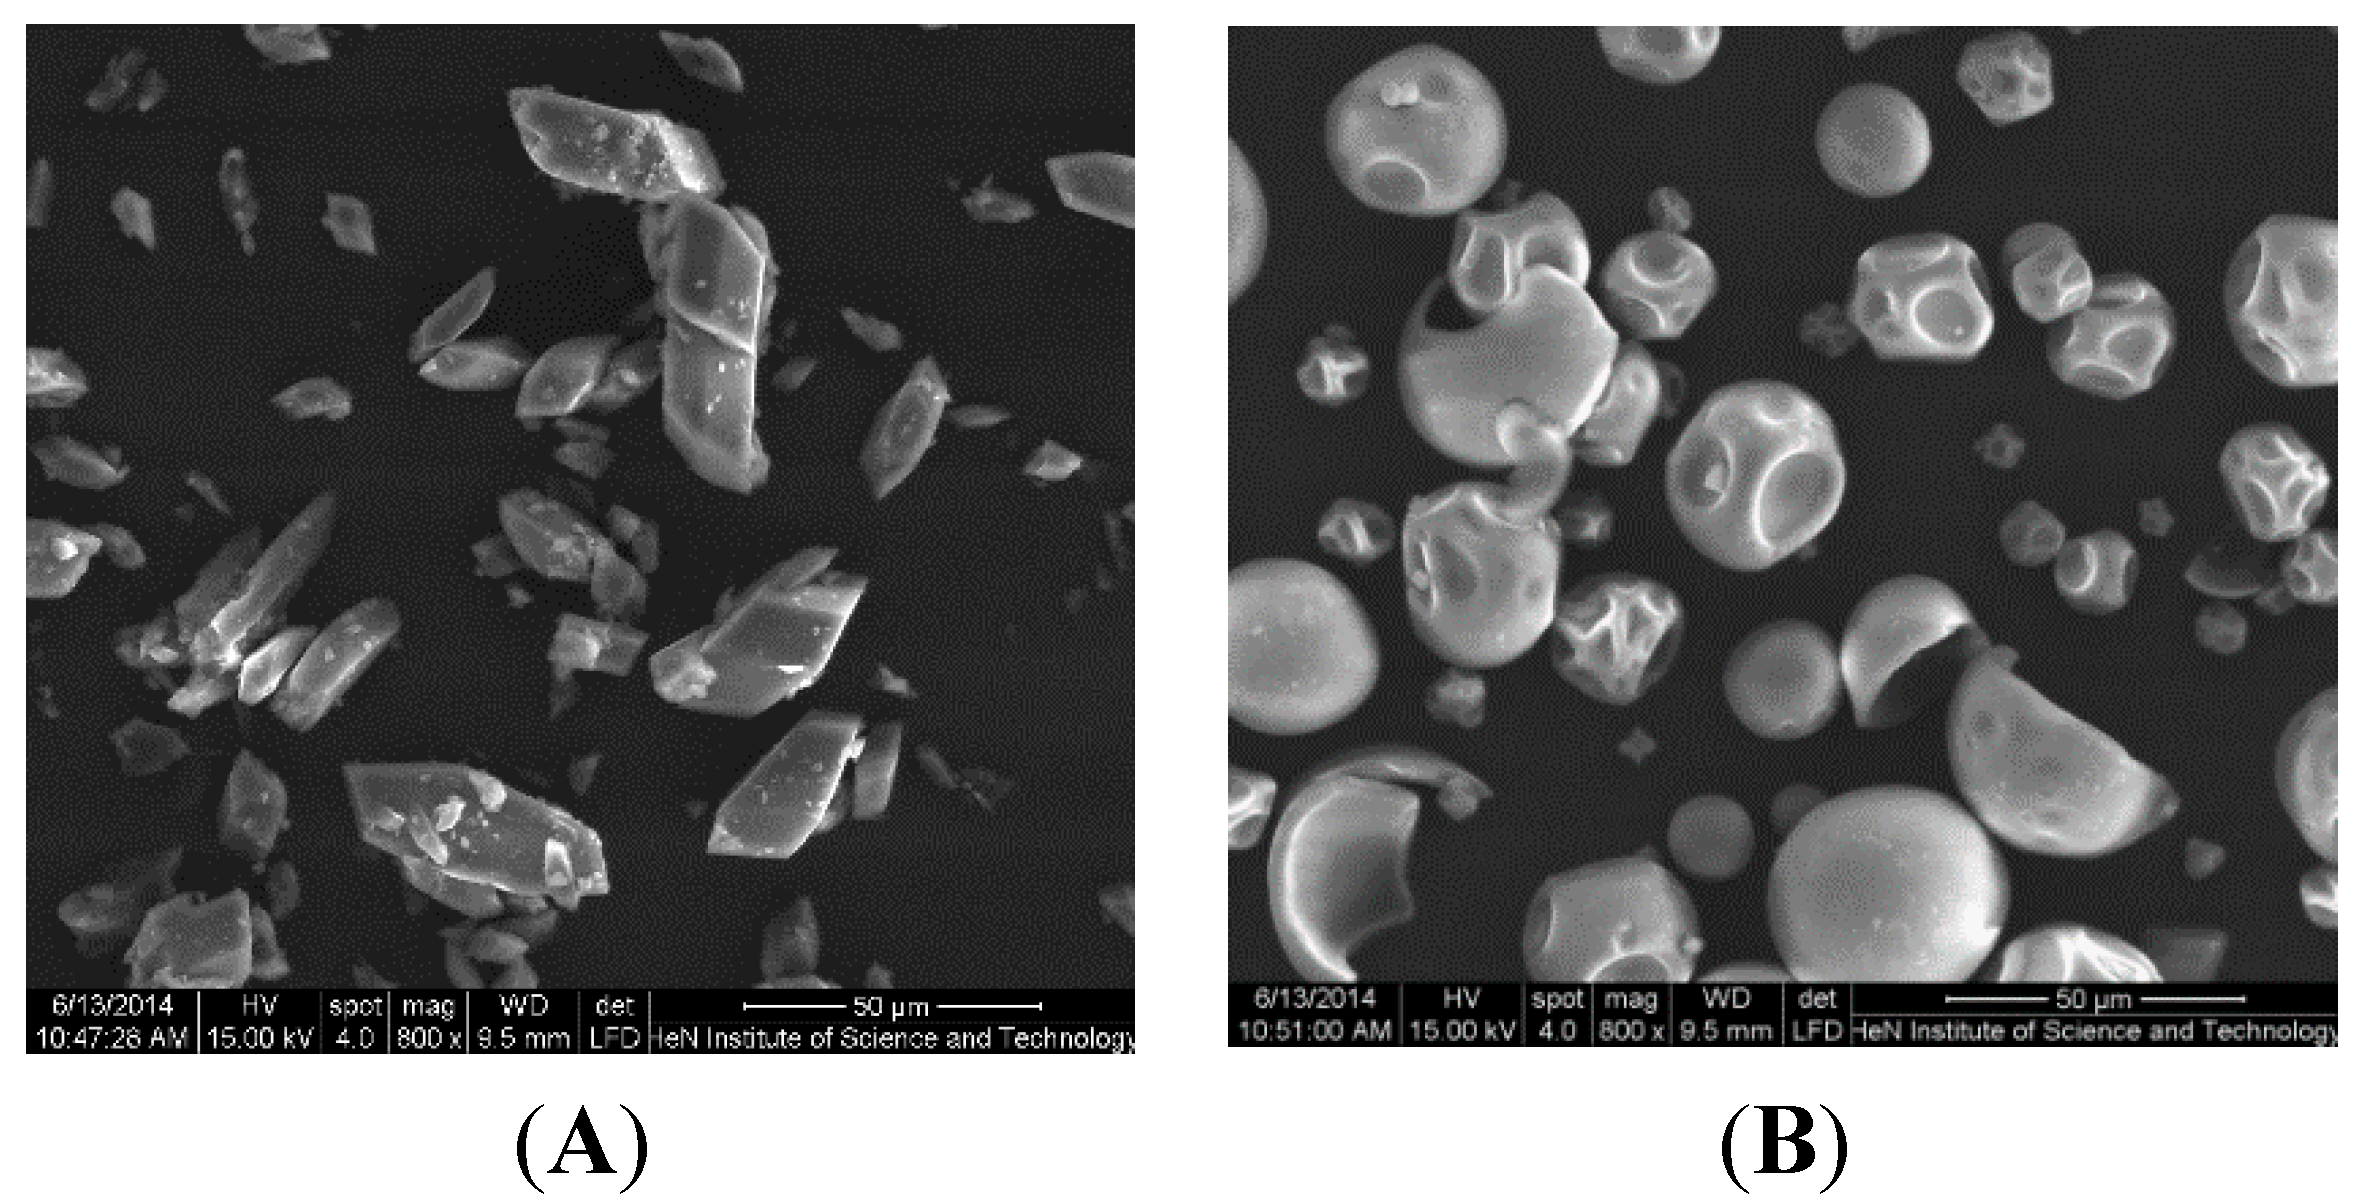
2.2. SEM Analysis

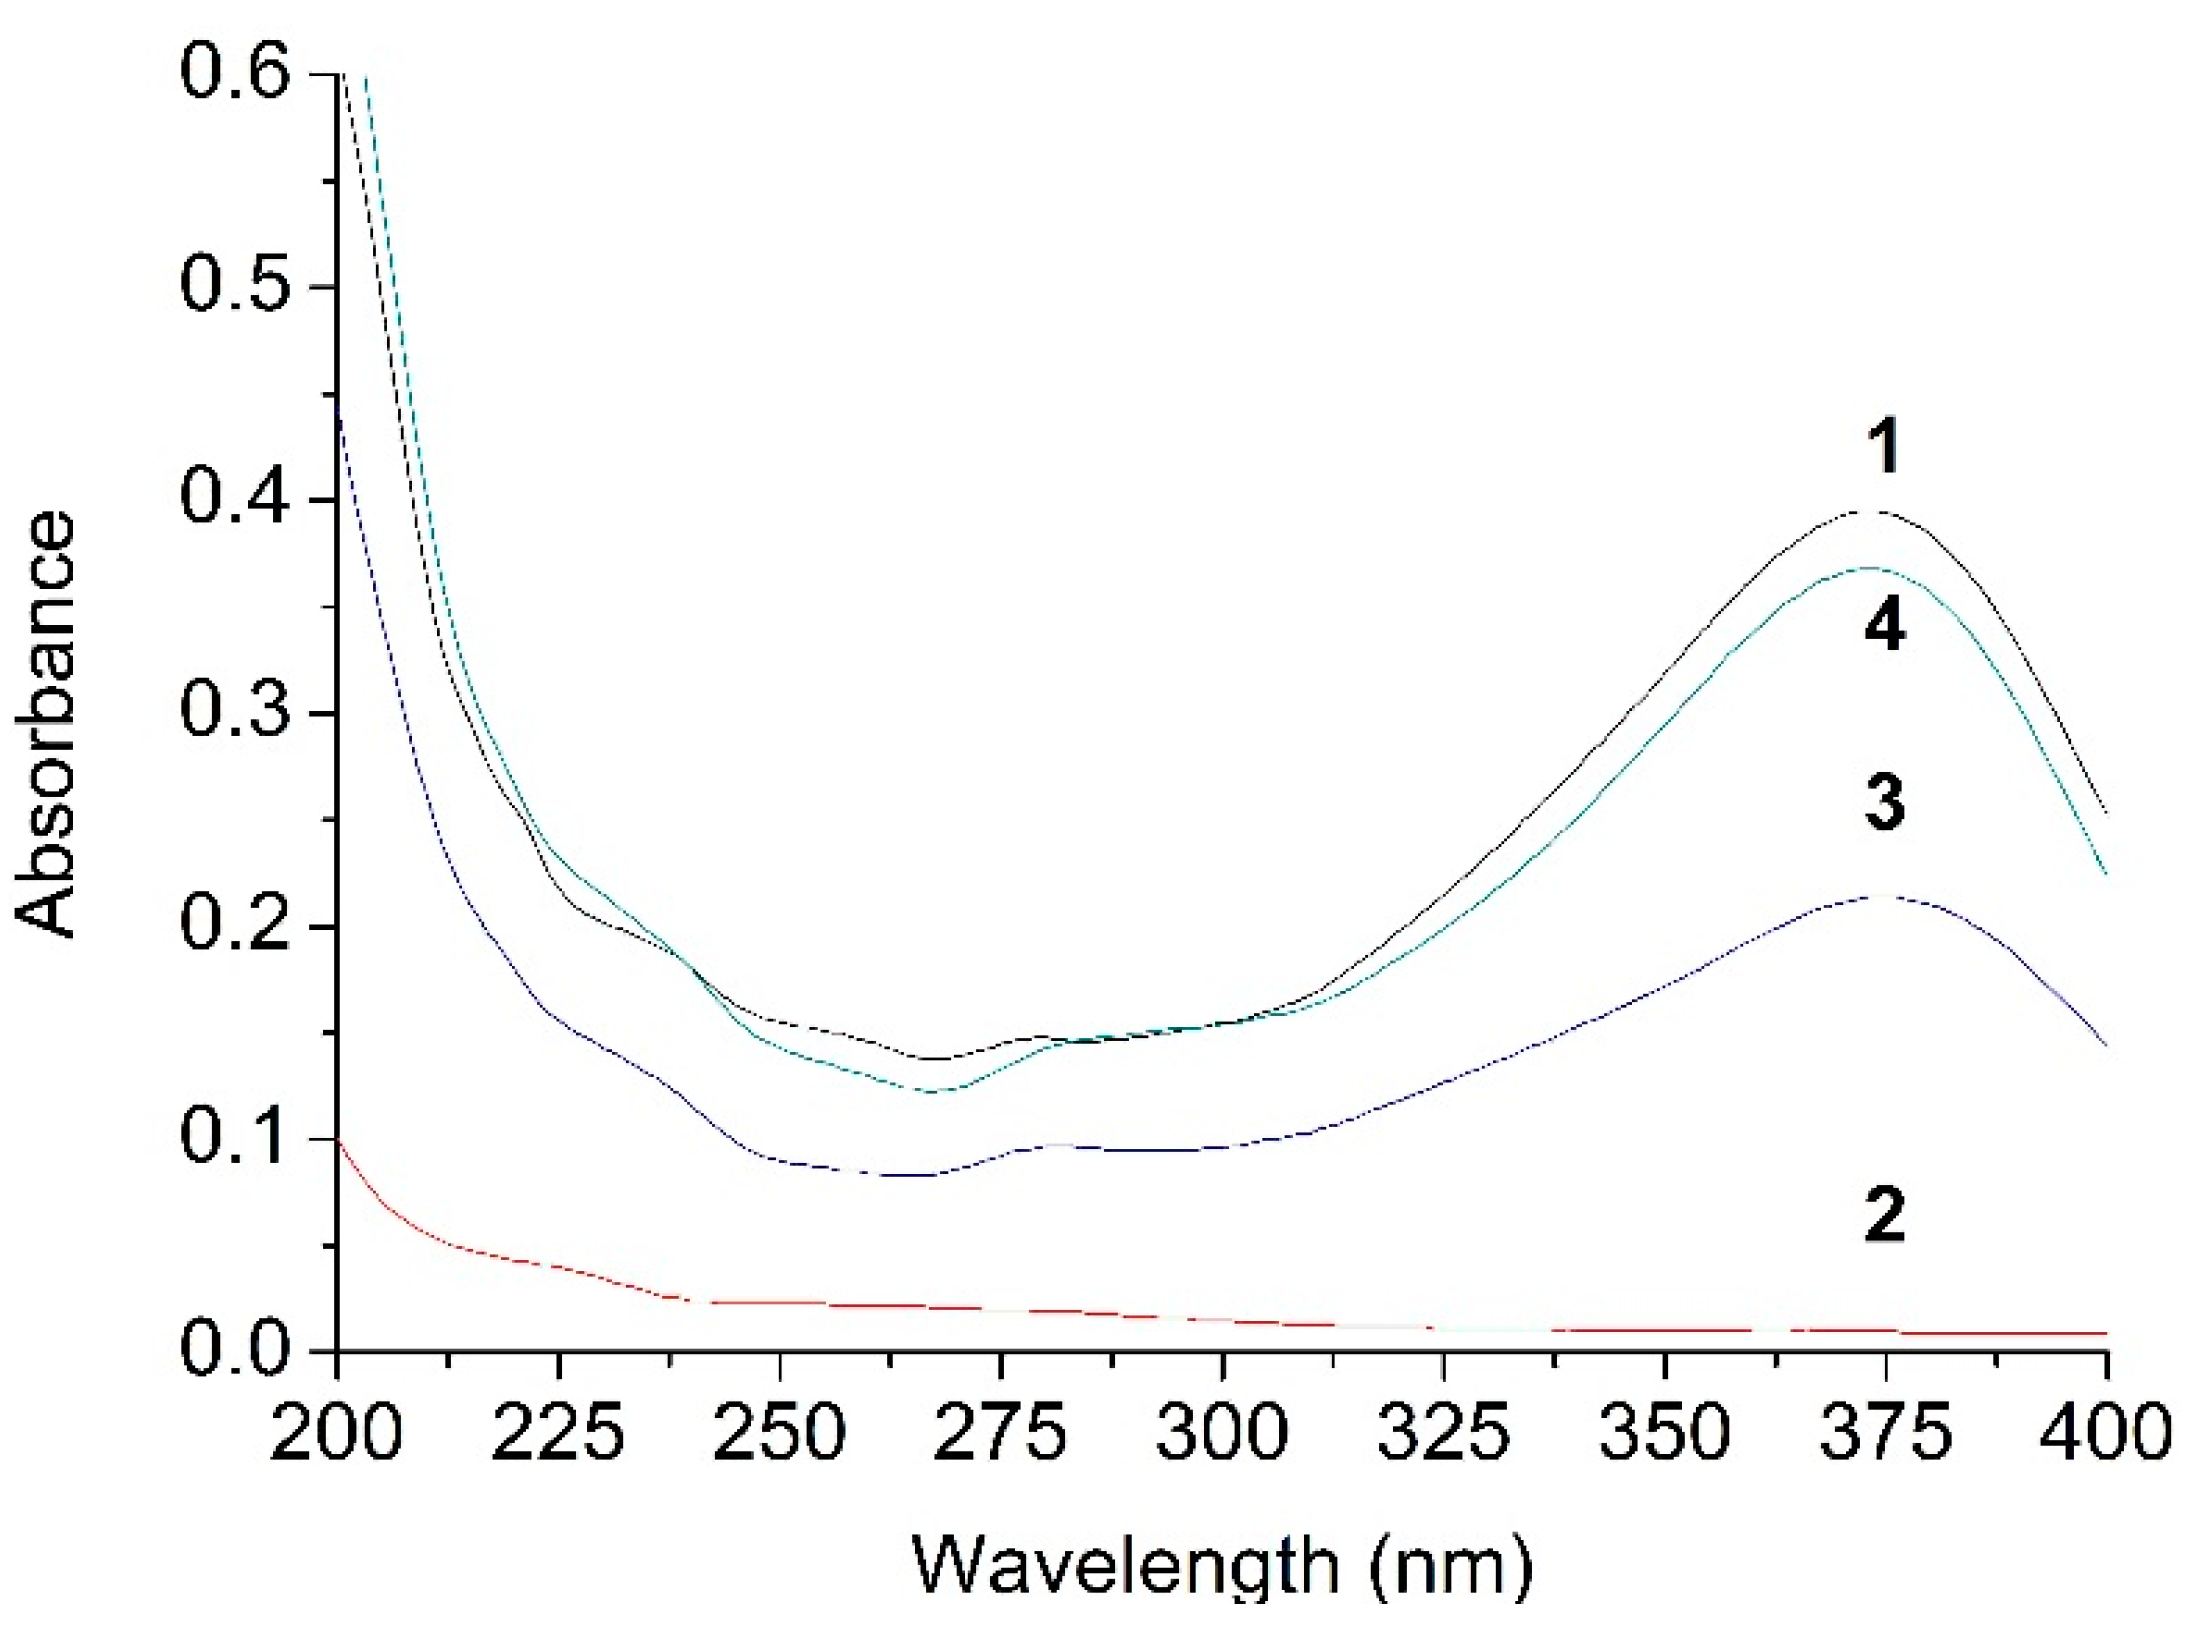
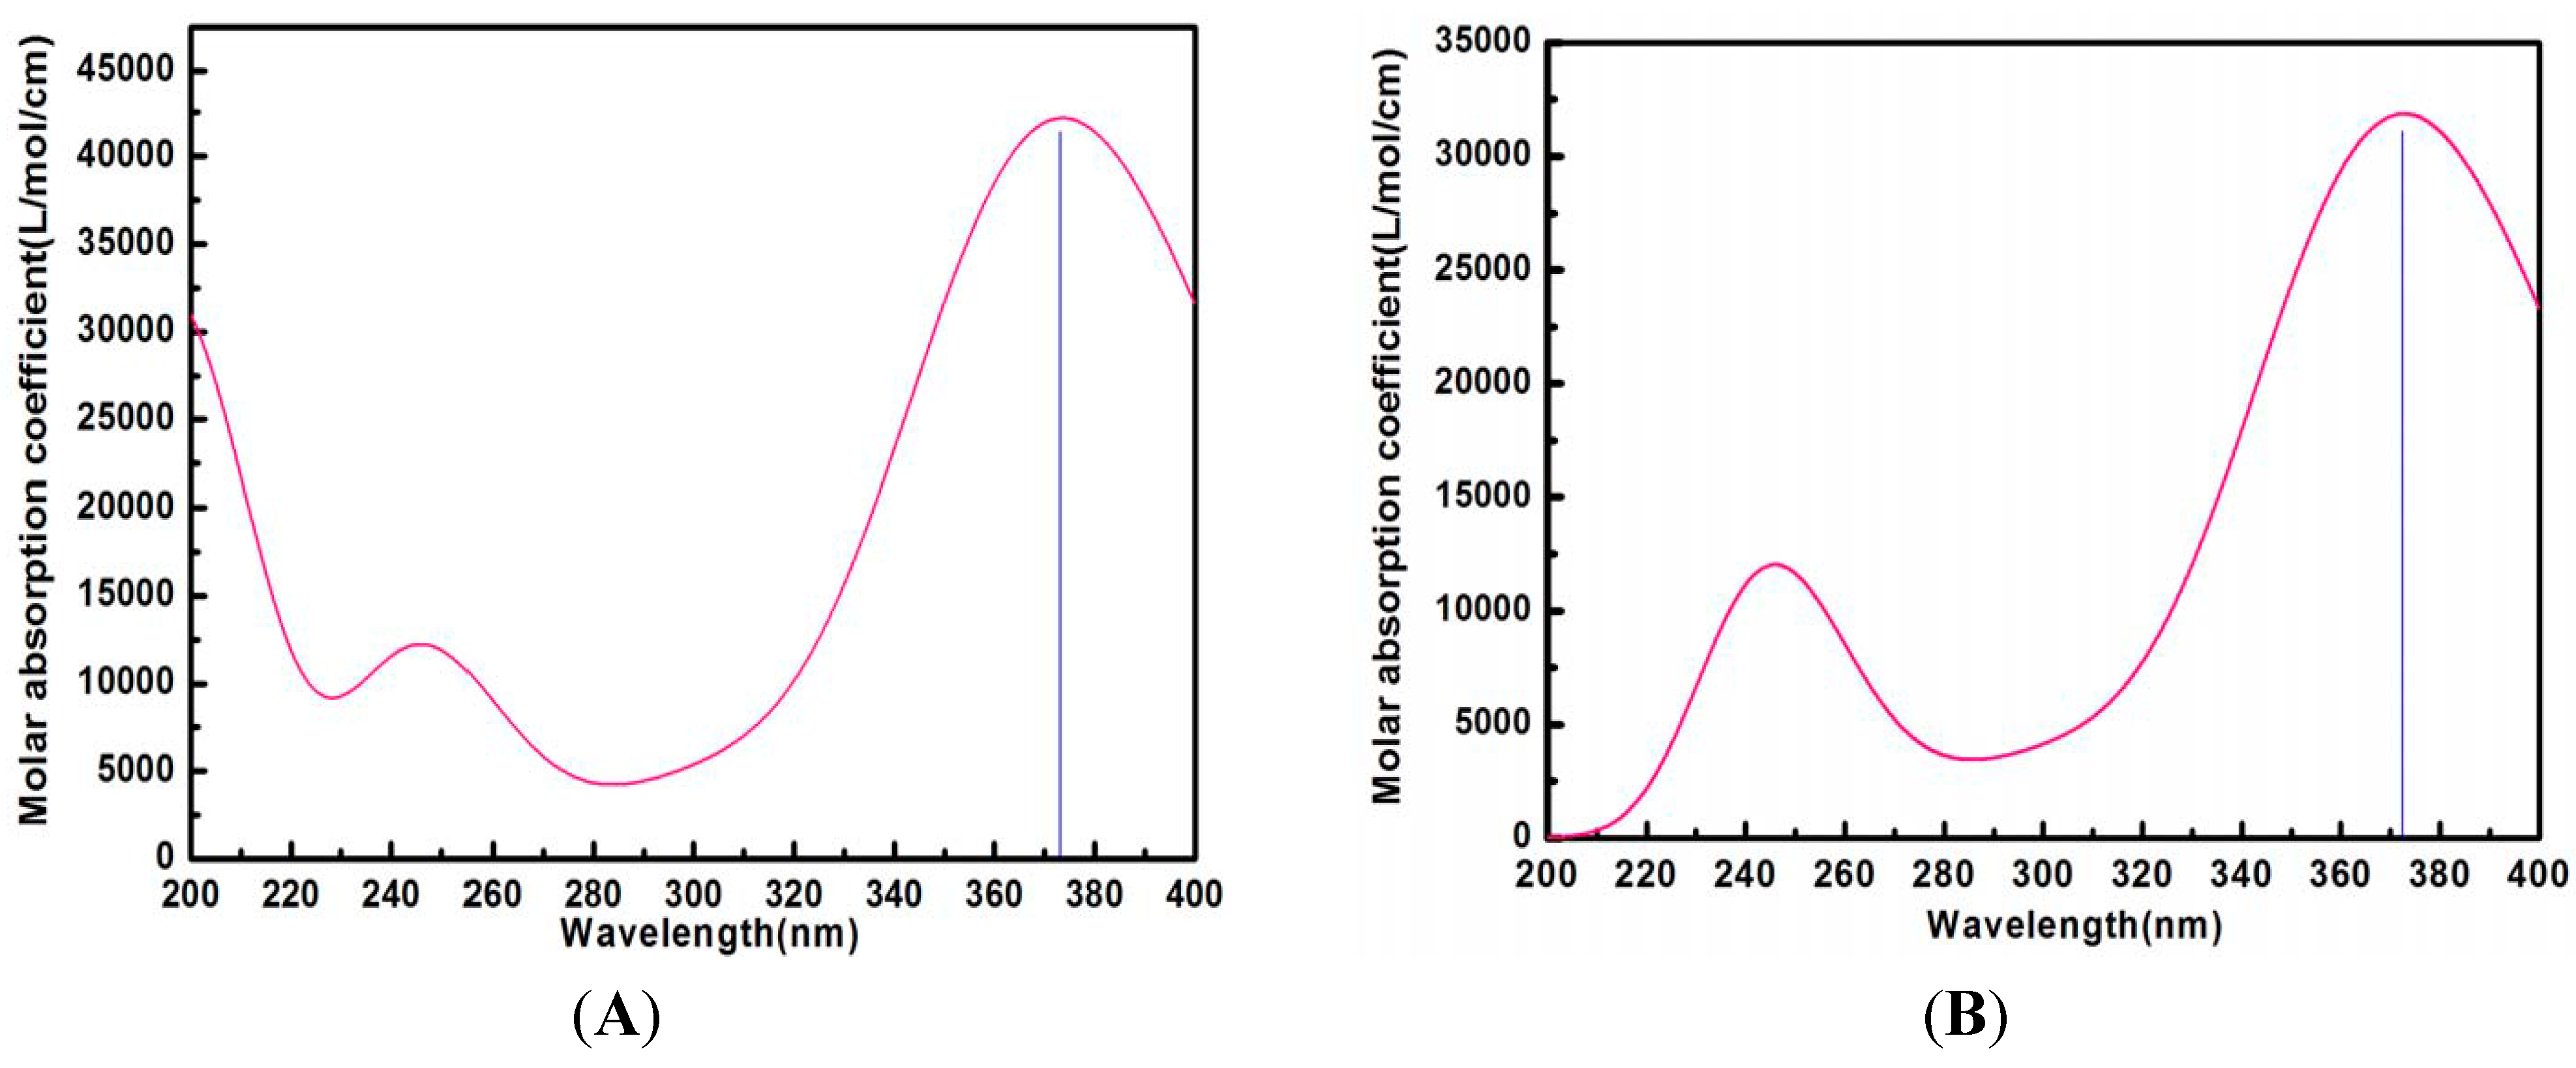
2.3. UV Analysis

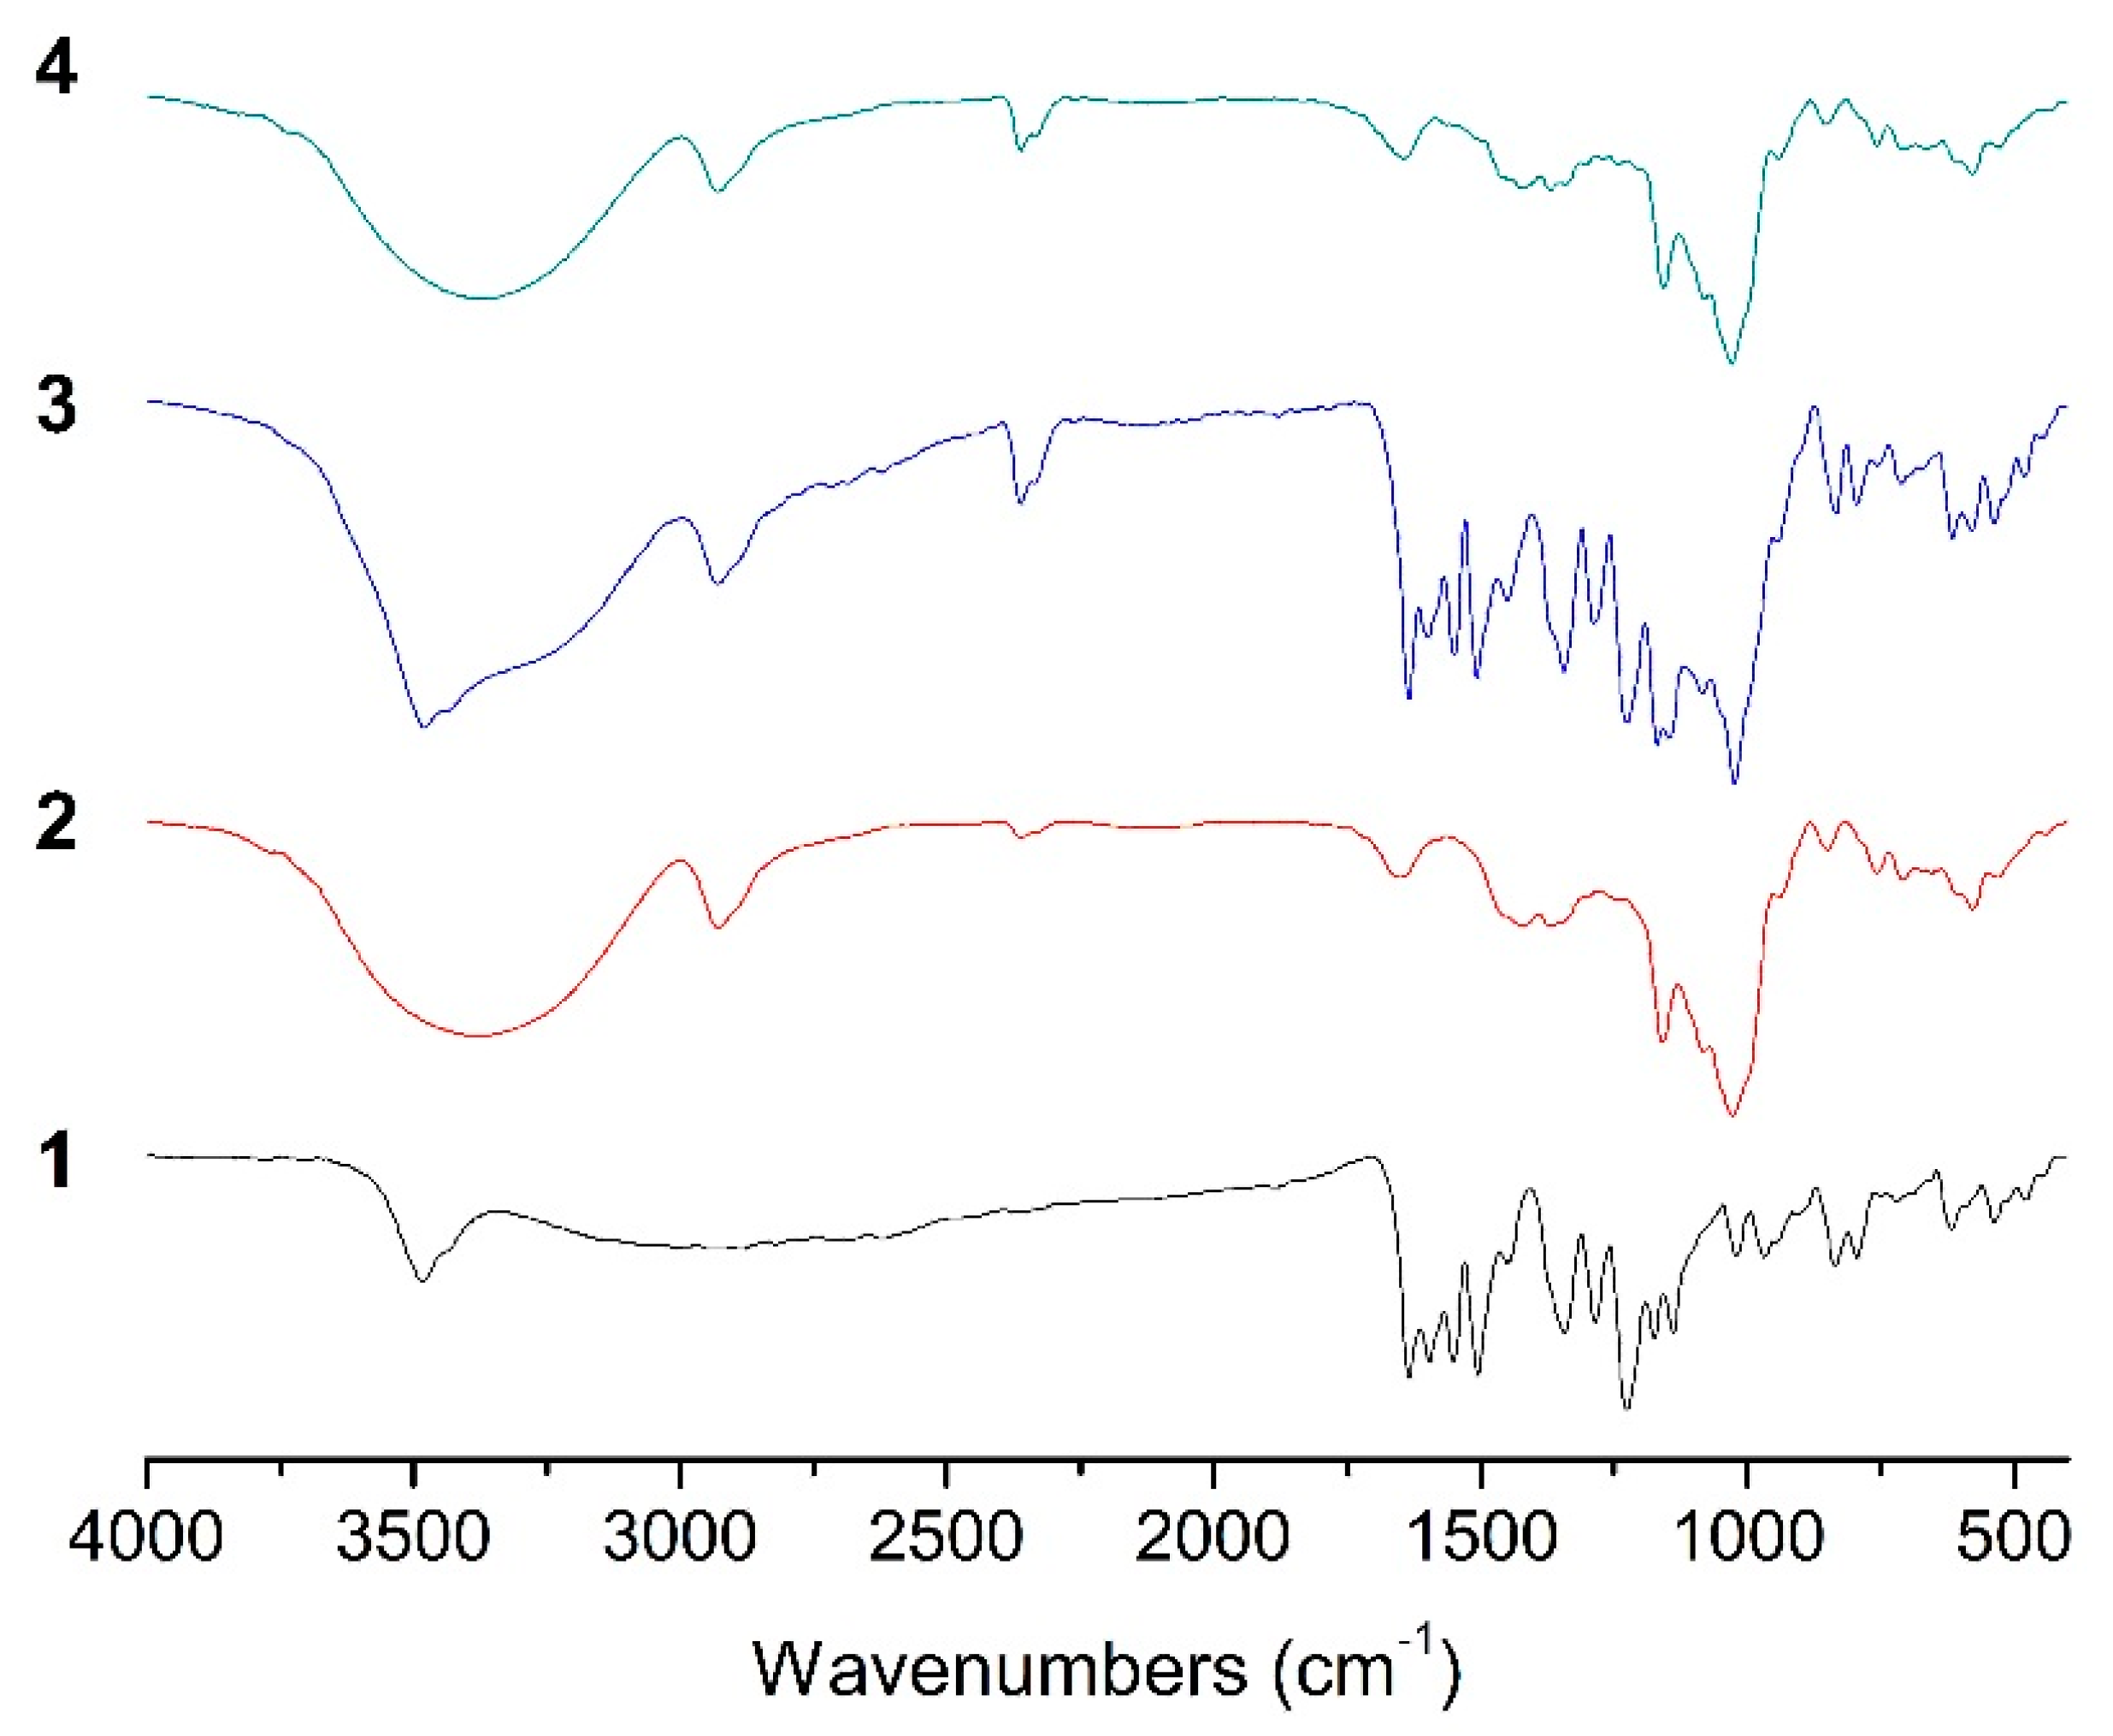
2.4. FT-IR Analysis

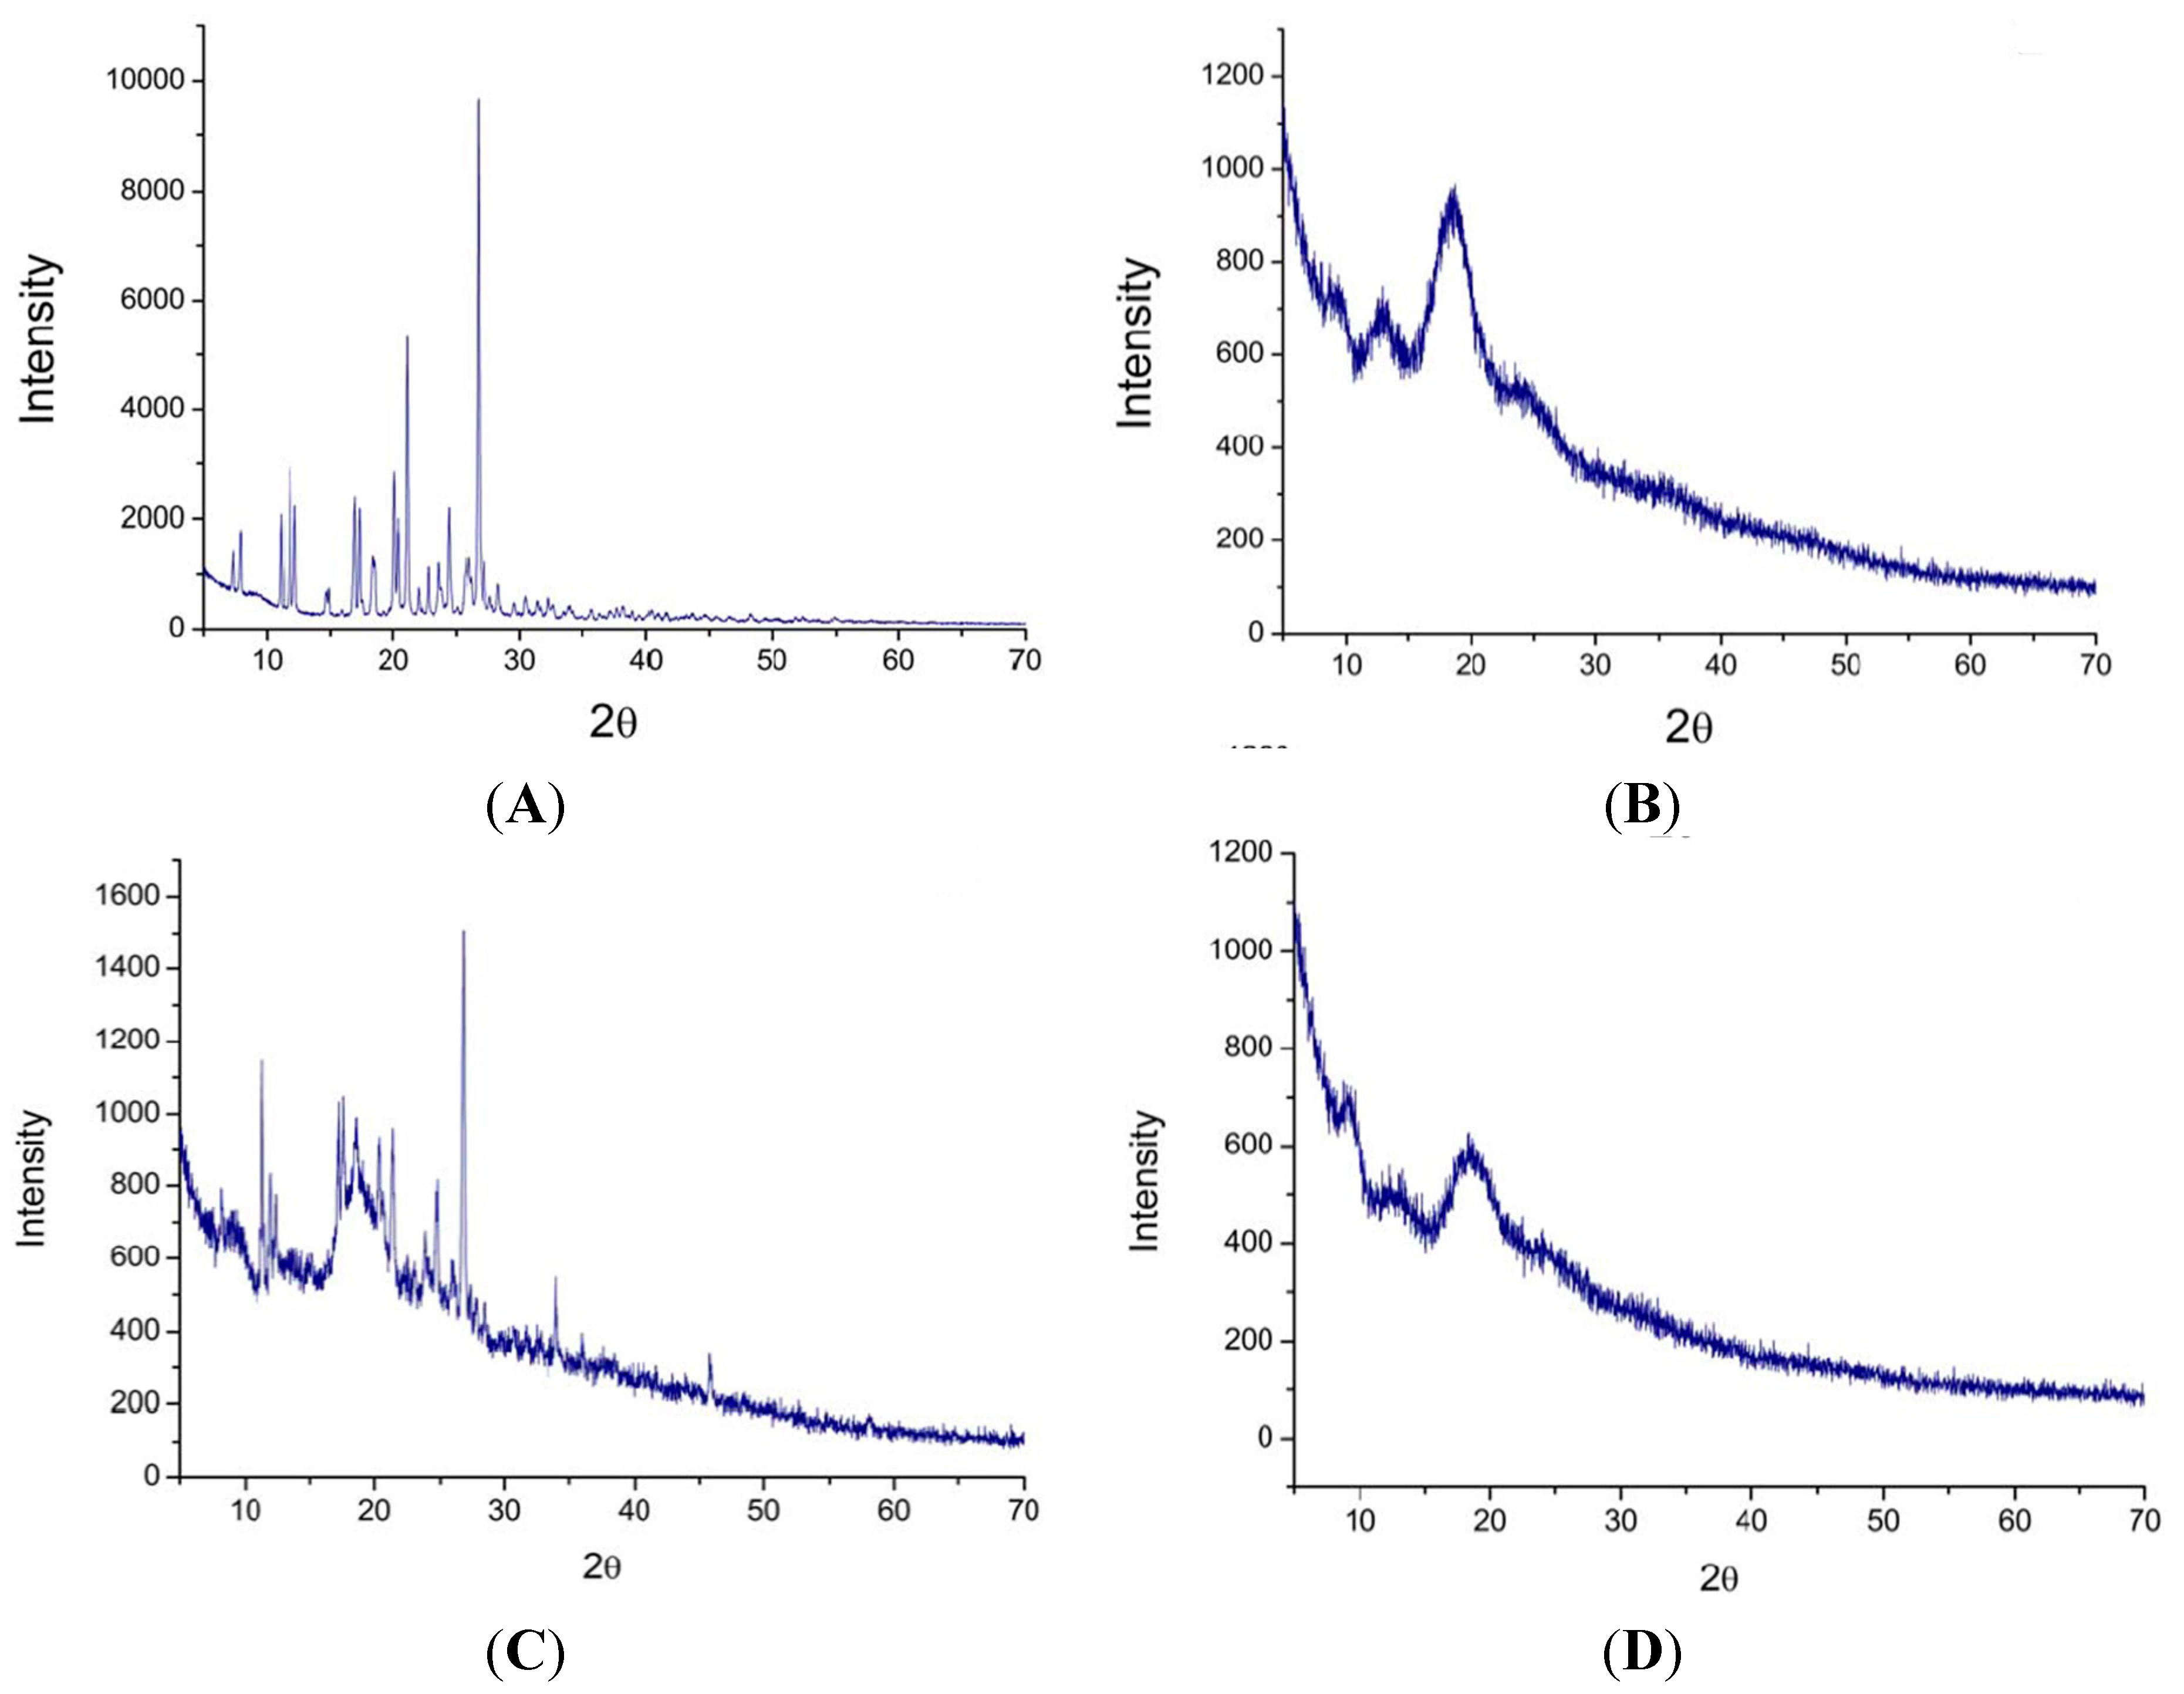
2.5. X-ray Powder Diffraction Pattern Analysis
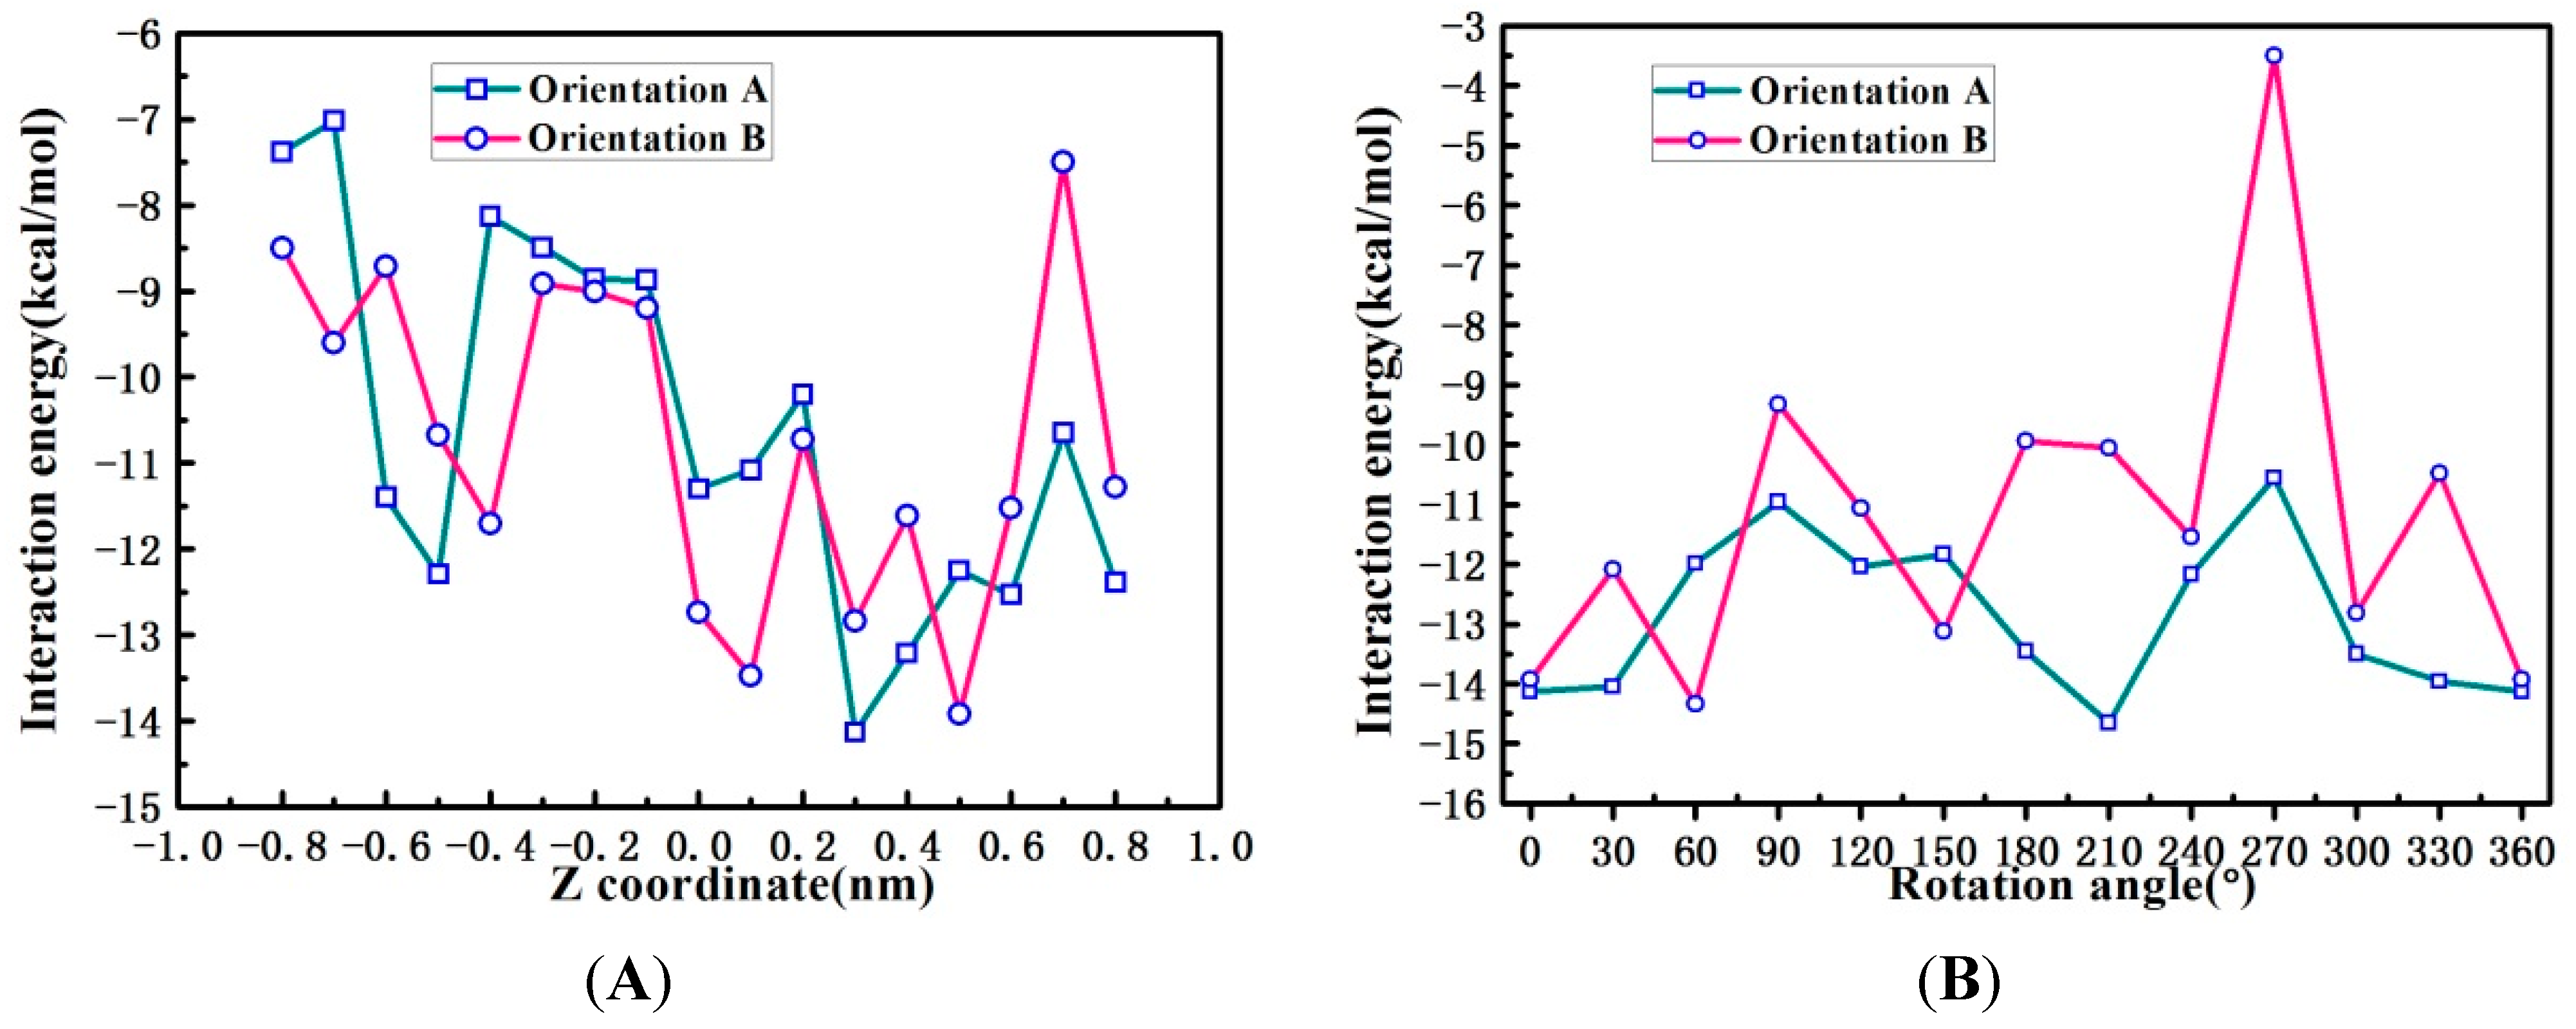
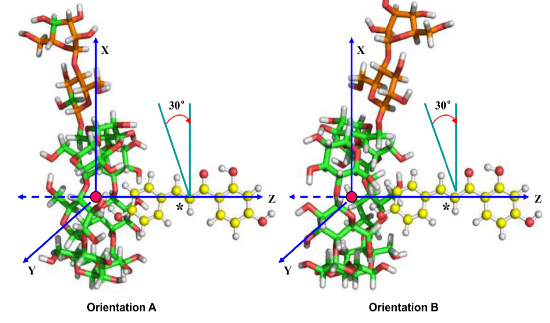
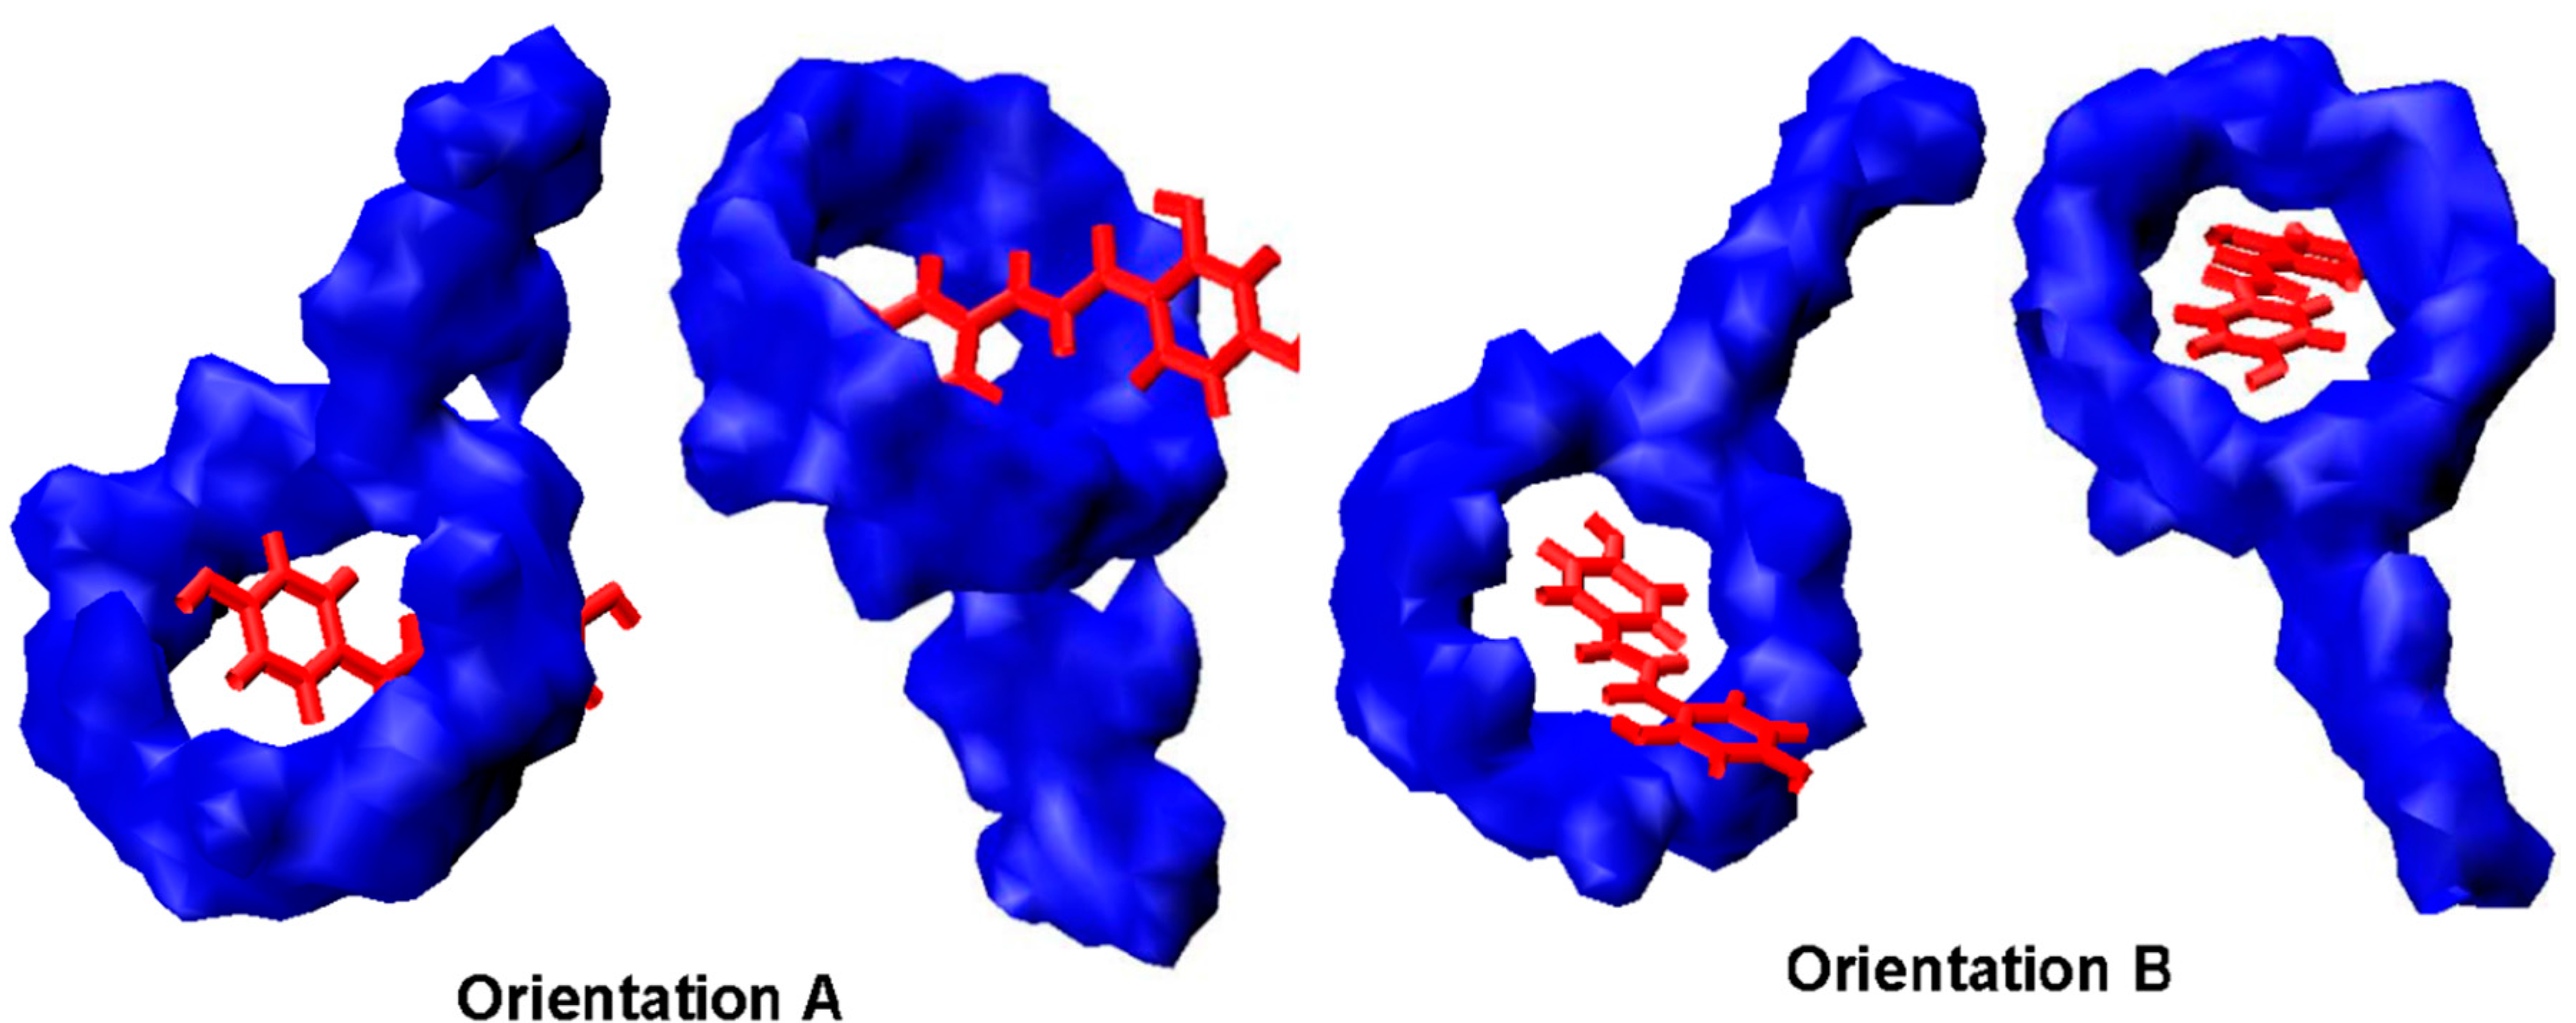
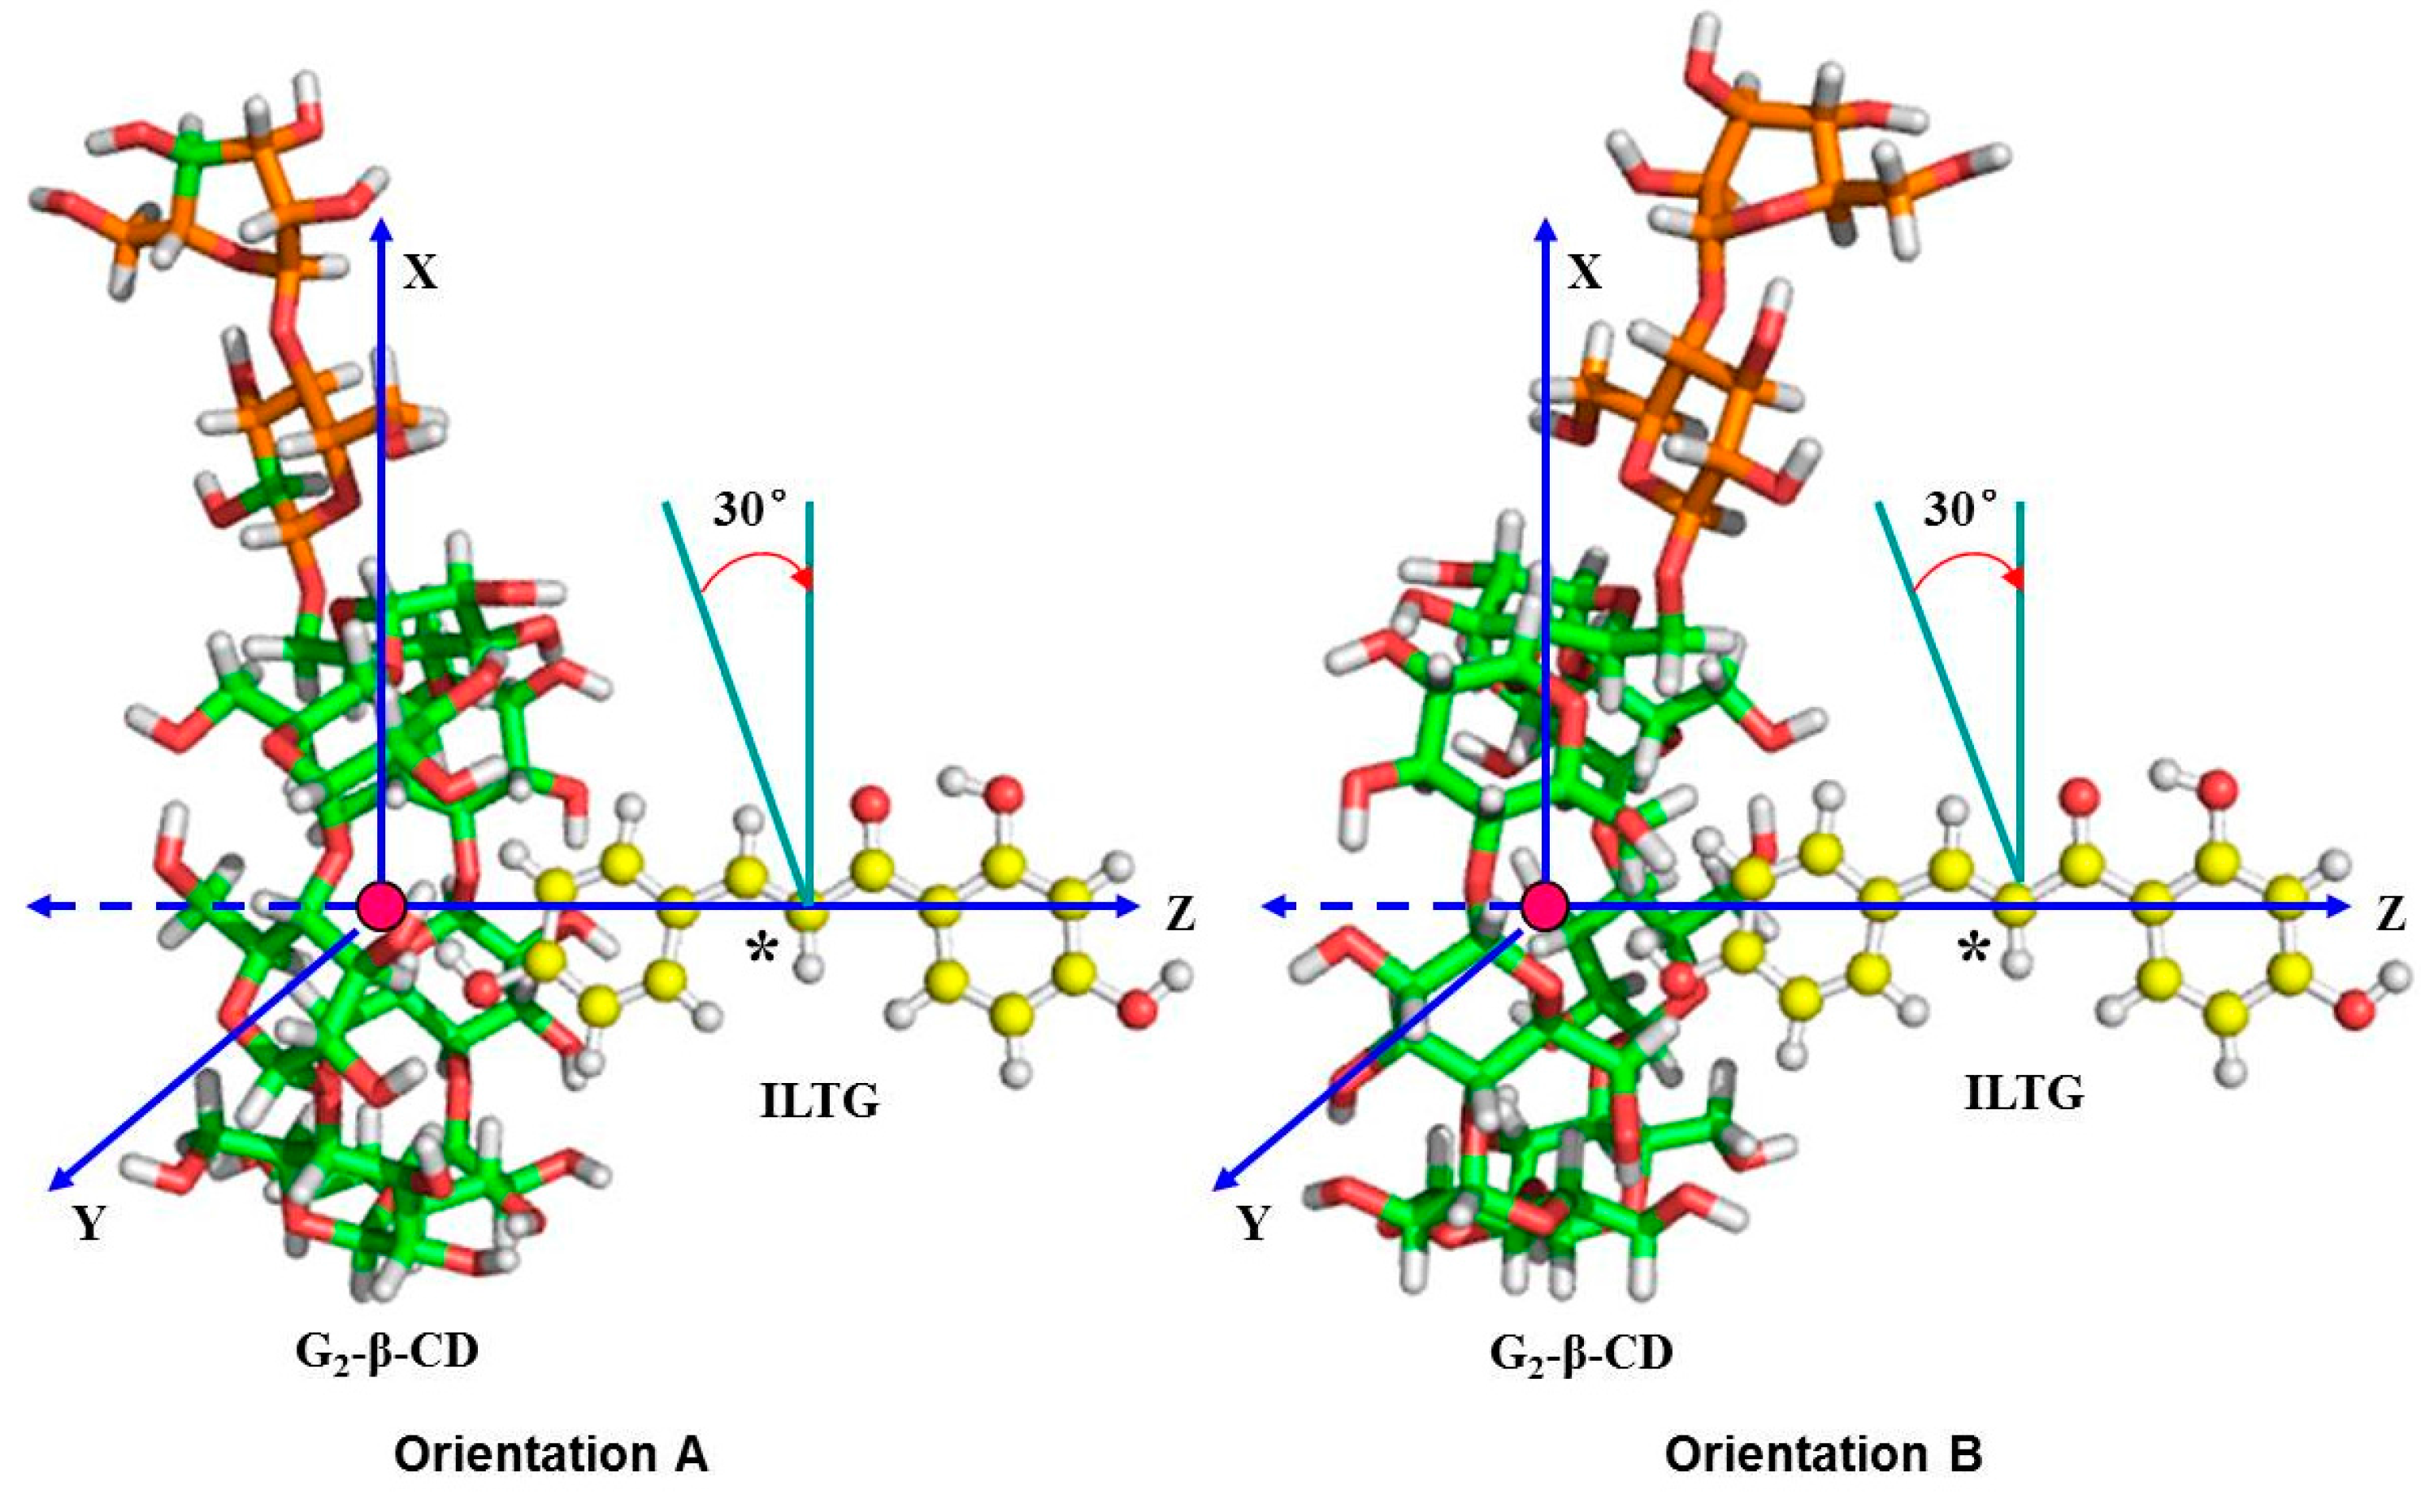
2.6. Binding Orientations of G2-β-CD with ILTG
2.7. Solvent Effects on Binding Selectivity of G2-β-CD with ILTG

2.8. Calculated UV Spectra in Water

2.9. Energies and Forces between ILTG and G2-β-CD in Water

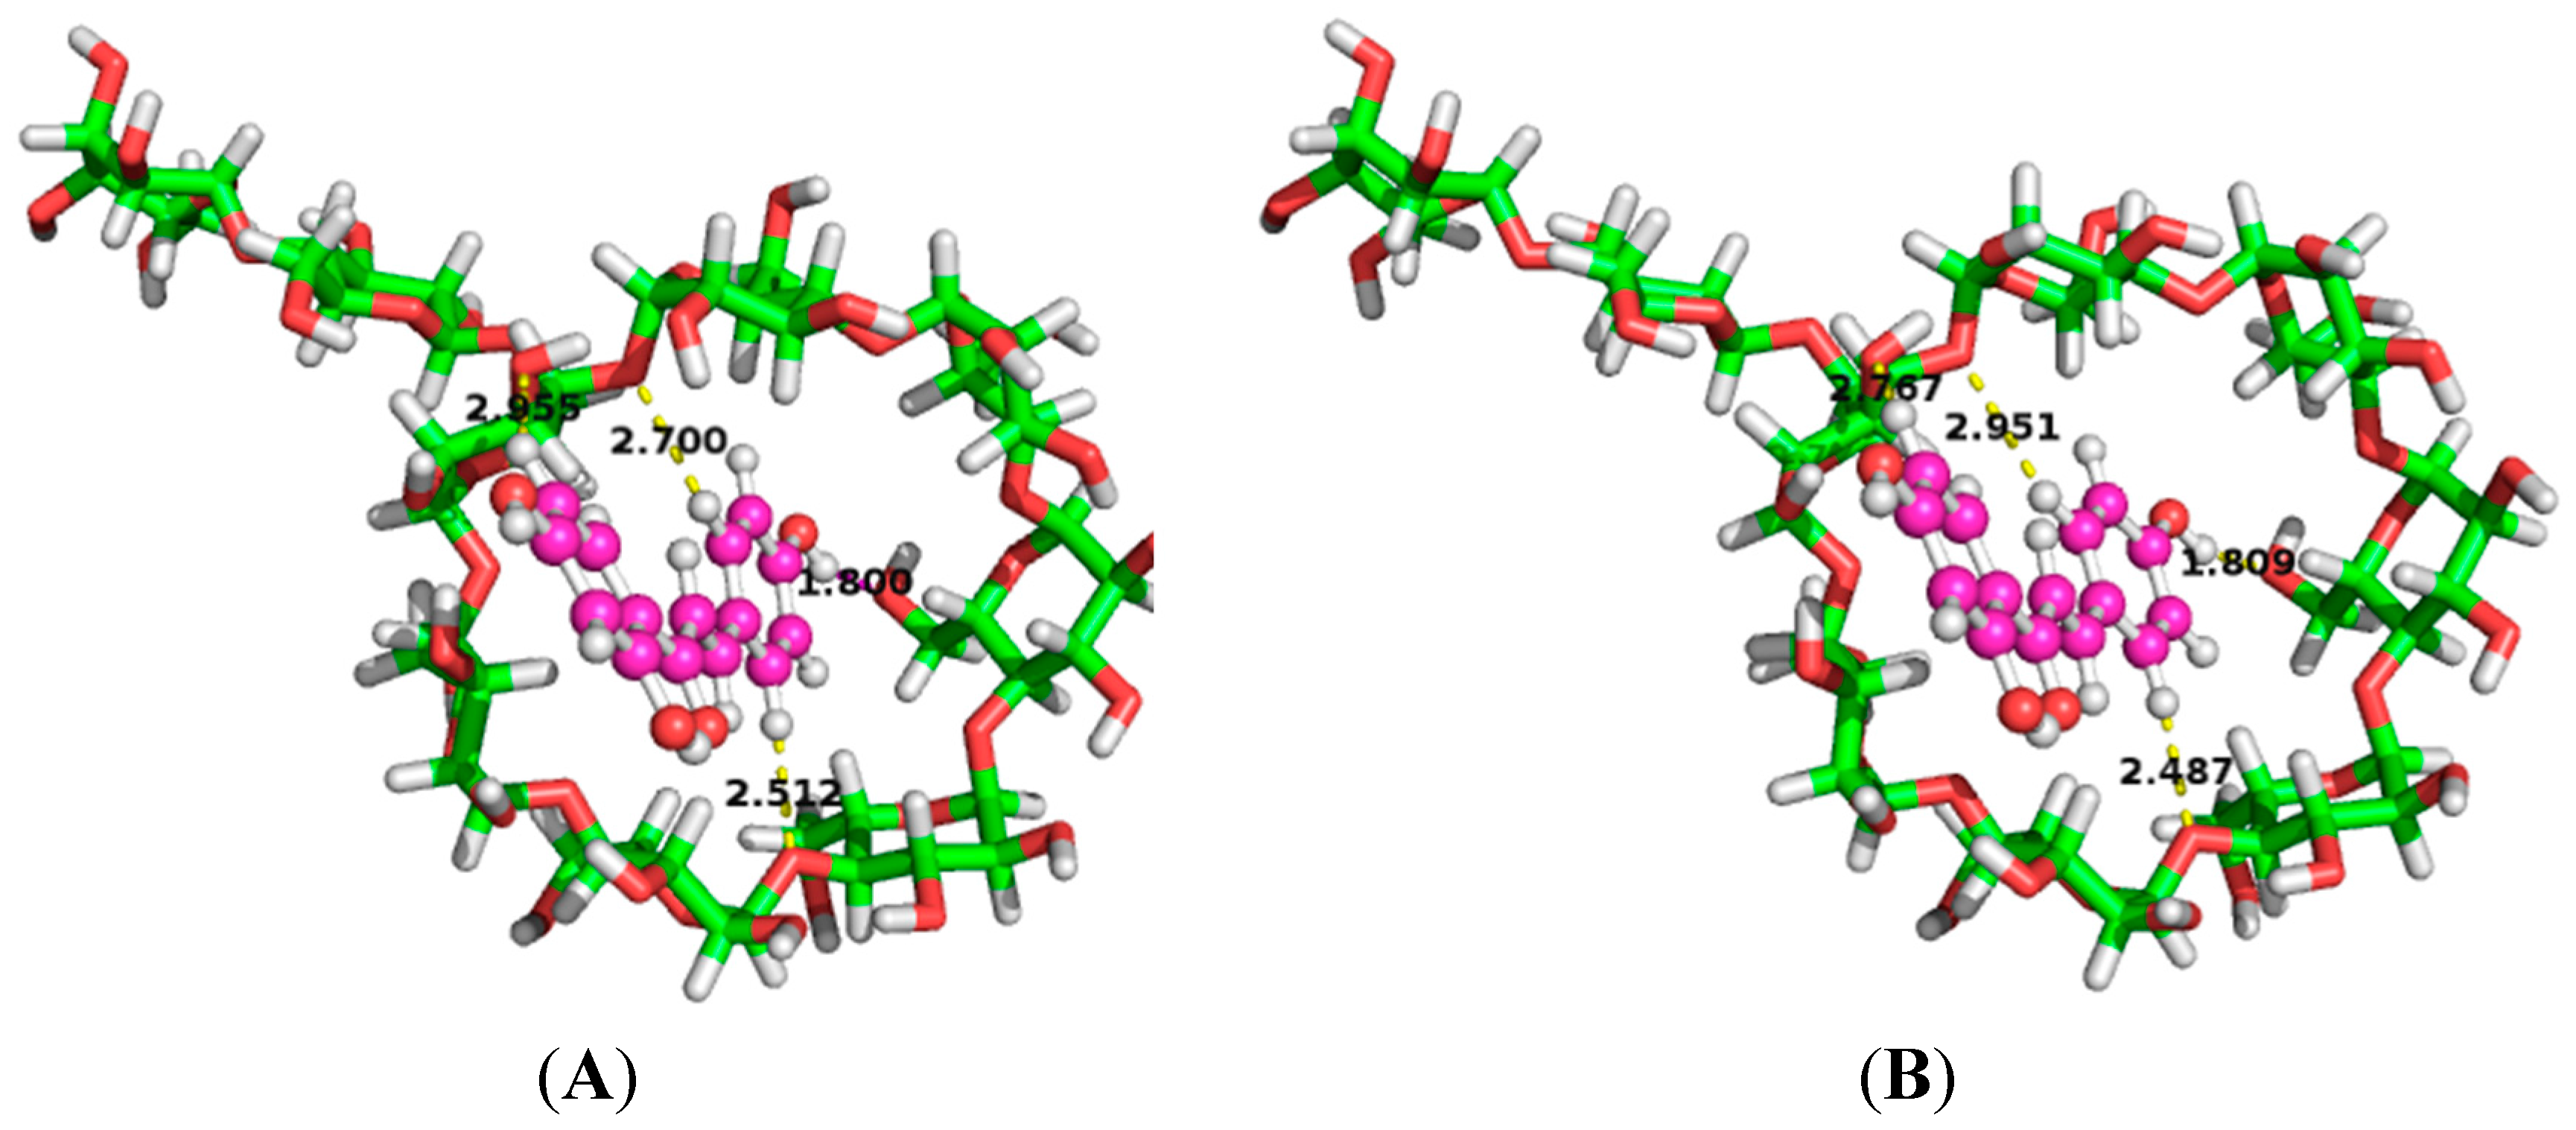
| Medium | Donor | Acceptor | Distance (Å) | Angle (°) | E(2) (kcal/mol) |
|---|---|---|---|---|---|
| Water | LP(1) O55 | BD * (1) C201-H214 | 2.51 | 159.68 | 1.70 |
| LP(1) O62 | BD * (1) H211-O217 | 1.80 | 155.47 | 2.95 | |
| LP(2) O74 | BD * (1) C195-H207 | 2.96 | 125.80 | 0.31 | |
| LP(1) O75 | BD * (1) C200-H215 | 2.70 | 140.55 | 0.77 | |
| Gas phase | LP(1) O55 | BD * (1) C201-H214 | 2.49 | 156.88 | 1.75 |
| LP(1) O62 | BD * (1) H211-O217 | 1.81 | 156.41 | 3.00 | |
| LP(2) O74 | BD * (1) C195-H207 | 2.77 | 145.84 | 0.49 | |
| LP(1) O75 | BD * (1) C200-H215 | 2.95 | 122.91 | 0.27 |
| Item | Water | Gas Phase |
|---|---|---|
| Dipole moment (Debye) | 3.233 | 2.586 |
| Charge of ILTG (e) | −0.053 | −0.046 |
| Charge of G2-β-CD (e) | 0.053 | 0.046 |
2.10. Adaptation Evidence of ILTG Induced by G2-β-CD
| Parameters | Water | Gas Phase | ||
|---|---|---|---|---|
| Free | Complex | Free | Complex | |
| (kcal/mol) | 0.75 | 0.71 | ||
| Dipole moment (Debye) | 3.597 | 3.680 | 2.697 | 2.830 |
| HOMO (kcal/mol) | −166.33 | −166.20 | −165.29 | −165.18 |
| LUMO (kcal/mol) | −30.92 | −30.32 | −26.68 | −26.40 |
| GAPHOMO-LUMO (kcal/mol) | −135.41 | −135.88 | −138.61 | −138.78 |
| Overall surface area (Å2) | 282.40 | 282.96 | 283.03 | 283.49 |
| Positive surface area (Å2) | 117.29 | 117.70 | 118.97 | 119.05 |
| Negative surface area (Å2) | 165.11 | 165.26 | 164.06 | 164.43 |
3. Experimental Section
3.1. Chemicals
3.2. Phase Solubility Study
3.3. Preparation of the Inclusion Complex and Physical Mixture of ILTG and G2-β-CD
3.4. Scanning Electron Microscopy
3.5. Ultraviolet-Visible Spectroscopy
3.6. Fourier Transform Infrared Spectroscopy
3.7. X-ray Diffractometry
3.8. ONIOM Host-Guest Simulations

3.9. ONIOM Interaction Calculations
4. Conclusions
Supplementary Files
Supplementary File 1Acknowledgments
Author Contributions
Conflicts of Interest
References
- Cao, Y.; Wang, Y.; Ji, C.; Ye, J. Determination of liquiritigenin and isoliquiritigenin in Glycyrrhiza uralensis and its medicinal preparations by capillary electrophoresis with electrochemical detection. J. Chromatogr. A 2004, 1042, 203–209. [Google Scholar] [CrossRef] [PubMed]
- Cho, S.; Kim, S.; Jin, Z.; Yang, H.; Han, D.; Baek, N.I.; Jo, J.; Cho, C.W.; Park, J.H.; Shimizu, M.; et al. Isoliquiritigenin, a chalcone compound, is a positive allosteric modulator of GABA(A) receptors and shows hypnotic effects. Biochem. Biophys. Res. Commun. 2011, 413, 637–642. [Google Scholar] [CrossRef] [PubMed]
- Lee, S.H.; Kim, J.Y.; Seo, G.S.; Kim, Y.C.; Sohn, D.H. Isoliquiritigenin, from Dalbergia odorifera, up-regulates anti-inflammatory heme oxygenase-1 expression in RAW264.7 macrophages. Inflamm. Res. 2009, 58, 257–262. [Google Scholar] [CrossRef] [PubMed]
- Chin, Y.W.; Jung, H.A.; Liu, Y.; Su, B.N.; Castoro, J.A.; Keller, W.J.; Pereira, M.A.; Kinghorn, A.D. Anti-oxidant constituents of the roots and stolons of licorice (Glycyrrhiza glabra). J. Agric. Food Chem. 2007, 55, 4691–4697. [Google Scholar] [CrossRef] [PubMed]
- Li, T.; Satomi, Y.; Katoh, D.; Shimada, J.; Baba, M.; Okuyama, T.; Nishino, H.; Kitamura, N. Induction of cell cycle arrest and p21(CIP1/WAF1) expression in human lung cancer cells by isoliquiritigenin. Cancer Lett. 2004, 207, 27–35. [Google Scholar]
- Kang, S.W.; Choi, J.S.; Choi, Y.J.; Bae, J.Y.; Li, J.; Kim, D.S.; Kim, J.L.; Shin, S.Y.; Lee, Y.J.; Kwun, I.S.; et al. Licorice isoliquiritigenin dampens angiogenic activity via inhibition of MAPK-responsive signaling pathways leading to induction of matrix metalloproteinases. J. Nutr. Biochem. 2010, 21, 55–65. [Google Scholar] [CrossRef] [PubMed]
- Kakegawa, H.; Matsumoto, H.; Satoh, T. Inhibitory effects of some natural products on the activation of hyaluronidase and their anti-allergic actions. Chem. Pharm. Bull. 1992, 40, 1439–1442. [Google Scholar] [CrossRef] [PubMed]
- Jang, E.Y.; Choe, E.S.; Hwang, M.; Kim, S.C.; Lee, J.R.; Kim, S.G.; Jeon, J.P.; Buono, R.J.; Yang, C.H. Isoliquiritigenin suppresses cocaine-induced extracellular dopamine release in rat brain through GABA(B) receptor. Eur. J. Pharmacol. 2008, 587, 124–128. [Google Scholar] [CrossRef] [PubMed]
- Gotsev, M.G.; Ivanov, P.M. Molecular dynamics of large-ring cyclodextrins: Principal component analysis of the conformational interconversions. J. Phys. Chem. B 2009, 113, 5752–5759. [Google Scholar] [CrossRef] [PubMed]
- Nguyen, T.A.; Liu, B.G.; Zhao, J.; Thomas, D.S.; Hook, J.M. An investigation into the supramolecular structure, solubility, stability and antioxidant activity of rutin/cyclodextrin inclusion complex. Food Chem. 2013, 136, 186–192. [Google Scholar] [CrossRef] [PubMed]
- Fuchs, R.; Habermann, N.; Klufers, P. Multinuclear sandwich-type complexes of deprotonated β-cyclodextrin and copper(II) ions—Polyol-metal complexes. Angew. Chem. Int. Ed. Engl. 1993, 32, 852–854. [Google Scholar] [CrossRef]
- Irie, T.; Uekama, K. Pharmaceutical applications of cyclodextrins. III. Toxicological issues and safety evaluation. J. Pharm. Sci. 1997, 86, 147–162. [Google Scholar] [CrossRef] [PubMed]
- Horvath, G.; Premkumar, T.; Boztas, A.; Lee, E.; Jon, S.; Geckeler, K.E. Supramolecular nanoencapsulation as a tool: Solubilization of the anticancer drug trans-dichloro(dipyridine)platinum(II) by complexation with β-cyclodextrin. Mol. Pharm. 2008, 5, 358–363. [Google Scholar] [CrossRef] [PubMed]
- Villalonga, R.; Cao, R.; Fragoso, A. Supramolecular chemistry of cyclodextrins in enzyme technology. Chem. Rev. 2007, 107, 3088–3116. [Google Scholar] [CrossRef] [PubMed]
- Davis, M.E.; Brewster, M.E. Cyclodextrin-based pharmaceutics: Past, present and future. Nat. Rev. Drug Discov. 2004, 3, 1023–1035. [Google Scholar] [CrossRef] [PubMed]
- Zhang, J.; Ma, P.X. Cyclodextrin-based supramolecular systems for drug delivery: Recent progress and future perspective. Adv. Drug Deliv. Rev. 2013, 65, 1215–1233. [Google Scholar] [CrossRef] [PubMed]
- Szejtli, J. Introduction and General Overview of Cyclodextrin Chemistry. Chem. Rev. 1998, 98, 1743–1754. [Google Scholar] [CrossRef] [PubMed]
- Stella, V.J.; Rajewski, R.A. Cyclodextrins: Their future in drug formulation and delivery. Pharm. Res. 1997, 14, 556–567. [Google Scholar] [CrossRef] [PubMed]
- Uekama, K.; Otagiri, M. Cyclodextrins in drug carrier systems. Crit. Rev. Ther. Drug Carrier Syst. 1987, 3, 1–40. [Google Scholar] [CrossRef] [PubMed]
- Uehata, K.; Anno, T.; Hayashida, K.; Higashi, T.; Motoyama, K.; Hirayama, F.; Uekama, K.; Arima, H. Peak-less hypoglycemic effect of insulin glargine by complexation with maltosyl-β-cyclodextrin. Int. J. Pharm. 2012, 422, 33–39. [Google Scholar] [CrossRef] [PubMed]
- Uekama, K.; Hirayama, F.; Irie, T. Cyclodextrin drug carrier systems. Chem. Rev. 1998, 98, 2045–2076. [Google Scholar] [CrossRef] [PubMed]
- Lucas-Abellan, C.; Gabaldon-Hernandez, J.A.; Penalva, J.; Fortea, M.I.; Nunez-Delicado, E. Preparation and characterization of the inclusion complex of chlorpyrifos in cyclodextrins to improve insecticide formulations. J. Agric. Food Chem. 2008, 56, 8081–8085. [Google Scholar] [CrossRef] [PubMed]
- Lopez-Nicolas, J.M.; Perez-Lopez, A.J.; Carbonell-Barrachina, A.; Garcia-Carmona, F. Kinetic study of the activation of banana juice enzymatic browning by the addition of maltosyl-β-cyclodextrin. J. Agric. Food Chem. 2007, 55, 9655–9662. [Google Scholar] [CrossRef] [PubMed]
- Connors, K.A. The stability of cyclodextrin complexes in solution. Chem. Rev. 1997, 97, 1325–1358. [Google Scholar] [CrossRef] [PubMed]
- Schneider, H.J.; Hacket, F.; Rudiger, V.; Ikeda, H. NMR studies of cyclodextrins and cyclodextrin complexes. Chem. Rev. 1998, 98, 1755–1786. [Google Scholar] [CrossRef] [PubMed]
- Vogt, F.G.; Strohmeier, M. 2D solid-state NMR analysis of inclusion in drug-cyclodextrin complexes. Mol. Pharm. 2012, 9, 3357–3374. [Google Scholar] [CrossRef] [PubMed]
- Lipkowitz, K.B. Applications of computational chemistry to the study of cyclodextrins. Chem. Rev. 1998, 98, 1829–1873. [Google Scholar] [CrossRef] [PubMed]
- Raffaini, G.; Ganazzoli, F.; Malpezzi, L.; Fuganti, C.; Fronza, G.; Panzeri, W.; Mele, A. Validating a strategy for molecular dynamics simulations of cyclodextrin inclusion complexes through single-crystal X-ray and NMR experimental data: A Case Study. J. Phys. Chem. B 2009, 113, 9110–9122. [Google Scholar] [CrossRef] [PubMed]
- Dapprich, S.; Komaromi, I.; Byun, K.S.; Morokuma, K.; Frisch, M.J. A new ONIOM implementation in Gaussian98. Part I. The calculation of energies, gradients, vibrational frequencies and electric field derivatives. J. Mol. Struct. Theochem 1999, 461–462, 1–21. [Google Scholar] [CrossRef]
- Holt, J.S. Structural characterization of the Brooker’s merocyanine/β-cyclodextrin complex using NMR spectroscopy and molecular modeling. J. Mol. Struct. 2010, 965, 31–38. [Google Scholar] [CrossRef]
- Liu, B.G.; Zhao, J.; Liu, Y.H.; Zhu, X.A.; Zeng, J. Physiochemical properties of the inclusion complex of puerarin and glucosyl-β-cyclodextrin. J. Agric. Food Chem. 2012, 60, 12501–12507. [Google Scholar] [CrossRef] [PubMed]
- Del Valle, E.M.M. Cyclodextrins and their uses: A review. Process Biochem. 2004, 39, 1033–1046. [Google Scholar] [CrossRef]
- Eid, E.E.M.; Abdul, A.B.; Suliman, F.E.O.; Sukari, M.A.; Abdullah, R.; Fatah, S.S. Characterization of the inclusion complex of zerumbone with hydroxypropyl-β-cyclodextrin. Carbohydr. Polym. 2011, 83, 1707–1714. [Google Scholar] [CrossRef] [Green Version]
- Conchillo-Sole, O.; de Groot, N.; Aviles, F.; Vendrell, J.; Daura, X.; Ventura, S. AGGRESCAN: A server for the prediction and evaluation of “hot spots” of aggregation in polypeptides. BMC Bioinforma. 2007, 8, 65. [Google Scholar] [CrossRef] [PubMed]
- Cancès, E.; Mennucci, B.; Tomasi, J. A new integral equation formalism for the polarizable continuum model: Theoretical background and applications to isotropic and anisotropic dielectrics. J. Chem. Phys. 1997, 107, 3032–3041. [Google Scholar] [CrossRef]
- Reed, A.E.; Curtiss, L.A.; Weinhold, F. Intermolecular interactions from a natural bond orbital, donor-acceptor viewpoint. Chem. Rev. 1988, 88, 899–926. [Google Scholar] [CrossRef]
- Zhou, Z.X.; Parr, R.G. Activation Hardness—New index for describing the orientation of electrophilic aromatic-substitution. J. Am. Chem. Soc. 1990, 112, 5720–5724. [Google Scholar] [CrossRef]
- Becke, A.D. A new mixing of Hartree–Fock and local density-functional theories. J. Chem. Phys. 1993, 98, 1372–1377. [Google Scholar] [CrossRef]
- Frisch, M.J.; Trucks, G.W.; Schlegel, H.B.; Scuseria, G.E.; Robb, M.A.; Cheeseman, J.R.; Scalmani, G.; Barone, V.; Mennucci, B.; Petersson, G.A.; et al. Gaussian 09; Gaussian, Inc.: Wallingford, CT, USA, 2009. [Google Scholar]
- Simon, S.; Duran, M.; Dannenberg, J.J. How does basis set superposition error change the potential surfaces for hydrogen bonded dimers? J. Chem. Phys. 1996, 105, 11024–11031. [Google Scholar] [CrossRef]
© 2015 by the authors; licensee MDPI, Basel, Switzerland. This article is an open access article distributed under the terms and conditions of the Creative Commons Attribution license (http://creativecommons.org/licenses/by/4.0/).
Share and Cite
Li, B.; Liu, B.; Li, J.; Xiao, H.; Wang, J.; Liang, G. Experimental and Theoretical Investigations on the Supermolecular Structure of Isoliquiritigenin and 6-O-α-D-Maltosyl-β-cyclodextrin Inclusion Complex. Int. J. Mol. Sci. 2015, 16, 17999-18017. https://doi.org/10.3390/ijms160817999
Li B, Liu B, Li J, Xiao H, Wang J, Liang G. Experimental and Theoretical Investigations on the Supermolecular Structure of Isoliquiritigenin and 6-O-α-D-Maltosyl-β-cyclodextrin Inclusion Complex. International Journal of Molecular Sciences. 2015; 16(8):17999-18017. https://doi.org/10.3390/ijms160817999
Chicago/Turabian StyleLi, Bin, Benguo Liu, Jiaqi Li, Huizhi Xiao, Junyi Wang, and Guizhao Liang. 2015. "Experimental and Theoretical Investigations on the Supermolecular Structure of Isoliquiritigenin and 6-O-α-D-Maltosyl-β-cyclodextrin Inclusion Complex" International Journal of Molecular Sciences 16, no. 8: 17999-18017. https://doi.org/10.3390/ijms160817999