2.1. Screening of Differentially Expressed Protein Markers
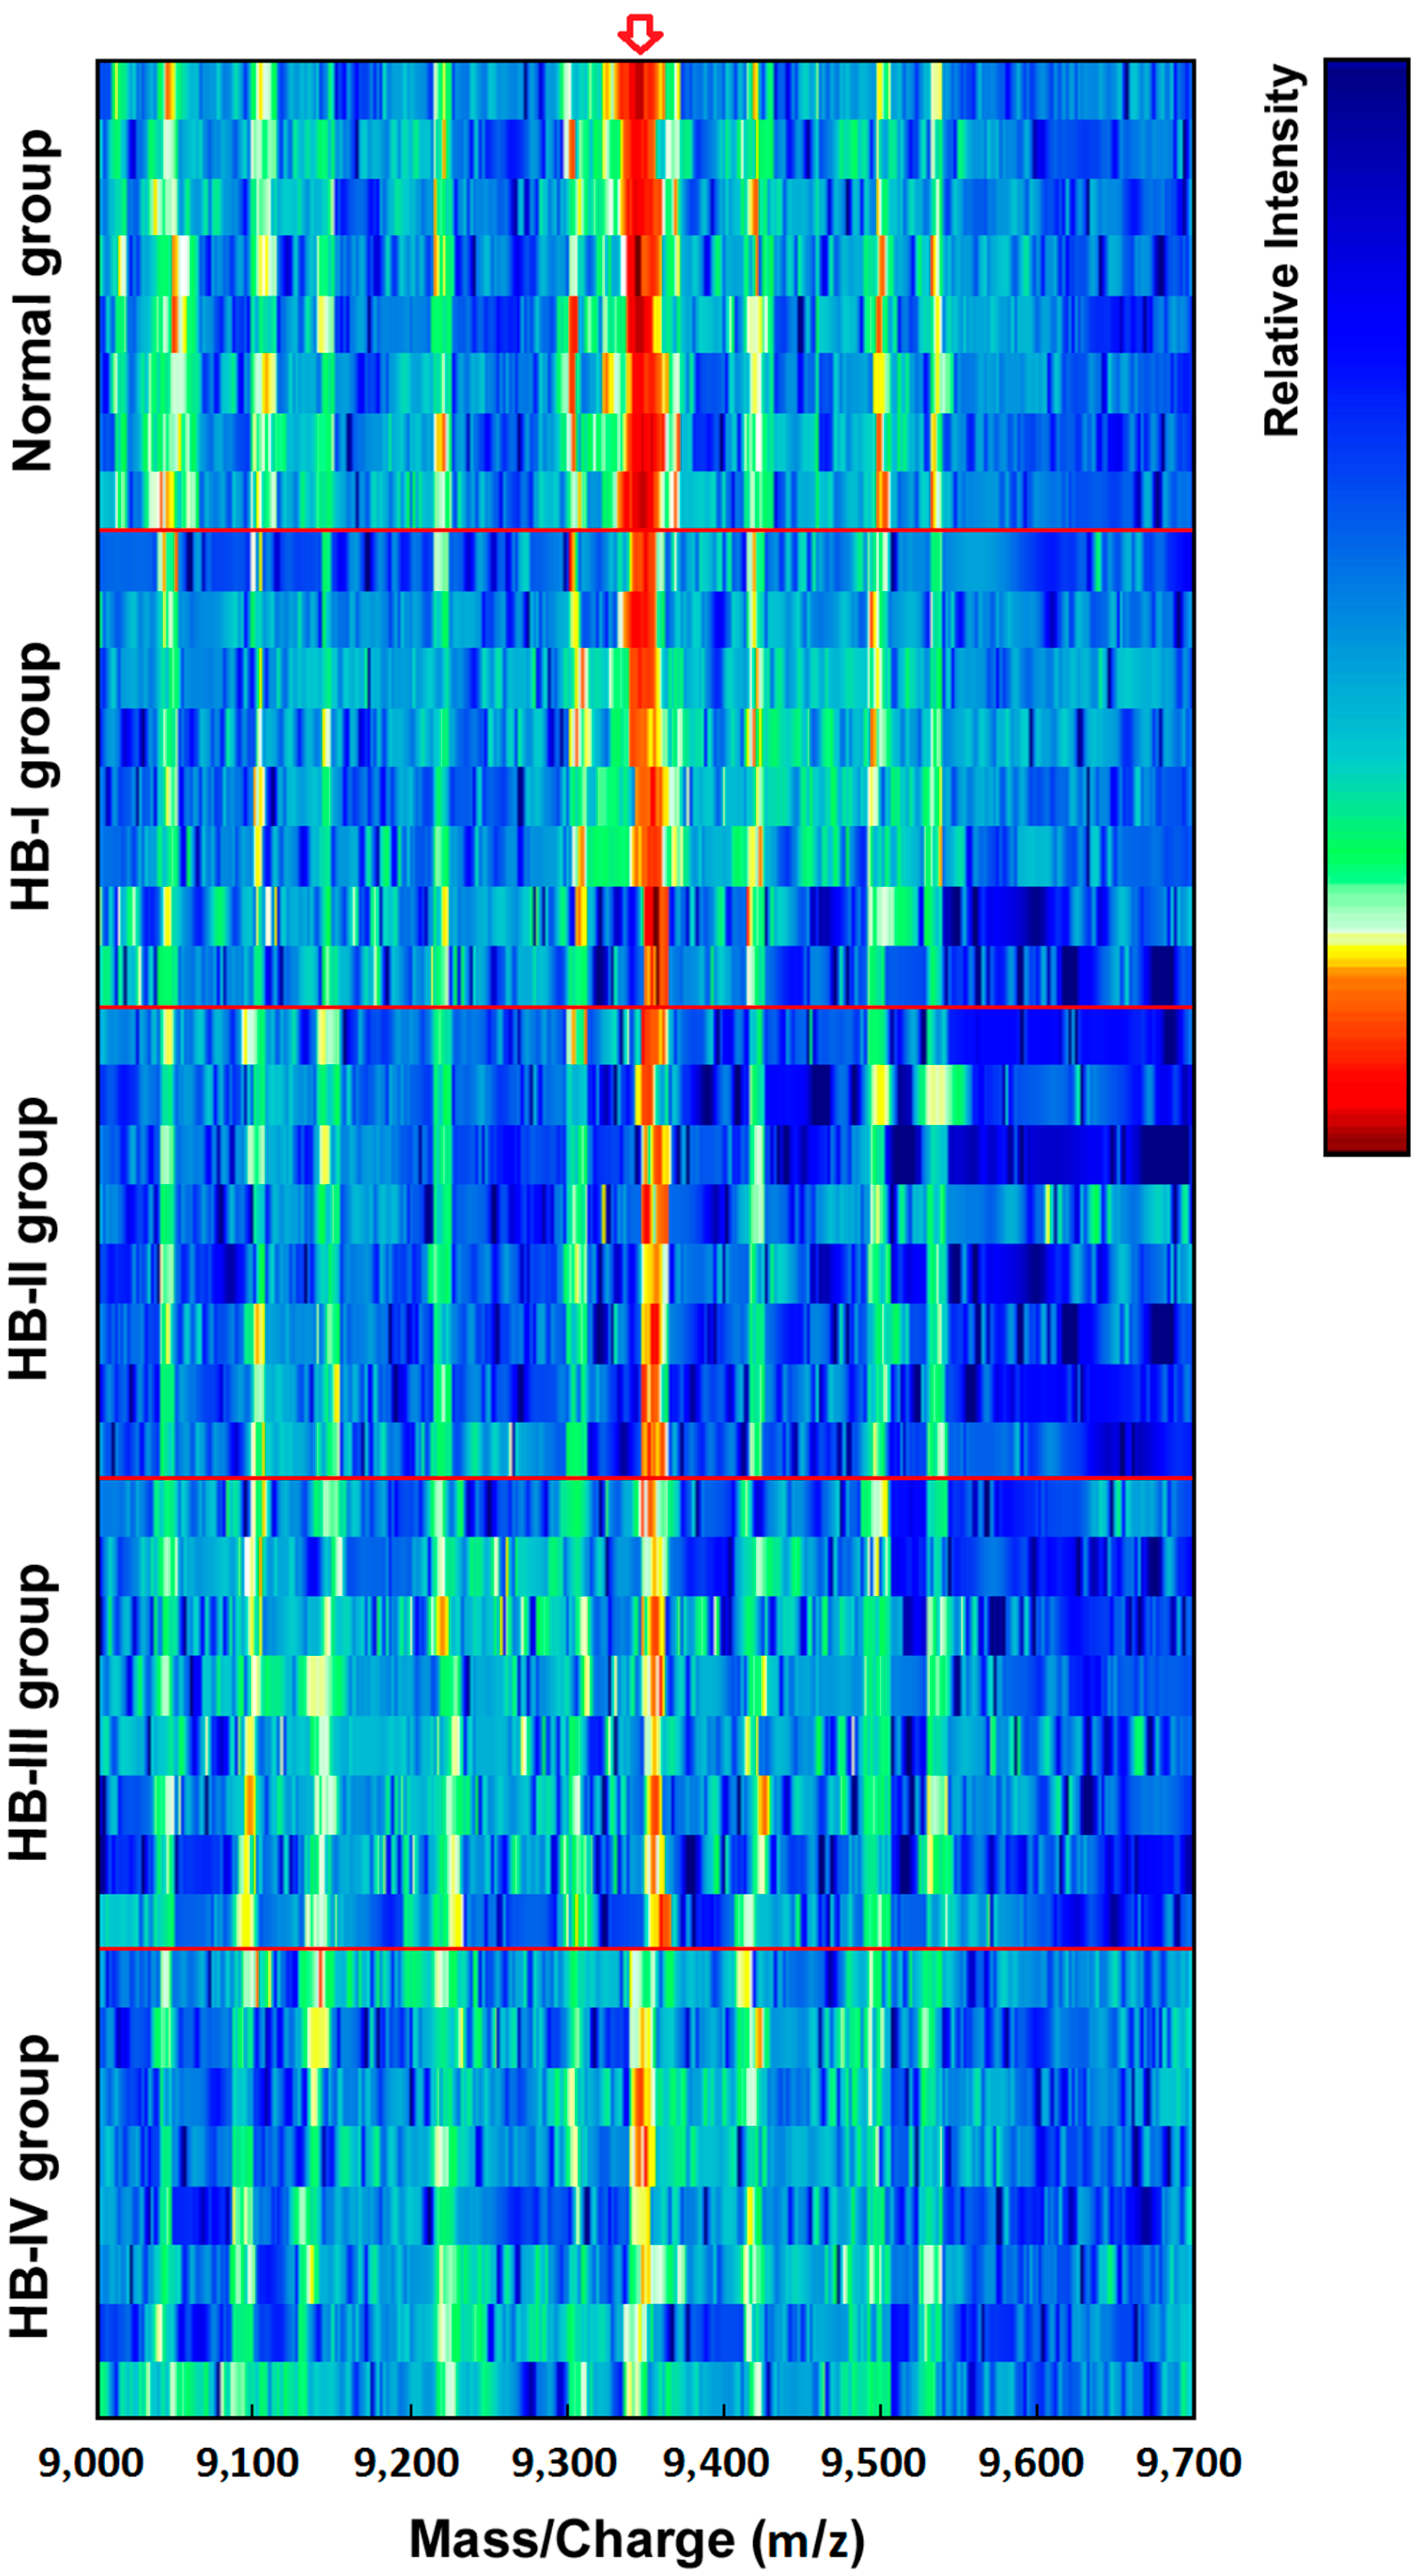
After screening the pretreated sera from the healthy children and HB patients using SELDI-TOF-MS, data from each protein peak and the peak values of the decomposed peptides were obtained. These protein peak values were standardized and analyzed using the Wilcoxon rank-sum test, and comparisons between the normal and HB groups were undertaken. Ten differentially expressed proteins, including four upregulated and six down-regulated protein peak values, were observed in the serum of HB patients (
Table 1). A composite model with the highest Youden index was screened using the support vector machine (SVM) to obtain a protein marker with a Mass-to-charge ratio (
m/
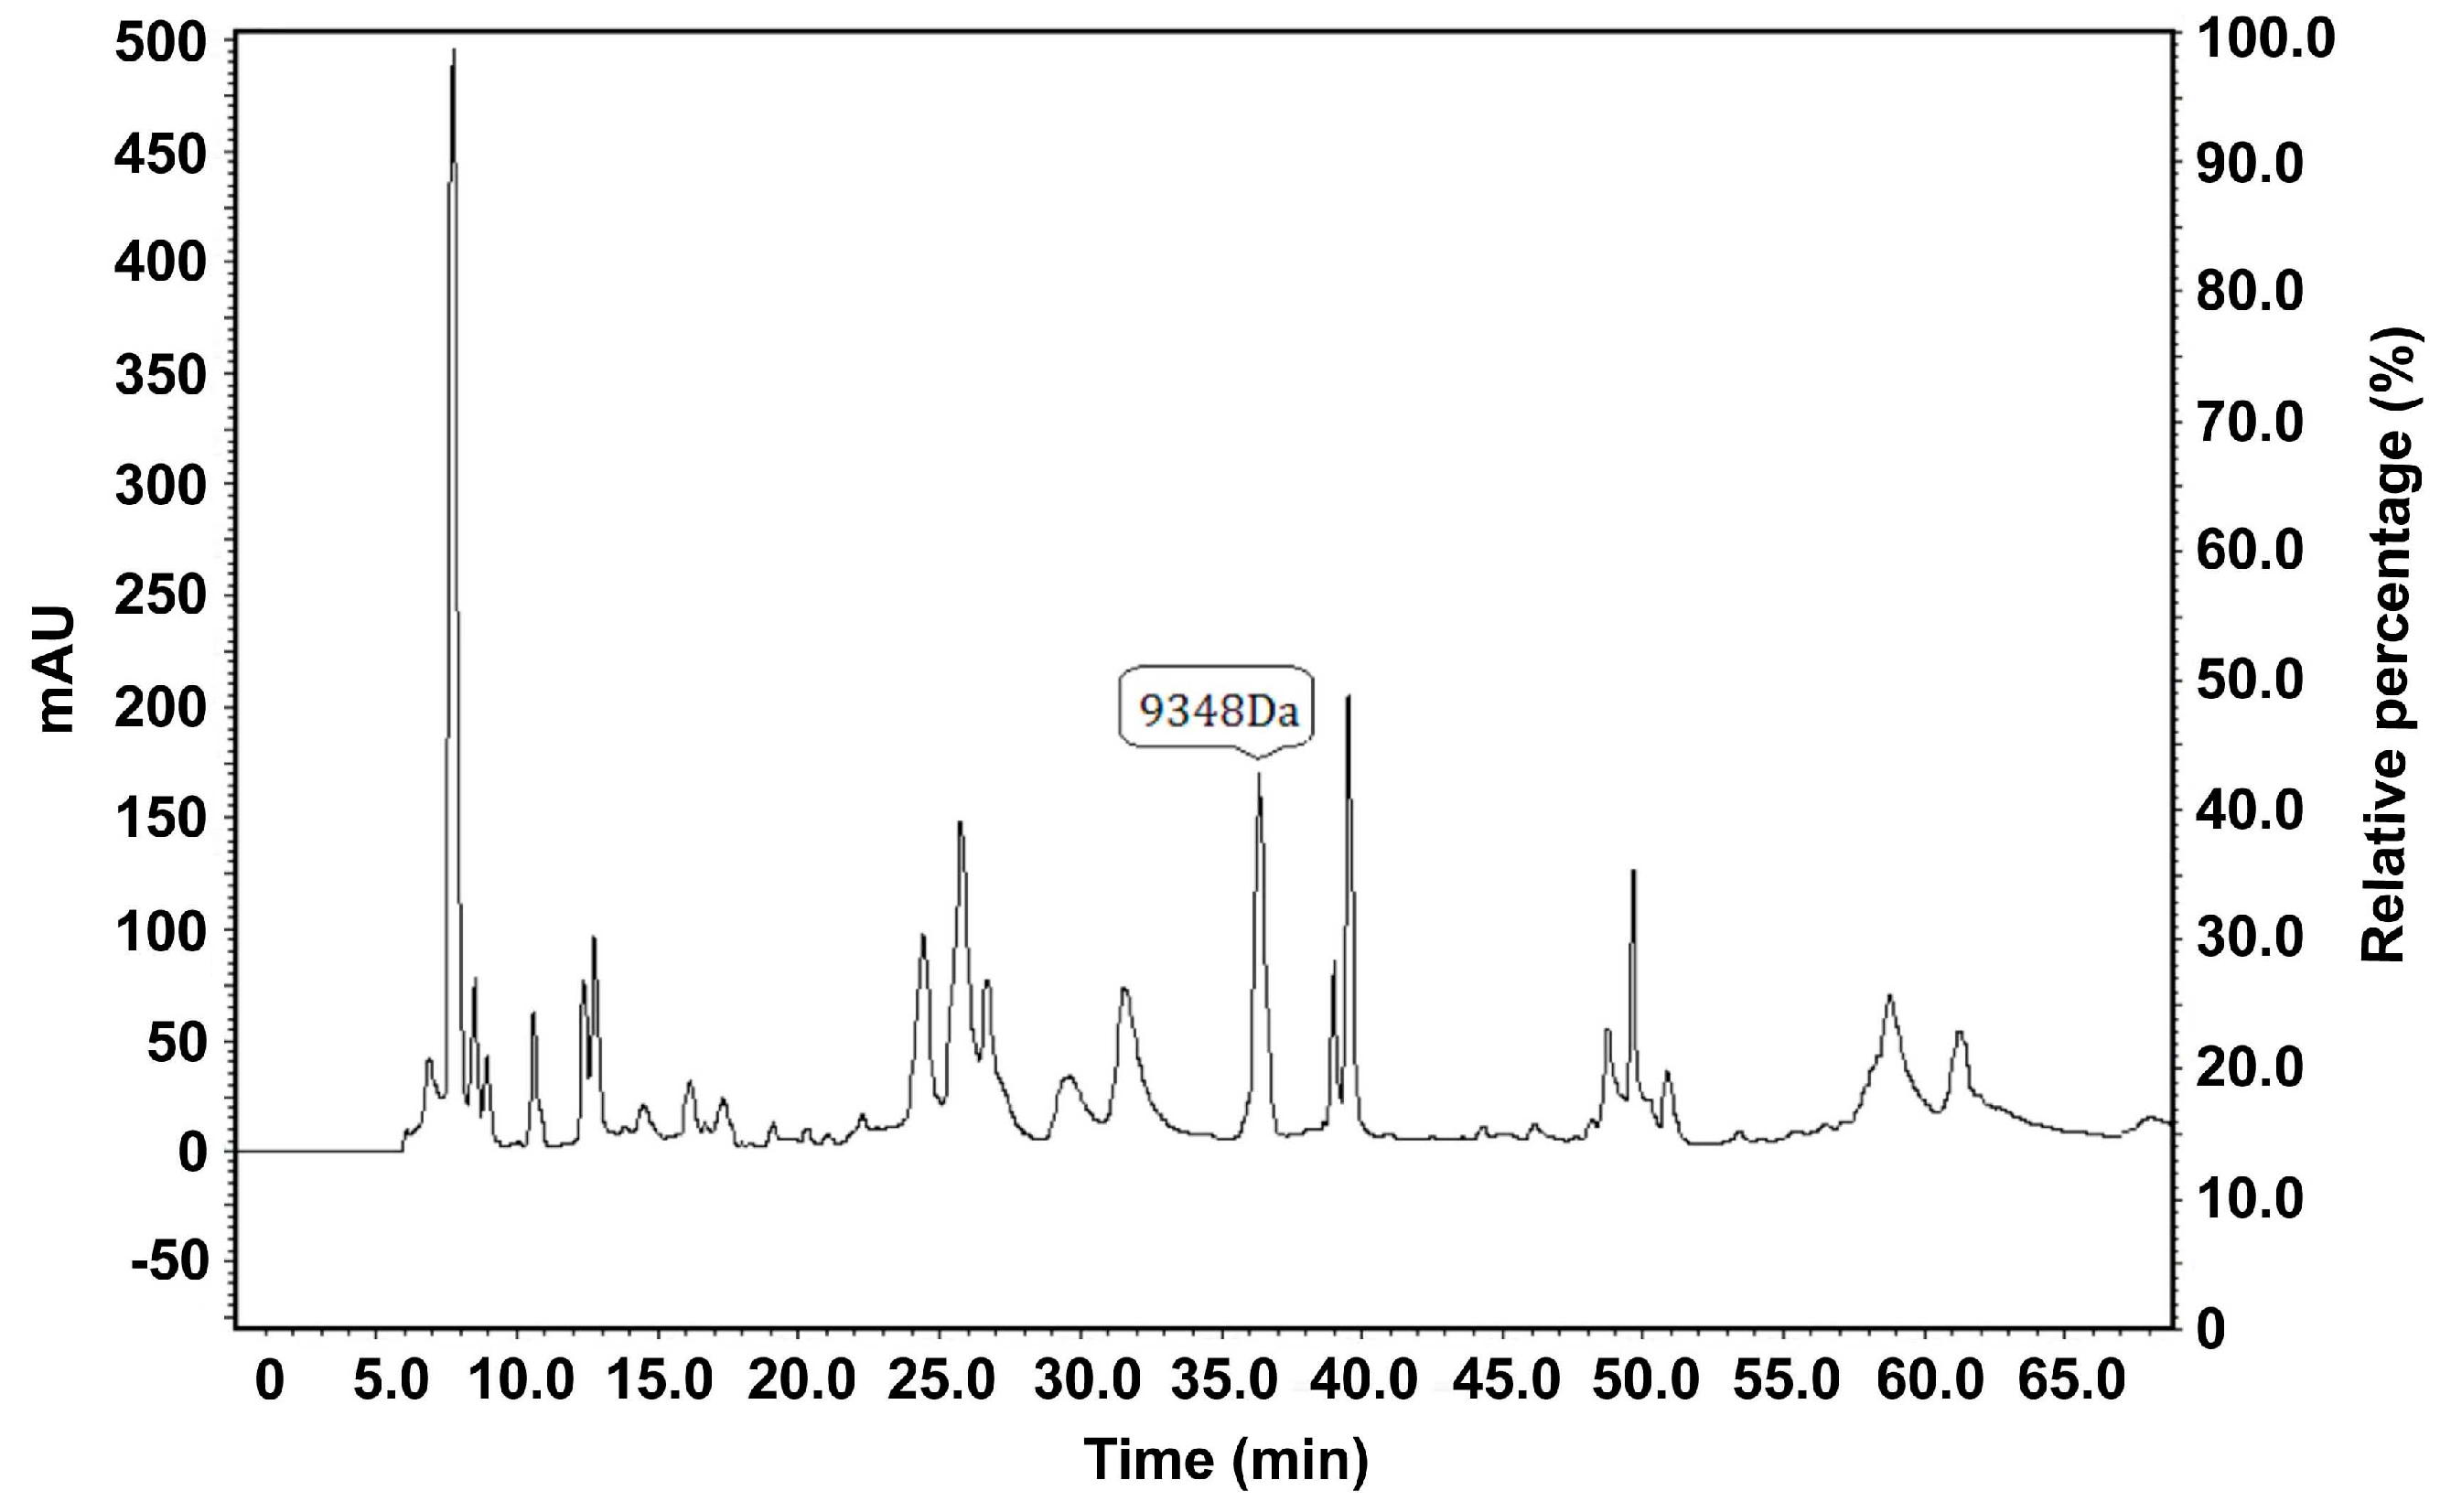
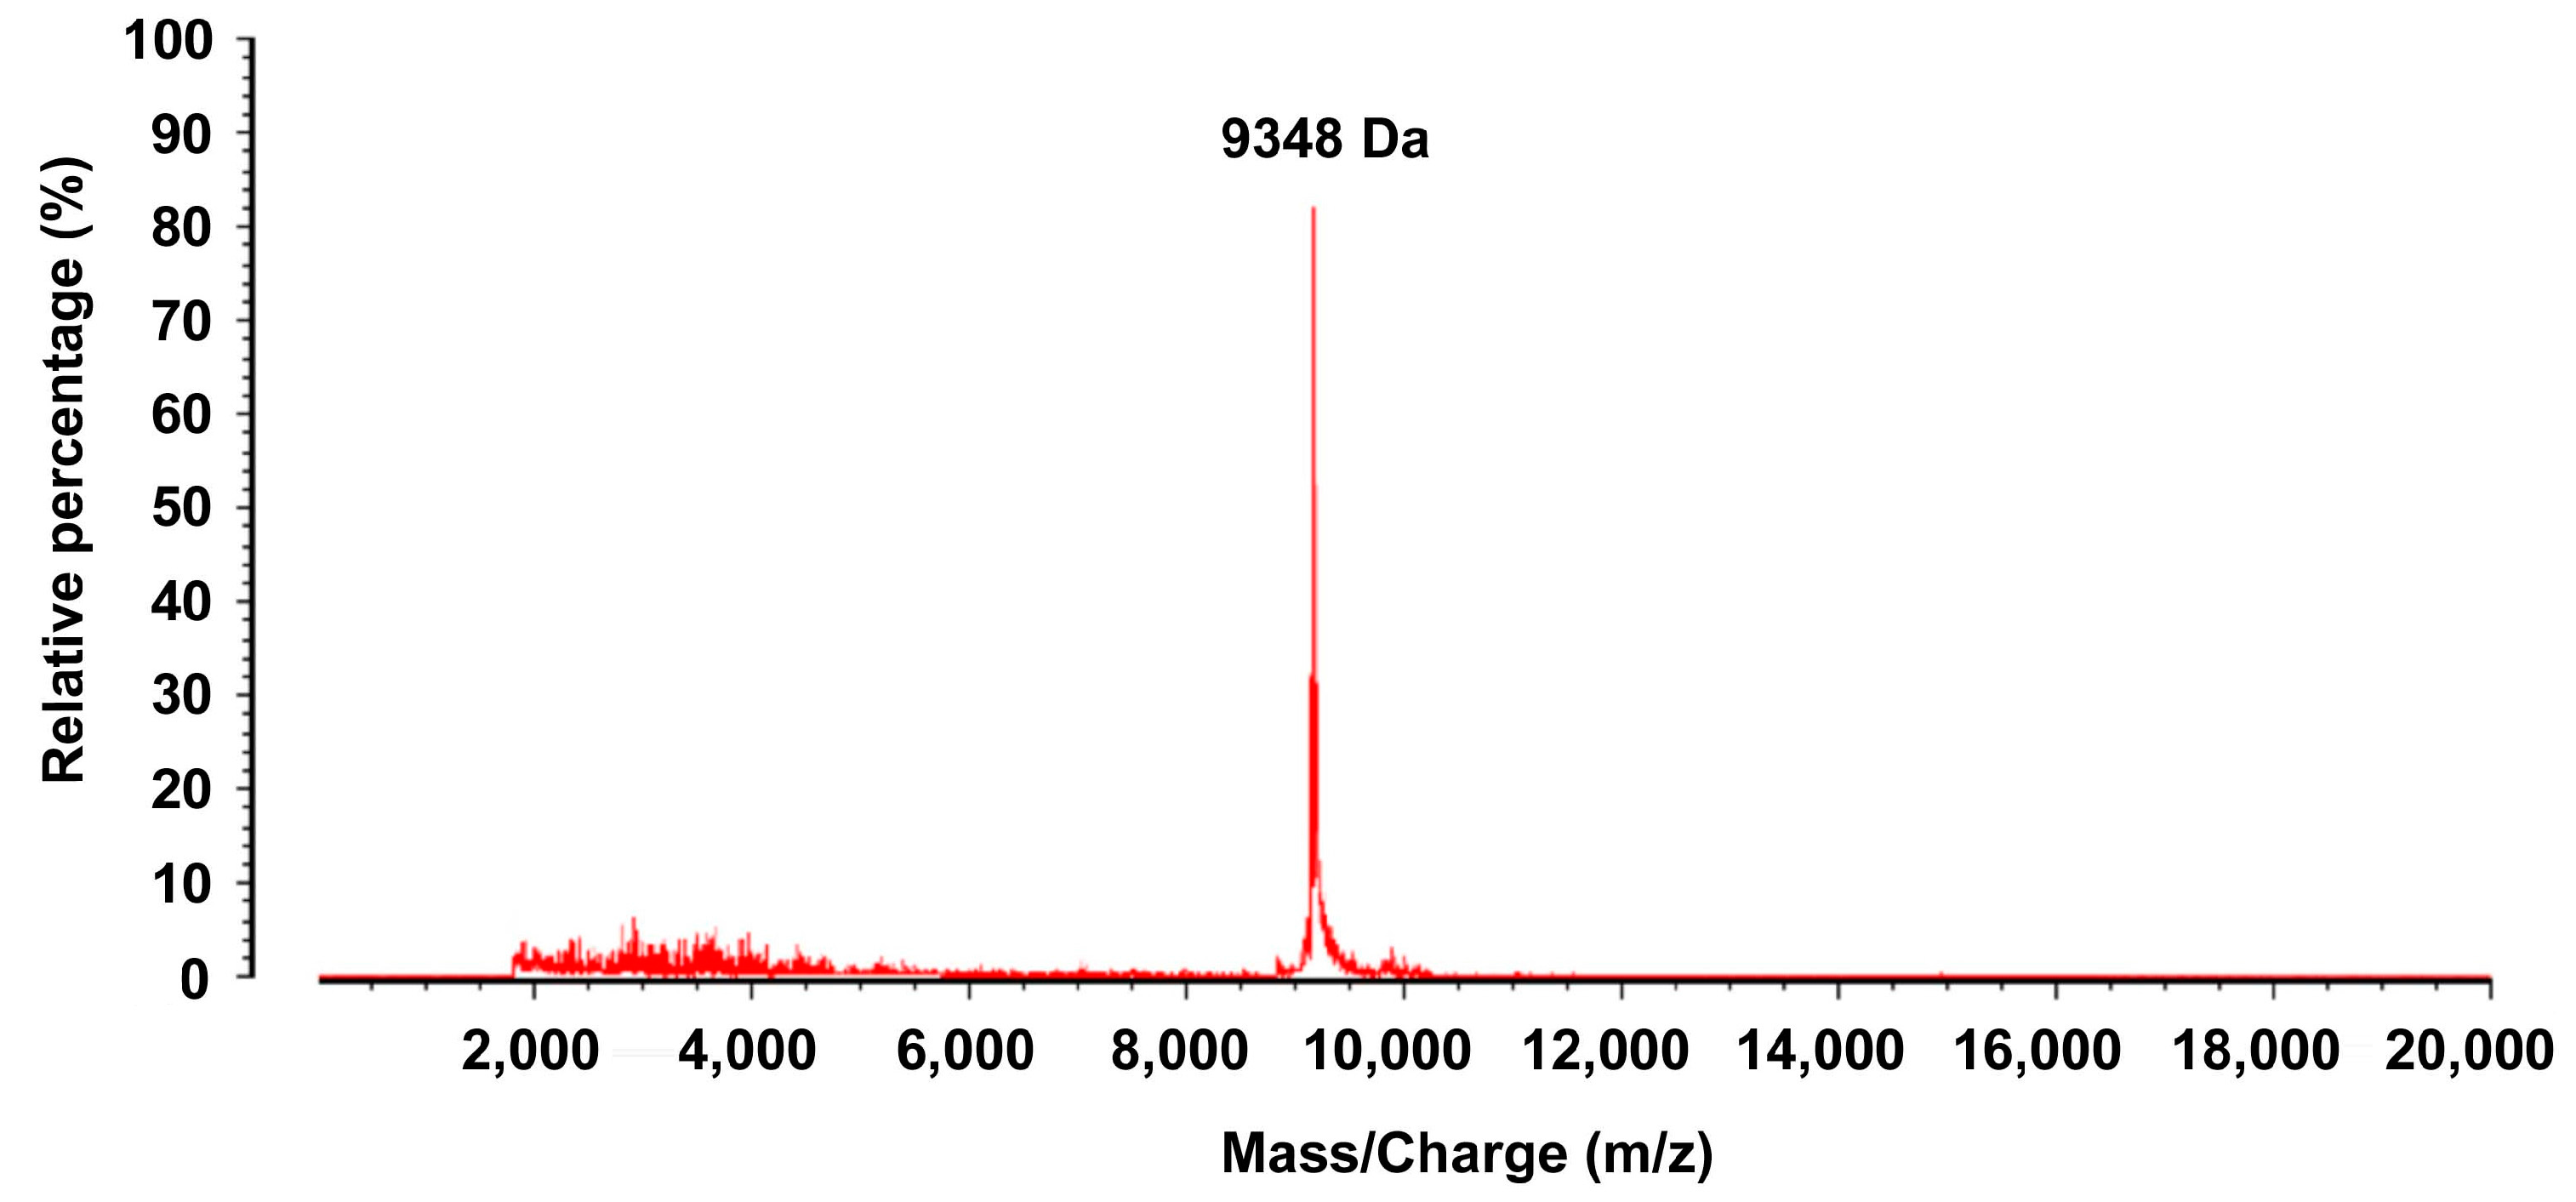
z) of 9348 Da (
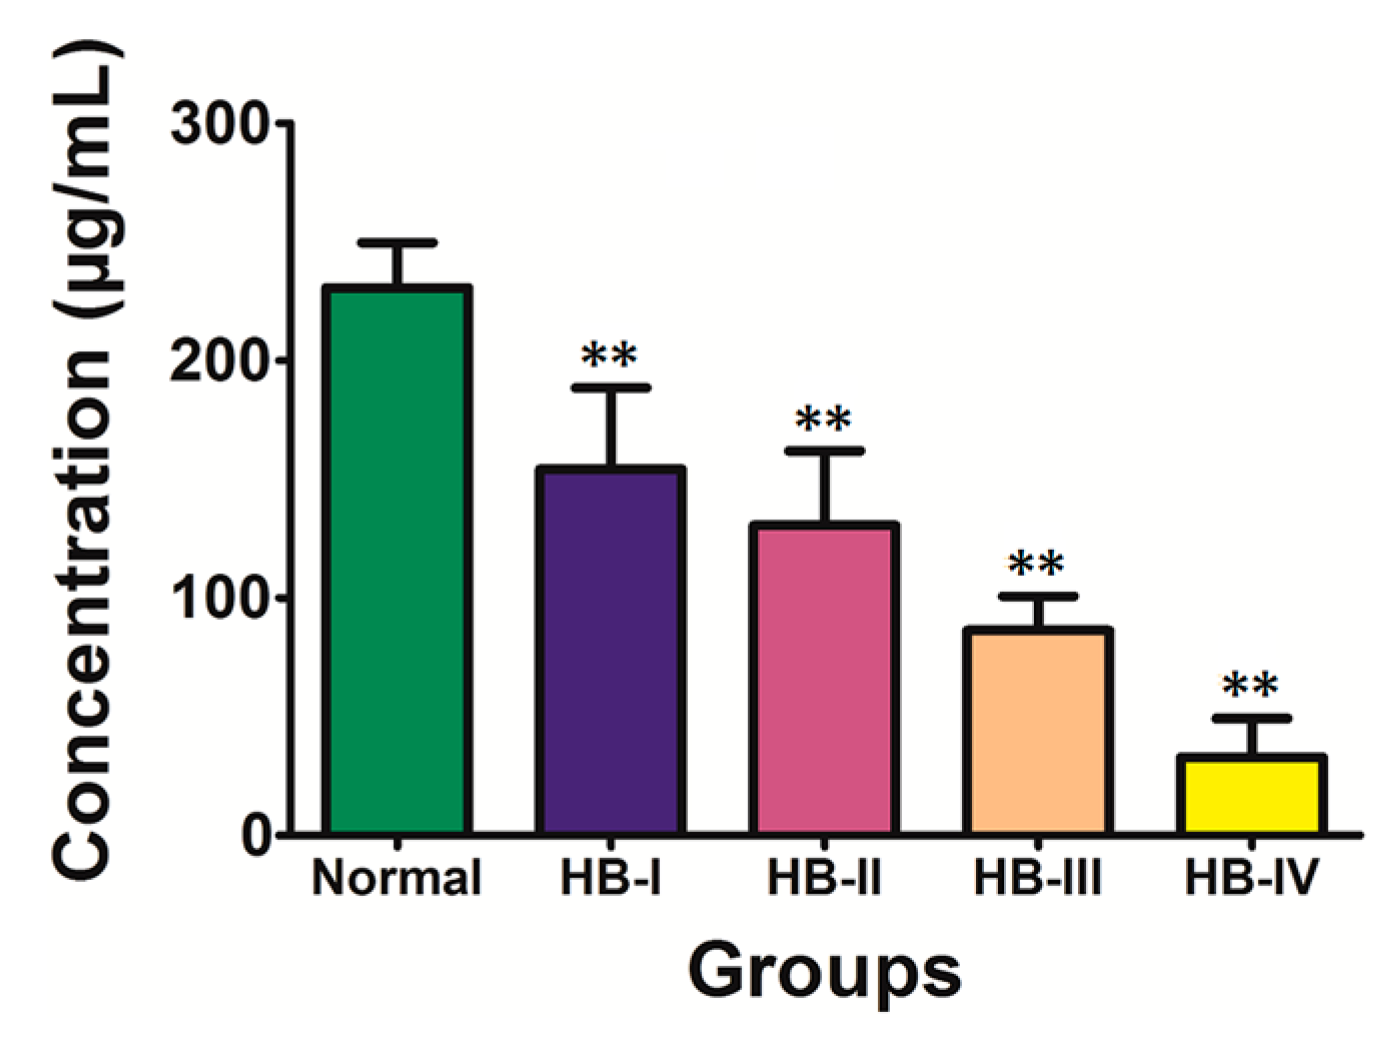
Figure 1). The expression level of this marker was 3359.21 ± 999.36 and 1546.67 ± 757.81 in the normal control and HB groups, respectively (
p < 0.01;
Table 2). Analysis of the HB group by disease stage revealed that the expression level of the protein marker with an
m/
z of 9348 Da was significantly lower at each disease stage as compared with the normal group (
p < 0.01;
Table 2). Moreover, there were significant differences between HB subgroups (
p < 0.01;
Table 2).
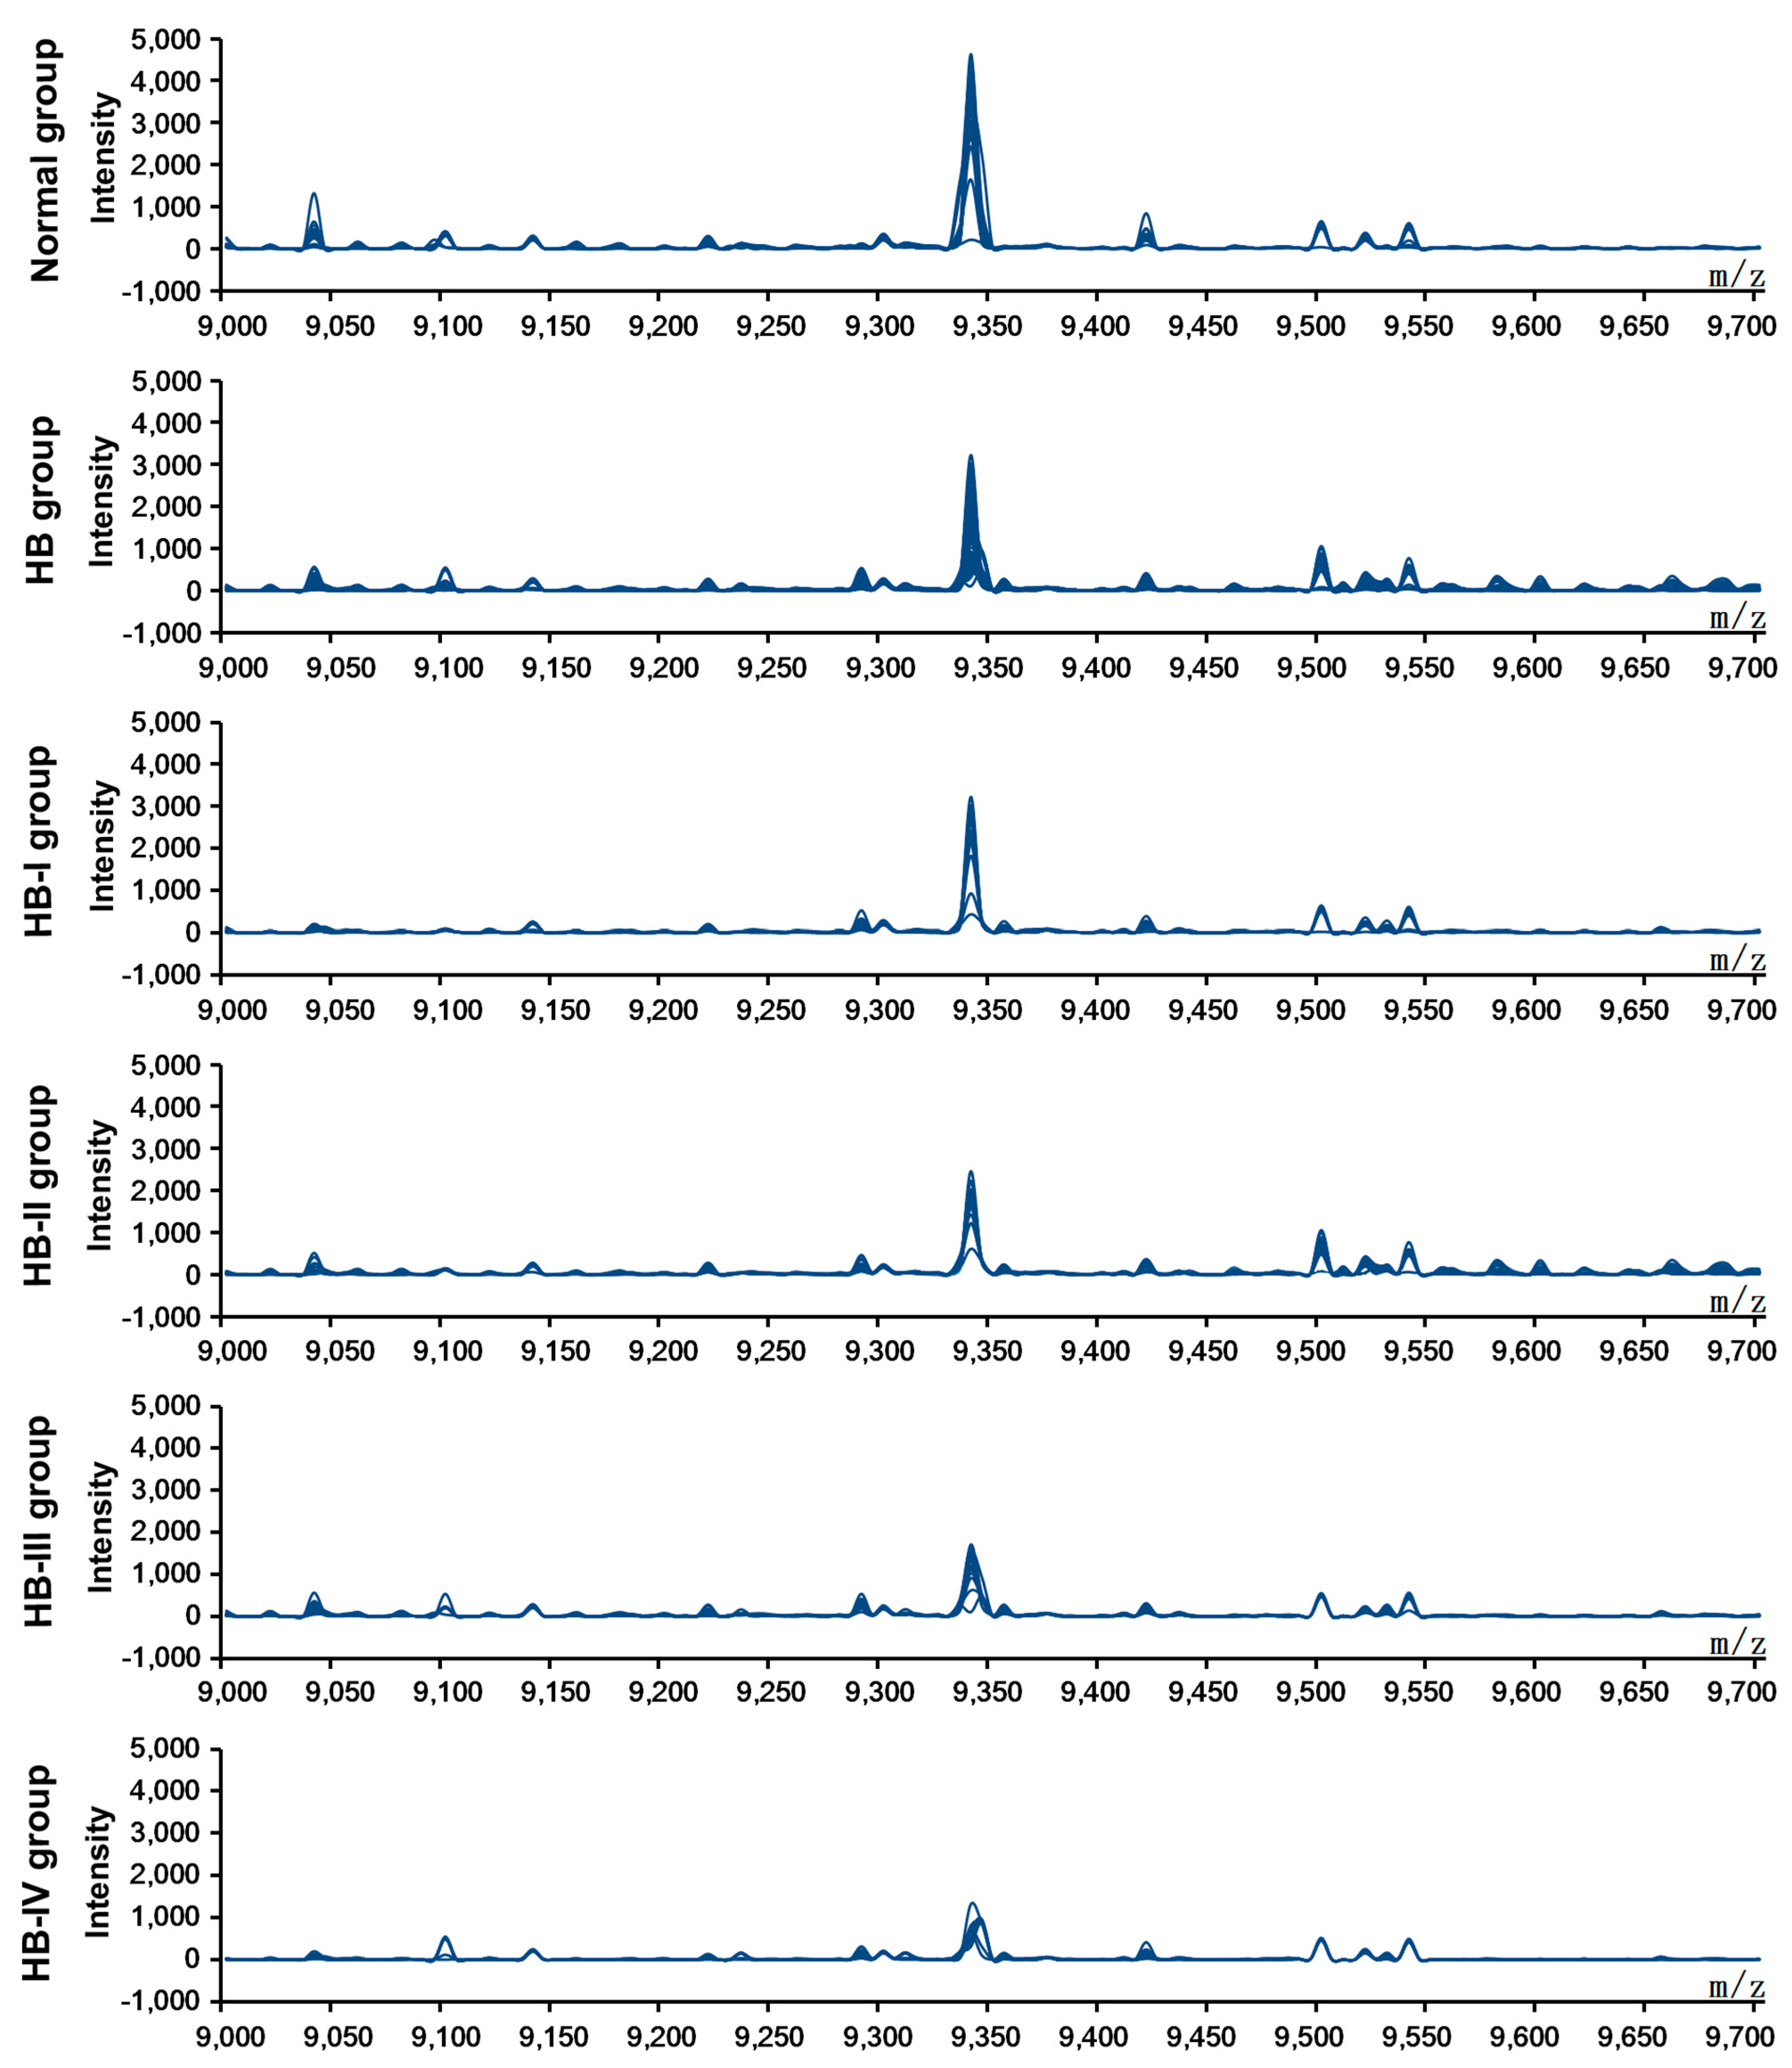
Figure 2 shows simulated electrophoretogram of proteins or peptide segments with an
m/
z of 9348 Da in the normal and HB groups with SELDI-TOF-MS. Using the method of leave-1-out for cross detection, the sensitivity of discriminating 71 HB and 23 normal subjects was 98.32%, and its specificity was 87.96%.
Table 1.
The ten differentially expressed proteins in hepatoblastoma vs. normal (mean ± SD).
Table 1.
The ten differentially expressed proteins in hepatoblastoma vs. normal (mean ± SD).
| m/z (Da) | Hepatoblastoma | Normal |
|---|
| 2032.3 | 889.41 ± 106.21 | 1058.41 ± 214.65 |
| 2486.6 | 621.45 ± 187.24 | 1306.64 ± 323.41 |
| 2963.5 | 2132.69 ± 524.12 | 2654.73 ± 408.64 |
| 3786.1 | 1135.30 ± 284.77 | 1462.58 ± 367.59 |
| 4571.3 | 1659.73 ± 325.38 | 974.57 ± 236.87 |
| 5269.0 | 1237.29 ± 363.74 | 1687.02 ± 397.54 |
| 5457.2 | 884.30 ± 204.23 | 656.31 ± 146.09 |
| 9348.0 * | 1546.67 ± 757.81 | 3359.21 ± 999.36 |
| 16,589.3 | 871.62 ± 659.37 | 452.14 ± 109.43 |
| 18,946.2 | 2068.85 ± 574.33 | 1564.89 ± 337.57 |
Table 2.
SELDI-TOF-MS mass spectrometry analysis of proteins or peptide segments with an m/z of 9348 Da in the normal and HB groups.
Table 2.
SELDI-TOF-MS mass spectrometry analysis of proteins or peptide segments with an m/z of 9348 Da in the normal and HB groups.
| Group | Case | Intensity | p Value |
|---|
| Normal | HB-I | HB-II | HB-III |
|---|
| Normal | 23 | 3359.21 ± 999.36 | – | – | – | – |
| HB | 71 | 1546.67 ± 757.81 | 0.000000 | – | – | – |
| HB-I | 19 | 2324.12 ± 679.42 | 0.000432 | – | – | – |
| HB-II | 19 | 1718.90 ± 418.62 | 0.000000 | 0.002153 | – | – |
| HB-III | 19 | 1268.10 ± 399.09 | 0.000000 | 0.000001 | 0.001674 | – |
| HB-IV | 14 | 635.91 ± 237.56 | 0.000000 | 0.000000 | 0.000000 | 0.000010 |
Figure 1.
SELDI-TOF-MS analysis of proteins or peptide segments with an m/z of 9348 Da in the normal and HB groups.
Figure 1.
SELDI-TOF-MS analysis of proteins or peptide segments with an m/z of 9348 Da in the normal and HB groups.
Figure 2.
Simulated electrophoretogram of proteins or peptide segments with an m/z of 9348 Da in the normal and HB groups.
Figure 2.
Simulated electrophoretogram of proteins or peptide segments with an m/z of 9348 Da in the normal and HB groups.
2.5. Discussion
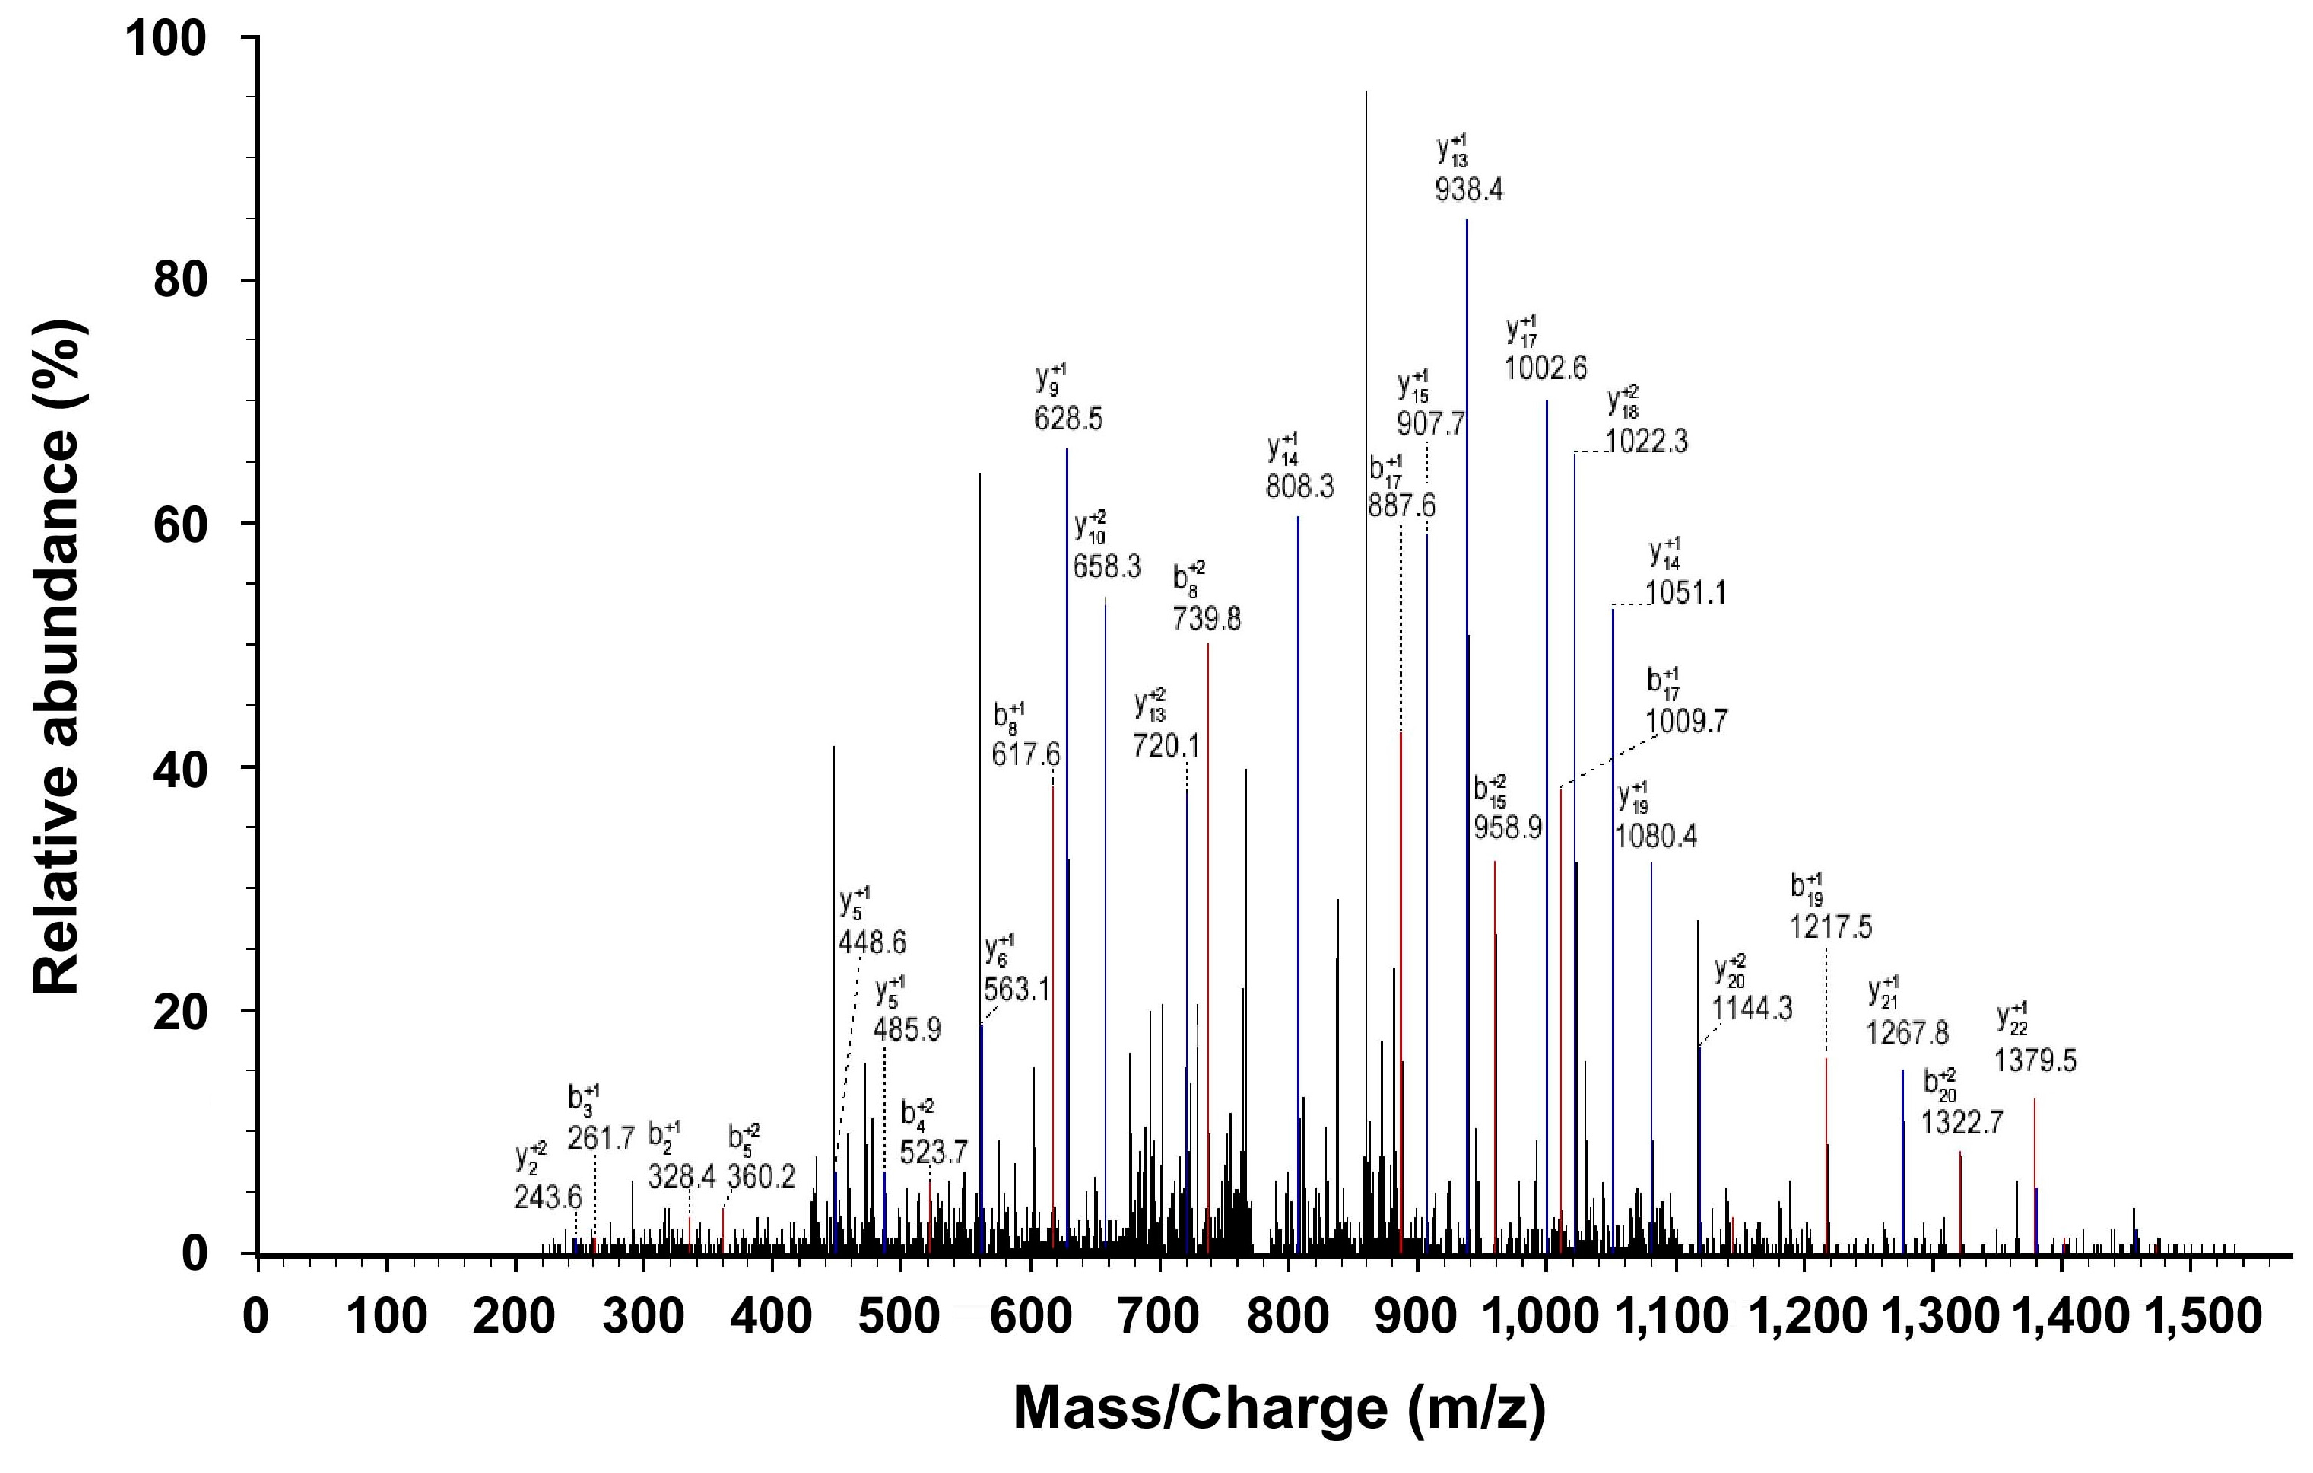
In the current study, we used SELDI-TOF-MS to identify a HB serum protein biomarker with a peak m/z value of 9348 Da, Apo A–I, which was significantly reduced in the serum of HB patients relative to that observed in healthy children. Apo A–I expression was also significantly reduced in the serum of children with each stage of HB compared with the normal group, and its expression level was relatively low in the groups with high stages of HB. Thus, Apo A–I may be a diagnostic and prognostic biomarker of HB.
Apo A–I, a subtype of Apo A and the most important structural protein of high density lipoprotein (HDL), accounts for 80%–90% of HDL and is the main component of the Apo A family. Apo A–I takes part in many steps of lipid metabolism and affects the body’s metabolism and development of chronic diseases. The liver participates in conversion of the pre-Apo A–I into mature Apo A–I; therefore, liver injury or liver tumors inhibit production of Apo, altering plasma lipid levels and lipoprotein structure [
22]. Thus, Apo A–I is related to the severity of liver disease. Moreover, disorders of lipoprotein metabolism in the serum of patients with malignant tumors have been noted. For example, plasma Apo A–I is related to the development of many tumors, such as stomach cancer, ovarian cancer, leukemia, and colon cancer [
23,
24]. Furthermore, serum HDL and Apo A–I levels are significantly reduced in these patients with cancer [
25], which may be due to the following: (1) Increased HDL uptake by pathological monocytes; (2) Decreased surface activity of HDL; and (3) The increased demand for cholesterol for the synthesis of cell membranes to support the high level of cell proliferation characteristic of tumorigenesis [
26].
Other studies have found a relationship between Apo A–I expression with malignant tumors. It is a specific serum biomarker of early-stage ovarian cancers with diagnostic value [
24]. In a nude mouse model of ovarian cancer, Apo A–I mimetic peptides increased their survival rate [
27], and the short 18 amino acid Apo A–I mimetic peptide can regulate the expression of hypoxia-inducible factor (HIF-1α), inhibit the formation of the vascular endothelial growth factor (VEGF) and tumor angiogenesis, and induce apoptosis of ovarian cancer cells [
28,
29]. Furthermore, increased plasma Apo A–I levels could reduce the course of gastric cancer in mice and was negatively related to the size of tumor [
30].
Cancer involves multiple genes and results from complex interactions between oncogenes and tumor suppressor genes. Gene mutations or abnormal regulation of gene expression may alter the expression level or structure of cellular proteins. Changes in these proteins may thus serve as markers, reflecting dynamic changes in oncogenes, tumor suppressor genes, and the interactions between them, as well as tumor load, tumor resection, recurrence, and metastasis. In our study, the expression of Apo A–I is lower in children with HB than in normal controls, suggesting that HB inhibits the expression of Apo A–I. In addition, Apo A–I expression was reduced significantly when HB staging further deteriorated, suggesting that this inhibition of Apo A–I expression was stronger when the progress of HB disease was more serious. Of course, we can only infer that HB inhibits the expression of Apo A–I from one direction. However, we need further trials to speculate whether the abnormal expression of Apo A–I led to the occurrence and development of HB.
In conclusion, Apo A–I was identified to be a serum protein marker of HB in the present study, and this marker may be an indicator of predicting HB stage. Nevertheless, the present study results are not sufficient to determine Apo A–I as the only clinical diagnostic criteria, because Apo C–I was detected between the HB group and normal group in this study without considering its involvement in other diseases. Further studies will include a larger number of samples to confirm its specificity and sensitivity and compare it with other diagnostic methods currently used in clinical practice. In addition, the relationship between Apo A–I and HB will be further explored to determine the effect of Apo A–I expression on the pathogenesis of HB.


