The enzymatic degradation of mitochondrial DNA with a mitochondrially-targeted restriction endonuclease is an important first step towards the replacement of defective mitochondrial genomes and thus a genetic therapy.
2.1. Visualization of Mitochondrial DNA Depletion Process
To visualize mitochondrial DNA depletion combined with the generation of ρ
0 cells, microscopic and PCR-based methods were applied. The depletion systems pMEE-con and MEE-con-module lead to the expression of the restriction endonuclease EcoRI [
9]. The import of EcoRI into the mitochondria is achieved with a mitochondrial targeting sequence (see
Figure S1). Transfection efficiency and localization can be easily analyzed because the attached green fluorescent protein (EGFP) illuminates EcoRI paths of action. After transfection with the depletion system the mitochondrial localization of EGFP-EcoRI was confirmed.
We observed that the mitochondrial localization of the fluorescently labeled restriction enzyme is associated with the destruction of mtDNA in the transfected cells. This becomes evident by overlaying the green EGFP fluorescence with the red staining of mitochondria with the specific dye MitoTracker
® Red CMXRos (
Figure 1 and
Figure 2). Transfection with linear and circular depletion system was carried out both in 143B.TK
− and HEp-2 cells, respectively.
At 24 h post-transfection the expression of the appropriate PCR product in 143B.TK
− cells (
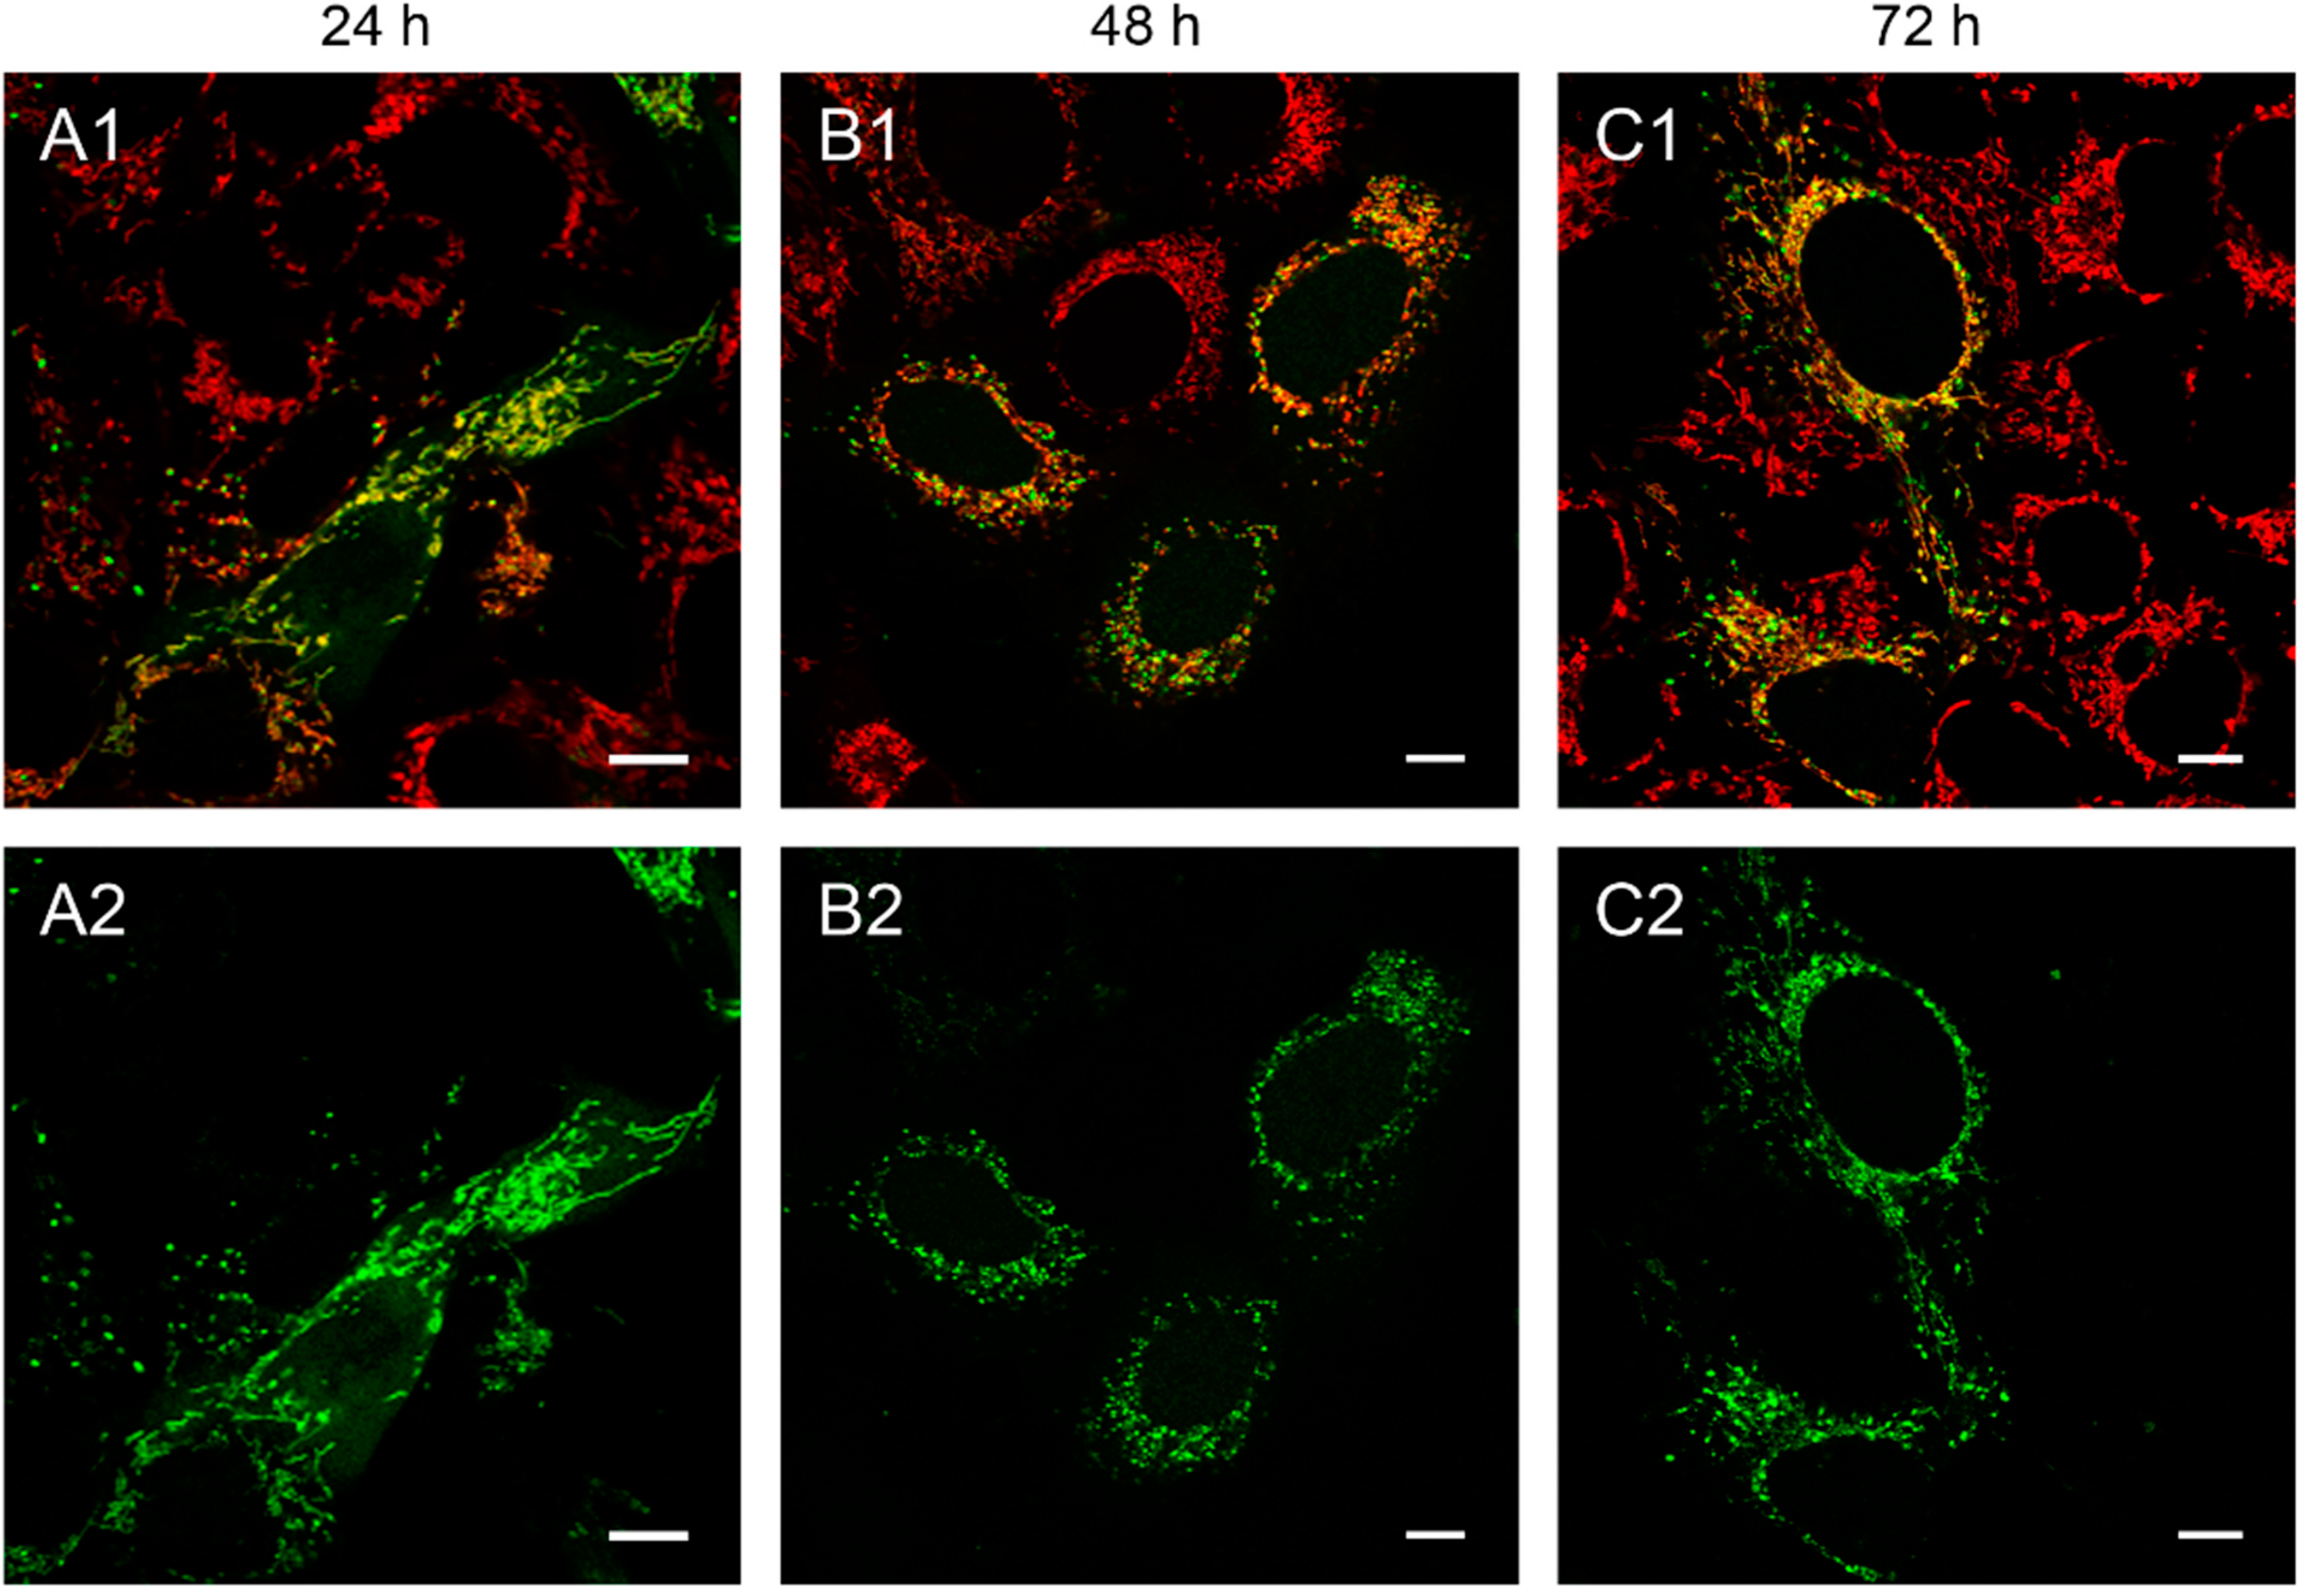
Figure 1A) lead firstly to an even distribution of EGFP-EcoRI fluorescence within mitochondria. Additionally, only few cells showed EGFP fluorescence in distinct sparkles, indicating possible destruction sites.
Figure 1.
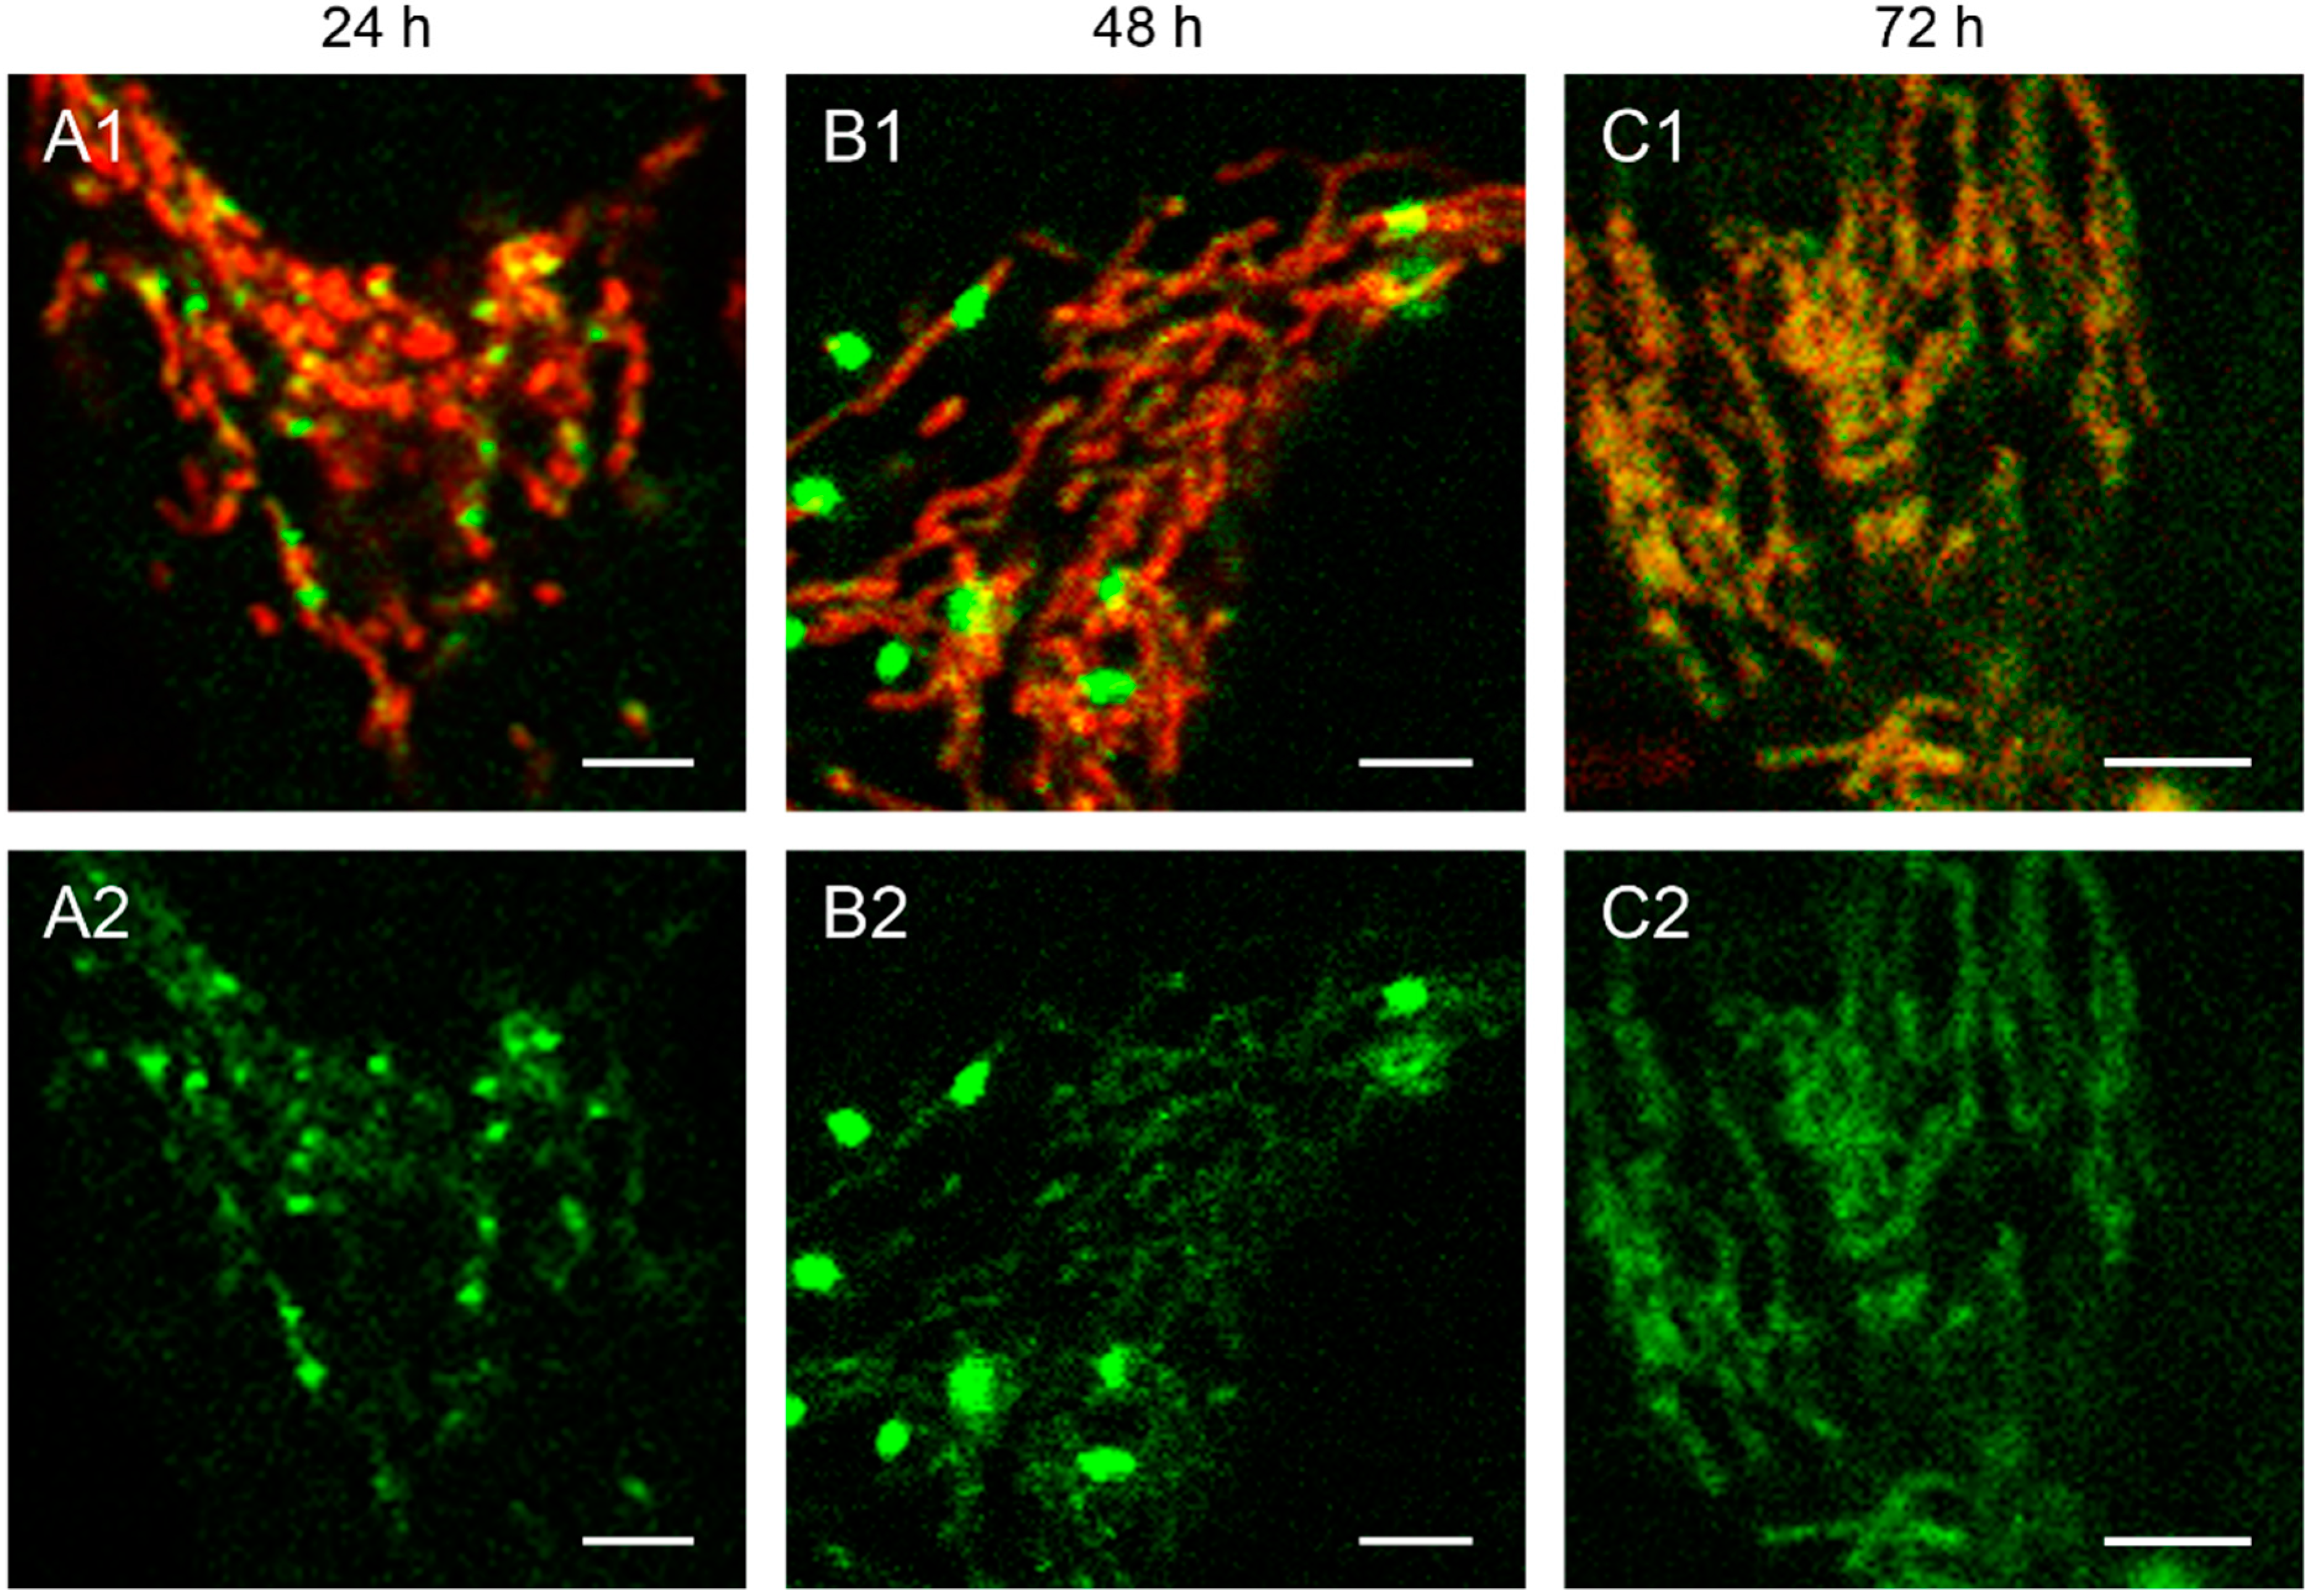
143B.TK− cells transfected with linear depletion system. 143B.TK− cells were transfected with the linear depletion system (MEE-con-module) and analyzed by confocal laser scanning microscopy. The EGFP-tagged restriction endonuclease (enhanced green fluorescent protein, green color, panels A2–C2) shows a uniform distribution or a punctate appearance (“nucleoid” structure) and co-localizes with the MitoTracker® Red CMXRos-stained mitochondrial network (red color, panels A1–C1). The superimposition of both colors is depicted in the top panel. Images were collected at intervals of 24 h post-transfection. White arrows show dissolving mitochondrial network. Calibration marks correspond to 10 µm.
Figure 1.
143B.TK− cells transfected with linear depletion system. 143B.TK− cells were transfected with the linear depletion system (MEE-con-module) and analyzed by confocal laser scanning microscopy. The EGFP-tagged restriction endonuclease (enhanced green fluorescent protein, green color, panels A2–C2) shows a uniform distribution or a punctate appearance (“nucleoid” structure) and co-localizes with the MitoTracker® Red CMXRos-stained mitochondrial network (red color, panels A1–C1). The superimposition of both colors is depicted in the top panel. Images were collected at intervals of 24 h post-transfection. White arrows show dissolving mitochondrial network. Calibration marks correspond to 10 µm.
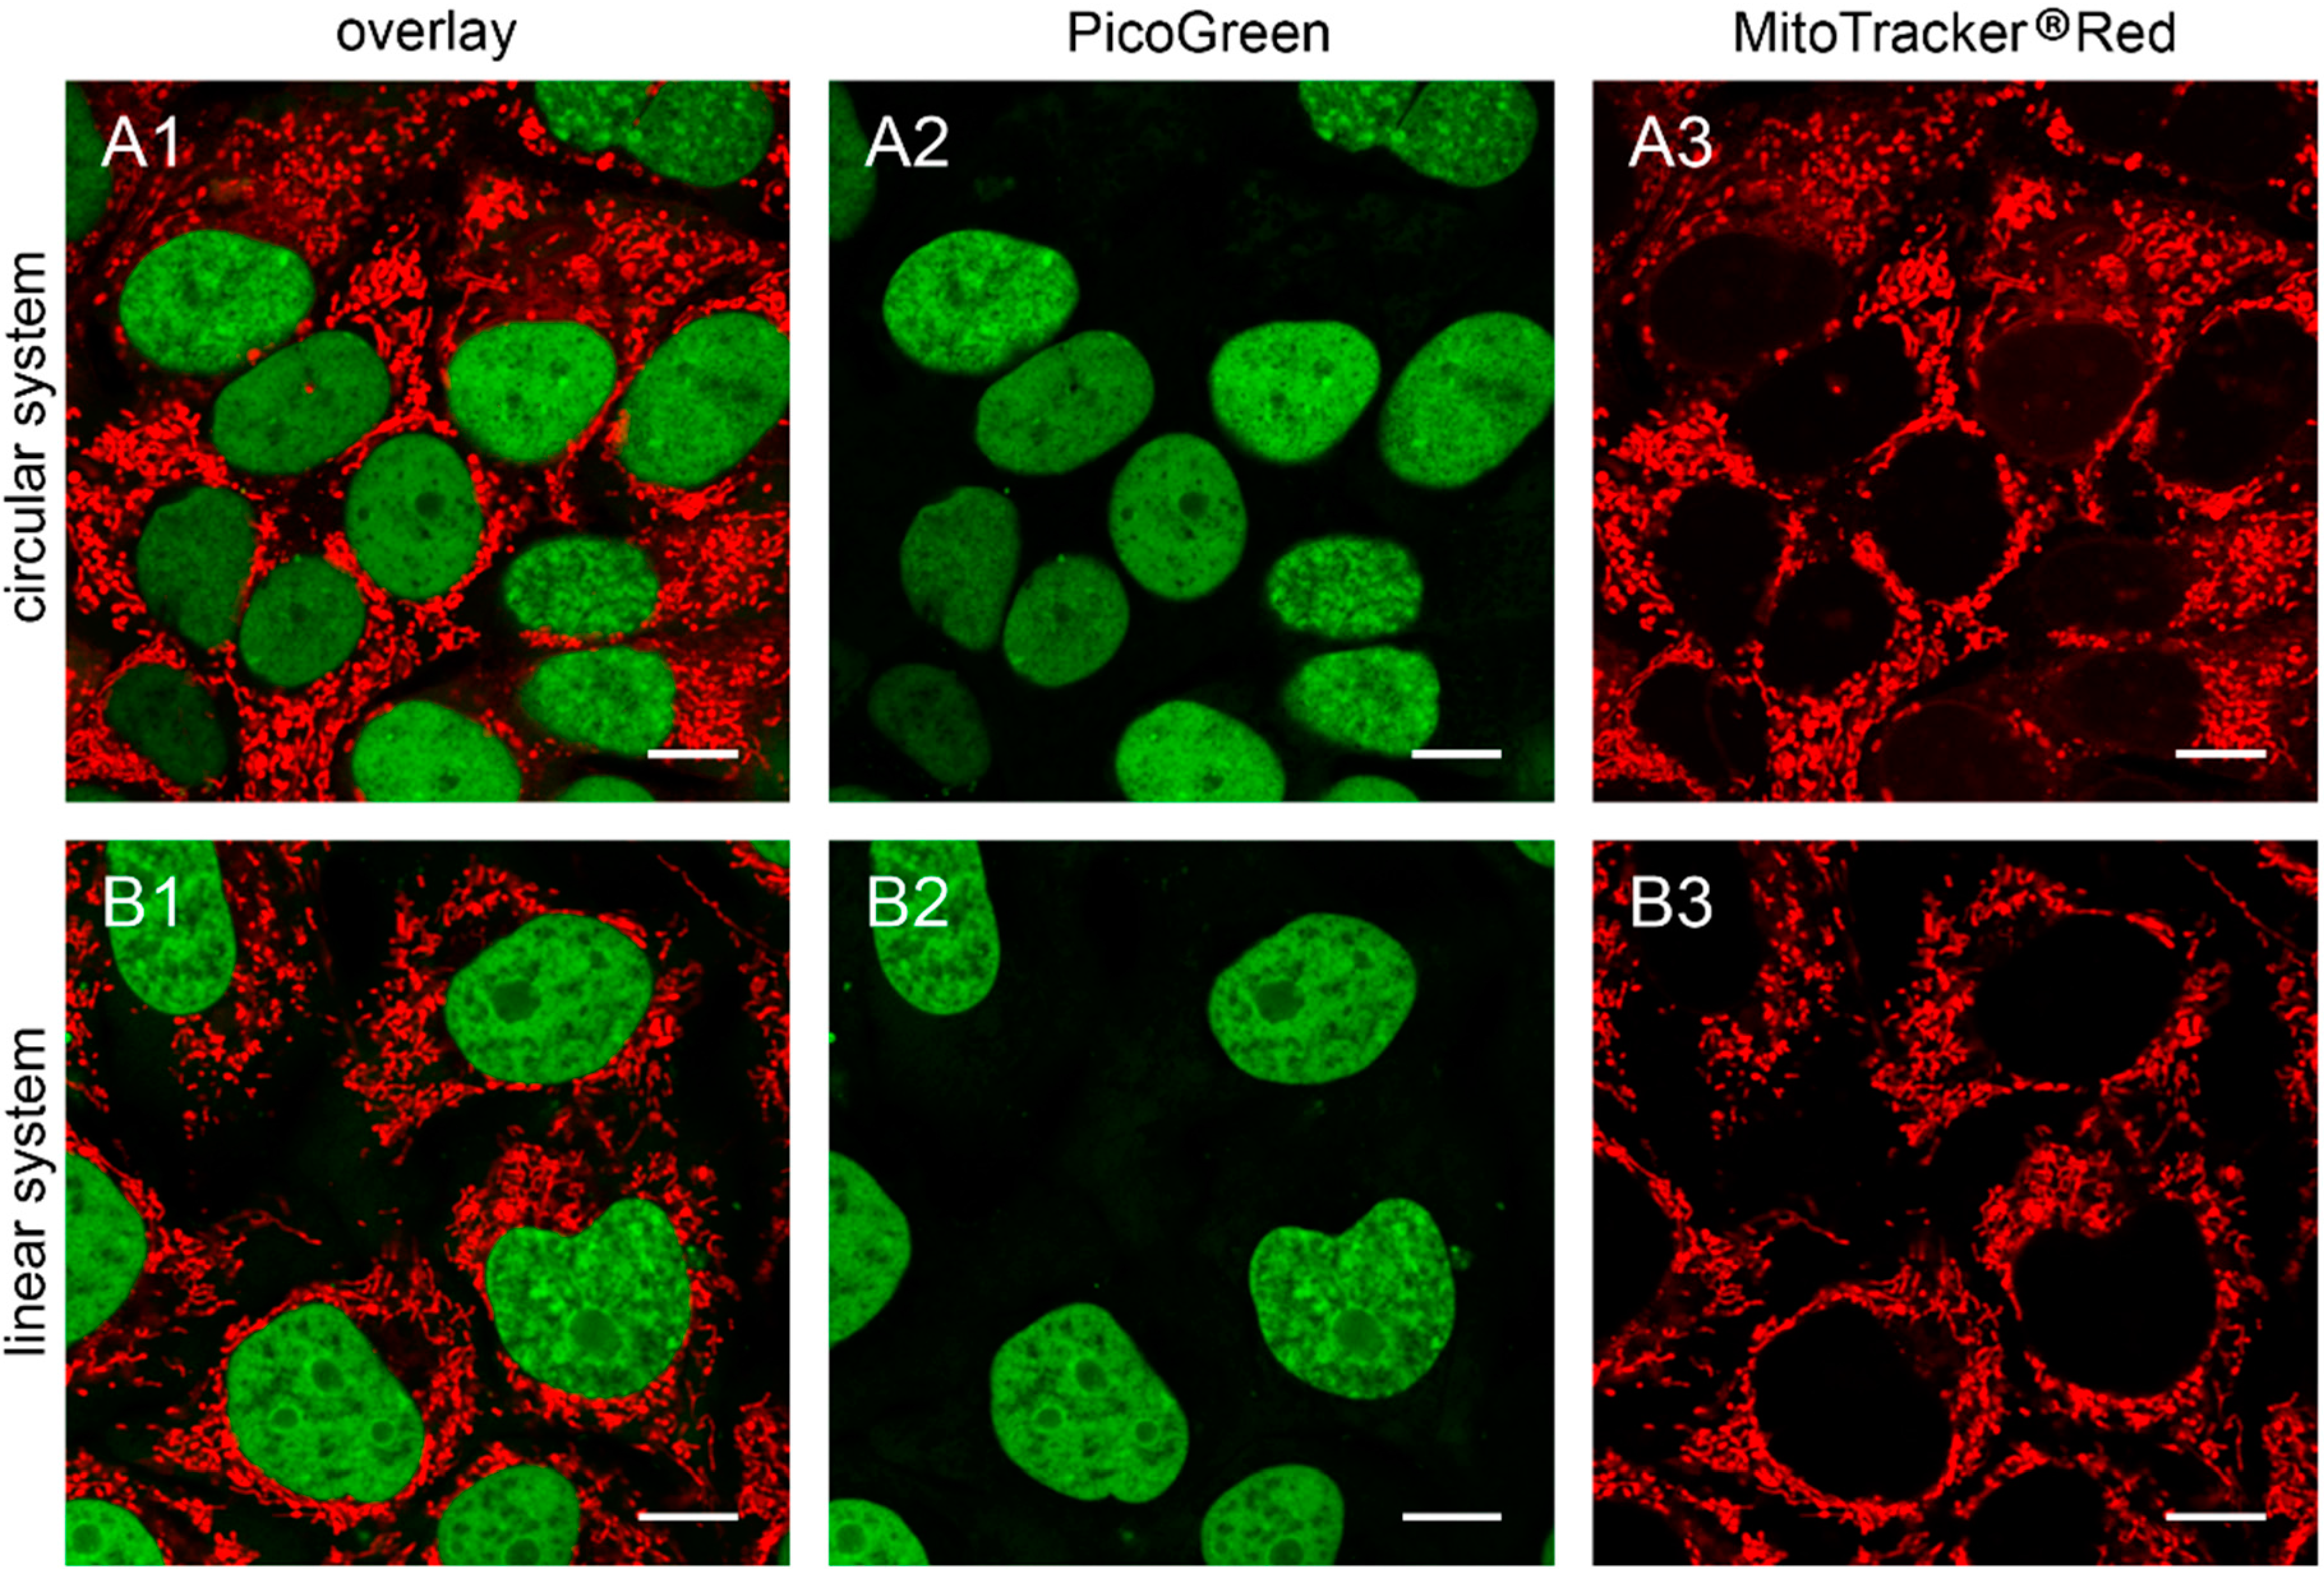
Figure 2.
Detailed images of HEp-2 cells transfected with circular depletion system. Cells were transfected with the circular depletion system (pMEE-con with EGFP, green color, bottom panels A2–C2) and analyzed by confocal laser scanning microscopy at intervals of 24 h post-transfection. The mitochondrial network was stained with MitoTracker® Red CMXRos (red color, overlay top panels A1–C1). The punctate appearance of the fusion protein EGFP-EcoRI merged into an evenly stained mitochondrial network 72 h post-transfection compared to 24 h/48 h, indicating that the interacting partner (mtDNA) of the restriction enzyme disappeared. Calibration marks correspond to 2.5 µm.
At 48 h post-transfection with the linear depletion system (
Figure 1B), the mitochondrial matrix was not evenly stained. The clear-cut punctate staining differed remarkably from the tubular appearance of mitochondria as visualized by MitoTracker
® Red CMXRos staining. The superimposition of both images (
Figure 1B1) underlines this observation, as demonstrated by the yellow sparkle appearance of the restriction enzyme in an otherwise red mitochondrial network. This indicates that the fluorescently tagged restriction enzyme localizes to distinct regions within the tubular network of mitochondria.
The observed punctate structure starts to dissolve in some cells into a tubular staining at 72 h post-transfection (white arrows), while others remain in a distinct localization within the tubular network (see
Figure 1, last row).
The interaction of mitochondrial DNA with endonuclease EcoRI in HEp-2 cells is clearly shown in
Figure 2, where three time points of the nucleoid structures up to the complete disappearance are displayed in detail.
When cells were transfected with the EGFP-labeled destruction system, an even distribution of the fusion enzyme could be seen in the mitochondrial network during the first hours. This is consistent with the assumption that the maturation (folding) of the EcoRI-EGFP fusion protein has to be completed before the enzyme can interact with its substrate (see
Figure 1A). The image of a detailed HEp-2 cell at a higher magnification shows both the even distribution and the punctate structure at 24 h post-transfection (
Figure 2A). At 48 h post-transfection, nucleoids became more visible indicating, that the fusion proteins were mainly associated with their substrates in order to start the cleavage procedure of the genomes (
Figure 2B). At 72 h the green staining started to disperse throughout the mitochondrial network thus overlaying with the MitoTracker
® Red staining (
Figure 2C).
The moment of a punctate structure appearance followed by an even distribution depends on different factors: the maturation of the protein, the binding of EcoRI to the mtDNA and the utilized cell line. In line with our previous finding [
9], mtDNA depletion could usually be detected generally as early as 48 h post-transfection, independently of the used depletion system (circular or linear).
To further challenge the hypothesis that mtDNA is degraded by the EGFP-EcoRI co-localized with the nucleoid structure, transfected cells were stained with the fluorescent dye PicoGreen
® that by intercalating double stranded DNA visualizes nuclear and mitochondrial DNA [
17,
18]. The applied settings for confocal laser scanning microscopy imaging allowed the preferential detection of the nucleoid structure and nuclear staining by PicoGreen
® as the EGFP-EcoRI signal is hidden by the brightness of PicoGreen
® at a similar excitation and emission wave length.
Therefore, 143B.TK
− cells were transfected with the circular depletion system and incubated with MitoTracker
® Red CMXRos and PicoGreen
® dsDNA reagent. As expected, punctate staining indicating mitochondrial nucleoids was visualized in most cells at 24 h post initiation process (see
Figure 3A, first row) with only few individual cells showing exclusively nuclear staining. The number of cells without punctate green structures increased over time, indicating that the nucleoid structures dissolve (
Figure 3A, 48 and 72 h). To highlight these results a control is depicted in
Figure S2, cells without transfection and incubation time (0 h). Similar data were obtained when transfecting 143B.TK
− cells with the linear depletion system (MEE-con-module).
In order to quantify the above observation, more than one hundred 143B.TK
− cells (stained with MitoTracker
® Red CMXRos and PicoGreen
®) were counted for each field and analyzed at every time point (
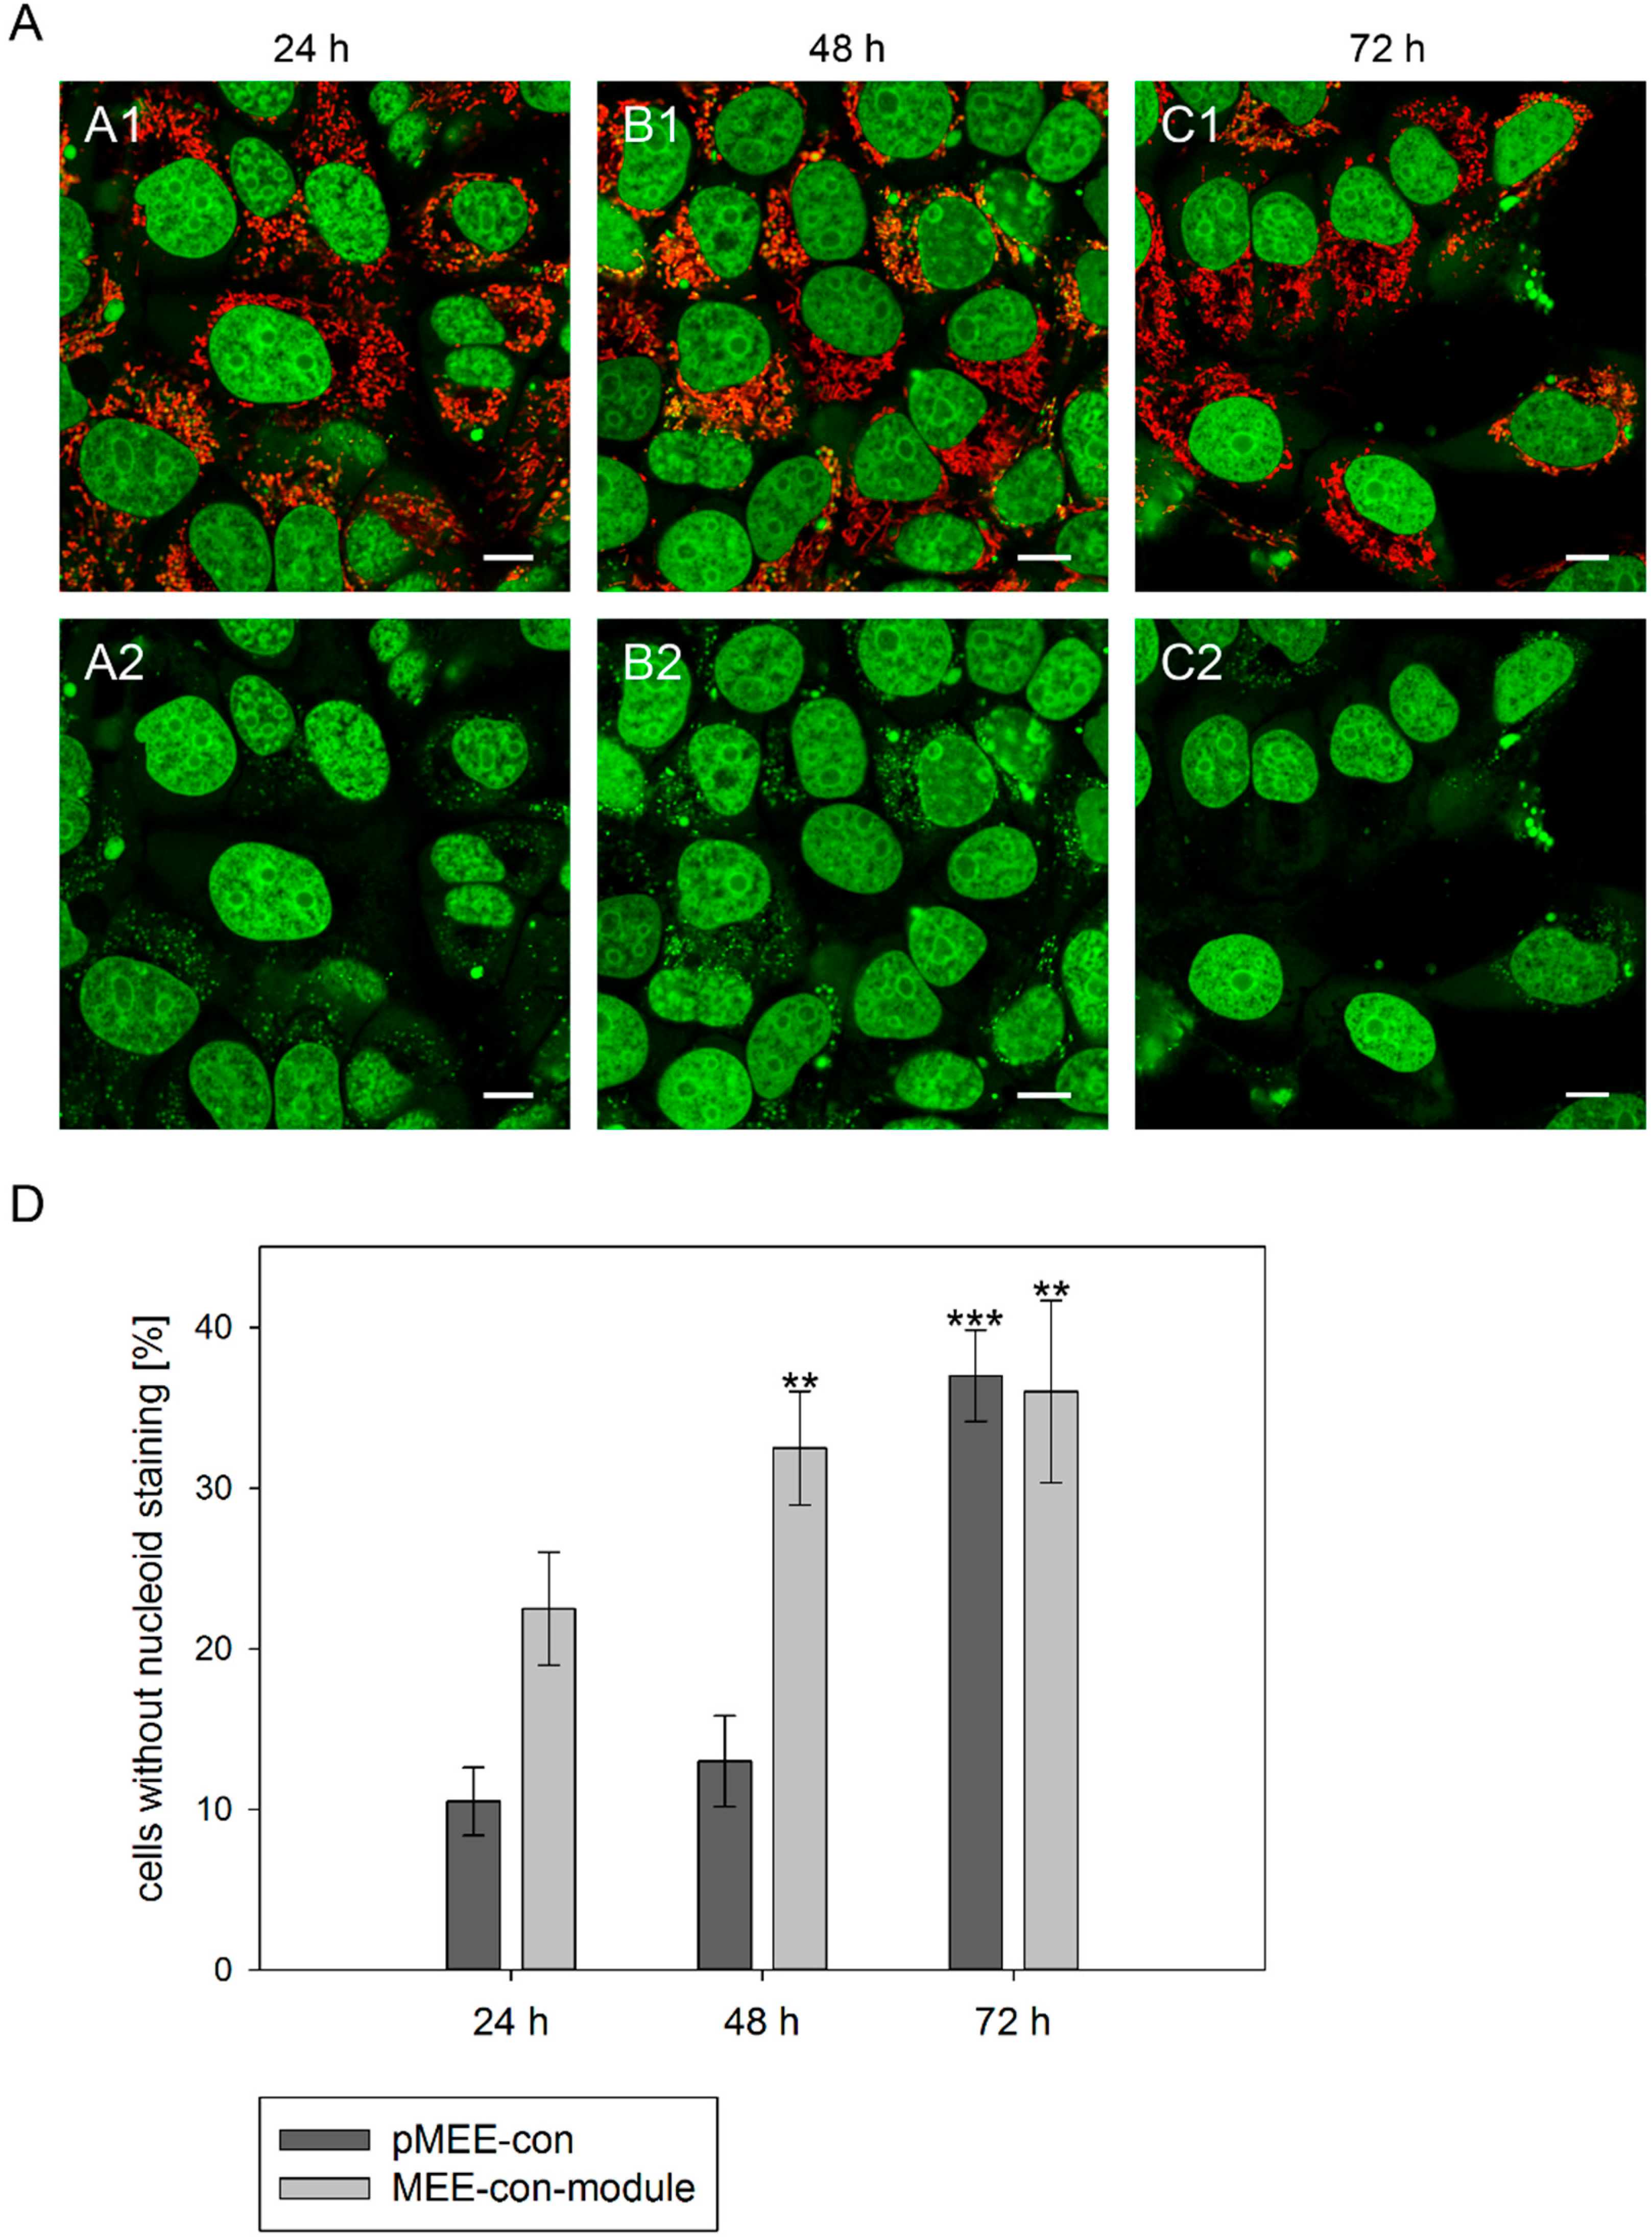
Figure 3D). After the transfection with the depletion systems, approximately 30% of the cells had lost their nucleoid staining after 72 h.
To further confirm our observations, we stained established ρ
0 cell lines with PicoGreen
®. We analyzed 143B.TK
− ρ
0 cells, previously generated by transfection with pMEE-con and cloning [
9], after additional transfection with pMEE-con and MEE-con-module. As expected, the cells displayed only nuclear but no cytoplasmic punctate staining (
Figure 4).
Similar results were obtained in HEp-2 ρ0 EtBr cells (generated by incubation with ethidium bromide) and HEp-2 ρ0 K1 cells (generated by transfection with pMEE-con). Therefore the absence of mitochondrial nucleoids after staining with PicoGreen® is an indicator for ρ0 cells.
Additionally, it is worth noting that the absence of PicoGreen® stained mitochondrial nucleoids in transfected or established ρ0 cells excludes the existence of DNA, either re-ligated or residual mtDNA molecules.
Figure 3.
Analysis of nucleoid staining in 143B.TK− cells. (A) Confocal images. 143B.TK− cells transfected with pMEE-con were analyzed by microscopy. The nucleus and nucleoids are stained green (PicoGreen®; panels A2–C2). The mitochondrial network was stained with MitoTracker® Red CMXRos and co-localizes with green-stained nucleoids (panels A1–C1, overlay). A few cells do not show nucleoid staining (indicating ρ0 status). Calibration marks correspond to 10 µm; (D) Quantification of images. More than one hundred 143B.TK− cells were counted and analyzed. The diagram shows the percentage of cells without nucleoid staining after transfection with various depletion systems. Bars describe the arithmetic mean ± SD. ** p < 0.01, *** p < 0.001.
Figure 4.
The 143B.TK− ρ0 K7 cells transfected with depletion systems. The 143B.TK− ρ0 K7 cells were transfected with pMEE-con (A) and MEE-con-module (B) and analyzed 24 h post-transfection by confocal laser scanning microscopy. Cells were incubated with PicoGreen® (green color, panel A2,B2) to stain DNA. The mitochondrial network was stained with MitoTracker® Red CMXRos (red color, panel A3,B3). Overlay of both fluorescent stainings are depicted in panel A1 and B1. Calibration marks correspond to 10 µm.
2.2. Quantitative Analysis of Mitochondrial DNA
To challenge the hypothesis that mtDNA is fully depleted by endogenous nucleases after transfection with our kit, a quantitative analysis of mtDNA in a transfected cell population was performed by real-time PCR. As shown in
Figure 5, the relative amount of mtDNA (
ND1 or
ND5 genes)
vs. nuclear DNA (18S ribosomal gene) was measured using different primer pairs both in 143B.TK
− and HEp-2 cells. The amplification of nuclear mitochondrial DNA fragments was largely excluded (see
Supplementary Materials Section 2,
Figure S3) [
21,
22,
23,
24,
25,
26].
Firstly, to rule out any negative effect of the transfection procedure and/or of the recombinant protein expression on mitochondrial DNA content, cells were transfected with a construct for the expression of mitochondrially targeted EGFP without nucleolytic activity (pEGFP-Mito). Transfected cells did not show any significant variation of mtDNA content (
Figure 5A,C, gray bars), thus excluding any unspecific effect by the experimental procedures on mtDNA content. The transfection efficiency 48 h post-transfection was approximately 45% for 143B.TK
− cells and 60% for HEp-2 cells, respectively.
Next, cells were transfected with the depletion systems and the DNA was quantified utilizing real-time PCR to prove that mtDNA is degraded after transfection.
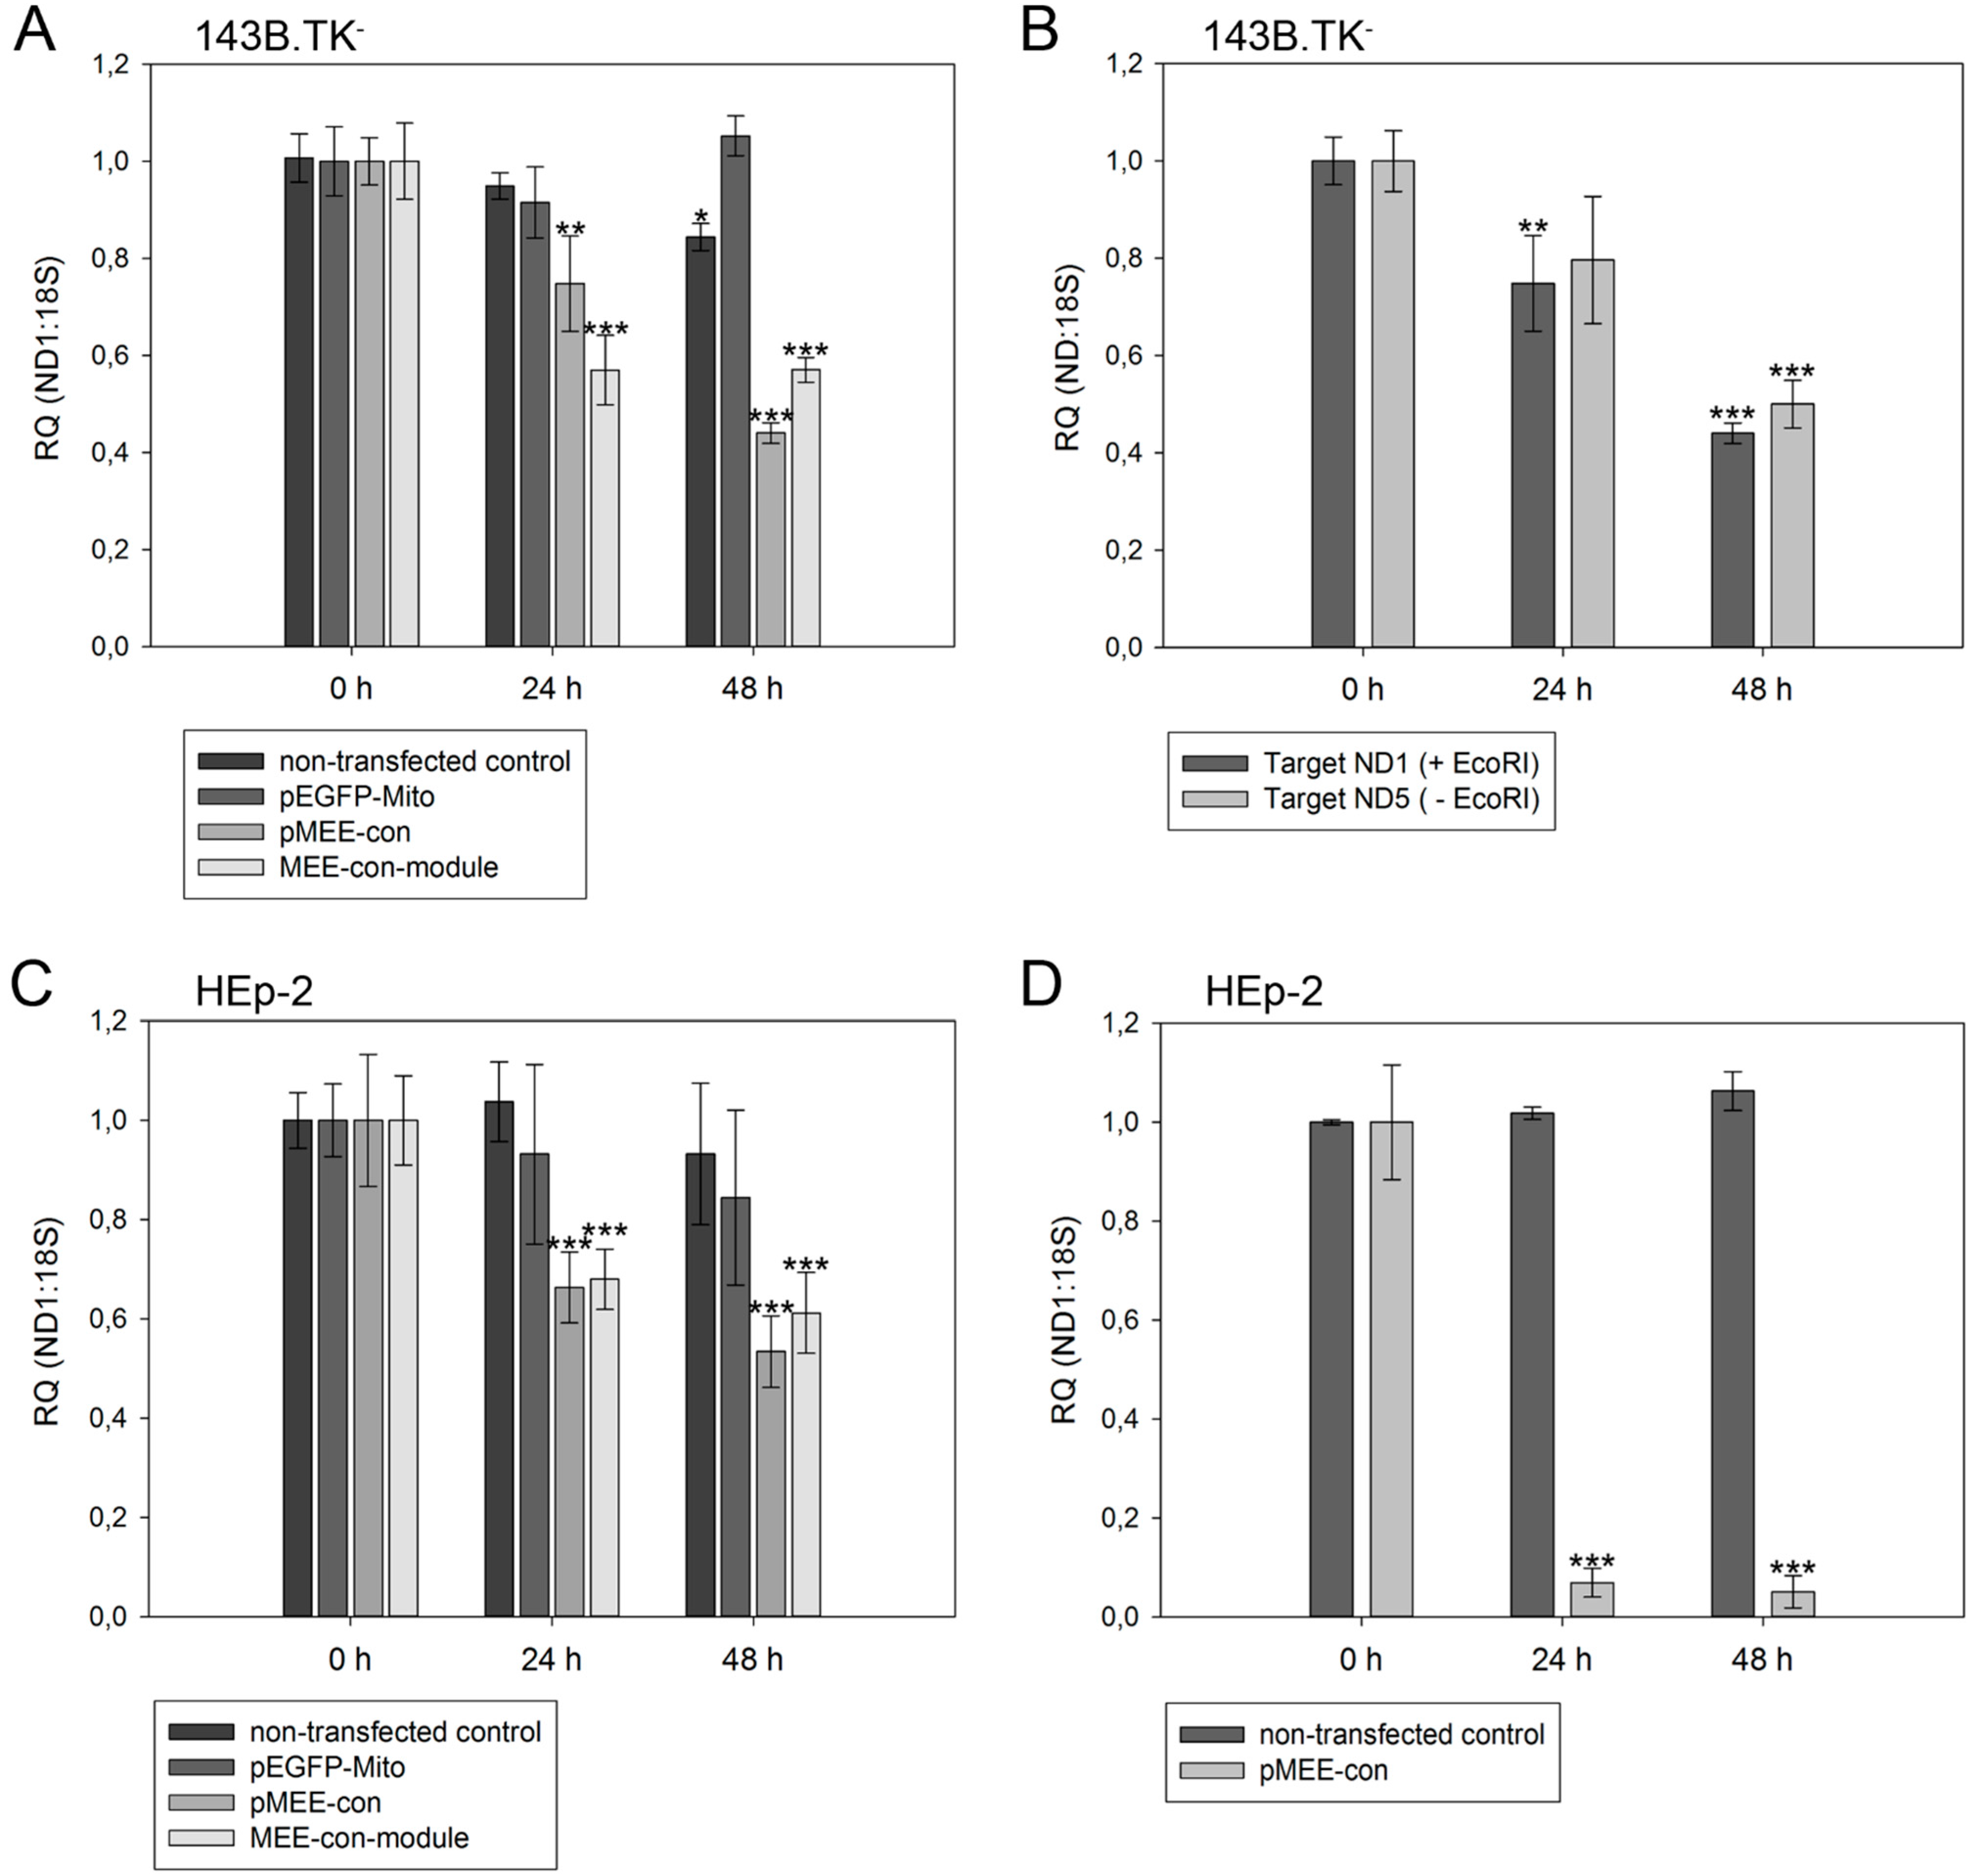
Figure 5.
Relative quantification of mtDNA in transfected cells. Cells were harvested directly before (0 h) or 24 h/48 h post-transfection with pEGFP-Mito (transfection control), circular depletion system (pMEE-con) or linear depletion system (MEE-con-module). Furthermore, non-transfected cells were used as control. Experiments were performed in triplicate. Data are expressed as ratio between mitochondrial DNA (ND1 or ND5 gene) vs. nuclear (ribosomal 18S gene) DNA content. Bars represent the mean ± SD. * p < 0.05, ** p < 0.01, *** p < 0.001. (A) 143B.TK− cells; (B) 143B.TK− cells transfected with depletion system (pMEE-con). Relative mtDNA content of DNA isolates was analyzed using ND1 (04094–04175 bp) and ND5 (13,893–13,983 bp) gene as targets in real-time PCR. Amplified target sequences differ in encompassing a recognition site for the restriction endonuclease EcoRI; (C) HEp-2 cells; (D) HEp-2 transfected cells. EGFP expressing cells were separated from non-transfected cells by fluorescence-activated cell sorting.
![Ijms 16 09850 g005]()
As expected, a significant reduction of relative mtDNA content in 143B.TK
− cells was observed 24 h post-transfection with the depletion kit: the total mtDNA amount was reduced by 25% (pMEE-con) and 40% (MEE-con-module) (see
Figure 5A). At 48 h post-transfection with the circular depletion kit, the observed 55% reduction of mtDNA was in line with the 45% transfection efficiency, thus suggesting that total loss of mtDNA occurred in transfected cells. Interestingly, the data also show that the mtDNA depletion is less effective when using the linearized pMEE-con transfection (
Figure 5A, light gray bars). Again, the mtDNA decrease (30%) was consistent with the transfection efficiency (30%) thus pointing to a lower uptake of linearized DNA during transfection [
27]. Furthermore, the presence of a similar mtDNA content 24 and 48 h post-transfection with the linear depletion system could be explained by the lack of origin of replication and the consequent dilution of the construct during cell division. These findings were confirmed by the results obtained with the HEp-2 cell line (
Figure 5C, light gray bars).
To exclude the contribution of non-transfected cells in the quantitative analysis, a fluorescence-activated cell sorting was used to separate the two populations of cells based on the expression of the EGFP fusion protein. HEp-2 cells transfected with the circular depletion system were sorted by flow cytometry and mtDNA content was measured by quantitative real-time PCR (
Figure 5D). In comparison to non-transfected parental cells the mtDNA content in sorted cells was drastically decreased to 7% and 5% at 24 and 48 h post-transfection showing that the circular depletion vector could reach its maximum efficiency already at 24 h post-transfection.
Specific destruction of mtDNA mutated molecules associated with mitochondrial diseases has been proposed to be a potential therapy for mitochondrial diseases caused by mutations that create a unique restriction endonuclease cleavage site in the mtDNA [
28,
29]. In contrast to these studies we offer with other methods a more rapid destruction of total mtDNA with the restriction endonuclease EcoRI to generate ρ
0 cells, as EcoRI creates three to five destruction start sites, depending on the mtDNA background. However, it is well understood that a repopulation with intact mitochondrial genomes is an essentially required second step when thinking of a genetic therapy (patent pending, [
30]).
With our depletion strategy, after cleavage of mtDNA, endogenous nucleolytic enzymes start to degrade DNA at the generated 5'- and 3'-endings. To distinguish the cleaving and degrading process of mtDNA in 143B.TK
− cells after expression of mitochondrially targeted EGFP-EcoRI, mtDNA depletion was assessed using two different primer sets. The first set hybridized to the mitochondrial
ND1 gene thereby encompassing an EcoRI restriction site. Hence, only un-cleaved mtDNA molecules would be amplified (
Figure 5B, dark gray bars). A second primer set, hybridizing to the mitochondrial
ND5 gene that does not contain an EcoRI recognition site was taken. This set can amplify mtDNA that is cleaved but not completely degraded by endogenous enzymes (
Figure 5B, light gray bars). The data show that both mtDNA species can be amplified to a similar extent in a transfected cell population over a period of 48 h, thus suggesting that degradation of mtDNA by endogenous nucleases occurs soon after cleavage.

